Embed Size (px)
Citation preview

Understanding the Effects Understanding the Effects of Anti-Profiling Policiesof Anti-Profiling Policies
Paul HeatonPaul HeatonRANDRAND
Criminology and Population Dynamics Criminology and Population Dynamics WorkshopWorkshopJune 2007June 2007

MotivationMotivation
Nationwide movement to enact policies to Nationwide movement to enact policies to prevent racial profiling by policeprevent racial profiling by police 26 states with legislation requiring data 26 states with legislation requiring data
collectioncollection Jurisdictions in 21 other states with voluntary Jurisdictions in 21 other states with voluntary
data collectiondata collection Several states, including California and Florida, Several states, including California and Florida,
with mandatory training programswith mandatory training programs Use a racial profiling scandal in New Jersey Use a racial profiling scandal in New Jersey
in 1998-1999 to estimate the effect of in 1998-1999 to estimate the effect of changes in profiling policy on arrests, changes in profiling policy on arrests, offenses, and other behavioroffenses, and other behavior

FindingsFindings
The scandal and policy reforms led to The scandal and policy reforms led to substantial (20-40%) reductions in substantial (20-40%) reductions in arrests of Blacks relative to Whites for arrests of Blacks relative to Whites for motor vehicle theft.motor vehicle theft.
Changes in the number and distribution Changes in the number and distribution of offenses suggest an increase in of offenses suggest an increase in vehicle thefts in response to the vehicle thefts in response to the changing arrest patterns.changing arrest patterns.
Findings robust to numerous specification Findings robust to numerous specification checks; similar results are observable in checks; similar results are observable in Maryland.Maryland.

Why Might Profiling Policy Affect Why Might Profiling Policy Affect Arrests and Offending?Arrests and Offending?
“ “Troopers are going to be more cautious and Troopers are going to be more cautious and are probably much more selective…When it are probably much more selective…When it comes time to go further, I'm sure there has comes time to go further, I'm sure there has to be a conscious decision at some point. to be a conscious decision at some point. Unless it's something very obvious or Unless it's something very obvious or blatant, [officers] may not go any further.”blatant, [officers] may not go any further.”
Ed Lennon, President of the State Troopers Ed Lennon, President of the State Troopers Fraternal Association of New Jersey, in a Fraternal Association of New Jersey, in a 1999 interview regarding the profiling 1999 interview regarding the profiling controversycontroversy

Data SourcesData Sources
Agency-level UCR data on arrests Agency-level UCR data on arrests and offenses, 1990-2003and offenses, 1990-2003 Focus on vehicle theft, closely Focus on vehicle theft, closely
linked to police stop behavior and linked to police stop behavior and well-reported with separate arrest well-reported with separate arrest and offense dataand offense data
Place-level Census dataPlace-level Census data
.00
00
7.0
00
1.0
00
15
.00
02
Wh
ite a
rre
st r
ate
.00
04
.00
06
.00
08
.00
1.0
01
2B
lack
arr
est
ra
te
1994 1996 1998 2000 2002 2004Year
Black White
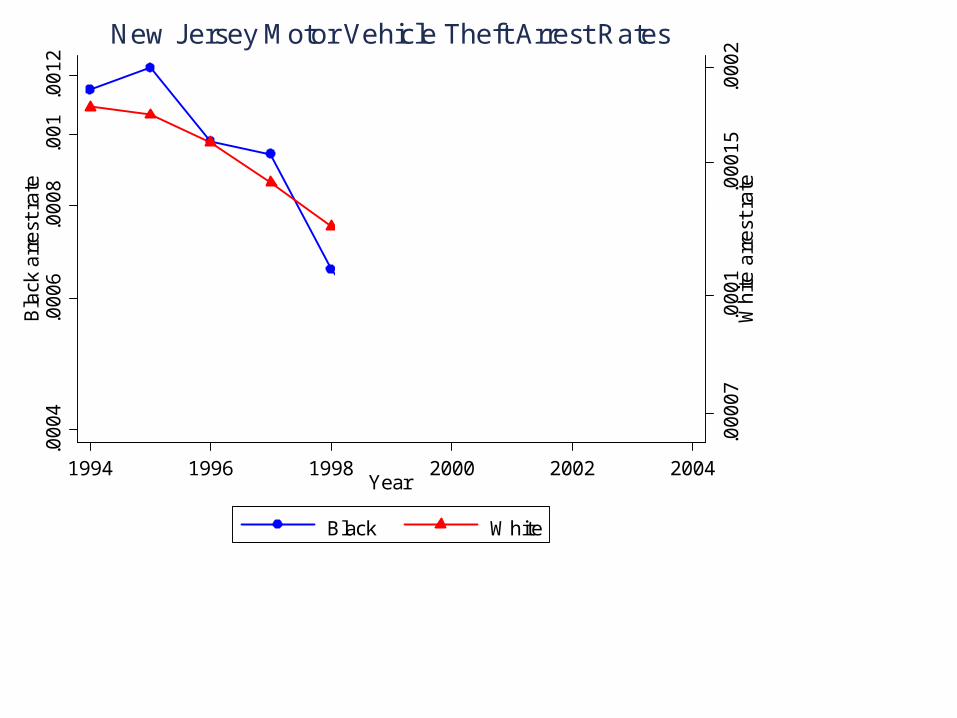
New Jersey Motor Vehicle Theft Arrest Rates
.00
00
7.0
00
1.0
00
15
.00
02
Wh
ite a
rre
st r
ate
.00
04
.00
06
.00
08
.00
1.0
01
2B
lack
arr
est
ra
te
1994 1996 1998 2000 2002 2004Year
Black White
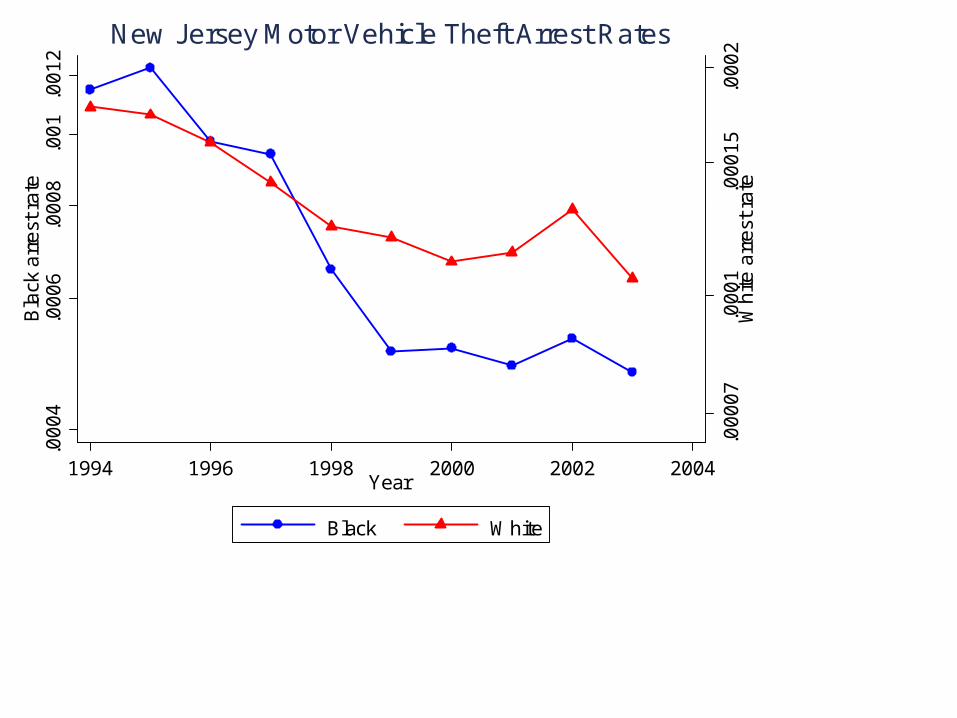
New Jersey Motor Vehicle Theft Arrest Rates

.00
00
7.0
00
1.0
00
15
.00
02
Wh
ite a
rre
st r
ate
.00
04
.00
06
.00
08
.00
1.0
01
2B
lack
arr
est
ra
te
1994 1996 1998 2000 2002 2004Year
Black White
New Jersey Motor Vehicle Theft Arrest Rates
Black pre-reform mean arrest rate: .0010
White pre-reform mean arrest rate: .00015
Pre-Reform DifferenceBlack - White0.0010 - 0.0001
0.00084

.00
00
7.0
00
1.0
00
15
.00
02
Wh
ite a
rre
st r
ate
.00
04
.00
06
.00
08
.00
1.0
01
2B
lack
arr
est
ra
te
1994 1996 1998 2000 2002 2004Year
Black White
New Jersey Motor Vehicle Theft Arrest Rates
White post-reform mean arrest rate: .0001
Post-Reform DifferenceBlack - White0.0005 - 0.0001
0.00038
Black post-reform mean arrest rate: .0005

.00
00
7.0
00
1.0
00
15
.00
02
Wh
ite a
rre
st r
ate
.00
04
.00
06
.00
08
.00
1.0
01
2B
lack
arr
est
ra
te
1994 1996 1998 2000 2002 2004Year
Black White
New Jersey Motor Vehicle Theft Arrest Rates
Post-Reform Difference Pre-Reform Difference DifferenceBlack - White Black - White In0.0005 - 0.0001 0.0010 - 0.0001 Difference
0.00038 0.00084 -0.00045 ≈ - 45%

Estimated Effects of the Scandal on ArrestsEstimated Effects of the Scandal on Arrests
Estimated % Estimated % ChangeChange
in Arrests For:in Arrests For:
Estimation ApproachEstimation Approach
DDDD DDDDDD DDDDDDDD
Motor Vehicle TheftMotor Vehicle Theft -.371***-.371*** -.195**-.195** -.264**-.264**
(.054)(.054) (.093)(.093) (.115)(.115)
No. Obs.No. Obs. 2020 4040 8080
First Difference:First Difference: Post-PrePost-Pre Post-PrePost-Pre Post-PrePost-Pre
Second Difference:Second Difference:Black-Black-
WhiteWhite Black-WhiteBlack-White Black-WhiteBlack-White
Third Difference:Third Difference:Affected Affected
Crime-Crime-Other CrimeOther Crime
Affected Affected Crime-Crime-
Other CrimeOther Crime
Fourth Difference:Fourth Difference: NJ-USNJ-US

Did the Policy Change Affect Did the Policy Change Affect Offending?Offending?
Obstacle: No direct data on the race Obstacle: No direct data on the race of offenders independent of arrest of offenders independent of arrest data.data.
Evidence from both the time series Evidence from both the time series and the geographic distribution of and the geographic distribution of offenses suggest increased offenses suggest increased offending at the time the new offending at the time the new policies were enactedpolicies were enacted

Trends in Vehicle Theft, 1994-200320
0030
0040
0050
00#
of v
ehic
le th
efts
01/94 01/96 01/98 01/00 01/02 01/04Month

Trends in Vehicle Theft, 1994-200320
0030
0040
0050
00#
of v
ehic
le th
efts
01/94 01/96 01/98 01/00 01/02 01/04Month

Trends in Burglaries and Larcenies, 1994-200310
000
1500
020
000
2500
030
000
# of
bur
glar
ies
and
larc
enie
s
01/94 01/96 01/98 01/00 01/02 01/04Month

Trends in Burglaries and Larcenies, 1994-200310
000
1500
020
000
2500
030
000
# of
bur
glar
ies
and
larc
enie
s
01/94 01/96 01/98 01/00 01/02 01/04Month

Estimated Proportion of Black Offenders,Burglary and Larceny
0.31
0.32
0.33
0.34
0.35
1993 1995 1997 1999 2001 2003
Est
ima
ted
Bla
ck %
of A
ll O
ffen
de
rs
Burglary Larceny

Estimated Proportion of Black Offenders,Vehicle Theft
0.42
0.43
0.44
0.45
0.46
0.47
0.48
1993 1995 1997 1999 2001 2003
Est
ima
ted
Bla
ck %
of A
ll O
ffen
de
rs
Vehicle Theft

Estimated Proportion of Black Offenders,Vehicle Theft
0.42
0.43
0.44
0.45
0.46
0.47
0.48
1993 1995 1997 1999 2001 2003
Est
ima
ted
Bla
ck %
of A
ll O
ffen
de
rs
Vehicle Theft

Interpretation of Offending ChangesInterpretation of Offending Changes
Locality at 75Locality at 75thth percentile of Black percentile of Black population distribution would have population distribution would have 17% more vehicle theft than one at 17% more vehicle theft than one at 2525thth percentile percentile
Policy would result in approximately Policy would result in approximately 3000 additional vehicle thefts 3000 additional vehicle thefts annually in NJannually in NJ
Does not suggest minorities have Does not suggest minorities have dramatically different responsiveness dramatically different responsiveness to enforcementto enforcement

Robustness ChecksRobustness Checks
Similar results changing sample, time Similar results changing sample, time period, comparison groupsperiod, comparison groups
Placebo tests—policy effects not Placebo tests—policy effects not observed for unaffected crimes, observed for unaffected crimes, groups, or locationsgroups, or locations
Replication using Maryland’s 1995 Replication using Maryland’s 1995 reformsreforms

ConclusionsConclusions
Contributions of paperContributions of paper
1. Adds to profiling literature by estimating 1. Adds to profiling literature by estimating policypolicy effects effects
2. Patterns in arrest/offending data are 2. Patterns in arrest/offending data are difficult to reconcile with causal explanations difficult to reconcile with causal explanations other than changes in profiling behavior by other than changes in profiling behavior by policepolice
3. Provides minority-specific measure of 3. Provides minority-specific measure of responsiveness to enforcement, an important responsiveness to enforcement, an important quantity in evaluating profiling policiesquantity in evaluating profiling policies