Embed Size (px)
Citation preview
Understanding the effect of soluble fibres on the hydrolysis of starch
and the diffusion of glucose during simulated human digestion
by
Hrvoje Fabek
A Thesis
Presented to
The University of Guelph
In partial fulfilment of requirements
for the degree of
Doctor of Philosophy
in
Food Science
Guelph, Ontario, Canada
© Hrvoje Fabek, April, 2015
ABSTRACT
UNDERSTANDING THE EFFECT OF SOLUBLE FIBRES ON THE
HYDROLYSIS OF STARCH AND THE DIFFUSION OF GLUCOSE DURING
SIMULATED HUMAN DIGESTION
Hrvoje Fabek Advisor:
University of Guelph, 2015 Professor H.D. Goff
Dietary fibre consumption is associated with a wide range of health benefits
including reductions in postprandial glycemia. It is widely accepted among
researchers that the effect is due to an increase in viscosity that fibres exert along the
gastrointestinal tract; however, the mechanism remains to be elucidated. In this study,
protein-starch solutions were fortified with four types of soluble fibre – xanthan gum
(XG), guar gum (GG), soluble flaxseed gum (SFG) and soy soluble polysaccharide
(SSPS). Subsequently, all solutions were passed through a three-stage in vitro
digestion model. Rheological investigations showed that all solutions behaved as
pseudoplastic shear-thinning materials and exhibited solid-like behaviour.
Quantitative analyses of reducing sugar release (RSR) demonstrated an inverse trend
between RSR and digesta viscosity. Glucose release measurements revealed that even
low viscosity systems were effective at lowering the hydrolysis of starch. Analysis of
glucose diffusion using a dialysis system indicated a lesser effect and only the fibres
with a measurable G’ and higher viscous component inside the simulated small
intestinal stage were able to attenuate glucose diffusion. Native (uncooked) tapioca
starch granules were separated, purified and dried at different times of digestion and
analyzed for changes in particle size using light scattering and starch morphology
using scanning electron microscopy (SEM) and light microscopy. Most granules were
in the range of 5-50µm, with an apparent reduction in particle size as hydrolysis
continued. SEM images of starch granules revealed smooth surfaces in solution and
substantial degradation (exo- and endo-corrosion, with some granules becoming
completely hydrolysed) as the treatments progressed through the in vitro digestion.
The progression of morphological changes was attenuated in granules extracted from
the digesta of XG and GG. Light scattering and microscopy also revealed an
aggregation effect between granules extracted from the XG and GG treatments. The
results of the study indicated that the mechanism by which soluble fibres are able to
moderate the in vitro glycemic response may be multi-faceted. Moreover, they may
not be due to viscosity alone as other effects may be important, including the ability of
fibres to create and maintain gel networks inside the lumen and allow starch granule
aggregation.
iv
Acknowledgements
I would like to express my appreciation to my advisor Dr. Douglas Goff,
without whom this project would not have been possible. The experience, knowledge,
and skills that I have gained through the completion of this project are invaluable.
Thank you for the guidance and incessant support you have offered throughout my
graduate degrees.
Special thanks to my two advisory committee members, Dr. Alison Duncan
and Dr. Amanda Wright. Your knowledge and contribution to this project are greatly
appreciated. Thank you for offering me your time, feedback and expertise throughout
this project.
Thank you to Dr. Sandy Smith who helped me with all the microscopy
analyses and providing training on the SEM, CLSM and light mic.
Thanks to all my labmates and friends who have helped make the time spent
on this project enjoyable and a special thanks to Dr. Fernanda Peyronel for her efforts
in maintaining the laboratory where I conducted most of my research. Also, thank you
to Ms. Tricia Anderson, Ms. Anne Ingram and Ms. Leona Varga-Lowes for their help
on the administrative side of the project.
Finally, I would like to thank and dedicate this thesis to my family who have
been supportive of me every step of the way. To my beautiful wife Danielle and our
two beautiful children - our son Luka and daughter Arwyn (born 4 days before my
defence) – thank you for making every day the happiest day of my life, I love you
guys so much!! Thank you to my parents for the never-ending support offered to me
throughout my life - hvala na svemu!

v
Table of Contents
1. Introduction ........................................................................................................................ 1
1.1. Importance of dietary fibre and research focus .......................................................... 1
1.2. Overall Objectives ..................................................................................................... 5
2. Literature Review ............................................................................................................... 7
2.1. Digestion of foods ...................................................................................................... 7
2.1.1. Gastrointestinal physiology...................................................................................... 7
2.1.2. Carbohydrate metabolism ...................................................................................... 12
2.1.3. Glucose absorption ................................................................................................. 14
2.1.4. Review of in vitro digestion ................................................................................... 16
2.1.5. In vitro digestion methods related to starch digestion ........................................... 23
2.2. Dietary Fibre ............................................................................................................ 29
2.2.1. Dietary fibre definition .......................................................................................... 29
2.2.2. Health benefits of dietary fibre .............................................................................. 31
2.3. Soluble fibres employed in the study ....................................................................... 42
2.3.1. Guar Gum............................................................................................................... 42
2.3.2. Xanthan Gum ......................................................................................................... 46
2.3.3. Flaxseed Gum ........................................................................................................ 50
2.3.4. Soy soluble polysaccharide .................................................................................... 52
2.3.5. Summary Comment ............................................................................................... 55
3. The effect of in vitro digestive processes on the viscosity of dietary fibres and their
influence on glucose diffusion ................................................................................................. 56
3.1. Introduction .............................................................................................................. 57
3.2. Materials and methods ............................................................................................. 60
3.2.1. Materials ................................................................................................................ 60
3.2.2. Soluble flaxseed gum extraction ............................................................................ 61
3.2.3. Food matrix preparation ........................................................................................ 61
3.2.4. Viscosity measurements ......................................................................................... 62
3.2.5. In vitro digestion .................................................................................................... 63
3.2.6. Glucose release measurements .............................................................................. 63
3.2.7. Statistical Analysis ................................................................................................. 64
3.3. Results and discussion ............................................................................................. 64
3.3.1. Effect of in vitro digestion on solution viscosity .................................................... 64
vi
3.3.2. Glucose diffusion during in vitro digestion ............................................................ 71
3.4. Conclusion ............................................................................................................... 75
4. Effect of soluble fibre inclusion on starch hydrolysis and glucose mobility during
simulated small intestinal digestion ......................................................................................... 77
4.1. Introduction .............................................................................................................. 78
4.2. Materials and methods ............................................................................................. 81
4.2.1. Materials ................................................................................................................ 81
4.2.2. Food matrix preparation ........................................................................................ 82
4.2.3. Dynamic viscoelasticity and viscosity measurements ............................................ 83
4.2.4. In vitro digestion .................................................................................................... 83
4.2.5. Reducing sugar determination ............................................................................... 85
4.2.6. Glucose release determination inside simulated digesta ....................................... 85
4.2.7. Glucose diffusion inside a dialysis system ............................................................. 86
4.2.8. Statistical Analysis ................................................................................................. 86
4.3. Results and discussion ............................................................................................. 87
4.3.1. Study treatment rheology during in vitro digestion ............................................... 87
4.3.2. Reducing sugar release during simulated small intestinal digestion ...................... 99
4.3.3. Effects of viscous fibres on glucose release during simulated small intestinal
digestion ......................................................................................................................... 102
4.4. Conclusion ............................................................................................................. 108
5. Simulated intestinal hydrolysis of native tapioca starch: understanding the effect of
soluble fibre ........................................................................................................................... 110
Hrvoje Fabeka and H. Douglas Goff
a, .................................................................................... 110
5.1. Introduction ............................................................................................................ 111
5.2. Materials and methods ........................................................................................... 115
5.2.1. Materials .............................................................................................................. 115
5.2.2. Sample preparation .............................................................................................. 116
5.2.3. In vitro digestion .................................................................................................. 116
5.2.4. Viscosity measurements ....................................................................................... 117
5.2.5. Isolation and purification of starch granules for morphological study ............... 117
5.2.6. Particle Size Analysis ........................................................................................... 118
5.2.7. Scanning electron microscopy (SEM) .................................................................. 119
5.2.8. Light microscopy .................................................................................................. 119
5.2.9. Statistical analysis ............................................................................................... 119
vii
5.3. Results and discussion ........................................................................................... 120
5.3.1. Flow behaviour .................................................................................................... 120
5.3.2. Particle size distribution of hydrolysed starch granules ....................................... 122
5.3.3. Starch Morphology .............................................................................................. 130
5.3.3.1. Scanning electron microscopy (SEM) ............................................................... 130
5.3.3.2. Light microscopy of digested starch granules .................................................. 141
5.4. Conclusion ............................................................................................................. 146
6. Study strengths and limitations ...................................................................................... 148
7. Conclusion and future directions ................................................................................... 150
References .............................................................................................................................. 155
viii
List of Tables
Table 3-1. Study treatment formulation (% w/w) for control solution (CS), xanthan
gum (XG)-, guar gum (GG)-, soluble flaxseed gum (SFG)-, and soluble soy
polysaccharide (SSPS)-fortified solutions.. .............................................................. 62
Table 3-2. Consistency index (K) and flow behaviour index (n) from the Power Law model of
guar gum-, xanthan gum-, flaxseed gum-, and soluble soy polysaccharide (SSPS)-
fortified solutions before and after in vitro digestion. .................................................... 70
Table 3-3. Apparent viscosity (Pa.s) at 50s-1 of guar gum-, xanthan gum-, flaxseed gum-, and
soluble soy polysaccharide (SSPS)-containing solutions after 4 h in vitro digestion. .... 72
Table 3-4. Normalized Sugar Diffusion (NSD) of solutions mixed with fibre compared with
the control ....................................................................................................................... 73
Table 4-1. Study treatment formulation (% w/w) for control solution (CS), xanthan gum
(XG)-, guar gum (GG)-, flaxseed gum (FG)-, and soluble soy polysaccharide
(SSPS)-fortified solutions ............................................................................................... 83
Table 4-2. Chemical composition of simulated salivary fluid1 ........................................................ 84
Table 4-3. Mean values for viscoelastic measurements storage (G') and loss (G") moduli and
tan δ measured at 1 Hz of xanthan gum-, guar gum-, flaxseed gum, and soluble soy
polysaccharide-fortified solutions ................................................................................... 93
Table 4-4. Consistency index (K, Pa.s) values of the Power Law model for control, xanthan
gum-, guar gum-, soy soluble polysaccharide (SSPS)-, and flaxseed gum-fortified
treatments in solution, following simulated salivary (SP), gastric (GP) and small
intestinal (SIP) phases of digestion. ................................................................................ 97
Table 4-5. Behaviour index (n) values of the Power Law model for control, xanthan gum-,
guar gum-, soy soluble polysaccharide (SSPS)-, and flaxseed gum-fortified
treatments in solution, following simulated salivary (SP), gastric (GP) and small
intestinal phases of digestion. ......................................................................................... 98
Table 4-7. Calculated slopes of the lines of regression (SLREG) of reducing sugar release for
control, xanthan gum-, guar gum-, flaxseed gum, and soy soluble polyssacharide
(SSPS)-fortified treatments. .......................................................................................... 100
Table 4-8. Percentage of starch hydrolysed (as measured by the amount of glucose released)
after in vitro digestion of control (no gum), xanthan gum-, guar gum, flaxseed
gum, and soy soluble polysaccharide (SSPS)-fortified solutions. ................................ 103

ix
Table 4-9. Final glucose concentrations measured inside the dialysate and calculated slopes of
the lines of regression (SLREG) of glucose release for control, xanthan gum-, guar
gum-, flaxseed gum, and soy soluble polysaccharide (SSPS)-fortified treatments
during 5 h in vitro digestion. ......................................................................................... 107
Table 5-1. Power Law parameters of control (no fibre) xanthan gum (XG)-, guar gum (GG)-,
soluble flaxseed gum (SFG)-, and soy soluble polysaccharide (SSPS)-fortified
treatments of the digesta isolated at the beginning (T0), after 1 h (T1), 2 h (T2),
and at the end (T3) of simulated small intestinal digestion. ......................................... 121
Table 5-2. Particle size as defined by the volume weighted mean d(4,3) of granules isolated
from in vitro digesta before the addition of amyloglucosidase (T0) after 1 h (T1), 2
h (T3), and 4 h (T3) of simulated small intestinal digestion. ........................................ 123
x
List of Figures
Figure 2-1. A comparison of solid and liquid components remaining in the stomach after
ingestion of a meal (Adapted from Camilleri, Malagelada, and Brown, 1985). .......... 10
Figure 2-2. GLUT2 model showing intestinal aborption of glucose following a meal (Adapted
from Kellett and Brot-Laroche, 2005). ......................................................................... 15
Figure 2-3. Schematic diagram of the dynamic gastric model. Numbers illustrate passage of
meal contents from the (1) the main body to the (2) the antrum to allow for
processing using (3) the piston and barrel to allow for (4) analysis (Adapted from
Vardakou et al., 2011). ................................................................................................. 20
Figure 2-4. Proposed flow diagram for a standardised in vitro digestion method (Adapted
from Minekus et al., 2014) ........................................................................................... 22
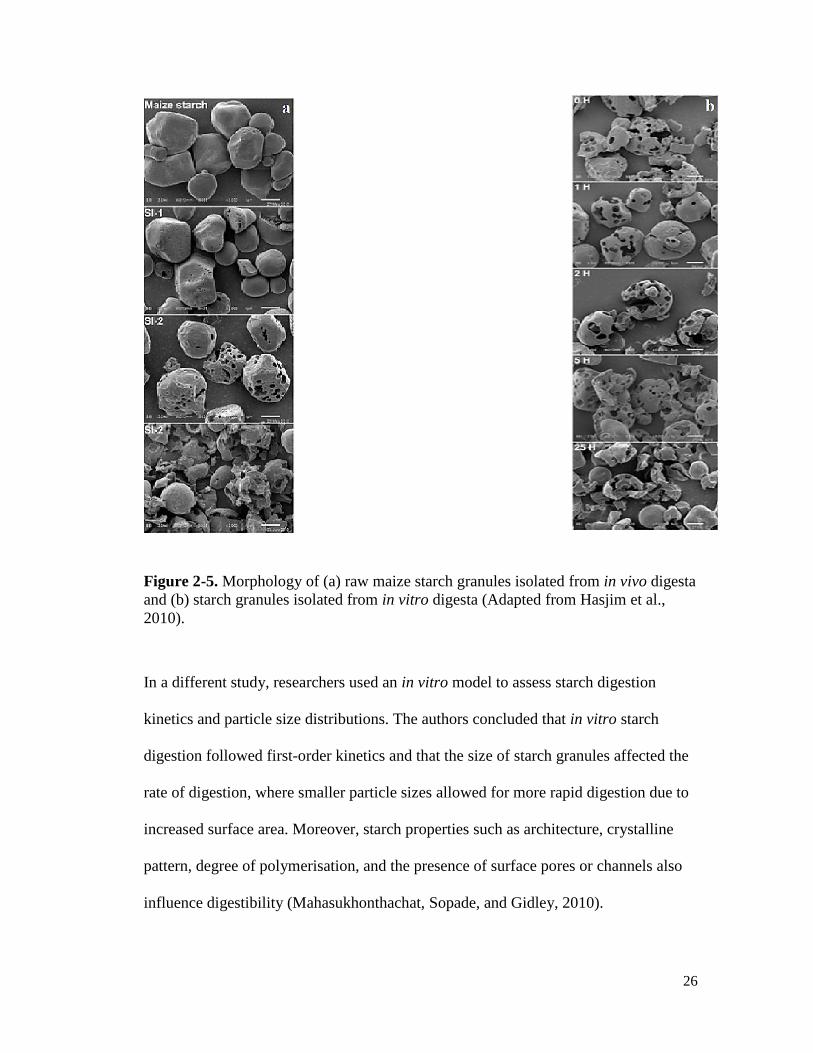
Figure 2-5. Morphology of (a) raw maize starch granules isolated from in vivo digesta and (b)
starch granules isolated from in vitro digesta (Adapted from Hasjim et al., 2010). ..... 26
Figure 2-6. Diagram of the potential effect of viscous soluble dietary fibre (SDF) on reducing
micelle absorption (Adapted from Gunness and Gidley, 2010). .................................. 36
Figure 2-7. Flow diagram illustrating guar gum production (Adapted from Wielinga, 2010). ....... 43
Figure 2-8. Chemical structure of the galactomannan backbone (Adapted from Wielinga,
2010). ............................................................................................................................ 44
Figure 2-9. Flow diagram illustrating xanthan gum production (Adapted from Garcia-Ochoa
et al., 2000). .................................................................................................................. 47
Figure 2-10. Structure of xanthan gum (Adapted from Garcia-Ochoa et al., 2000). ....................... 48
Figure 2-11. Structure of SSPS (adapted from Nakamura, et al., 2002). ......................................... 53
xi
Figure 3-1. Viscosity of guar gum-, xanthan gum-, soluble soy polysaccharide (SSPS)-, and
flaxseed gum- fortified solutions, as a function of shear rate (s-1
). .............................. 65
Figure 3-2. Viscosity of guar gum-, xanthan gum-, soluble soy polysaccharide (SSPS)-, and
flaxseed gum- fortified solutions, as a function of shear rate (s-1
) following 1h
simulated gastric digestion. .......................................................................................... 66
Figure 3-3. Viscosity of guar gum-, xanthan gum-, soluble soy polysaccharide (SSPS)-, and
flaxseed gum- fortified solutions, as a function of shear rate (s-1
), following a
two-stage in vitro digestion. ......................................................................................... 67
Figure 3-4. Viscosity of guar gum and guar gum-fortified solution containing protein and
starch, following simulated in vitro digestion (curves are overlapping). ..................... 68
Figure 3-5. Viscosity of xanthan gum and xanthan gum-fortified solution containing protein
and starch, following simulated in vitro digestion. ...................................................... 68
Figure 3-6. Viscosity of flaxseed gum and flaxseed gum-fortified solution containing protein
and starch, following simulated in vitro digestion. ...................................................... 69
Figure 3-7. Viscosity of soy soluble polysaccharide (SSPS) and SSPS-fortified solution
containing protein and starch, following simulated in vitro digestion. ........................ 69
Figure 3-8. Available glucose (µg/mL) in the dialysate during 180 min in vitro small
intestinal digestion of control (no fibre), soy soluble polysaccharide (SSPS)-,
flaxseed gum-, guar gum-, and xanthan gum-fortified solutions. ................................ 71
Figure 3-9. Available glucose (µg/mL) in the dialysate during 180 min in vitro small
intestinal digestion of control (no fibre), soy soluble polysaccharide (SSPS)-,
flaxseed gum-, guar gum-, and xanthan gum- fortified solutions when starch was
replaced with D-glucose. ............................................................................................... 75
Figure 4-1. Storage (G') and loss moduli (G") of xanthan gum-fortified treatments – that is
(a) in solution, (b), following simulated gastric digestion, and (c) at the end of 3-
stage in vitro digestion – as a function of frequency with an oscillating stress of
0.5 Pa. ........................................................................................................................... 88
xii
Figure 4-2. Storage (G') and loss moduli (G") of guar gum-fortified treatments – that is (a) in
solution, (b), following simulated gastric digestion, and (c) at the end of 3-stage
in vitro digestion – as a function of frequency with an oscillating stress of 0.5 Pa. .... 89
Figure 4-3. Storage (G') and loss moduli (G") of flaxseed gum-fortified treatments – that is
(a) in solution, (b), following simulated gastric digestion, and (c) at the end of 3-
stage in vitro digestion – as a function of frequency with an oscillating stress of
0.5 Pa. ........................................................................................................................... 90
Figure 4-4. Storage (G') and loss moduli (G") of soluble soy polysaccharide-fortified
treatments – that is (a) in solution, (b), following simulated gastric digestion, and
(c) at the end of 3-stage in vitro digestion – as a function of frequency with an
oscillating stress of 0.5 Pa. ........................................................................................... 91
Figure 4-5. Flow behaviour of control (no gum), xanthan gum-, guar gum-, soy soluble
polysaacharide (SSPS)-, and flaxseed gum-fortified solutions across a shear rate
range of 10 to 200 s-1
. ................................................................................................... 95
Figure 4-6. Flow behaviour of control (no gum), xanthan gum-, guar gum-, soy soluble
polysaacharide (SSPS)-, and flaxseed gum-fortified solutions - that follow
simulated, (a) salivary, (b) gastric, and (c) small intestinal digestion, across a
shear rate range of 10 to 200 s-1
. ................................................................................... 96
Figure 4-7. Reducing sugars released, expressed as mg/g sample of control (no fibre), soy
soluble polysaccharide (SSPS)-, flaxseed gum-, guar gum-, and xanthan gum-
fortified solutions, during 5 h simulated intestinal digestion. ...................................... 99
Figure 4-8. Slopes of the lines of regression (SLERG) of reducing sugar release for control,
xanthan gum-, guar gum-, flaxseed gum, and soy soluble polyssacharide (SSPS)-
fortified treatments versus apparent viscosity (50s-1
) during simulated small
intestinal digestion. ..................................................................................................... 101
Figure 4-9. Percentage of starch hydrolysis during 5 h simulated small intestinal digestion of
control (no fibre), soy soluble polysaccharide (SSPS)-, flaxseed gum-, guar gum-
, and xanthan gum-fortified solutions (measured by the concentration of glucose). .. 102
Figure 4-10. In vitro diffusion of glucose during 5 h simulated small intestinal digestion of
control (no fibre), soy soluble polysaccharide (SSPS)-, flaxseed gum-, guar gum-
, and xanthan gum-fortified solutions. ........................................................................ 106
xiii
Figure 5-1. Flow behaviour of native starch/skim milk powder solutions fortified with 4%
xanthan gum, 3% guar gum, 7% soluble flaxseed gum, and 20% soy soluble
polysaccharide (SSPS). .............................................................................................. 120
Figure 5-2. Particle size distribution of starch granules isolated from the in vitro digesta of
control- and fibre-fortified solutions at the beginning of simulated small
intestinal hydrolysis. ................................................................................................... 124
Figure 5-3. Particle size distribution of starch granules isolated from the in vitro digesta of
control- and fibre-fortified solutions after 1 hr of simulated small intestinal
hydrolysis. .................................................................................................................. 125
Figure 5-4. Particle size distribution of starch granules isolated from the in vitro digesta of
control- and fibre-fortified solutions after 2 h of simulated small intestinal
hydrolysis. .................................................................................................................. 126
Figure 5-5. Particle size distribution of starch granules isolated from the in vitro digesta of
control- and fibre-fortified solutions at the end of simulated small intestinal
hydrolysis. .................................................................................................................. 127
Figure 5-6. Scanning electron microscopy of tapioca starch granules isolated from control
(C)-, soy soluble polysaccharide (SSPS)-, soluble flaxseed gum (SFG)-, guar
gum (GG)-, and xanthan gum (XG)-fortified solutions. ............................................ 131
Figure 5-7. Scanning electron micrographs of tapioca starch aggregates isolated from guar
gum (GG)- and (XG)-fortified solutions. ................................................................... 132
Figure 5-8. Morphology of granules isolated from the in vitro digesta of the control and fibre
foritifed treatments at the beginning of simulated small intestinal digestion. ............ 134
Figure 5-9. Morphology of granules isolated from the in vitro digesta of the control and fibre
fortified treatments after 1 h of simulated small intestinal digestion. ........................ 136
Figure 5-10. Morphology of granules isolated from the in vitro digesta of the control and
fibre fortified treatments after 2 h of simulated small intestinal digestion. ................ 137
xiv
Figure 5-11. Morphology of granules isolated from the in vitro digesta of the control and
fibre fortified treatments at the end of in vitro digestion. ........................................... 139
Figure 5-12. Light microscopy of starch isolated from the digesta of control (C), soy soluble
polysaccharide (SSPS), soluble flaxseed gum (SFG), guar gum (GG) and xanthan
gum (XG) treatments at the beginning (T1), after 1 h (T2), after 2 h (T3) and at
the end of simulated small intestinal digestion (T4)................................................... 141
xv
List of Acronyms and symbols
XG Xanthan gum
GG Guar gum
SFG Soluble flaxseed gum
SSPS Soy soluble polysaccharide
RSR Reducing sugar release
NSD Normalized sugar diffusion
GIT Gastrointestinal tract
DGM Dynamic gastric model
CS Control solution
G’ Storage modulus
G” Loss modulus
σ Shear stress
K Consistency index
n Flow behaviour index
SEM Scanning electron microscopy
1
1. Introduction
1.1. Importance of dietary fibre and research focus
Mankind has been enduring global change for centuries, whether they are
political, economic or societal; yet the single most invariable and important factor in
our everyday lives remains to be healthy. For decades the link between proper
dietary eating patterns and improvement in overall health and wellness has been
perpetuated and strengthened through research studies and government
recommendations. The Public Health Agency of Canada (2013) has developed what
is known as the “Preventing Chronic Disease Strategic Plan” in order to provide a
roadmap to healthy living. The front runners for this strategy include two
controllable factors, those being regular exercise and healthy eating habits. This link
between food and health is being perpetuated in the minds of consumers and also
legislators who are incessantly looking for long-term reduction in health care costs.
Despite this increase in awareness there is an interminable upsurge in
disease trends in North America. To exemplify this, self-reported obesity trends have
increased from 6.2% in 1985 to 16.9% in 2007. Furthermore, the number of people
diagnosed with type II diabetes (T2D) in Canada alone has increased from 3.3% in
1999 to 5.6% in 2009 and if these incidence rates continue on this path the expected
number of people diagnosed with T2D is expected to reach 3.7 million by 2019.
According to the World Health Organization, T2D affects more than 380 million
people worldwide and this number is expected to double by the year 2025 (World
Health Organization, 2003). Beyond the health implications that these trends have
they also bear a significant economic impact, as it has been shown that populations
2
with diabetes have nearly four times greater annual per capita health care costs than
populations without (Public Health Agency of Canada, 2011). Nonetheless,
Canadian consumers are consistently being advised on the importance of exercise
and eating a healthy balanced diet, with the primary focus being fat reduction and
consuming foods rich in dietary fibre. The latter component is one that has gained a
great deal of attention from not only consumers but also health practitioners,
researchers, legislators and food manufacturers, due to the multitude of health
benefits associated with the consumption of dietary fibre.
Recommended intake levels for dietary fibre are based on the level observed
to protect against coronary heart disease (Institute of Medicine, 2005). In addition to
this, consumption of fibre-rich foods is associated with other physiological effects
including increases in satiety, reductions in blood lipids, specifically triglycerides
and low-density lipoprotein cholesterol, decreases in blood glucose levels, as well as
enhanced gastrointestinal immunity and overall colonic health (Jenkins, Leeds,
Gassull, Cochet, & Alberti, 1977; Gunness & Gidley, 2010; Brownlee, 2011).
Globally, government agencies such as the Canadian Diabetes Association,
American Diabetes Association, British Diabetes Association, and European
Association for the Study of Diabetes all have made strong nutritional
recommendations to include dietary fibre as part of a regular diet for people
suffering from T2D (Anderson, Randles, Kendall, and Jenkins, 2004). Currently, the
recommended intake levels in North America are 38 g/d and 25 g/d for men and
women, respectively. However, recent surveys from nutrient intakes from foods
indicate that actual intake levels fall between 16.5 to 19.4 g/d for men and 14.3 to
3
16.6 g/d for women (Health Canada and Statistics Canada, 2004). Despite current
recommendations and growing awareness surrounding the importance of fibre
consumption, reported low intake levels suggest a need for fibre fortification of
foods.
Hydrocolloids are commonly used ingredients by the industry for their ability
to impart technological functionality, such as colloidal stability, texture, ice
recrystallization inhibition, gelation and viscosity, in a range of food systems.
Furthermore, the ability of hydrocolloids to act as dietary fibre makes them
functional food ingredients as well, allowing them to deliver at least one of the
aforementioned health benefits. Because of this they are integral components of
human diets as they can define both the sensory and nutritional qualities of foods
(Gidley, 2013). Therefore, selecting the most appropriate ingredient for food
fortification means maximizing nutritional quality without compromising
organoleptic properties of the product.
Viscosity is a physicochemical property of foods that can be controlled
through the addition of certain hydrocolloids, such as guar gum and xanthan gum.
Moreover, it is purported to be associated with some of the health benefits that arise
from consumption of fibre rich foods, which includes attenuation in postprandial
glycaemia (Brownlee, 2011). Fibre intake has been reported to be associated with
improved glucose/insulin metabolism in T2D patients (Jenkins, Jenkins,
Zdravkovic, Wursch, and Vuksan, 2002) and observational studies indicate that diets
high in fibre have an overall protective effect against T2D (Barclay, Petocz,
McMillan-Price, Flood, Prvan, Mitchell, and Brand-Miller, 2008; Kendall, Esfahani,
4
and Jenkins, 2010). The ability of viscous dietary fibres to reduce plasma glucose
levels in humans has been well reported over the past couple of decades (Jenkins et
al., 1977). However, reductions in plasma glucose concentrations achieved by
increasing viscosity may be due to one of several events (Dikeman & Fahey Jr.,
2006). Carbohydrate assimilation, which will be discussed in detail in Chapter 2,
begins inside the mouth. As the bolus reaches the stomach an increase in viscosity of
the gastric contents may slow gastric emptying rates. Furthermore, a thickening
inside the small intestine may decrease contact between the small intestinal contents
and digestive enzymes. Finally at the mucosal surface, ingestion of viscous fibres
may lead to a thickening of the unstirred water layer, thereby slowing the diffusion
rate of glucose (Edwards, Johnson, and Read, 1988; Eastwood and Morris, 1992;
Mälkki, 2001). Despite the growing evidence and continual research over the past
couple of decades, the exact mechanism(s) by which dietary fibres are able to
modulate the glycaemic response in humans remains to be elucidated.
5
1.2. Overall Objectives
In our earlier work we have shown how despite increasing solution viscosity,
through the addition of various types of dietary fibre, substantial reductions in
digesta viscosity were observed for all solutions following a simulated digestion
protocol (Fabek, 2011). Furthermore, the ability of fibres to resist loss of viscosity
varied, with some exhibiting total loss while others were able to retain a significant
amount. However, the design protocol did not include adding fibre to a food matrix
containing other nutrients such as available carbohydrates and protein. Moreover, the
link between digesta viscosity and physiological functionality was not examined.
The overall objective of this study is to investigate the structure-function
relationship of viscous soluble fibres, by focusing on the effect(s) they may have on
reducing glucose levels, in vitro. The milestones of this work are:
1) To formulate solutions containing protein and starch with guar gum,
xanthan gum, soluble flaxseed gum, and soy soluble polysaccharide
(SSPS) at concentrations that allow for similar solution viscosities
2) To analyze the rheological behaviour of fibre-fortified solutions
throughout in vitro digestion
3) To determine the amount of intermediate starch hydrolysis products and
glucose released in the simulated digesta
4) To examine the effects that fibre addition may have on glucose
diffusivity inside a dialysis system

6
5) To isolate starch granules at various times of simulated small intestinal
digestion for analysis using light scattering, scanning electron
microscopy and light microscopy
7
2. Literature Review
This review will primarily focus on the relationship between dietary fibre,
specifically soluble dietary fibre, and the ability to generate glycemic reductions.
Initially, an overview of the biomechanics of the gastrointestinal tract will be
presented. This will be followed by a description of nutrient absorption, with the focus
being on carbohydrate metabolism throughout the salivary, gastric, and small
intestinal phases. Subsequently, recent advances in the design protocols of in vitro
digestion methods will be reviewed, with a focus on studies exploring starch
digestion. Information on dietary fibre, including the definition, classification and
postulated health benefits of its subsequent consumption will be outlined. Finally, the
structure, physicochemical properties, and uses of guar gum, xanthan gum, flaxseed
gum, and soy soluble polysaccharide will be presented.
2.1. Digestion of foods
2.1.1. Gastrointestinal physiology
The gastrointestinal tract (GIT) is the largest endocrine organ in the body and
stretching it would create a long muscular tube close to 30 ft in length. The objective
of the GIT is digestion of foods, absorption of nutrients, and excretion of waste
products. Surprisingly, the process of digestion begins before food is even placed
inside the mouth, this is known as the cephalic phase of digestion. Chemoreceptors
and mechanoreceptors located in the buccal and nasal cavities are stimulated by the
mere thought or smell of food. Subsequently, nerve impulses are transmitted to the
stomach via vagal efferent fibers, which initiates gastric acid secretion in preparation
8
for food entering the GIT. The cephalic phase is responsible for nearly 30% of the
total response to a meal (Johnson, 2014).
As we ingest food, the process of chewing reduces the size of ingested food
particles and mixes the food with saliva thereby lubricating the bolus and exposing it
to digestive enzymes, such as salivary amylase. The bolus is then propelled in a
proximal-to-distal manner through the pharynx via peristaltic contractions, which are
rhythmic wave-like contractions of the pharyngeal musculature. The bolus is then
further propelled through the esophagus in a similar manner of muscular contractions,
where inner circular muscle fibers squeeze the food and the outer longitudinal muscle
layer physically pushes the food toward the stomach. Often a secondary peristaltic
event takes place, which aids in emptying the esophagus or if gastric contents reflux
back into the esophagus (Johnson, 2014).
The stomach is separated into three distinct anatomical divisions, the fundus,
the corpus (or body), and the antrum. The fundus acts as a reservoir for ingested
foods. It has been shown that one of the tasks required by the stomach is to act as a
temporary storage compartment, controlling the release of gastric contents into the
duodenum (Fengua and Singh, 2010). The body is responsible for propelling gastric
contents toward the pylorus. Lastly, the antrum is characterized by high intensity
mechanical mixing allowing for chyme to be adequately mixed with gastric secretions
(Chang, Sitrin, and Black, 1996). As previously mentioned, the stomach begins
preparation before the bolus reaches the lower esophageal sphincter. Gastrin, a
hormone secreted by the G cells of the stomach lining, stimulates gastric glands in the
oxyntic gland area along with histamine and acetylcholine (Johnson, 1991). These
9
gastric glands contain two types of cells: parietal cells and chief cells. The former
cells secrete intrinsic factor, a mucoprotein critical for the absorption of vitamin B12,
and hydrochloric acid responsible for creating a low pH environment. The latter cells
are responsible for secreting pepsinogen, the enzyme precursor to pepsin that initiates
protein digestion, and gastric lipase responsible for lipid digestion. Furthermore, the
gastric mucosa contains epithelial cells that subsequently secrete soluble mucus
leading to the lubrication of chyme as well as insoluble mucus that protects the
mucosa from damage (Johnson, 2014). Overall, gastric acid secretion accounts for
more than 50% of the total response to a meal.
As mentioned previously, the task of the orad region of the stomach is to
accommodate ingested material. It contains weak contractions and thin musculature to
permit stretching. In the fasted state, stomach volume is approximately 200 mL and
this increases to more than 1.7 L in the fed state allowing for dimensions of
approximately 10 cm wide and 30 cm long to be reported (Ferrua and Singh, 2010).
Once chyme enters the body of the stomach peristaltic contractions, with a frequency
of three contractions per minute and duration of 2 to 20 seconds per contraction, mix
and propel gastric contents toward the gastroduodenal junction, or pylorus. The
velocity of the peristaltic wave, which is controlled by fluctuations in membrane
potential, increases as it reaches the pylorus allowing it to eventually overtake the
gastric contents. As this occurs, everything but the smallest food particles is pushed
back, a process known as retropulsion. Ultimately, this provides sufficient mixing
leading to a breakdown of food particles to a small enough size, less than 1 mm3,
thereby permitting passage through the pylorus and into the small intestine. An earlier
10
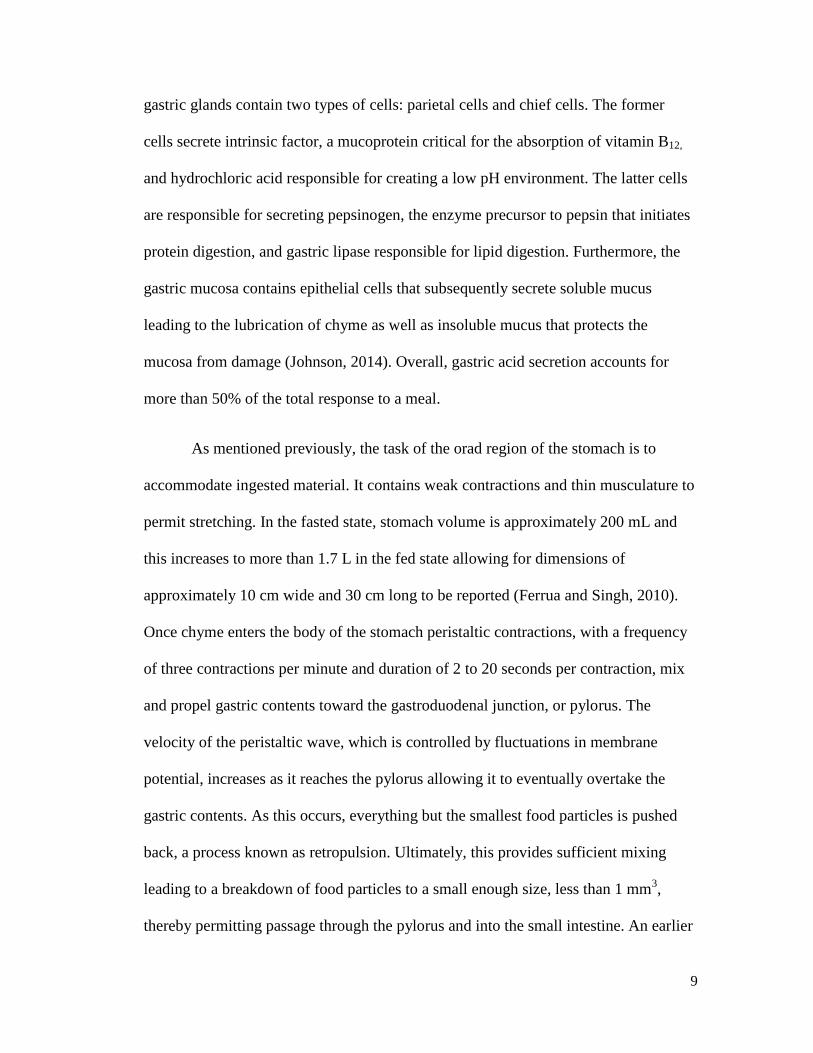
study done on examining the relationship between gastric motility patterns and gastric
emptying rates of solids and liquids in humans demonstrates how liquid meals exit the
stomach at a much faster rate than do solid meals, as can be seen in Figure 2-1. The
authors attribute their findings to the requirement of the solid component to be
reduced to small particles before being emptied into the small intestine.
Figure 2-1. A comparison of solid and liquid components remaining in the stomach
after ingestion of a meal (Adapted from Camilleri, Malagelada, and Brown, 1985).
The small intestine is divided into three sections, the duodenum is the section
distal to the pylorus of the stomach, the jejunum is the middle portion, and the ileum
is the most distal section that connects to the large intestine via the ileocecal valve.
Altogether, they constitute the longest portion of the GIT and the small intestine is the
11
site where most of the nutrient absorption takes place, which will be discussed in
greater detail in Section 2.1.2. As food particles pass through the pylorus reaching the
duodenum, the pancreas is stimulated resulting in alkaline and enzymatic secretions.
The former is stimulated by secretin, also known as “nature’s antacid”, which is
released from S cells in response to gastric acid and increasing levels of long-chain
fatty acids. The latter is stimulated by cholecystokinin (CCK), arriving from I cells in
response to products of protein (amino acids) and fat (fatty acids) digestion.
Neutralization of food particles occurs rapidly in the duodenum and after
approximately 30 minutes enzyme secretion reaches nearly 80% completion and
continues until the stomach is empty. Pancreatic secretions are produced at a rate of
0.2 – 0.3 mL/min and can reach values of up to 4 – 4.5 mL/min, when stimulated
(Chang et al., 1996). In the case of lipid digestion, bile, which is secreted from the
liver and is comprised of bile acids, phospholipids, cholesterol, and pigments, is
released from the gall bladder via the common bile duct to aid in emulsification of the
lipid compounds (Johnson, 2014).
The small intestine is innervated by both the autonomic and enteric nervous
systems, which are together responsible for the contractions inside the small intestine.
In particular, two layers of smooth muscles control the contractile activity, an outer
longitudinal layer and a thicker inner circular muscle layer. Both layers are found
abundant throughout the small intestine and their thickness has been reported to
decrease distally towards the aforementioned ileocecal junction (Johnson, 2014).
Similar to the stomach, smooth muscles of the small intestine undergo cyclic
depolarizations and repolarizations inducing what is known as slow wave activity.
12
Unlike the contractions in the stomach, however, the contractions here are initiated by
spike potentials, which are rapid depolarizations of the cell membrane that occur
during the depolarization phase of the preceding slow wave. The movements of the
small intestinal walls are divided into 2 types of contractile events: segmentation and
peristalsis. Segmentation occurs when slow waves are induced in the absence of spike
potentials. They are localized concentric contractions, due to the fact that the
contraction is neither preceded nor followed by further contractions, which are 1 to 2
cm in length and that act to physically squeeze the chyme and mix it with digestive
enzymes. However, if contractions at adjacent sites occur, then contents are propelled
in an analward direction at a velocity of 0.5 to 2 cm/s, this is known as peristalsis
(Guyton & Hall, 2010; Tharakan, Norton, and Bakalis, 2010; Johnson, 2014). The
continuous contraction and relaxation of the circular and longitudinal muscles push
the intestinal contents toward the ileocecal junction so that the remaining material
may pass into the large intestine. The mechanical design of the small intestine makes
it a vital organ for nutrient absorption.
2.1.2. Carbohydrate metabolism
Carbohydrates are an important energy source for the body, providing
approximately 4 kcal/g, and are the primary fuel source for the brain. Currently,
Health Canada advocates that the acceptable macronutrient distribution range, as the
percentage of total calories being derived from carbohydrates, should fall between 45
– 65% of the total diet (Health Canada, 2011). Dietary carbohydrates can be further
divided into sugars, starch and fibre; the latter term will be discussed in detail in the
next chapter. Starch, a storage polysaccharide in plants, is the main energy source in
13
human food (Hasjim, Lavau, Gidley, and Gilbert, 2010) and is comprised of two
molecules, amylose and amylopectin. Amylose is the smaller of the two, with a
molecular weight of approximately 106 Da and is primarily linear with few longer
chain branches. Amylopectin on the other hand is a larger, highly branched molecule
with a molecular weight of approximately 108 Da. Both consist solely of D-glucose
connected by α-1-4 linkages, with amylopectin containing α-1-6 linkages at the
branched points. Both polymers are α-glucans and, therefore, their subsequent
digestion is initiated in the mouth.
Saliva, the secretion of which is almost completely controlled by the nervous
system, functions by protecting the mouth, lubricating the bolus, and in the case of
starchy foods initiating the process of digestion. Ptaylin is the α-amylase enzyme
found in the mouth and begins to cleave the α-1,4-glycosidic bonds at random
locations along the chain of the entering carbohydrate moiety. The swallowed bolus
then travels down through the esophagus into the stomach where the acidic
environment deactivates α-amylase and enzyme activity ceases altogether. Food
particles are further propelled through the pylorus, as described in Section 2.1.1.,
arriving in the duodenum, which is where the majority of starch digestion begins.
Digestion within the small intestine occurs both inside the lumen and at the
surface of epithelial cells, through the action of enzymes embedded along the brush
border. Small intestinal luminal digestion begins when chyme is sufficiently mixed
with pancreatic secretions containing amylase enzymes that are secreted from the
pancreatic duct. These enzymes attack the interior α-1,4-bonds, producing maltose and
the trisaccharide maltotriose as well as α-limit dextrins, which are branched
14
oligosaccharides of glucose containing 5 to 10 glucose residues and are formed from
the hydrolysis of amylopectin. Through segmentation these luminal digestion products
are brought in contact with brush border carbohydrases. Maltase hydrolyzes maltose
into glucose, sucrase cleaves sucrose to yield glucose and fructose, and lactase breaks
down lactose into glucose and galactose; individuals with insufficient amounts of
lactase suffer from lactose intolerance. Finally, glucoamylase liberates glucose
residues starting from the non-reducing ends until a 1-6 branch point is reached,
which is subsequently hydrolyzed by isomaltase. Unless there is a predisposing
medical condition, sugar assimilation in humans is complete in the proximal jejunum.
There seems to be minimal control in humans over how much free sugar is absorbed,
and it has been estimated that hexoses equivalent to 22 pounds of sucrose can be
absorbed per day (Johnson, 2014). However, there are reports of a negative feedback
mechanism by which chemo- and osmoreceptors in the proximal small intestine
regulate the emptying of gastric contents. To exemplify this, a 750 mL isotonic citrate
solution that is placed in a human stomach passes through the pylorus in 20 min
whereas a solution with the same volume containing sucrose is delivered at a much
slower rate (Johnson, 2014).
2.1.3. Glucose absorption
In order for the body to be able to utilize carbohydrates as a fuel source, the
monosaccharides must first get absorbed into the bloodstream. Despite the presence of
aqueous channels between enterocytes, glucose is too large of a molecule to pass
through via simple diffusion; therefore, both passive and active transport are involved.
In humans, there are three major routes used to allow for monosaccharide absorption.

15
Fructose is transported from the intestinal lumen via glucose transporter 5 (GLUT-5)
and exits the cell using a different channel, GLUT-2. Glucose and galactose enter the
blood using the same channel, GLUT-2, however unlike fructose, which is absorbed
by facilitated diffusion alone, they are absorbed by active transport via an Na+-
dependent transport system, SGLT-1. The carrier binds 2 Na+ molecules for every
glucose or galactose molecule being transported, as illustrated in Figure 2-2. The
reaction is ATP-driven and maintains a Na+ gradient that favours glucose entry.
Glucose exits the cytosol using GLUT-2, located at the basolateral membrane, and
travels to the liver via the portal vein, which is responsible for moderating the
distribution of glucose throughout the body.
Figure 2-2. GLUT2 model showing intestinal aborption of glucose following a meal
(Adapted from Kellett and Brot-Laroche, 2005).
16
The target plasma glucose value is 7.8 mmol/L or less, anything between 7.8
and 10 is considered pre-diabetes or Impaired Glucose Tolerance (IGT), 10 and
beyond classifies diabetes (Canadian Diabetes Association, 2009). Although insulin is
responsible for stimulating liver and muscle cells to utilize glucose from the blood,
inadequate production may lead to type I diabetes, and if cells are resistant to the
insulin that is produced, then type II diabetes may develop. In either case,
hyperglycemia is the result and in the latter hyperinsulinemia may also occur due to
the continuous production of insulin by the pancreas. As mentioned in Chapter 1, the
occurrence of T2D is on the rise, which is why understanding the mechanics of
carbohydrate digestion is crucial. However, studying digestion behaviour, in vivo, can
be both costly and time consuming with many ethical considerations and restrictions
that cannot be overlooked. As a result, developing in vitro techniques has become an
integral design strategy for research that is focused on trying to better understand
human digestive health.
2.1.4. Review of in vitro digestion
Simulated digestion protocols more often than not incorporate the oral, gastric
and small intestinal phases. Occasionally, depending on the nature of the research, a
large intestinal fermentation step is included (Minekus, Alminger, Alvito, Balance,
Bohn, Bourlieu, et al., 2014). Regardless of the in vitro digestion method that is
employed, the strategy is to mimic physiological conditions and therefore the design
takes into account pH, incubation times, digestive enzyme concentrations and
agitation speeds. These principles date as far back as 1969 when Southgate
incorporated amyloglucosidase and pullulanase to hydrolyze starch (Southgate, 1969).
17
A 2011 study, which surveyed more than 80 publications whose research focused on
in vitro digestion models for foods, reported that the majority (45%) were based on
plant-based foods such as starch, tea and bread, followed by meats (18%), and
emulsions (9%) (Jur, Lim, Decker, and McClements, 2011). Since the time of
Southgate, two types of digestion models have been introduced to allow researchers to
study the gastrointestinal behaviour of foods and pharmaceuticals; those are static
models and dynamic models.
Static digestion models receive their name from the fact that the concentrations
of enzymes, bile acids, buffers (pH) and salts and their subsequent ratios to meal
components, remain the same during each stage of digestion. Nonetheless, they
comprise the majority of models that are used in studying the digestibility and
bioavailability of mycotoxins, soil contaminants, pharmaceuticals, and macronutrients
such as proteins, lipids and carbohydrates (Guerra, Etienne-Mesmin, Livrelli, Denis,
Blanquet-Diot, and Alric, 2012). The design includes a brief oral phase, usually 5 min,
to allow for mechanical breakdown and to initiate amylolysis. Subsequently, a gastric
step (1 – 2 h) continues the breakdown process and mixes the substrate with simulated
gastric fluid containing hydrochloric acid and pepsin. Finally, the simulated intestinal
fluid of the intestinal phase neutralizes the mixture and supplies a variety of different
enzymes as well as bile to allow for complete digestion of protein, fat and
carbohydrate. The common theme amongst them is that from the oral step to the small
intestinal stage, all enzyme concentrations, pH values, mechanical stresses and
incubation times are fixed. Although they provide simplicity and a high throughput,
static models lack a physiological relevance to in vivo conditions, which is a challenge
18
for any in vitro digestion protocol. The mechanics of the GIT are highly dynamic
throughout all stages of digestion. As was illustrated in Section 2.1.1, the digestive
tract is a highly complex system that incorporates a variety of control/feedback
mechanisms, including neurological, hormonal, and even the nutrients themselves can
regulate different steps of digestion. For example, in the oral step hydration-
lubrication depends on the meal type, whether it is solid or liquid. In the gastric stage,
only small particles may pass through the pylorus, indicating that not everything is
introduced to the duodenum at the same time. Moreover, the pH in the stomach during
the fasted state is significantly different than after consumption of a meal. In the small
intestine, the lack of removal of digestive products is a major drawback to using static
models, which has been reported to lead to product inhibition of digestive enzymes
(Minekus et al., 2014). Additionally, there are both intra- and inter-personal
variability where age, physical constitution, mental status, and general eating habits
all factor in on how food is metabolised. These are parameters that are nearly
impossible to control and furthermore it is difficult to compare the results of one static
model to another due to the heterogeneity in their design protocols (pH, incubation
times, enzymes used in the study and their concentrations). These drawbacks have led
researchers to create novel ways by which human digestion may be studied, through
the introduction of dynamic digestion models.
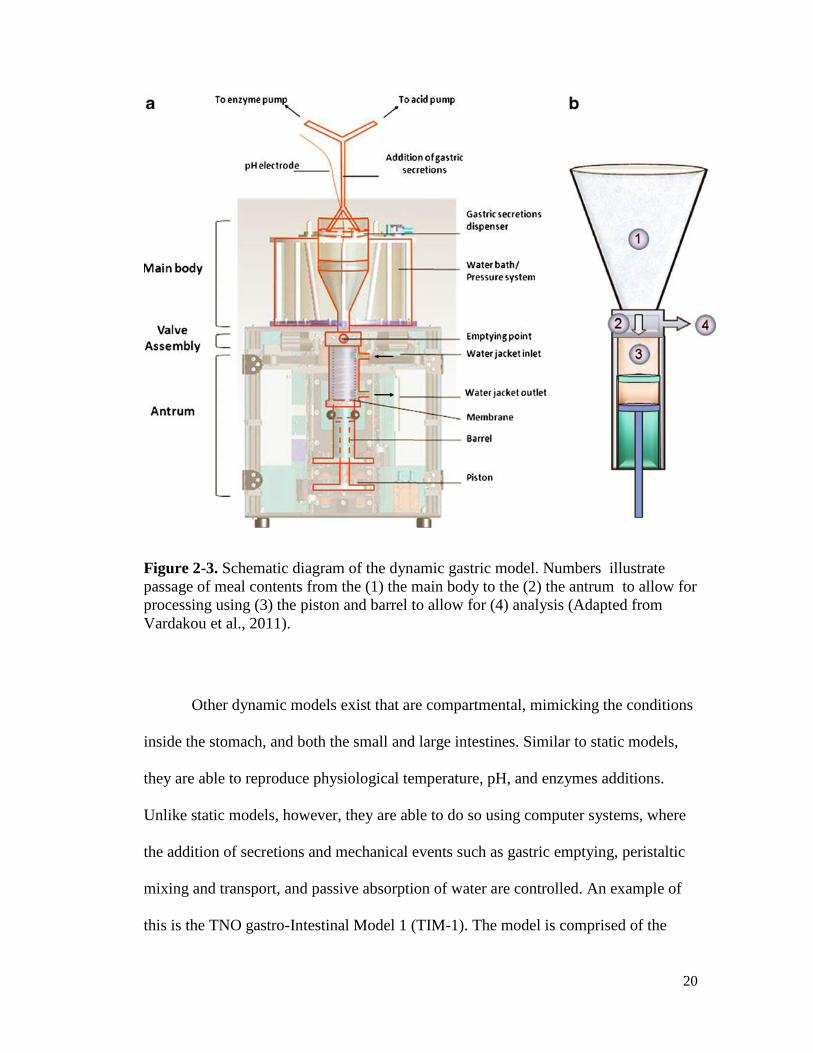
The dynamic gastric model (DGM) simulates events taking place inside the
stomach. The design includes two compartments, the body and the antrum, the
schematic is illustrated in Figure 2-3. The body is essentially a cone that can
accommodate up to 800 mL of material, which is placed inside a water bath. Changes
19
in water pressure act to mimic peristaltic actions in the stomach (three gentle
contractions are produced per minute). It is inside the body where digestive secretions
are released. The secretion of enzymes is achieved using a peristaltic pump, which is
connected to a computer that calculates the enzyme concentrations based on the
volume of food inside the machine. The pH is monitored using a pH catheter placed
directly inside the body. The antrum is responsible for the mixing and subsequent
breakdown of food material. The grinding of the antrum occurs by the sliding of two
stainless steel cylinders controlled by a piston, which act to break down the food
particles to allow them to pass through an elastic annulus, a small opening on the
bottom representing the pylorus. The unique design of the DGM allows it to mimic
retropulsion, where only smaller particles are able to leave the stomach to allow for
subsequent analysis and larger ones are refluxed back into the top chamber (body) to
allow for further mixing with gastric secretions (Chessa, Huatan, Levina, Mehta,
Ferrizzi, and Rajabi-Siahboomi, 2014; Wickham, Faulks, Mann, and Mandalari, 2012;
Vardakou, Mercuri, Barker, Craig, Faulks, and Wickham, 2011).
20
Figure 2-3. Schematic diagram of the dynamic gastric model. Numbers illustrate
passage of meal contents from the (1) the main body to the (2) the antrum to allow for
processing using (3) the piston and barrel to allow for (4) analysis (Adapted from
Vardakou et al., 2011).
Other dynamic models exist that are compartmental, mimicking the conditions
inside the stomach, and both the small and large intestines. Similar to static models,
they are able to reproduce physiological temperature, pH, and enzymes additions.
Unlike static models, however, they are able to do so using computer systems, where
the addition of secretions and mechanical events such as gastric emptying, peristaltic
mixing and transport, and passive absorption of water are controlled. An example of
this is the TNO gastro-Intestinal Model 1 (TIM-1). The model is comprised of the
21
stomach and the three parts of the small intestine (duodenum, jejunum and ileum) and
is considered to be the closest simulation to in vivo digestion (Guerra et al., 2012).
Despite continuous advances and technological efforts to improve in vitro methods
there are always limitations in modelling human digestion. As mentioned, static
models continue to be the preferred method; however, due to the heterogeneity
amongst the different models, there is a need for standardisation of in vitro digestion
protocols.
The requirement for standardisation of in vitro methods is the result of the
range in values for incubation times, buffer constituents and enzyme concentrations
that are employed and reported in literature. Hollebeeck, Borlon, Schneider,
Larondelle, and Rogez (2013) have reported that incubation times can range from 5
min to 15 min in the salivary step, from 30 min to 180 min for the gastric step, and
from 60 min to 360 min for the small intestinal step. Moreover, pH levels reported in
recent literature vary from 5.0 to 6.9 in the salivary step, from 1.1 to 2.8 in the gastric
step, and from 6.3 to 7.8 for the small intestinal step. Finally, the composition and
concentration of enzymes employed in different studies and the lack of reported
enzyme activity makes it difficult to compare studies that use static models
(Hollebeeck, et al., 2013). An earlier study demonstrated the necessity of
incorporating pepsin in the simulated gastric step and the effect that varying pH of the
simulated duodenal step has on pancreatin activity (Woolnough, Monro, Brennan, and
Bird, 2008). As a result, studies have been done to explore the effect that three
continuous factors (pH, incubation times and enzyme concentration) have on
macronutrient digestibility, in order to ascertain a standardised protocol (Minekus et
22
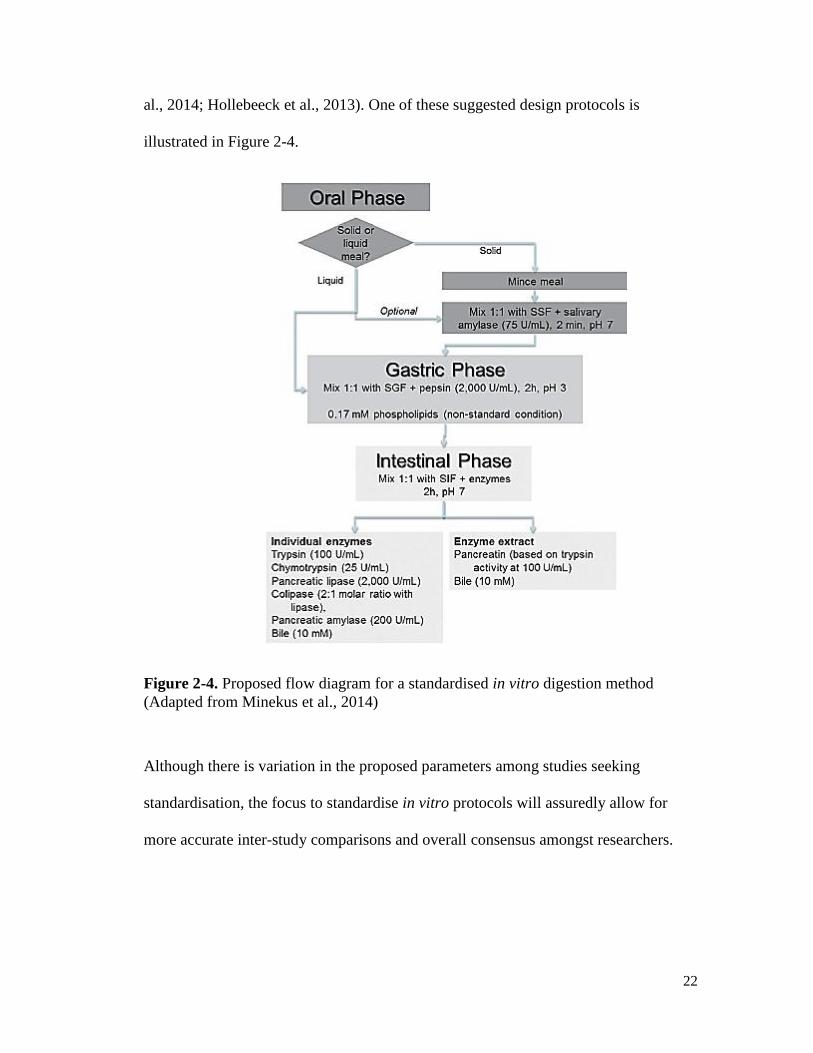
al., 2014; Hollebeeck et al., 2013). One of these suggested design protocols is
illustrated in Figure 2-4.
Figure 2-4. Proposed flow diagram for a standardised in vitro digestion method
(Adapted from Minekus et al., 2014)
Although there is variation in the proposed parameters among studies seeking
standardisation, the focus to standardise in vitro protocols will assuredly allow for
more accurate inter-study comparisons and overall consensus amongst researchers.
23
2.1.5. In vitro digestion methods related to starch digestion
As mentioned in Section 2.1.4, digestion methods have been around since
1969, when Southgate used pullulanase and amyloglucosidase to hydrolyze starch.
Since then, methods for modelling amylolysis of starch have been improved upon and
are widespread throughout literature. However, the Englyst method, which employs
controlled enzymic hydrolysis to measure total starch, rapidly digestible starch, slowly
digestible starch and resistant starch fractions in foods (Englyst, Kingman, and
Cummings, 1992), has become the pillar of in vitro models investigating starch
digestion and is heavily cited among nutrition and food science journals (Edwards,
Warren, Milligan, Butterworth, and Ellis, 2014). In fact, both the Englyst and
Southgate procedures have become two of the most widely used enzymatic chemical
methods for dietary fibre analysis, along with the AOAC enzymatic gravimetric
methods (Tungland and Meyer, 2002). Mimicking the in vivo circumstance is a
challenging task, which is made even more challenging when attempting to use in
vitro methods to analyse the mechanics and products of starch digestion. The
challenge is associated with controlling experimental conditions, as they are affected
by a variety of parameters that are intrinsic to not only the biochemical and physical
processes/conditions of the body but also the structural organization of different starch
granules. Consequently, research on in vitro starch digestion is of immense
importance to biochemists, physicists, nutritionists and food scientists as well as
researchers exploring the requirements for a stadardised in vitro design protocol.
Studies focused on exploring the need for standardised in vitro digestion
methods use starch as a substrate to determine the fixed conditions of the salivary
24
step. Minekus et al. (2014) used soluble potato starch to assess amylase activity and
concluded that a 2 min salivary stage at pH 6.8 with α-amylase concentration of 75 U
mL-1
should be used as a standard. In contrast, Hollebeeck et al. (2013) used surface
methodology to determine the incubation time, pH, and digestive enzyme
concentrations that will allow for 5% salivary starch hydrolysis, mimicking the in vivo
circumstance (Guyton and Hall, 2010). The authors of this paper concluded that a 5
min salivary step at pH 6.9 and amylase activity of 1.3 U mL-1
are sufficient to allow
for 5% starch hydrolysis. Despite varied results, this demonstrates the continued
importance of using starch as a substrate for in vitro digestion models. In addition,
studies have explored enzyme kinetics by modelling amylolysis of starch-containing
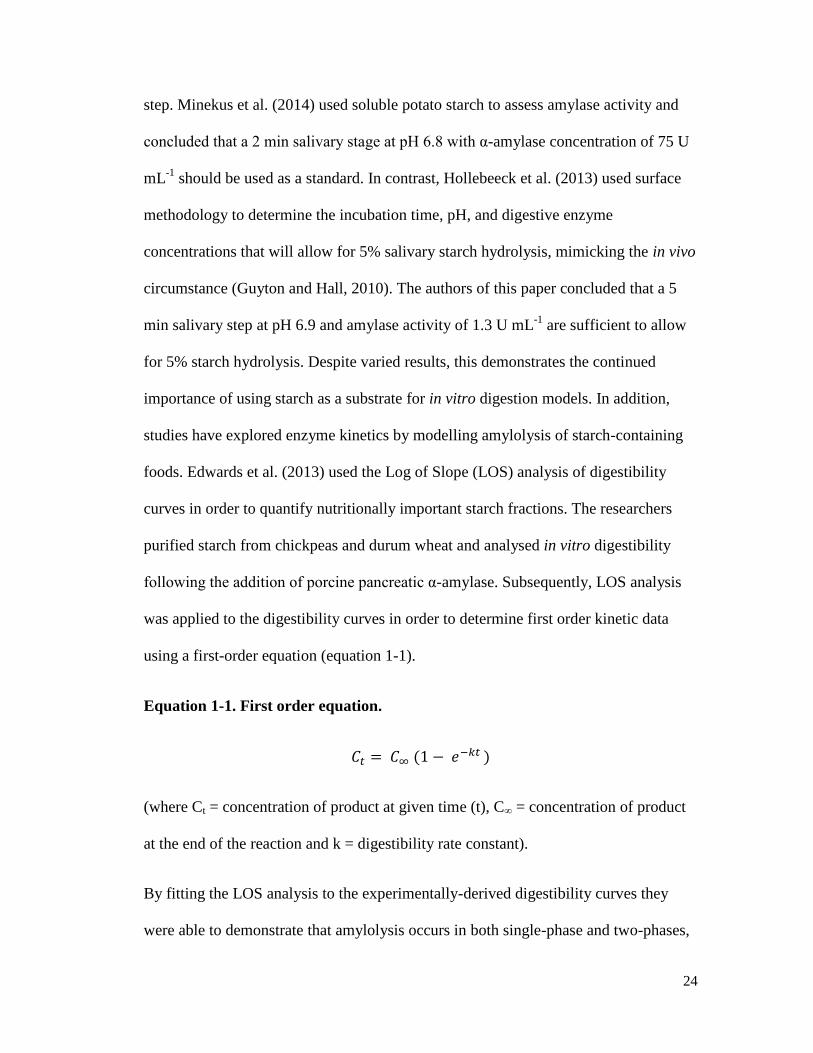
foods. Edwards et al. (2013) used the Log of Slope (LOS) analysis of digestibility
curves in order to quantify nutritionally important starch fractions. The researchers
purified starch from chickpeas and durum wheat and analysed in vitro digestibility
following the addition of porcine pancreatic α-amylase. Subsequently, LOS analysis
was applied to the digestibility curves in order to determine first order kinetic data
using a first-order equation (equation 1-1).
Equation 1-1. First order equation.
𝐶𝑡 = 𝐶∞ (1 − 𝑒−𝑘𝑡 )
(where Ct = concentration of product at given time (t), C∞ = concentration of product
at the end of the reaction and k = digestibility rate constant).
By fitting the LOS analysis to the experimentally-derived digestibility curves they
were able to demonstrate that amylolysis occurs in both single-phase and two-phases,
25
depending on the particle size. The authors concluded that C∞ and k, and LOS plots in
general, are valid predictors of the release of hydrolysed starch products arising from
amylolysis (Edwards et al., 2013). In a different study, researchers exploring the
mechanism of action of amylase enzymes were able to successfully label porcine
pancreatic α-amylase using two different dyes. Subsequently, they observed the
labelled α-amylase using a confocal laser scanning microscope of unhydrolysed and
hydrolysed starch. The results of the study demonstrate a preferential binding of the
enzyme to more susceptible parts of the granule, such as the hilum where there is less
organization, molecular order and greater overall porosity. As the enzyme was bound
to the granule, more binding sites were exposed, which led to further digestion of the
starch granules (Dhital, Warren, Zhang, and Gidley, 2014). A 2010 study compared
the effect of an in vitro digestion method to in vivo (pig) digestion. Comparisons were
made on the basis of changes in the morphology of isolated starch granules of in vivo
and in vitro digesta. The authors observed that the starch granules of the in vivo
digesta were almost completely hydrolysed in the upper part of the small intestine of
the pig. This, however, was not observed in the granules isolated from the in vitro
digesta. Moreover, they observed heterogeneity in the attack of enzymes on the
granules in the in vivo digesta, whereas changes in morphology of granules isolated
from the in vitro digesta appeared to be even across all granules, as shown in Figures
2-5 (a) and (b). The authors concluded that the conditions present during in vivo
digestion were not accurately produced using their in vitro protocol (Hasjim et al.,
2010).
26
Figure 2-5. Morphology of (a) raw maize starch granules isolated from in vivo digesta
and (b) starch granules isolated from in vitro digesta (Adapted from Hasjim et al.,
2010).
In a different study, researchers used an in vitro model to assess starch digestion
kinetics and particle size distributions. The authors concluded that in vitro starch
digestion followed first-order kinetics and that the size of starch granules affected the
rate of digestion, where smaller particle sizes allowed for more rapid digestion due to
increased surface area. Moreover, starch properties such as architecture, crystalline
pattern, degree of polymerisation, and the presence of surface pores or channels also
influence digestibility (Mahasukhonthachat, Sopade, and Gidley, 2010).
27
As mentioned in Section 2.1.2, starch is the primary fuel for the body. For
decades, the nutritional importance of this energy-providing carbohydrate has sparked
interest of nutritionists and food scientists that are exploring ways to reduce diet-
related diseases. Although a plethora of human studies have been conducted,
including the 1981 study that resulted in the coining of the term ‘glycemic index’
(Jenkins, Wolever, Taylor, Barker, Fielden, Baldwin, Bowling, Newman, Jenkins, and
Goff 1981), researchers employ in vitro methods to further our understanding of the
mechanics of starch digestion and factors influencing metabolic effects. Hasjim et al.
(2010) demonstrated that in vitro digestion of a pig diet containing raw normal maize
starch liberated nearly half of the starch as glucose following a 5 h incubation period
and 98% of the starch had broken down into glucose following 25 h of in vitro
digestion. A more recent study was carried out that exposed a variety of starches (sour
polvilho, sweet polvilho, tapioca, and cassava flour) to the aforementioned TIM-1
dynamic model. The purpose of the study was to determine a starch that allows for
slow glucose release, which may be considered ideal for consumption by patients
suffering from hepatic glycogen storage disease (GSD). The authors concluded that
sweet polvilho allowed for a 15% reduction in the rate of glucose release in
comparison to uncooked cornstarch, which has been a treatment option for GSD
patients since the 1980’s (Nalin, Koen, Weinstein, de Souza, Perry, van Wandelen,
van Rijn, Smit, Schwartz, and Derks, 2014).
Due to the processing of starch, the quality of carbohydrates is often reduced
and this is concomitant with a higher glycemic index. Subsequently, a study was
carried out to characterize starch fractions of foods as rapidly digestible starch (RDS),
28
slowly digestible starch (SDS), and resistant starch (RS) by measuring the amount of
glucose using a standardized in vitro technique. The researchers exposed spaghetti,
pearled barley, corn flakes and white bread to a two-stage in vitro digestion model.
Samples were taken after 20 min (RDS component) and 120 min (SDS component)
and were subsequently analysed for sugar concentrations using high-performance
liquid chromatography. Furthermore, the study included a clinical component through
the recruitment of eight volunteers. Participants were asked to consume four test foods
and finger-pick samples were taken at various times to measure plasma glucose. The
results demonstrated an inverse relationship between the amount of RAG measured in
the test foods and blood glucose levels. Corn flakes and white bread showed the
highest values of RAG and as a result elicited significantly higher in vivo glycaemic
responses. They concluded that RAG intake is a major determinant of the glycaemic
response of a food (Englyst, Englyst, Hudson, Cole, and Cummings, 1999). A recent
follow up to this study was done to determine the relationship between cornstarch
digestibility and glycemic response and subjective appetite in young men. The study
included starches with a wide range in RDS and RS, which were measured using the
Englyst method (Englyst et al., 1999). Whole-grain (10 g RDS), regular cornstarch
(13 g RDS), high-amylose starch (19 g RDS) and maltodextrin (41 g RDS) were
employed in the study. Subsequently, the starches were added to tomato soup and the
subjects were asked to fill out questionnaires to rate subjective appetite after
consumption of an ad libitum pizza meal that was offered 30 min and 120 min after
the test meals. Blood samples were also taken at various times throughout the study.
The results showed that the maltodextrin and whole-grain treatments led to the highest

29
and lowest blood glucose levels, respectively. Food intake, on the other hand, was
associated with higher levels of RS, which they believe is attributed by satiety signals
in the body. The authors concluded that the in vitro classification of starch
digestibility using the aforementioned Englyst method was able to predict the
glycemic response and food intake levels in the participants (Anderson, Cho,
Akhavan, Mollard, Luhovyy, and Finocchiaro, 2010). The unremitting research on
starch digestion has led to advances in in vitro digestion techniques and has generated
a greater understanding of the health implications associated with consumption of
foods high in digestible carbohydrates. However, much of the focus has been shifted
to understanding the biomechanics of the GIT and functional properties as related to
consumption of indigestible carbohydrates, or dietary fibre.
2.2. Dietary Fibre
2.2.1. Dietary fibre definition
Eben Hipsley was accredited for coining the term ‘dietary fibre’ in 1953, when he
observed that populations who consume fibre-rich foods also reported lower incidence
rates of pregnancy toxaemia (Brownlee, 2011; Hipsley, 1953). Hippocrates in 430 BC
described how coarse wheat promoted a laxative effect, which was not evident in
refined wheat, and in the early 1920’s, J.H. Kellogg related increased stool weight and
laxation to bran consumption, which sparked interest in dietary fibre research (Slavin,
2013). This notion of having a physiological benefit arise as a direct result of fibre
consumption remains to be the backbone of the current definition of dietary fibre.
30
There are various contortions and arguments surrounding the exact definition and
classification of fibre, depending on the scientific body. However, the 2009 meeting
of Codex agreed that dietary fibre is a carbohydrate with 10 or more monomeric units
(DP≥10), is of plant origin and escapes digestion in the human upper GIT (Codex,
2009; Institute of Medicine, 2008; EFSA, 2010; ANZFA, 2000; and Health Canada,
1985). In addition, Health Canada’s definition necessitates that it must deliver at least
one physiological benefit to the consumer. However, because the definition excludes
oligosaccharides (DP < 10), resistant starches (RS1, RS2, RS3 and RS4), and requires
that all dietary fibre must be of plant origin, it makes Health Canada’s definition very
restrictive (Jones, Lineback, and Levine, 2006). Accordingly, a proposal for a new
definition was put forth in 2010 that reads, “Dietary fibre consists of naturally
occurring edible carbohydrates (DP>2) of plant origin that are not digested and
absorbed by the small intestine and includes accepted novel dietary fibres” (Health
Canada, 2010). As discussed in Chapter 1, dietary fibre consumption in Canada falls
far below the recommended levels put forth by Health Canada. Therefore, accepting a
broader definition of dietary fibre will place fewer restrictions on the food industry
that is afforded the task of formulating foods with novel fibre ingredients. As a result,
this will also help consumers by increasing the availability and accessibility to fibre-
rich foods in today’s market, thereby delivering the proposed health benefits. Many
stakeholders, however, asked for more unambiguous explanations of what constitutes
a physiological effect, which is synonymous with Health Canada’s current definition
of dietary fibre. In response, the benefits include one of: improved laxation and
increased fecal bulk, reduced level of triglycerides and/or LDL cholesterol, reductions
31
in post-prandial plasma glucose and/or insulin levels and/or supply of energy-yielding
metabolites and short-chain fatty acids (SCFA’s) through colonic fermentation. A
product supplemented with a novel dietary fibre and without a prior history of food
use must therefore demonstrate both safety and an ensuing physiological benefit that
will arise from its subsequent consumption before it can be placed on the market
(Phillips, 2013).
2.2.2. Health benefits of dietary fibre
Despite the fact that the caloric value of dietary fibre is approximately 2
kcal/g, it remains a vital nutrient in our everyday diet due to its ability to promote
physiological benefits throughout the body. As mentioned in Section 2.2.1, dietary
fibre, according to the definition, has to exert at least one of the benefits that are listed
by Health Canada, but not all. Therefore, it is important to highlight that the resulting
physiological effect is dependent on the type of fibre consumed, that is, not all fibres
are alike (Slavin and Jacobs, 2010). Although they are all indigestible, structural
dissimilarities, such as number and type of monomeric units, types of linkages present
between monomers, and presence of branch points and charged groups along the
backbone (Tungland and Meyer, 2002) create heterogeneity in dietary fibre
functionality. Subsequently, water solubility may help to further distinguish and
classify fibre types. Water soluble fibres, such as gums and pectins, rely on their
ability to thicken when they come in contact with gastric and intestinal secretions and
the ensuing viscosity is related to health benefits along the upper GIT (Dikeman et al.,
2006). On the other hand, water insoluble fibres such as cellulose, hemicellulose and
32
lignin are not affected as they pass through the upper GIT and physiological
functionality is solely associated with colonic fermentation (Brownlee, 2011).
The human large intestine is heavily colonized with up to 1000 different
species of bacteria and can reach numbers of 1011
to 1012
anaerobic bacteria for every
gram of intestinal content (Roberfroid, Van Loo, and Gibson 1998). Colonic bacteria
are able to hydrolyze indigestible (insoluble) carbohydrates to produce gases
(hydrogen, carbon dioxide and methane) as well as SCFA’s (acetate, propionate and
butyrate). Increased levels of SCFA’s have been shown to be vital to the health of the
colonic epithelium (Topping and Clifton, 2001). In addition to stimulating colonic
fermentation, insoluble fibres increase fecal mass thereby having a stool bulking
effect as well. This increased weight reduces transit time in the large intestine and
may help prevent or relieve constipation (Slavin, 2013). Inulin, oligofructose, and
fructo-oligosaccharides demonstrate a prebiotic effect by increasing the level of
bifidobacteria at low levels of consumption. This was also demonstrated in studies
working with acacia gum and polydextrose, which have all led to increases in levels of
bifidobacteria (Jie, Bang-Yao, Ming-Jie, Hai-wei, Zu-kang, Ting-song, and Craig,
2000; Hengst, Ptok, Roessler, Fechner, and Jahreis, 2008). The results of a clinical
trial conducted on 40 female subjects showed that wheat dextrin supplementation for
fourteen days resulted in higher levels of bacteroides and depletion of pathogenic
bacteria (Slavin, 2013). Earlier studies have also shown that consumption of alginate,
chitosan and inulin all lead to reductions in harmful microfloral metabolties (Grasten,
Liukkonen, Chrevatidis, El-Nezami, Poutanen, and Mykkanen, 2003). In addition to
dietary fibre having a profound influence on the colonic microflora there are also
33
reports that consumption of fibre-rich foods may increase gastrointestinal immunity.
One of the roles of the colonic mucosa is to assess whether luminal contents contain
any toxic compounds and this is achieved through the gut-associated lymphoid tissue.
Samples of colonic digesta are taken up by M cells situated along the large intestinal
epithelium. Antigens present in the samples may then elicit an immune response via
the systemic immune system. Animal studies have shown that highly fermentable
fibres (fructooligosaccharides and gum Arabic) have led to increased T-cell mitogen
responses (Field, McBurney, Massimino, Hayek, and Sunvold, 1999), while other
studies have reported on the ability of insoluble fibres to protect the colonic mucus
barrier (Brownlee, 2011; Brownlee, Dettmar, Strugala and Pearson, 2006; Meguro,
Hase, Tokimitsu and Sakata, 2001). Although there are numerous reports on the
prebiotic and probiotic effects of dietary fibres, especially concerning infant nutrition,
the research surrounding the health benefits of insoluble fibres is ongoing. Similarly,
researchers are focusing on the events that take place in the upper GIT, in hopes of
better understanding and explaining the beneficial effects of soluble fibre
consumption.
Fermentability is a physicochemical property associated with insoluble dietary
fibres and some soluble fibres, such as guar gum and xanthan gum. In addition to this,
soluble fibres also have the ability to induce viscosity in the upper GIT, which is
linked to a variety of physiological responses. The degree of thickening is dependent
on the inherent properties of different polysaccharides, such as molecular weight
(MW), degree of polymerisation, chemical composition and overall structure, as well
as concentration in solution. For example, a study was done that investigated the
34
viscosity of solutions prepared using guar gum flours with different MW. The
researchers found that at 40 g/kg solution, viscosities ranged from 0 cP for the low
MW, 1,600 cP for the medium MW and 8,200 cP for the high MW flours (Roberts,
Smith, Low, Ellis, Morris, and Sambrook, 1989). This again highlights that not all
fibres are alike, and although soluble fibres may act similarly when exposed to the
environment inside the GIT, some may be more effective than others in mediating a
physiological response.
The confounding evidence of the physiological effects of soluble fibre
consumption has allowed the FDA to place a health claim on food products containing
soluble fibre, that reads “soluble fibre from foods such as (name of soluble fibre
source and/or name of food product), as part of a diet low in saturated fat and
cholesterol, may reduce the risk of heart disease” (FDA, 2013). Currently, Health
Canada has permitted two claims that are fibre-specific, “oat fibre helps reduce/lower
cholesterol, (which is) a risk factor for heart disease”, and ”psyllium fibre helps
reduce/lower cholesterol” (Health Canada, 2011). A recent meta-analysis on 22 cohort
studies concluded that foods rich in fibre, specifically from cereal or vegetable
sources, lead to substantial reductions in the risk of developing cardiovascular disease
(Threapleton, Greenwood, Evans, Cleghorn, Nykjaer, Woodhead, Cade, Gale, and
Burley, 2013). There is growing evidence to support the position that consumption of
foods rich in dietary fibre are useful in combating other major health problems and
their pre-determining risk factors, such as high cholesterol levels, obesity, certain
types of cancer, and T2D. The results of a human intervention trial demonstrated that
the addition of oat beta-glucan has a substantial effect on lowering plasma cholesterol.
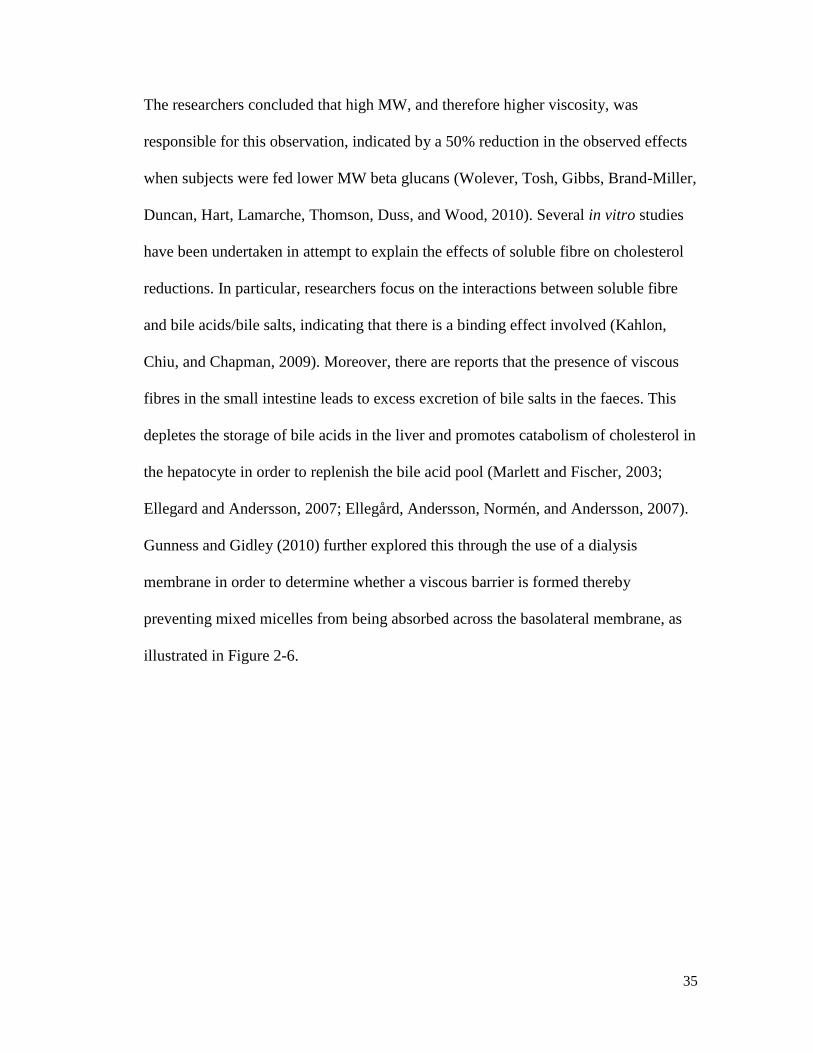
35
The researchers concluded that high MW, and therefore higher viscosity, was
responsible for this observation, indicated by a 50% reduction in the observed effects
when subjects were fed lower MW beta glucans (Wolever, Tosh, Gibbs, Brand-Miller,
Duncan, Hart, Lamarche, Thomson, Duss, and Wood, 2010). Several in vitro studies
have been undertaken in attempt to explain the effects of soluble fibre on cholesterol
reductions. In particular, researchers focus on the interactions between soluble fibre
and bile acids/bile salts, indicating that there is a binding effect involved (Kahlon,
Chiu, and Chapman, 2009). Moreover, there are reports that the presence of viscous
fibres in the small intestine leads to excess excretion of bile salts in the faeces. This
depletes the storage of bile acids in the liver and promotes catabolism of cholesterol in
the hepatocyte in order to replenish the bile acid pool (Marlett and Fischer, 2003;
Ellegard and Andersson, 2007; Ellegård, Andersson, Normén, and Andersson, 2007).
Gunness and Gidley (2010) further explored this through the use of a dialysis
membrane in order to determine whether a viscous barrier is formed thereby
preventing mixed micelles from being absorbed across the basolateral membrane, as
illustrated in Figure 2-6.
36
Figure 2-6. Diagram of the potential effect of viscous soluble dietary fibre (SDF) on
reducing micelle absorption (Adapted from Gunness and Gidley, 2010).
As a follow up to their study, they showed that inclusion of soluble dietary fibre,
namely barley beta-glucan and wheat arabinoxylan, led to delayed transport of bile
salts across a semi-permeable membrane, which they believe was attributed to by
increasing concentrations of fibre and therefore increasing viscosity (Gunness,
Flanagan, Shelat, Gilbert, and Gidley, 2012).
In addition to the effects on cholesterol lowering, fortification of foods with
soluble fibres has been shown to be an effective strategy in reducing both blood
pressure (Streppel, Arends, van ‘t Veer, Grobbee, and Geleinjse, 2005) and weight
loss to counteract the increase incidence in obesity (Brownlee, 2011). Recently, a
37
clinical trial was carried out where researchers fortified orange juice with high-
methoxyl, low-methoxyl, and low-methoxyl amidated pectin. They observed that
following simulated digestion (Fabek, 2011) there were substantial reductions in
viscosity of all solutions. Subsequently, this affected the satiety response in human
subjects wherein the low-methoxyl pectin was the only treatment that resulted in
elevated feelings of satiety (Logan, Wright, and Goff, 2015). Investigators of a seven
day randomised crossover trial of 68 participants indicated that beverages fortified
with 1.5 g sodium alginate led to significant reductions in daily energy intake in
comparison to the control. They attributed their findings to alginate-induced gelation
inside the stomach, which therefore reduced gastric emptying rates (Paxman,
Richardson, Dettmar, and Corfe, 2008). On the other hand, researchers using echo-
planar magnetic resonance imaging have demonstrated that nutrient composition is
more important in slowing gastric emptying than viscosity. In their four-way
crossover design, which consisted of low-viscosity nutrient control, high-viscosity
nutrient control, low-viscosity nutrient and high-viscosity nutrient meals, they found
that not only was gastric emptying inversely related to viscosity, but the presence of
nutrients led to the greatest reductions in subsequent rates that were observed
(Marciani, Gowland, Spiller, Manoj, Moore, Young et al., 2001). Moreover, the
researchers, in conjunction with their earlier work (Marciani, et al., 2000), observed
that intragastric secretions intensified when there was greater viscosity and nutrient
composition in the body of the stomach. They hypothesize that the stomach works
harder to dilute the viscosity and that greater distension of the stomach may also be a
precursor to the rate of gastric secretions. Although the effect of fibre on satiety
38
remains a contentious topic, researchers have demonstrated that soluble fibres are
more effective in reducing appetite between meals in comparison to other dietary
interventions, including high-fat diets (Slavin and Green, 2007; Halton and Hu, 2004).
Dietary fibre intake has also been associated with reductions in postprandial glycemia
(Jenkins et al., 1987), making it a staple ingredient in the management of T2D.
Results of both animal and human studies conducted over the past couple of
decades have highlighted that diets high in soluble fibre improve overall glucose and
glycated protein levels in the blood and lead to increased insulin sensitivity, which are
all biomarkers for glycemic control (Kendall et al., 2010; Brennan, 2005; Schulze and
Hu, 2005; Behall, Scholfield, and Hallfrisch, 2005; Brennan and Cleary, 2005; Judd
and Ellis, 2005; Gallaher and Schaubert, 1990). These findings are further supported
through a recent meta-analysis that looked at the effects of high fibre diets vs. low
fibre diets on biomarkers for glycemia (Anderson et al., 2004). Despite evidence
suggesting that soluble fibre consumption reduces postprandial plasma glucose levels
by way of the viscosity impacting rates of gastric emptying, many studies have shown
that the effects inside the small intestine are more prominent. Edwards et al., (1987)
measured gastric emptying in human volunteers by monitoring changes in
radioactivity of a sulfur colloid that was consumed along with 50 g glucose test drinks
with and without added fibre (2.5 g of 1% locust bean gum, xanthan gum, or a
combination of both). The results indicated that in the control group 28% of the drink
had emptied into the stomach after 30 min and this value was reduced to 11% for the
locust bean gum/xanthan gum mixture. Interestingly, no difference was observed
among individual gums and the control, yet all treatments were able to improve the
39
glucose response in comparison to the control. The authors thereby concluded that
effects on gastric emptying alone may not be responsible for the modulating effects of
soluble fibres on the glycemic response in vivo. An earlier study resulted in a similar
finding, wherein different doses of guar gum (2.5 g or 14.5 g) were added to glucose
test drinks. Gastric emptying was measured in a similar fashion, using changes in
radioactivity, followed by 60 min postprandial glucose measurements. The authors
concluded that neither dose of guar gum led to changes in gastric emptying, yet both
doses were able to significantly reduce the levels of plasma glucose that were
measured in comparison to the control (Jarjis, Blackburn, Redfern, and Read, 1984).
More commonly, in vitro experiments are employed to analyse fibre
functionality in the GIT, due to the aforementioned costs and ethical considerations of
in vivo work. As was shown in Section 2.1.2, starch digestion and carbohydrate
metabolism are complex processes, making it difficult for researchers to determine
how viscosity is able to modulate the glycaemic response using simulated models.
Nonetheless, a commonly employed technique is using dialysis tubing to mimic
glucose mobility across a semi-permeable membrane. Sasaki and Kohyama (2011)
demonstrated that formulation of rice starch gels with non-starch polysaccharides
(NSPs), agar, xanthan gum and konjac glucomannan, leads to reduced starch
digestibility. The authors demonstrated that not only did gel rigidity increase but they
hypothesize there is an interaction between the starch and the gums and that the
addition of NSP’s leads to greater viscosity, which altogether may contribute to the
reductions in digestibility that they observed. In a more recent study, researchers
explored the effects that adding xanthan gum, guar gum, konjac glucomannan, and
40
pectin would have on glucose diffusion. Their results indicated that all gums were
able to promote viscosity in solution. Moreover, an inverse relationship between
viscosity and glucose diffusivity was established, whereby greater concentrations of
NSPs led to more pronounced suppressive effects on diffusion, with xanthan gum
being the most effective at the same concentration (Sasaki and Kohyama, 2012).
Clinical evidence of soluble fibre functionality exists, demonstrating that formulation
of foods and drinks with beta-glucan leads to reductions in glycemic responses in
humans (Juvonen, Purhonen, Salmenkallio-Marttila, Lähteenmäki, Laaksonen,
Herzig, Uusitupa, Poutanen, and Karhunen, 2009; Panahi, Ezatagha, Temelli,
Vasanthan, and Vuksan, 2007; Brennan and Cleary, 2005; Jenkins et al., 2002).
Subsequently, a study was carried out that examined whether solutions and gels
formulated with low-MW and high-MW oat beta-glucan have any effects on lowering
glucose mobility, in vitro, and reducing glycemic responses, in vivo. The in vitro
results showed that all beta-glucan gels released significantly less glucose in
comparison to the beta-glucan solutions. The researchers attributed their findings to
the gels physically trapping the glucose within the food matrix, therefore leading to
reductions in the amount of glucose permeating through the dialysis membrane.
Interestingly, the in vivo results did not demonstrate the same trend. Fifteen
participants received test meals, which were either liquid solutions or viscoelastic
gels, each containing either low-MW or high-MW oat beta-glucan. The high-MW
solutions elicited the lowest glycemic response; however, the gels did not differ from
the control. The authors explained their findings by looking at the rheological
properties of each treatment. Analyses of the storage modulus (G’) and loss modulus

41
(G”) and frequency dependence tests showed that the oat beta-glucan drinks may be
abundant in polymer chain entanglements. On the other hand, the gels were more
abundant in hydrogen bonds, which could have been disrupted through chewing and
mechanical mixing, and the openness of the gel networks resulted in an inability to
attenuate the glucose response. A measureable viscous component (G”) seems to be
vital to the functionality of oat beta-glucan and polymer chain entanglements appear
to be necessary for reducing glucose diffusion. In addition, the researchers of this
study speculate that physiological functionality of oat beta-glucan is not only due to
viscosity being able to lower diffusion of molecules, but may also be a result of
impairment of mixing with digestive enzymes and reduced gastric emptying (Kwong,
Wolever, Brummer, and Tosh, 2013). Other studies suggest that soluble dietary fibre
acts like a sponge, forming an entangled network with the food through enhanced
water absorption, which thereby acts to slow the rate of starch digestion by impairing
both enzyme transport to its substrate (Gidley, 2013) and sugar absorption across the
intestinal epithelium (Singh, Dartois, and Kaur, 2010; Wursch and Pi-Sunyer, 1997).
To further complicate our understanding concerning the functionality of soluble fibre,
it has also been suggested that an enhancement of the ileal brake may be involved.
This would act to reduce gastric emptying and acid secretion, small intestinal transit,
pancreatic enzyme secretion and bile acid secretion, which altogether may play a role
in some of the proposed health benefits that arise from fibre consumption (Kristensen
and Jensen, 2011; Maljaars, Peters, and Masclee, 2007). Nonetheless, it is evidenced
in literature that using in vitro methods is a vital tool in allowing researchers to assess

42
the physiological functionality of soluble dietary fibres in order to gain a clearer
understanding of structure-function relationships.
Despite emerging evidence that soluble fibre intake is related to reduced
postprandial glycemic levels, functional dissimilarities are a result of structural
diversity present among different fibres. Viscosity results from physical
entanglements of polysaccharide chains (Dikeman and Fahey, 2006). Therefore,
chemical composition, overall structure (linear versus branched), MW, as was shown
with oat beta-glucan, and degree of polymerisation (DP) all play a role in the ability of
fibres to induce viscosity in solution. As an extension, these structural differences
have a bearing on their ability to exert physiological functionality when consumed as
a food ingredient.
2.3. Soluble fibres employed in the study
2.3.1. Guar Gum
Guar gum belongs to the family of reserve carbohydrates known as
galactomannans, which are storage polysaccharides found in the cell wall of various
albuminous and endospermic seeds. One of the most widely used seeds comes from
the guar plant (Cyamopsis tetragonoloba). The plant is bush-like growing up to 90 cm
tall and is drought resistant, allowing it to thrive in arid and semi-arid zones. It has
been grown for centuries in India and Pakistan where it is widely used as a food
source for humans and animals. However, due to the increased demand of guar
production, programmes have been established in other parts of the world, including
Australia, Colombia, Argentina and some parts of North America, such as Texas,
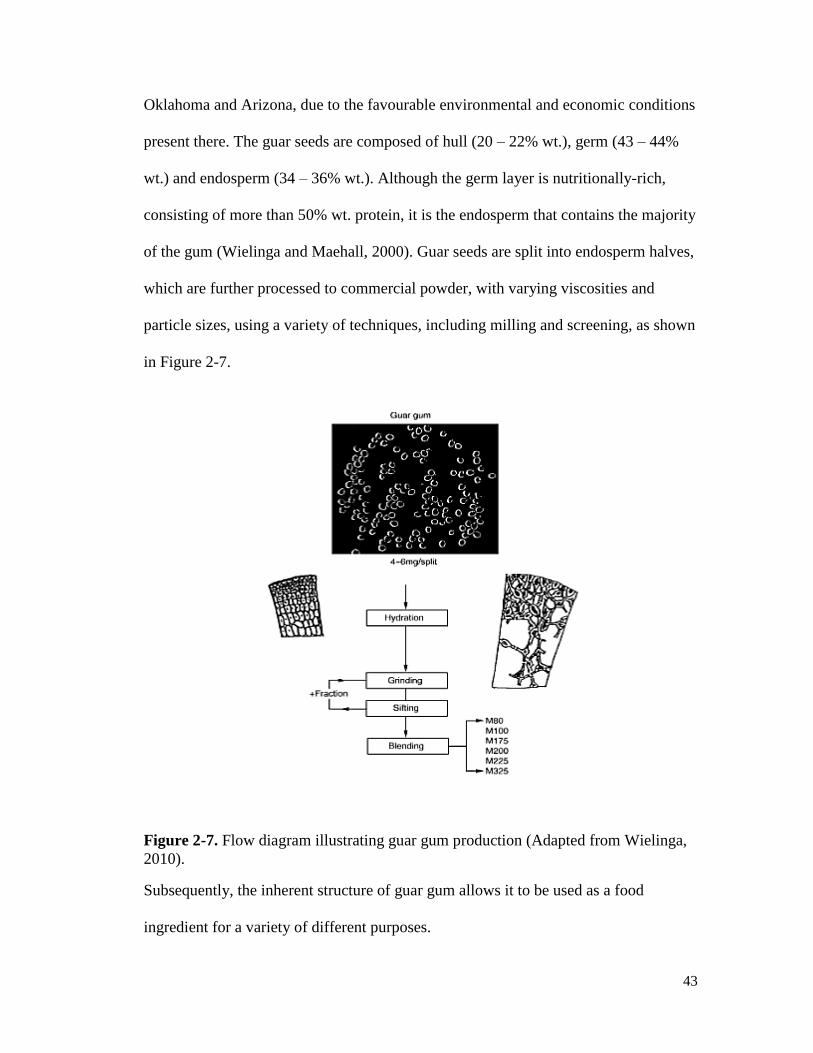
43
Oklahoma and Arizona, due to the favourable environmental and economic conditions
present there. The guar seeds are composed of hull (20 – 22% wt.), germ (43 – 44%
wt.) and endosperm (34 – 36% wt.). Although the germ layer is nutritionally-rich,
consisting of more than 50% wt. protein, it is the endosperm that contains the majority
of the gum (Wielinga and Maehall, 2000). Guar seeds are split into endosperm halves,
which are further processed to commercial powder, with varying viscosities and
particle sizes, using a variety of techniques, including milling and screening, as shown
in Figure 2-7.
Figure 2-7. Flow diagram illustrating guar gum production (Adapted from Wielinga,
2010).
Subsequently, the inherent structure of guar gum allows it to be used as a food
ingredient for a variety of different purposes.

44
Guar gum consists of a linear 1, 4 linked-β-D-mannan backbone, as do all
galactomannans; however the differentiating factor among the galactomannans is the
degree of substitution along the mannose backbone. Guar gum, unlike locust bean
gum and tara gum, has a 1, 6 α-linked galactose side chain at every other mannose
unit (Kulicke, Eidam, Kath, Kix, and Kull, 1996), as shown in Figure 2-8. However,
as many as 5 unsubstituted regions may be found along the backbone (Wielinga and
Maehall, 2000).
Figure 2-8. Chemical structure of the galactomannan backbone (Adapted from
Wielinga, 2010).
The molecular weight of guar gum ranges between 50,000 to 8,000,000 Da
(Kawamura, 2008) and DP is 300 – 50,000 hexoses. With increasing concentrations in
solution there is an increase in viscosity and rheological flow behaviour displays
solutions that behave as non-Newtonian, pseudoplastic fluids. One of the main
functional properties of guar gum is linked to the ability to promote viscosity in
45
solution, due to the interactions between polymer chains. However, this also acts to
limit potential uses for guar gum in foods. Typically, the food industry incorporates
guar gum at a concentration of ≤1% to facilitate gelling, emulsifying, thickening and
prevent creaming, syneresis and retrogradation of starch. It is used in foods such as ice
creams and other dairy products such as puddings, soft drinks, baby foods and pet
foods (Wielinga, 2010). Because measurably high viscosity, achieved at
concentrations greater than 1%, affects textural and organoleptic properties of foods,
partially hydrolysed guar gum is often used to circumvent such undesirable
characteristics (Roberts, 2011). However, this may impact the multi-functional
behaviour of guar gum as it has been shown to also promote physiological
functionality upon consumption through increasing digesta viscosity.
An earlier study was conducted to analyze the effect that three viscous
hydrocolloids, guar gum, pectin, and carboxymethylcellulose, would have on
postprandial glycemia in humans. The results indicated that despite comparable initial
viscosities, guar gum showed greater resistance to in vitro digestion and also led to
more pronounced reductions in plasma glucose levels, as measured in vivo (Brenelli,
Campos, and Saad, 1997). Gularte and Rossell (2011) reported that blending of guar
gum with potato starch led to pronounced reductions in the amount of starch that was
hydrolysed over a 3 h simulated digestion period. They attribute their findings to the
potential physical barrier that could act to hinder α-amylase access to the substrate.
Similar results were obtained from a study that examined predicted glycemic index
(PGI) values of cereal foods through soluble fibre supplementation. The findings
indicate that adding guar gum at levels of 2.5% and 5% reduced the PGI values by 4
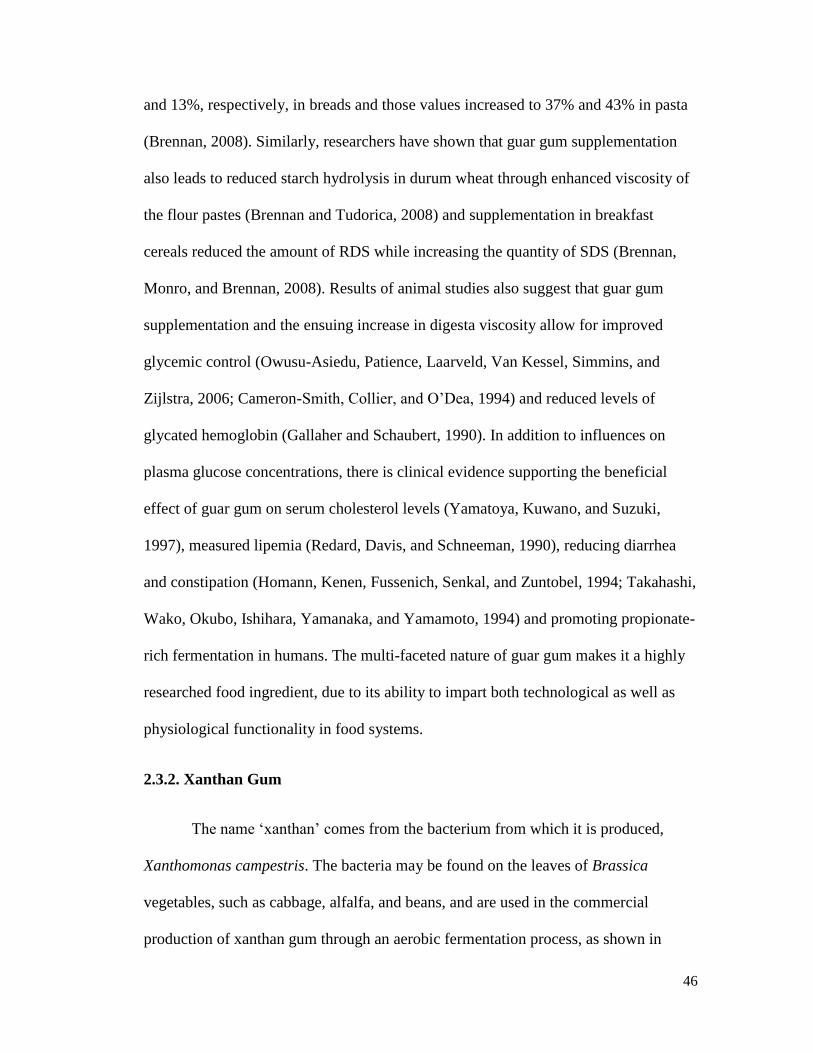
46
and 13%, respectively, in breads and those values increased to 37% and 43% in pasta
(Brennan, 2008). Similarly, researchers have shown that guar gum supplementation
also leads to reduced starch hydrolysis in durum wheat through enhanced viscosity of
the flour pastes (Brennan and Tudorica, 2008) and supplementation in breakfast
cereals reduced the amount of RDS while increasing the quantity of SDS (Brennan,
Monro, and Brennan, 2008). Results of animal studies also suggest that guar gum
supplementation and the ensuing increase in digesta viscosity allow for improved
glycemic control (Owusu-Asiedu, Patience, Laarveld, Van Kessel, Simmins, and
Zijlstra, 2006; Cameron-Smith, Collier, and O’Dea, 1994) and reduced levels of
glycated hemoglobin (Gallaher and Schaubert, 1990). In addition to influences on
plasma glucose concentrations, there is clinical evidence supporting the beneficial
effect of guar gum on serum cholesterol levels (Yamatoya, Kuwano, and Suzuki,
1997), measured lipemia (Redard, Davis, and Schneeman, 1990), reducing diarrhea
and constipation (Homann, Kenen, Fussenich, Senkal, and Zuntobel, 1994; Takahashi,
Wako, Okubo, Ishihara, Yamanaka, and Yamamoto, 1994) and promoting propionate-
rich fermentation in humans. The multi-faceted nature of guar gum makes it a highly
researched food ingredient, due to its ability to impart both technological as well as
physiological functionality in food systems.
2.3.2. Xanthan Gum
The name ‘xanthan’ comes from the bacterium from which it is produced,
Xanthomonas campestris. The bacteria may be found on the leaves of Brassica
vegetables, such as cabbage, alfalfa, and beans, and are used in the commercial
production of xanthan gum through an aerobic fermentation process, as shown in
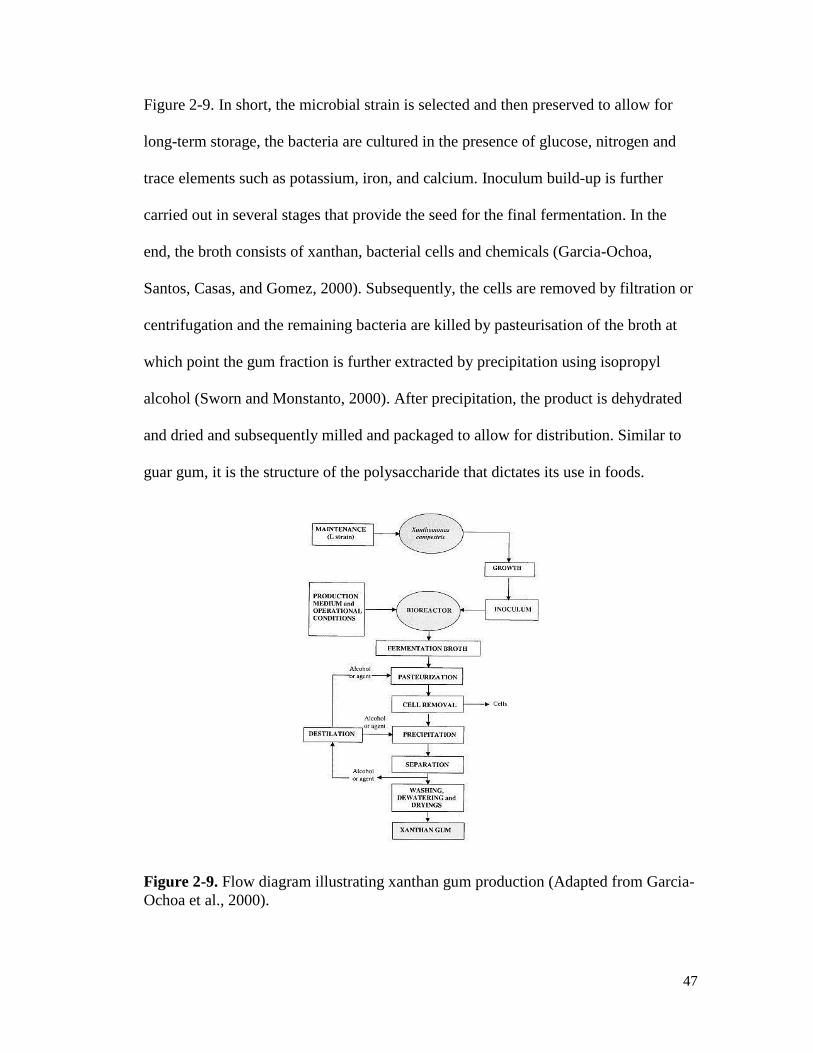
47
Figure 2-9. In short, the microbial strain is selected and then preserved to allow for
long-term storage, the bacteria are cultured in the presence of glucose, nitrogen and
trace elements such as potassium, iron, and calcium. Inoculum build-up is further
carried out in several stages that provide the seed for the final fermentation. In the
end, the broth consists of xanthan, bacterial cells and chemicals (Garcia-Ochoa,
Santos, Casas, and Gomez, 2000). Subsequently, the cells are removed by filtration or
centrifugation and the remaining bacteria are killed by pasteurisation of the broth at
which point the gum fraction is further extracted by precipitation using isopropyl
alcohol (Sworn and Monstanto, 2000). After precipitation, the product is dehydrated
and dried and subsequently milled and packaged to allow for distribution. Similar to
guar gum, it is the structure of the polysaccharide that dictates its use in foods.
Figure 2-9. Flow diagram illustrating xanthan gum production (Adapted from Garcia-
Ochoa et al., 2000).
48
Xanthan gum is a heteropolysaccharide consisting of a linear 1,4 – linked β-D-
glucose backbone with a trisaccharide side chain, containing D-glucuronic acid units,
linked at the O-3 position of every other glucose unit, as illustrated in Figure 2-10.
Figure 2-10. Structure of xanthan gum (Adapted from Garcia-Ochoa et al., 2000).
The molecular weight ranges from 2x10⁶ Da to 2x10
7 Da, depending on the
fermentation conditions used in the production process (Garcia-Ochoa et al., 2000). It
is an anionic polysaccharide due to the presence of acetic and pyruvic acids. The
trisaccharide branches align with the main backbone inducing a stiff single, double, or
triple helix (Cairns, Miles, and Morris, 1986; Rinaudo and Milas, 1982; Milas and
Rinaudo, 1979) and this helical formation has been shown to provide a protective
barrier towards pH extremes and accessibility to hydrolytic enzymes (Sworn and
Monsanto, 2000). Moreover, the ordered helical conformation allows for synergistic
interactions with other gums, such as galactomannans, allowing for gel formation and
greater solution viscosities to be attained (Renou, Petibon, Malhiac, and Grisel, 2013).
Xanthan gum solutions have non-Newtonian rheology, wherein the apparent viscosity
49
decreases with increasing shear rates. Despite both shear-thinning and recovery being
instantaneous (Kang and Pettit, 1993), an initial yield stress is required in order for
xanthan gum solutions to flow, providing storage and transportation stability for
emulsions prepared with xanthan gum. These unique properties and characteristics
make xanthan gum a popular ingredient used by the food industry, where it may act as
a thickener, dispersant, and stabilizer in dairy products, baked goods, frozen foods,
beverages and salad dressings. In addition to this, results of several studies have
suggested that xanthan gum is able to promote physiological functionality by acting as
a source of dietary fibre.
A recent study explored the effects that different hydrocolloids, including
xanthan gum, have on starch digestibility. The results demonstrated that although
some of the hydrocolloids increase the RDS fraction of the starch, xanthan gum was
able to decrease C∞, which in this study was used as the equilibrium concentration of
hydrolyzed starch, therefore indicating that adding xanthan gum decreased the
maximum hydrolysis of starch (Gularte et al., 2011). In a similar study, researchers
explored how adding non-starch polysaccharides would affect in vitro digestibility of
starch suspensions. Their results indicated that xanthan gum had the most pronounced
effect on suppressing starch digestion in comparison to the other gums used in the
study. They attributed their findings to not only the increase in digesta viscosity but
also a potential interaction that could exist between xanthan and starch, which would
encapsulate the starch granule creating a barrier to hydrolytic enzymes. However, they
indicated that this needs to be explored further (Sasaki and Kohyama, 2012). The
effect on starch digestion was also observed in an earlier study that showed reduced
50
hydrolysis of starch through supplementation of xanthan gum in pasta (Brennan et al.,
2008). Moreover, consumption of viscous gums such as xanthan has been associated
with reductions in plasma cholesterol (Dikeman et al., 2006) and increases in satiety
(Sworn, 2010). Although widely used in the food industry, more remains to be
elucidated regarding the physiological functionality of xanthan gum.
2.3.3. Flaxseed Gum
Flaxseed (Linum usitatissimum L.) was first introduced in North America as a
fibre crop, however over time it has become of great importance as a source of oil to
consumers and food manufacturers (Cunnane and Thompson, 1995). Canadian
production accounts for more than 17% of the global production of flaxseed (Statistics
Canada, 2012) and is considered to be the richest plant source of α-linolenic acid in
the North American diet (Morris, 2001). Although flax contains nearly 45% oil, which
is found in the endosperm, it is also comprised of soluble flaxseed gum, which can be
isolated from mucilage found inside the hull (Cui and Mazza, 1996). In addition, the
kernel of flaxseed has been shown to contain nearly 20% dietary fibre, the structure of
which was recently elucidated through the use of high performance anion exchange
chromatography. It is mainly comprised of glucose, xylose, galactose, and arabinose
and the molecular weight was shown to range from 486 kDa to 1660 kDa (Ding, Cui,
Goff, Wang, Chen, and Han, 2014).
Soluble (mucilage) flaxseed gum is reported to be comprised of neutral and
acidic fractions, and ion-exchange chromatography reveals a high molecular weight
arabinoxylan for the neutral fraction and a low molecular weight pectin-like
51
rhamnogalacturonan for the acidic fraction (Cui et al., 1994). Their structures dictate
their rheological properties in solution. It is reported that the different fractions behave
as Newtonian fluids at low concentrations and that pseudoplasticity is not observed
until the concentration exceeds 0.2%. However, for acidic fractions Newtonian
behaviour has been reported for concentrations of up to 2%, and has been observed to
be substantially less viscous than the neutral fraction (Mazza and Biliaderis, 1989).
Viscosities reported for flaxseed mucilage gum (Qian, Cui, Wu, and Goff, 2012) and
flaxseed kernel gum (Ding et al., 2014) are substantially lower than other
commercially available gums, such as guar gum and xanthan gum (Fabek, 2011).
These rheological properties allow for functionality in food systems where they are
added as thickeners, emulsifiers, stabilisers, and fat replacers without having adverse
effects on organoleptic properties.
Furthermore, studies have shown that inherently low GI values allow flaxseed
to be used in value-added foods such as salad dressings, pasta, muffins and dairy
products (Hall, Tulbek, and Xu, 2006; Lee, Manthey, and Hall, 2003). Soluble
flaxseed gum has also been associated with increased bile-acid binding (Fodje, Chang,
and Leterme, 2009) and has been shown to reduce plasma glucose and cholesterol
concentrations in human trials (Thakur, Mitra, Pal, and Rousseau, 2009). Moreover,
animal studies have demonstrated that flaxseed gum exerts a prebiotic effect through
the production of acetate and propionate (Fodje et al., 2009) and stimulation of the
growth of lactobacilli (Alzueta, Rodriguez, Cutuli, Rebole, Ortiz, Centeno, and
Trevino, 2003). Despite unremitting research efforts to elucidate the structure of
52
soluble flaxseed gum, more remains to be discovered of its potential physiological
effects and subsequent behaviour along the GIT.
2.3.4. Soy soluble polysaccharide
Soybean soluble polysaccharide (SSPS) is a water-soluble by-product that is
obtained during production of tofu (soybean curd), soy milk, and soy protein isolate
(Chivero, Gohtani, Ikeda, and Nakamura, 2014). Okara is an insoluble residue that is
produced from protein extraction and it is this insoluble fraction that leads to the
production of SSPS. In short, the material is autoclaved in weak acidic conditions,
followed by processes of refining, pasteurising and spray-drying to produce a white
powder. SSPS powders have been in the market since the early 1990’s when Fuji Oil
marketed the product as SOYAFIBE-S. Its structure allows for comparably low
viscosity and stability in aqueous solutions (Maeda, 2000).
SSPS consists of a rhamnogalacturonan and homogalacturonan backbone with
branched β-1,4-galactan and α-1,3- or α-1,5 side chains, along with monosaccharide
constituents, fructose, xylose, and glucose embedded along the main backbone
(Nakamura, Furuta, Maeda, Takao, and Nagamatsu, 2002), as illustrated in Figure 2-
11.
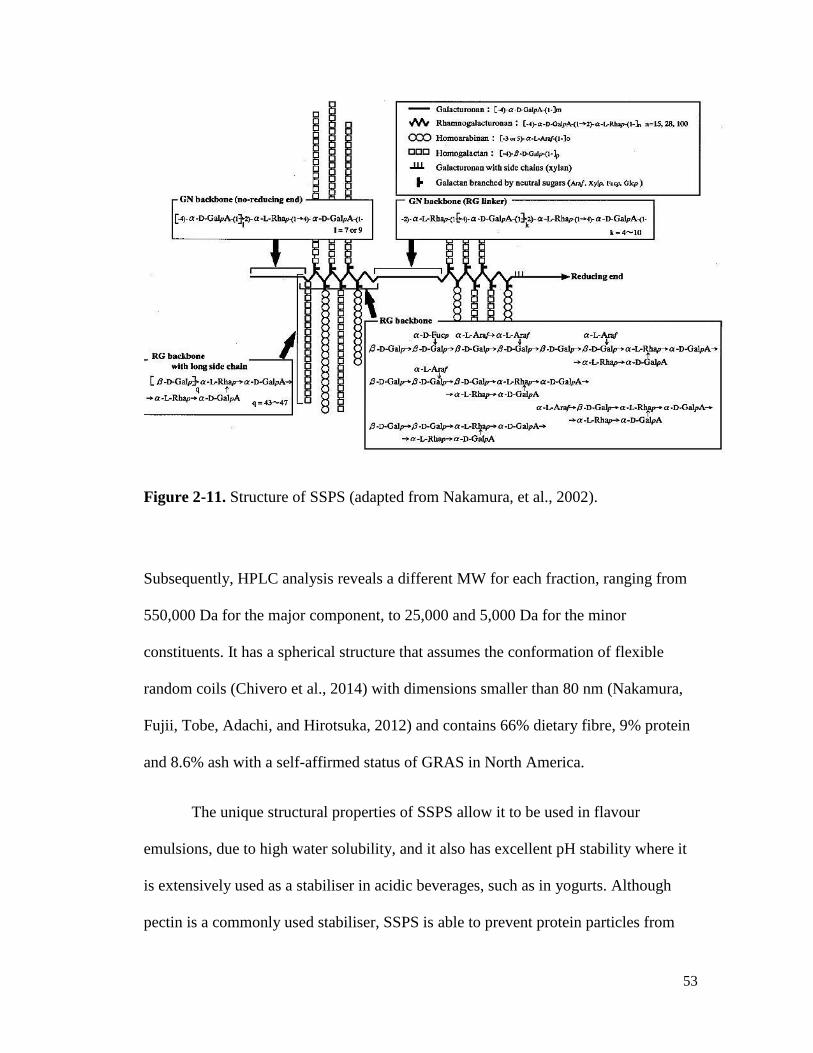
53
Figure 2-11. Structure of SSPS (adapted from Nakamura, et al., 2002).
Subsequently, HPLC analysis reveals a different MW for each fraction, ranging from
550,000 Da for the major component, to 25,000 and 5,000 Da for the minor
constituents. It has a spherical structure that assumes the conformation of flexible
random coils (Chivero et al., 2014) with dimensions smaller than 80 nm (Nakamura,
Fujii, Tobe, Adachi, and Hirotsuka, 2012) and contains 66% dietary fibre, 9% protein
and 8.6% ash with a self-affirmed status of GRAS in North America.
The unique structural properties of SSPS allow it to be used in flavour
emulsions, due to high water solubility, and it also has excellent pH stability where it
is extensively used as a stabiliser in acidic beverages, such as in yogurts. Although
pectin is a commonly used stabiliser, SSPS is able to prevent protein particles from
54
coagulating and precipitating out of solution without raising the viscosity of the
product thereby maintaining desirable product characteristics. Moreover, it is able to
form strong interfacial films (Furuta and Maeda, 1999), prevent oxidation of oils, and
has excellent thermal stability and emulsifying properties, permitting it to be used in
foods such as ice cream, dairy products, baked goods and dressings (Nakamura,
Yoshida, Maeda, and Corredig, 2006). Furthermore, its reported high fibre content is
spurring research interests in exploring potential physiological functionality
surrounding SSPS consumption.
Studies have shown that consumption of soy fibre leads to a stool bulking and
laxation effect due to colonic fermentation (Schneeman, 1998; Wrick, Robertson, Van
Soest, Lewis, Rivers, Roe, and Hackler, 1983). A much earlier diet-controlled study
demonstrated that supplementing 25 g/d with SSPS led to significant improvements in
glucose tolerance as well as increased fecal wet weight and water content. Moreover,
supplementation with SSPS led to improved nutrient balance through increasing
amounts of protein, calcium, iron and other minerals in the diet (Tsai, Mott, Owen,
Bennick, Lo, and Steinke, 1983). In a separate clinical trial, SSPS consumption led to
significant reductions in the duration of liquid stool excretion in infants suffering from
diarrhea (Brown, Perez, Peerson, Fadel, Brunsgaard, Ostrom, and MacLean, 1993).
Although SSPS consists primarily of dietary fibre, very little is known about the
functionality of SSPS in the human GIT. A recent study showed that addition of 6%
SSPS and 0.7% flaxseed gum, allowing for equal solution viscosities, to 50 g glucose
solutions had no effect on measured postprandial glucose and insulin levels in humans
(Au, Goff, Kisch, Coulson, and Wright, 2013).. However, differences in glucose AUC

55
were reported when the fibres were added to dairy beverages and puddings, with no
differences observed between the dairy product types. They concluded that product
viscosity was responsible for mediating a physiological response, not the
concentration in solution. Moreover, they suggest that despite there being a
relationship between viscosity and glucose attenuations, the fibre polymers are subject
to structural changes when passing through the GIT. Subsequently, the viscosity
measured in solution may not be indicative of the physiological viscosity in the small
intestine (Au et al., 2013). This raises a critical question surrounding the functionality
of soluble fibres, whether they may are extensively studied, such as guar gum and
xanthan gum, or understood to a lesser degree such as SSPS and flaxseed gum.
2.3.5. Summary Comment
Viscosity is a physicochemical property that is intrinsic to all soluble fibres
(Dikeman, Murphy, and Fahey Jr., 2006). There is extensive information present in
the literature that supports the claim that viscous soluble fibres are able to modulate
the glycemic response in humans. However, the GIT is exceedingly complex and for
that reason the mechanistic action remains to be elucidated. In order to fully
understand how dietary fibres are able to promote physiological functionality, it is
vital to look at and understand how food is metabolised by employing a variety of
analytical techniques, including the aforementioned in vitro digestion method.

56
3. The effect of in vitro digestive processes on the viscosity of
dietary fibres and their influence on glucose diffusion
Hrvoje Fabeka, Stefanie Messerschmidt
a, Valentin Brulport
a, H. Douglas Goff
a,*
a Department of Food Science University of Guelph, Guelph, Ontario N1G 2W1,
Canada
Parts of this chapter were published in 2014: Food Hydrocolloids, 35, 718-726.
Abstract
The consumption of soluble dietary fibres is associated with a variety of physiological
responses, one of which is their ability to modulate postprandial glycemic response
due to increasing digesta viscosity. The effects that the different digestive processes in
the stomach and small intestine have on the thickening ability of six soluble fibres
were investigated in this study. Moreover, the ability of these fibres to resist loss of
viscosity following two-stage in vitro digestion, simulating gastric and small intestinal
phases, was analyzed. In a second set of experiments, protein and starch were
included to simulate a food model, which allowed for glucose release. The second
stage was carried out inside a dialysis system. The primary determinant of starch
digestibility was the concentration of glucose in the dialysate over a 3 h period.
Irrespective of the concentration level or simulated condition, xanthan gum (XG)
retained viscosity more than all other fibre types (p<0.05). XG reduced glucose
concentrations in the dialysate in comparison to the control and the others fibres
employed in this study (p<0.05). The ability of XG to attenuate glucose mobility
means that it may be a target for future studies, both in vitro and in vivo, which seek to
57
analyze food ingredients as aids in effectively mediating the postprandial glycaemic
response in humans.
3.1.Introduction
In recent years, dietary fibre has received a great deal of attention from
researchers, the food industry, and consumers, due to the health benefits that are
associated with the consumption of fibre-rich foods (Brighenti, Pellegrini, Casiraghi,
& Testolin, 1995). Beneficial effects include lowering blood lipid levels, specifically
triglycerides and low-density lipoprotein cholesterol, reduction in risk of
cardiovascular disease, increases in satiety and consequent decreases in obesity trends,
enhanced gastrointestinal immunity and overall colonic health, and decreases in blood
glucose levels (Jenkins, Leeds, Gassull, Cochet, & Alberti, 1977; Jenkins, Kendall,
Axelsen, Augustin, & Vuksan, 2000; Gunness & Gidley, 2010; Brownlee, 2011).
However, despite the numerous studies and growing consumer awareness surrounding
the health benefits of dietary fibre consumption, average intake levels still fall far
below recommended levels (Health Canada, 2010). Selecting fibre for food
fortification may therefore be a fundamental strategy for the food industry.
Fibre molecules possess distinctive physicochemical characteristics that dictate
their uses in foods, and are categorized as being soluble or insoluble (Dikeman &
Fahey, 2006). The inherent solubility is what determines their fate as they pass
through the gastrointestinal tract (GIT). For insoluble fibres (e.g., cellulose, wheat
bran), it is their ability to ferment that allows them to act as functional foods. On the
other hand, soluble fibres (e.g., gums, pectins) rely on their ability to thicken into
58
swollen hydrated networks and their ensuing viscosity that dictates their potential to
exert biological effects along the GIT, specifically through the stomach and small
intestine (Schneeman, 2001; Brownlee, 2011). Dikeman, Murphy, & Fahey Jr. (2006)
showed that soluble fibres, such as guar gum and psyllium, promote relatively high
viscosities in comparison to insoluble fibres such as cellulose, rice bran, and wheat
bran. Consequently, they proposed that because of this relationship, soluble fibres
may have an effect on postprandial blood glucose concentrations. Accordingly,
hydrocolloids can act as soluble dietary fibre. Their uses may extend beyond the
technological functionalities they currently promote in foods, (e.g., gelation, product
consistency, colloidal stability, texture, and viscosity) if they have the potential to
deliver a health benefit to the consumer without having negative impacts on
organoleptic properties.
There are several proposed mechanisms by which viscosity may elicit
physiological responses such as attenuation in postprandial glycaemia. These include
increases in luminal bulk, changes in neurohumoral mediation, and impairing nutrient
diffusion across the unstirred boundary layer of the mucosal membrane (Chawla &
Patil, 2010). Starch digestion and subsequent glucose absorption occur mainly in the
small intestine (Hasjim, Lavau, Gidley, & Gilbert, 2010). In the lumen, starch is
hydrolyzed by α-amylase, secreted from the pancreas. The resulting oligosaccharides
and maltose are then further hydrolyzed by brush border enzymes (Tharakan, Norton,
Fryer & Bakalis, 2010), leading to glucose transport through the basolateral
membrane into the blood (Guyton & Hall, 2010). Therefore, an increase in digesta
viscosity that arises from soluble fibre consumption may influence one or more events
59
that occur during starch metabolism and glucose uptake. However, the stability of
both the polysaccharide networks and the various non-covalent bonds that stabilize the
junction zones of the polymers are susceptible to the conditions of the GIT (e.g.,
secretion of fluids, enzyme hydrolysis, pH extremes, and the presence of salts).
Eastwood & Morris (1992) mentioned specifically how charged polysaccharides are
precariously sensitive to pH, and that polysaccharide networks in general are
influenced by other factors present along the GIT, including bile salt concentrations.
Bobboi & Stephens (1996) demonstrated that addition of guar gum to glucose
containing solutions led to increases in viscosity. However, they observed reductions
in apparent viscosities at 150 s-1
after acidification. Evidently, physiological
conditions, such as pH levels, will affect the viscosity of soluble fibres and as an
extension may alter their ability to modulate nutrient absorption in the foregut.
Moreover, the ability of polysaccharide solutions to enhance viscosity is a direct result
of the inherent ability of polymer chains to overlap with each other creating a greater
number of junction zones. The degree of thickening is therefore reliant on the
hydrodynamic volume, or intrinsic viscosity, and the number of coils present in
solution, and is not universal among all soluble fibres (Eastwood & Morris, 1992).
The viscosity of branched polysaccharides is lower in comparison to long linear
polymers that are able to promote greater entanglements when placed in solution.
Therefore, in order to select appropriate hydrocolloids for food fortification to
enhance their dietary fibre levels, it is essential to not only have an understanding of
the viscosity characteristics of an array of polysaccharides and biopolymers, but more
60
importantly recognize their ability to withstand postprandial changes that lead to
reductions in digesta viscosity.
The objectives of this study were to evaluate the viscosity profiles, across a range of
shear rates, for four structurally-different hydrocolloids at various concentrations both
in solution and during a 2-stage in vitro digestion. A second objective was to
determine the impact that fibres have on lowering the diffusion of glucose using a
dialysis system.
3.2. Materials and methods
3.2.1. Materials
Four hydrocolloids, including guar gum, (Danisco Canada Inc., Toronto, ON,
Canada), xanthan gum (Sigma Chemical CO., St. Louis, MO, USA), soluble flaxseed
gum extracted from flaxseed hulls (refer to Section 3.2), and DA-100 variety soy
soluble polysaccharides (Fuji Oil Co. Ltd., Osaka, Japan), were tested. Waxy corn
starch, ULTRA-SPERSE® A, was purchased from National Starch (Bridgewater, NJ,
USA). Sodium caseinate (ALANATE® 180) was purchased from NZMP Inc.
(Lemoyne, PA, USA). Study-specific enzymes and chemicals were purchased from
the following distributors: simulated gastric fluid (SGF) from Ricca Chemical
Company (Arlington, TX, USA), purified pepsin, sodium phosphate monobasic
monohydrate and sodium phosphate dibasic anhydrous from Fisher Scientific (Fair
Lawn, NJ, USA), pancreatin from MP Biomedicals (Solon, OH, USA),
amyloglucosidase (Aspergillius niger) from Sigma-Aldrich (St. Louis, MO, USA),
hydrochloric acid 2N solution from Fisher Scientific (Nepean, ON, Canada), bile salts
from Fisher Science Education (Hanover Park, IL, USA).
61
3.2.2. Soluble flaxseed gum extraction
Omega-3 flaxseed hulls (Natunola Health Biosciences Inc., Winchester, ON,
Canada) and deionized water were used for flaxseed gum extraction. Flaxseed hulls
(3.0 kg) were allowed to soak in 39 L of deionized water. The mixture was stirred for
18 h at 300 rpm and 20oC, using an electrical stirrer (Model 4100, Burlington Pump
Inc., Burlington, ON, Canada) to extract the soluble fibre. The extract was filtered
using 4 layers of cheese cloth to separate the desired mucilage from the hulls. The
mucilage was transferred into 500 mL centrifuge tubes whereby the flaxseed gum was
separated from any remaining insoluble fractions by using a Beckman JA-10 Rotor in
a JA-21 centrifuge (Beckman Coulter Inc., Palo Alto, CA, USA) at 9000 rpm, 20oC
for 20 min. The remaining soluble fractions were then poured onto trays, which were
subsequently placed in a VirTis Freeze Dryer (Model FFD-42, VirTis Inc., New York,
USA) and allowed to freeze dry for 72 h. The gum was then blended into powder form
using an Oster® 10 speed blender (Model 6640-33, Jarden Corporation, New York,
USA).
3.2.3. Food matrix preparation
Hydrocolloids were dissolved with the addition of sodium caseinate and waxy
corn starch. The final composition of the non-dietary fibre components was 4% w/w
starch and 6% w/w sodium caseinate. Concentrations of hydrocolloids were varied in
order to normalize the apparent viscosities from 50 to 100 s-1
, as this is the shear rate
range that exists during digestion (Borwankar, 1992). All solutions were prepared
separately by dissolving weighed quantities into distilled water at room temperature.
The solutions were left to stir until fully dissolved and then placed inside a water bath

62
at 70oC for 10 min, allowing for maximum hydration and thickening. All solutions
were left to cool at 4oC for 24 h prior to experimentation. The final concentrations of
the solutions are listed in Table 3-1.
Table 3-1. Study treatment formulation (% w/w) for control solution (CS), xanthan
gum (XG)-, guar gum (GG)-, soluble flaxseed gum (SFG)-, and soluble soy
polysaccharide (SSPS)-fortified solutions.
CS
XG
GG
SFG SSPS
Fibre 0 4 2 6.5 25
Sodium caseinate 6 6 6 6 6
Starch 4 4 4 4 4
Water 90 86 88 83.5 65
Total 100 100 100 100 100
3.2.4. Viscosity measurements
Solution viscosities were measured at 37±0.1 oC over a shear rate range of
30—200 s-1
, using a controlled-stress rheometer (AR 2000, TA Instruments, New
Castle, DE, USA) equipped with a 60 cm, 4o cone-plate geometry and using a
truncation gap of 50 µm. The Power Law Model (Eq. (1)) was used to analyze the
flow curves and estimate the K and n values
𝜎 = 𝐾 × �̇�𝑛 (1)
where �̇� is shear rate, n is flow behaviour index, and K is consistency index.
In the equation, shear stress (σ) is a function of the shear rate, the consistency index,
and a dimensionless exponent (n) that indicates closeness to Newtonian behaviour.
The exponent will be less than 1 for non-Newtonian shear-thinning fluids and will
equal 1 for Newtonian fluids. The consistency index is proportional to viscosity.
63
3.2.5. In vitro digestion
A two-step in vitro digestion procedure, mimicking gastric and small intestinal
digestion, was adapted from a study that developed a model for the determination of
bioavailability of soil contaminants (Oomen, Rompelberg, Bruil, Dobbe, Pereboom &
Sips, 2003). 7.0 mL of SGF [0.2%NaCl (w/w) in 0.7% HCl (w/v)] was added to an
Erlenmeyer flask containing 15 g of sample and 4 (1 cm2, 2.1 g) glass balls that were
used to induce churning and agitation. A final concentration of 3.2 mg mL-1
of pepsin
was dissolved in SGF, as described by Malaki Nik, Wright & Corredig (2010), and a
final pH of 1.8 ±0.1 was obtained. The mixture was incubated in a shaking water bath
(Thermo Scientific, Marietta, OH, USA) at 37oC, at a speed of 175 rpm, for 1 h.
Following gastric digestion, 4.6 mL simulated bile fluid (SBF), containing 8 mg mL-1
bile salts, 14 mL simulated intestinal fluid (SIF), pH 7.8 ±0.1, containing 5 mg mL-1
pancreatin dissolved in 0.5M sodium phosphate buffer, and 2.9 mL of
amyloglucosidase (112 U/mL) were added to attain a final physiological ratio of
1:2:0.5 for gastric juices, small intestinal juices, and bile, respectively (Guyton & Hall
2010). The mixture was placed back in the shaking water bath and simulated
intestinal digestion proceeded at 37oC for 3 – 4 h.
3.2.6. Glucose release measurements
Following gastric digestion, the digesta was transferred to 23 cm dialysis tubes
(Sigma-Aldrich, St. Louis, MO, USA), with a molecular weight cutoff of 2000 Da and
a width of 32 mm. The tubes were then filled with SIF, SBF, and amyloglucosidase to
mimic the small intestinal step. Two glass balls were added and the tubes were
subsequently tied off and placed inside a beaker filled with 450 mL sodium phosphate
64
buffer. Simulated intestinal digestion proceeded for 180 min with gentle agitation. The
dialysis tubes were manually inverted every 10 min to allow for sufficient mixing.
Aliquots of 0.1 mL were pipetted at 0, 10, 20, 30, 40, 50, 60, 90, 120, 150, and 180
min, replacing with 0.1 mL buffer after each withdrawal. The glucose concentration in
the dialysate was measured using the Megazyme D-glucose (GOPOD Format kit)
following the manufacturer’s instructions (Megazyme International Ireland ltd.,
Wicklow, Ireland). Absorbance was measured using a spectrophotometer (Beckman
DU 7400) at 510 nm.
3.2.7. Statistical Analysis
All experiments were performed in triplicate. Nonlinear regression analysis
was used to formulate a mathematical model of the flow behaviour data. Analysis of
variance (ANOVA) was used to determine means and standard deviations from
replicate measurements of viscosity, viscosity following in vitro digestion, and
available glucose (GraphPad Prism Software Inc., La Jolla, CA, USA). Difference test
was evaluated by using Tukey’s Multiple Comparison testing. The significance level
was set at p<0.05.
3.3.Results and discussion
3.3.1. Effect of in vitro digestion on solution viscosity
Flow curves of the four solutions before simulated digestion, after simulated
gastric digestion and following simulated intestinal digestion are shown in Fig. 3-1, 3-
2, and 3-3, respectively. All solutions behaved as pseudoplastic non-Newtonian fluids,
with the exception of SSPS after in vitro digestion, which behaved more like a

65
Newtonian fluid. The addition of the four soluble fibres to sodium caseinate – starch
suspensions led to substantial increases in solution viscosity, with no significant
differences observed between their flow behaviours at a shear rate range of 20 – 60 s-1
.
Figure 3-1. Viscosity of guar gum-, xanthan gum-, soluble soy polysaccharide
(SSPS)-, and flaxseed gum- fortified solutions, as a function of shear rate (s-1
).
After adding gastric secretions, the viscosity of all solutions was reduced, however the
degree of reduction varied with xanthan gum demonstrating the greatest resistance to
losses in viscosity and SSPS the least, as shown in Fig 3-2.
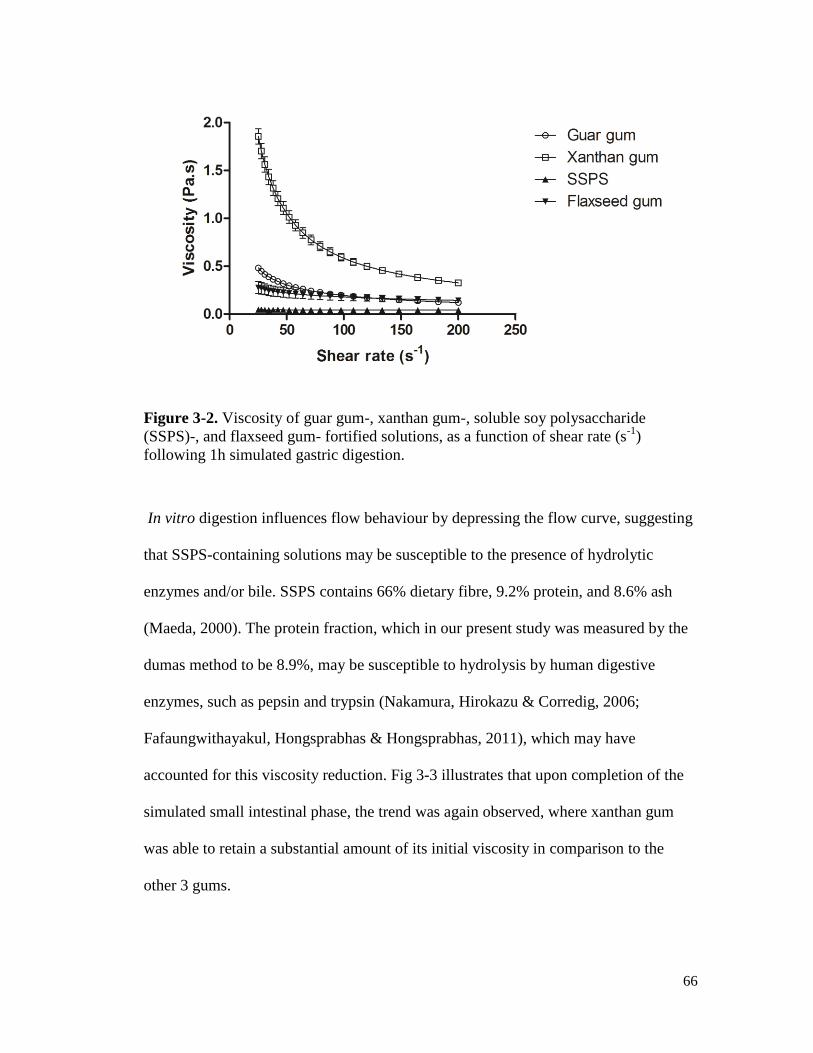
66
Figure 3-2. Viscosity of guar gum-, xanthan gum-, soluble soy polysaccharide
(SSPS)-, and flaxseed gum- fortified solutions, as a function of shear rate (s-1
)
following 1h simulated gastric digestion.
In vitro digestion influences flow behaviour by depressing the flow curve, suggesting
that SSPS-containing solutions may be susceptible to the presence of hydrolytic
enzymes and/or bile. SSPS contains 66% dietary fibre, 9.2% protein, and 8.6% ash
(Maeda, 2000). The protein fraction, which in our present study was measured by the
dumas method to be 8.9%, may be susceptible to hydrolysis by human digestive
enzymes, such as pepsin and trypsin (Nakamura, Hirokazu & Corredig, 2006;
Fafaungwithayakul, Hongsprabhas & Hongsprabhas, 2011), which may have
accounted for this viscosity reduction. Fig 3-3 illustrates that upon completion of the
simulated small intestinal phase, the trend was again observed, where xanthan gum
was able to retain a substantial amount of its initial viscosity in comparison to the
other 3 gums.
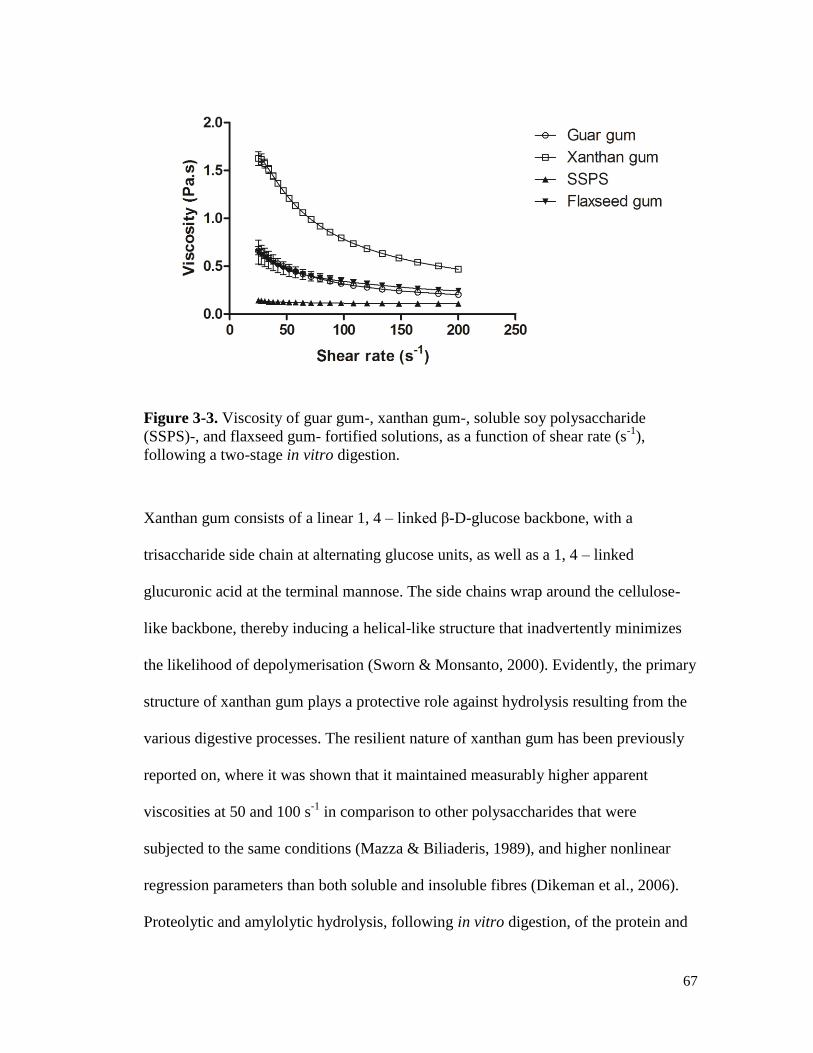
67
Figure 3-3. Viscosity of guar gum-, xanthan gum-, soluble soy polysaccharide
(SSPS)-, and flaxseed gum- fortified solutions, as a function of shear rate (s-1
),
following a two-stage in vitro digestion.
Xanthan gum consists of a linear 1, 4 – linked β-D-glucose backbone, with a
trisaccharide side chain at alternating glucose units, as well as a 1, 4 – linked
glucuronic acid at the terminal mannose. The side chains wrap around the cellulose-
like backbone, thereby inducing a helical-like structure that inadvertently minimizes
the likelihood of depolymerisation (Sworn & Monsanto, 2000). Evidently, the primary
structure of xanthan gum plays a protective role against hydrolysis resulting from the
various digestive processes. The resilient nature of xanthan gum has been previously
reported on, where it was shown that it maintained measurably higher apparent
viscosities at 50 and 100 s-1
in comparison to other polysaccharides that were
subjected to the same conditions (Mazza & Biliaderis, 1989), and higher nonlinear
regression parameters than both soluble and insoluble fibres (Dikeman et al., 2006).
Proteolytic and amylolytic hydrolysis, following in vitro digestion, of the protein and
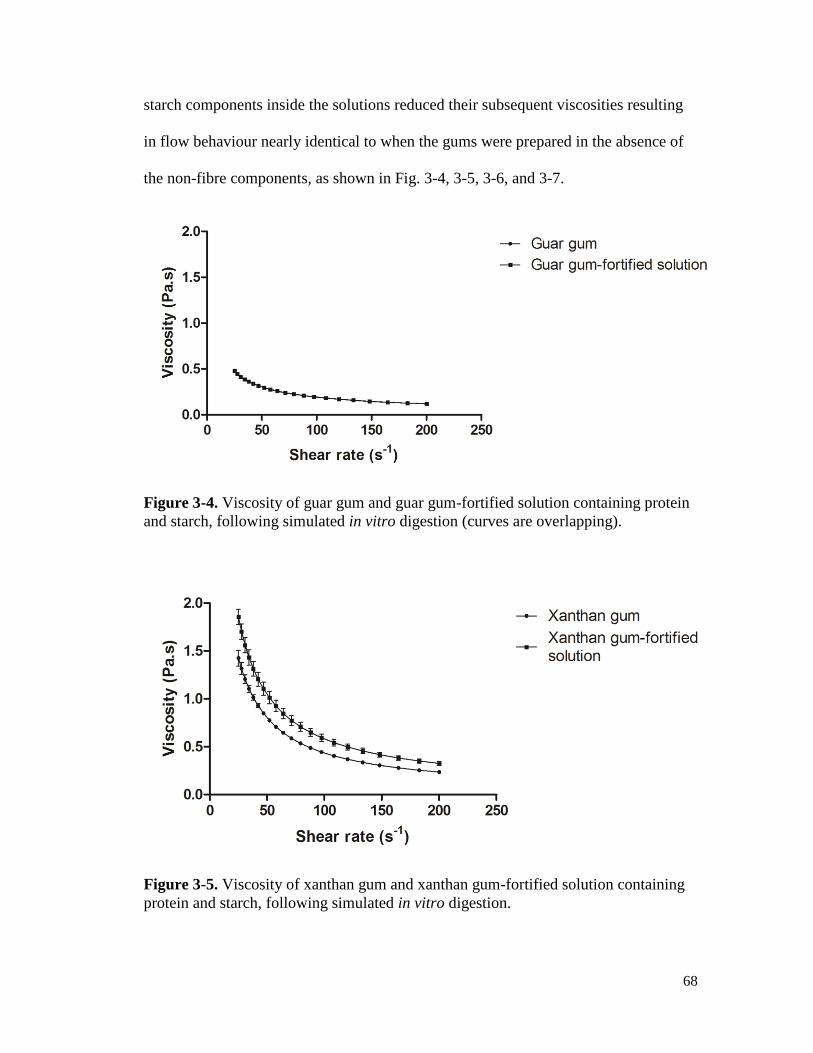
68
starch components inside the solutions reduced their subsequent viscosities resulting
in flow behaviour nearly identical to when the gums were prepared in the absence of
the non-fibre components, as shown in Fig. 3-4, 3-5, 3-6, and 3-7.
Figure 3-4. Viscosity of guar gum and guar gum-fortified solution containing protein
and starch, following simulated in vitro digestion (curves are overlapping).
Figure 3-5. Viscosity of xanthan gum and xanthan gum-fortified solution containing
protein and starch, following simulated in vitro digestion.
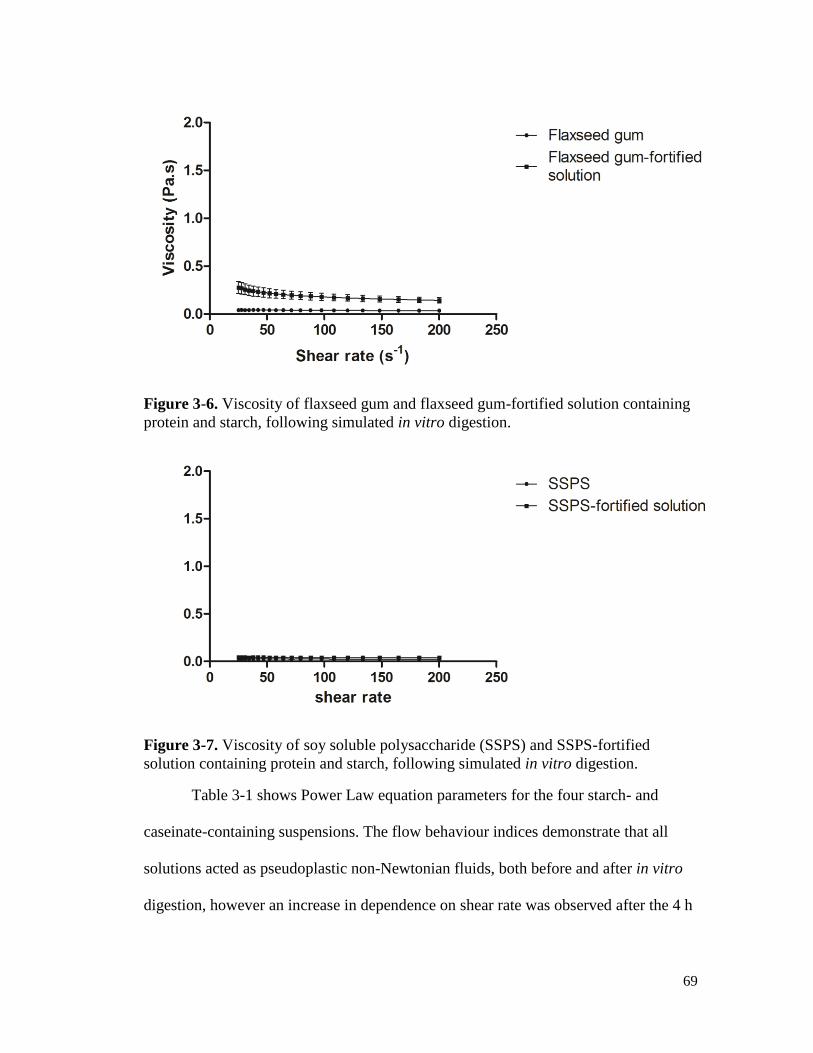
69
Figure 3-6. Viscosity of flaxseed gum and flaxseed gum-fortified solution containing
protein and starch, following simulated in vitro digestion.
Figure 3-7. Viscosity of soy soluble polysaccharide (SSPS) and SSPS-fortified
solution containing protein and starch, following simulated in vitro digestion.
Table 3-1 shows Power Law equation parameters for the four starch- and
caseinate-containing suspensions. The flow behaviour indices demonstrate that all
solutions acted as pseudoplastic non-Newtonian fluids, both before and after in vitro
digestion, however an increase in dependence on shear rate was observed after the 4 h
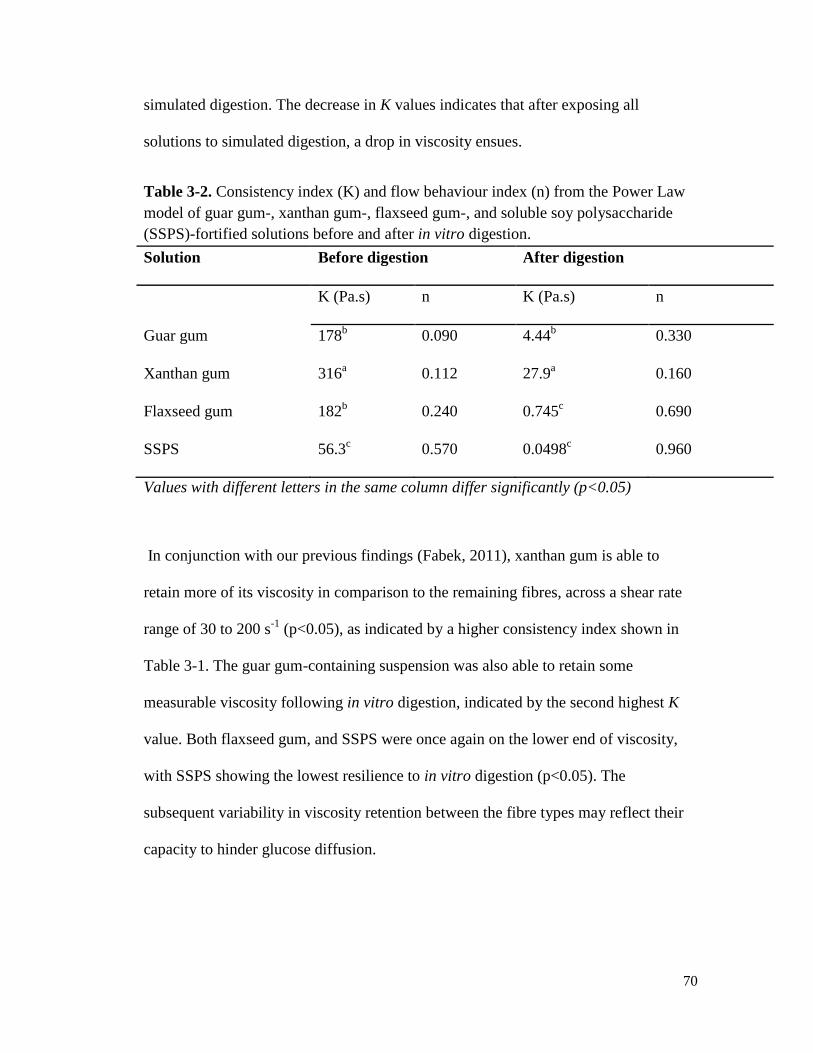
70
simulated digestion. The decrease in K values indicates that after exposing all
solutions to simulated digestion, a drop in viscosity ensues.
Table 3-2. Consistency index (K) and flow behaviour index (n) from the Power Law
model of guar gum-, xanthan gum-, flaxseed gum-, and soluble soy polysaccharide
(SSPS)-fortified solutions before and after in vitro digestion.
Solution Before digestion After digestion
K (Pa.s) n K (Pa.s) n
Guar gum 178b 0.090 4.44
b 0.330
Xanthan gum 316a 0.112 27.9
a 0.160
Flaxseed gum 182b 0.240 0.745
c 0.690
SSPS 56.3c 0.570 0.0498
c 0.960
Values with different letters in the same column differ significantly (p<0.05)
In conjunction with our previous findings (Fabek, 2011), xanthan gum is able to
retain more of its viscosity in comparison to the remaining fibres, across a shear rate
range of 30 to 200 s-1
(p<0.05), as indicated by a higher consistency index shown in
Table 3-1. The guar gum-containing suspension was also able to retain some
measurable viscosity following in vitro digestion, indicated by the second highest K
value. Both flaxseed gum, and SSPS were once again on the lower end of viscosity,
with SSPS showing the lowest resilience to in vitro digestion (p<0.05). The
subsequent variability in viscosity retention between the fibre types may reflect their
capacity to hinder glucose diffusion.
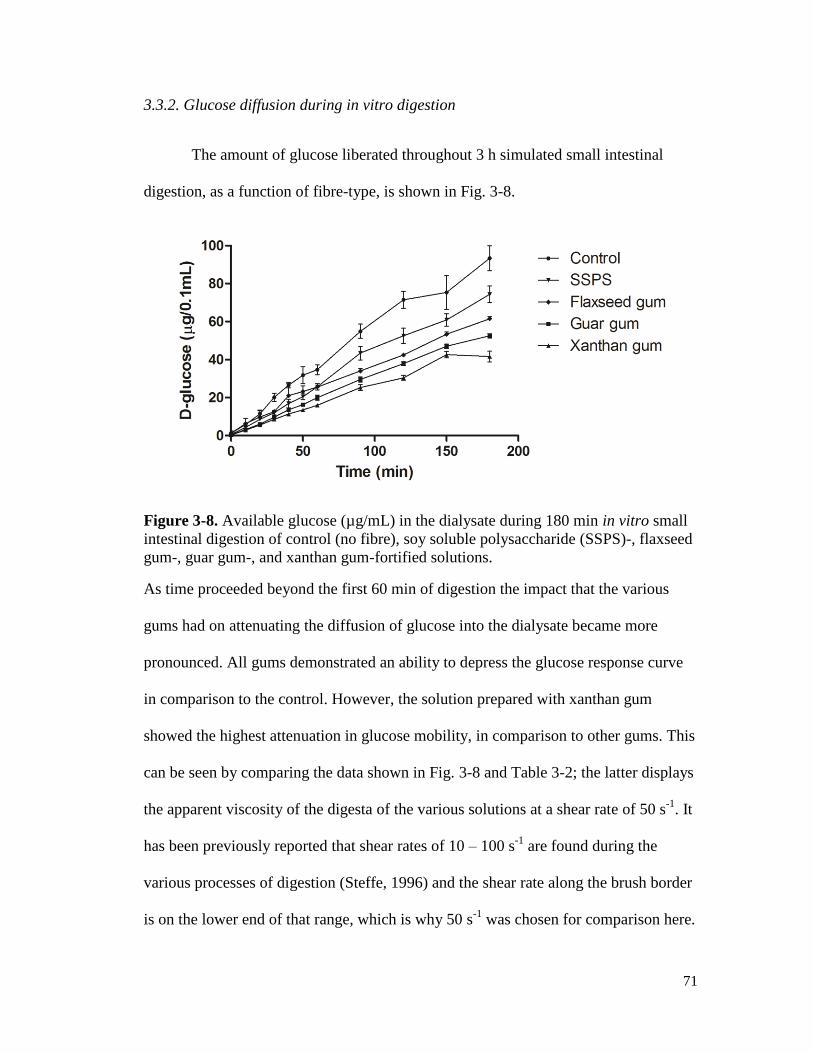
71
3.3.2. Glucose diffusion during in vitro digestion
The amount of glucose liberated throughout 3 h simulated small intestinal
digestion, as a function of fibre-type, is shown in Fig. 3-8.
Figure 3-8. Available glucose (µg/mL) in the dialysate during 180 min in vitro small
intestinal digestion of control (no fibre), soy soluble polysaccharide (SSPS)-, flaxseed
gum-, guar gum-, and xanthan gum-fortified solutions.
As time proceeded beyond the first 60 min of digestion the impact that the various
gums had on attenuating the diffusion of glucose into the dialysate became more
pronounced. All gums demonstrated an ability to depress the glucose response curve
in comparison to the control. However, the solution prepared with xanthan gum
showed the highest attenuation in glucose mobility, in comparison to other gums. This
can be seen by comparing the data shown in Fig. 3-8 and Table 3-2; the latter displays
the apparent viscosity of the digesta of the various solutions at a shear rate of 50 s-1
. It
has been previously reported that shear rates of 10 – 100 s-1
are found during the
various processes of digestion (Steffe, 1996) and the shear rate along the brush border
is on the lower end of that range, which is why 50 s-1
was chosen for comparison here.
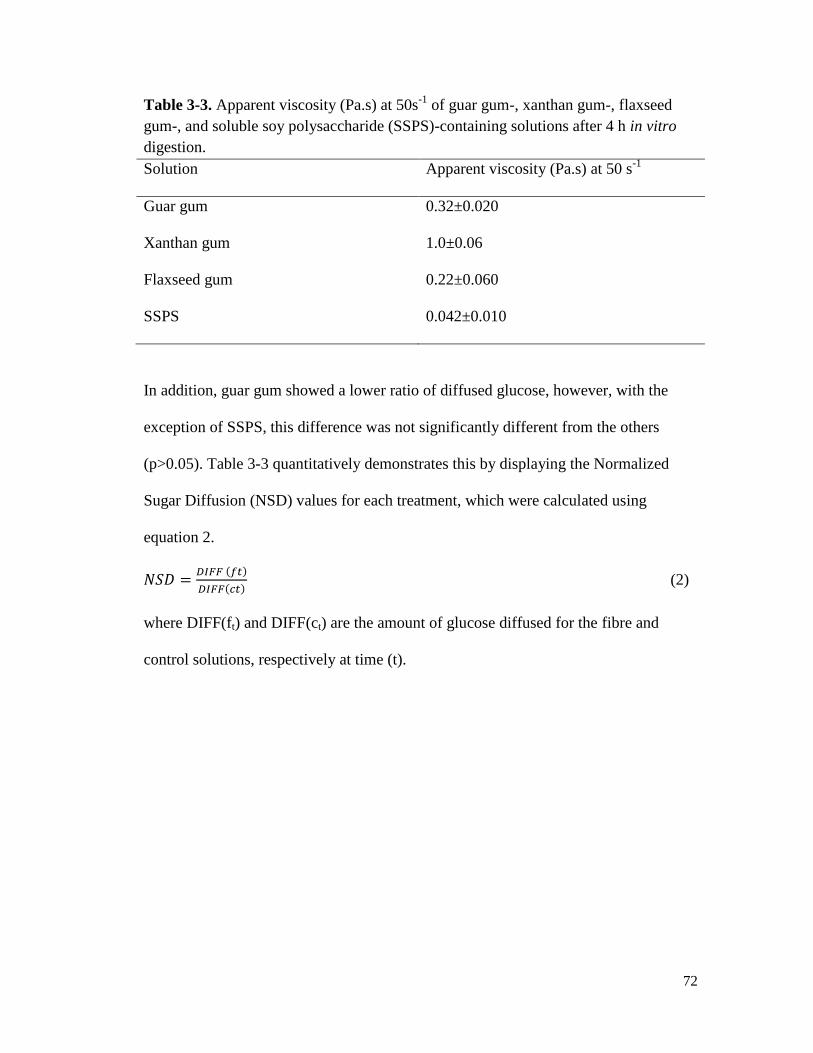
72
Table 3-3. Apparent viscosity (Pa.s) at 50s-1
of guar gum-, xanthan gum-, flaxseed
gum-, and soluble soy polysaccharide (SSPS)-containing solutions after 4 h in vitro
digestion.
Solution Apparent viscosity (Pa.s) at 50 s-1
Guar gum 0.32±0.020
Xanthan gum 1.0±0.06
Flaxseed gum 0.22±0.060
SSPS 0.042±0.010
In addition, guar gum showed a lower ratio of diffused glucose, however, with the
exception of SSPS, this difference was not significantly different from the others
(p>0.05). Table 3-3 quantitatively demonstrates this by displaying the Normalized
Sugar Diffusion (NSD) values for each treatment, which were calculated using
equation 2.
𝑁𝑆𝐷 =𝐷𝐼𝐹𝐹 (𝑓𝑡)
𝐷𝐼𝐹𝐹(𝑐𝑡) (2)
where DIFF(ft) and DIFF(ct) are the amount of glucose diffused for the fibre and
control solutions, respectively at time (t).
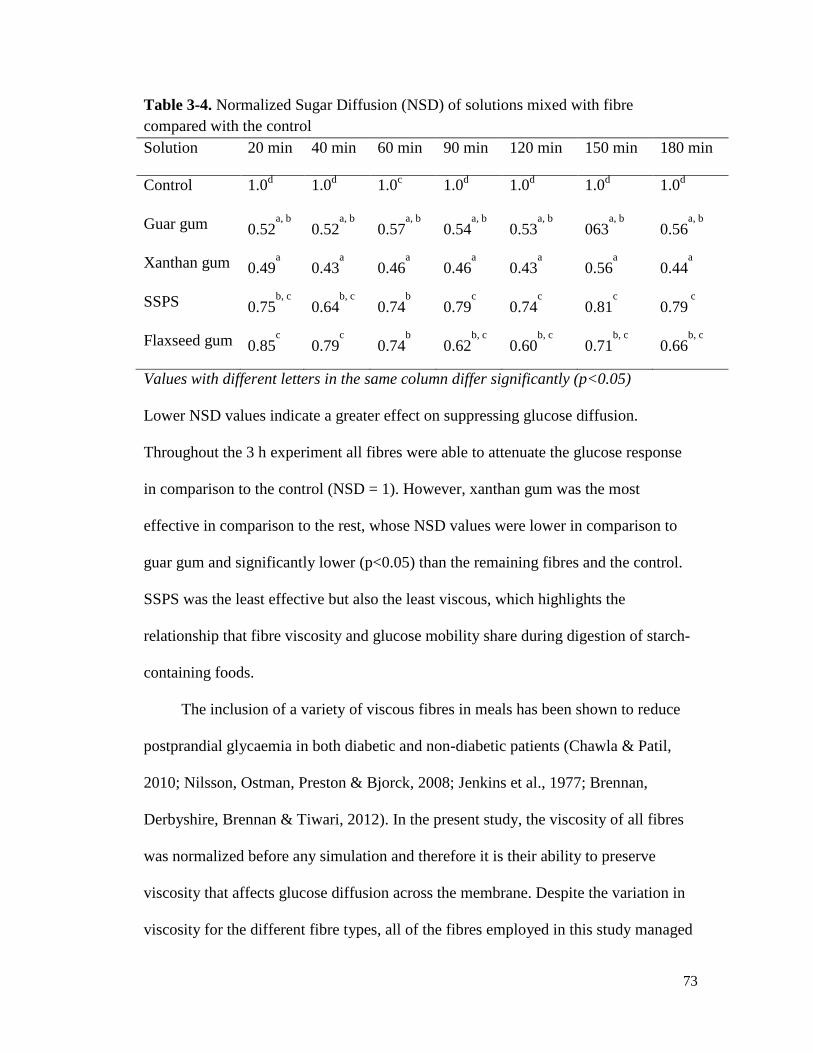
73
Table 3-4. Normalized Sugar Diffusion (NSD) of solutions mixed with fibre
compared with the control
Solution 20 min 40 min 60 min 90 min 120 min 150 min 180 min
Control 1.0d
1.0d
1.0c
1.0d
1.0d
1.0d
1.0d
Guar gum 0.52a, b
0.52a, b
0.57a, b
0.54a, b
0.53a, b
063a, b
0.56a, b
Xanthan gum 0.49a
0.43a
0.46a
0.46a
0.43a
0.56a
0.44a
SSPS 0.75b, c
0.64b, c
0.74b
0.79c
0.74c
0.81c
0.79 c
Flaxseed gum 0.85c
0.79c
0.74b
0.62b, c
0.60b, c
0.71b, c
0.66b, c
Values with different letters in the same column differ significantly (p<0.05)
Lower NSD values indicate a greater effect on suppressing glucose diffusion.
Throughout the 3 h experiment all fibres were able to attenuate the glucose response
in comparison to the control (NSD = 1). However, xanthan gum was the most
effective in comparison to the rest, whose NSD values were lower in comparison to
guar gum and significantly lower (p<0.05) than the remaining fibres and the control.
SSPS was the least effective but also the least viscous, which highlights the
relationship that fibre viscosity and glucose mobility share during digestion of starch-
containing foods.
The inclusion of a variety of viscous fibres in meals has been shown to reduce
postprandial glycaemia in both diabetic and non-diabetic patients (Chawla & Patil,
2010; Nilsson, Ostman, Preston & Bjorck, 2008; Jenkins et al., 1977; Brennan,
Derbyshire, Brennan & Tiwari, 2012). In the present study, the viscosity of all fibres
was normalized before any simulation and therefore it is their ability to preserve
viscosity that affects glucose diffusion across the membrane. Despite the variation in
viscosity for the different fibre types, all of the fibres employed in this study managed
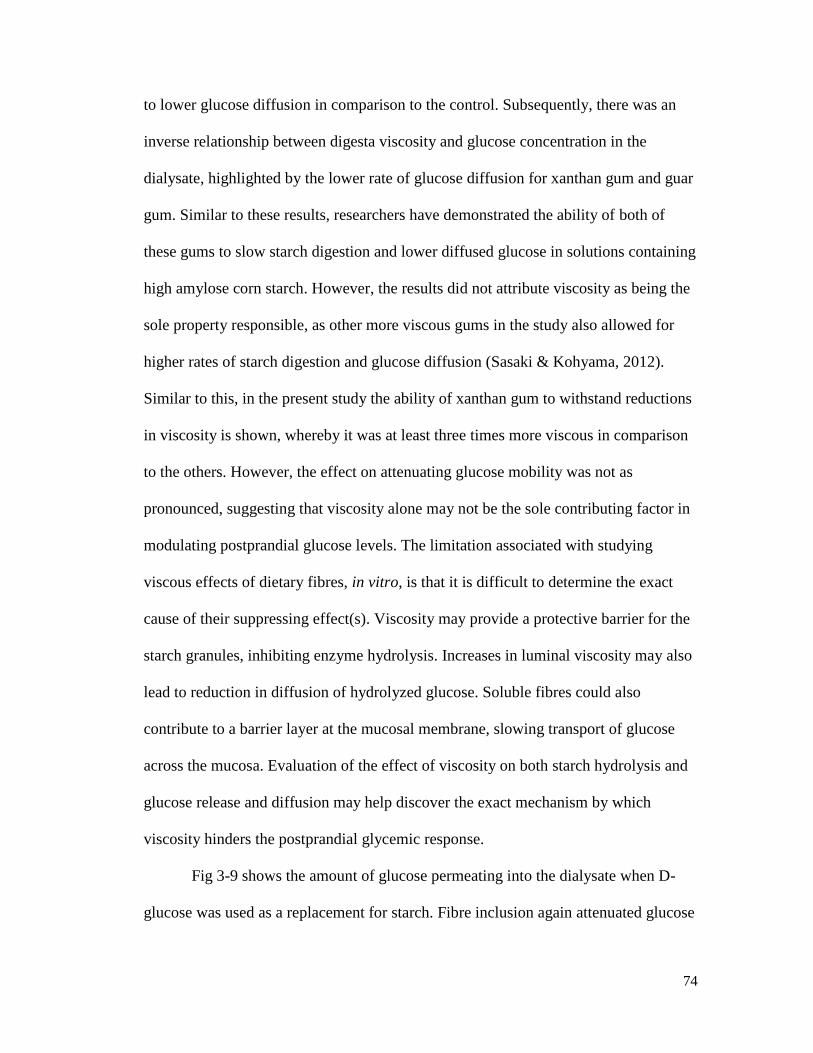
74
to lower glucose diffusion in comparison to the control. Subsequently, there was an
inverse relationship between digesta viscosity and glucose concentration in the
dialysate, highlighted by the lower rate of glucose diffusion for xanthan gum and guar
gum. Similar to these results, researchers have demonstrated the ability of both of
these gums to slow starch digestion and lower diffused glucose in solutions containing
high amylose corn starch. However, the results did not attribute viscosity as being the
sole property responsible, as other more viscous gums in the study also allowed for
higher rates of starch digestion and glucose diffusion (Sasaki & Kohyama, 2012).
Similar to this, in the present study the ability of xanthan gum to withstand reductions
in viscosity is shown, whereby it was at least three times more viscous in comparison
to the others. However, the effect on attenuating glucose mobility was not as
pronounced, suggesting that viscosity alone may not be the sole contributing factor in
modulating postprandial glucose levels. The limitation associated with studying
viscous effects of dietary fibres, in vitro, is that it is difficult to determine the exact
cause of their suppressing effect(s). Viscosity may provide a protective barrier for the
starch granules, inhibiting enzyme hydrolysis. Increases in luminal viscosity may also
lead to reduction in diffusion of hydrolyzed glucose. Soluble fibres could also
contribute to a barrier layer at the mucosal membrane, slowing transport of glucose
across the mucosa. Evaluation of the effect of viscosity on both starch hydrolysis and
glucose release and diffusion may help discover the exact mechanism by which
viscosity hinders the postprandial glycemic response.
Fig 3-9 shows the amount of glucose permeating into the dialysate when D-
glucose was used as a replacement for starch. Fibre inclusion again attenuated glucose
75
mobility; however, the effect is not as pronounced in comparison to what was seen in
Fig 3-8, with starch acting as a substrate for amylolytic hydrolysis.
Figure 3-9. Available glucose (µg/mL) in the dialysate during 180 min in vitro small
intestinal digestion of control (no fibre), soy soluble polysaccharide (SSPS)-, flaxseed
gum-, guar gum-, and xanthan gum- fortified solutions when starch was replaced with
D-glucose.
Therefore, although we have demonstrated that fibre-induced viscosity has a positive
impact on lowering glucose diffusivity, in vitro, there may also be an effect on the
hydrolysis of starch, indicating a potential multi-faceted manner by which soluble
fibres may lower postprandial glycemia.
3.4.Conclusion
Hydrocolloids (xanthan gum, guar gum, flaxseed gum, and SSPS) were prepared
at defined concentrations to create equi-viscous solutions. Their flow behaviour was
analyzed both before and after two-stage in vitro digestion. Xanthan gum showed
76
significantly higher resilience to the digestive processes, followed by guar gum. The
remaining gums demonstrated nearly a complete loss in viscosity by dilution from
gastric and small intestinal secretions, simulating physiological conditions. All gums
were also mixed with starch and sodium caseinate, allowing for a food-like matrix to
form. Following in vitro digestion, starch and protein were hydrolyzed and the
ensuing viscosity was attributed only to the individual gums. Xanthan gum again
showed significantly higher apparent viscosities across a range of shear rates,
followed by guar gum. Subsequently, the amount of glucose that was available
following in vitro digestion in dialysis tubes was measured and compared to the
control. All gums lowered glucose concentration, with xanthan gum being the most
effective. These results suggest that digesta viscosity of soluble fibres depends on
their ability to resist changes during digestion in addition to their initial viscosity or
concentration in solution or in a food matrix. Subsequently, this affects the capacity
by which they affect glycemic levels following in vitro digestion. These findings
suggest that the inclusion of more resilient gums, such as xanthan gum, might be an
effective strategy in lowering postprandial glycemia in humans.

77
4. Effect of soluble fibre inclusion on starch hydrolysis and
glucose mobility during simulated small intestinal
digestion
Hrvoje Fabeka and H. Douglas Goff
a,
a Department of Food Science University of Guelph, Guelph, Ontario N1G 2W1,
Canada
Abstract
Type II diabetes (T2D) is a disease that afflicts millions of people annually.
Subsequently, researchers are exploring potential dietary strategies that can be used to
help improve the lifestyle of individuals diagnosed with T2D. Consumption of soluble
fibre is one such strategy, which has been studied extensively for its ability to reduce
postprandial glycemia, both in human and animal studies. The exact mechanism by
which it is able to lower plasma glucose levels remains unclear; however, researchers
speculate it is due to the increase in digesta viscosity that arises from the consumption
of fibre-rich foods. Recently, we have reported on the ability of different soluble
fibres to retain solution viscosity after passing through a 2-stage in vitro digestion
model (Fabek, Messerschmidt, Brulport, and Goff, 2014). The aim of the present
study is to follow up on our earlier work and to analyse the rheological properties of
guar gum-, xanthan gum-, soluble flaxseed gum-, and soy soluble polysaccharide
(SSPS)-starch fortified solutions during 3-stage in vitro digestion (mimicking the
salivary, gastric and small intestinal steps). Moreover, biomarkers of starch hydrolysis
will be examined by looking at the effect(s) that fibre inclusion may have on reducing
sugar and glucose concentrations inside the simulated digesta. Lastly, a dialysis
78
system will be incorporated into the study to analyse for effects of fibre-induced
viscosity on glucose diffusion.
Rheological investigations revealed that all solutions exhibited viscoelastic behaviour.
Shear-thinning behaviour was evident throughout all 3 stages of in vitro digestion,
with the exception of SSPS and flax solutions, which showed Newtonian-like
behaviour at the end of the simulated intestinal step (n value from the Power Law
model was greater than 0.9). Analysis of the small intestinal digesta demonstrated an
inverse relationship between the viscosity of the solution and the amount of reducing
sugars released, where the most viscous formulation (xanthan gum) led to the greatest
suppression of starch hydrolysis. This was also evident when measuring glucose
diffusion, where the glucose concentrations in the dialysate were significantly lower
for solutions containing a viscous polysaccharide. The findings of our current work
suggest a multi-faceted effect of soluble fibres in retarding glucose levels, by affecting
both the hydrolysis of starch (luminal digestion) as well as the diffusion of hydrolysis
products.
4.1.Introduction
The evolution of the human diet remains a contentious topic, yet it is widely
accepted that our ancestors mainly consumed plant-based foods rich in dietary fibre
(Teaford and Ungar, 2000). Unrefined grains, raw fruits and vegetables, which are all
sources of fibre, were commonly consumed and when combined with high physical
activity this provides a recipe for healthy living. However, technological advances led
to such things as processed foods, which ultimately reduced the amount of fibre that
would normally be present in a particular foodstuff. Subsequently, the rates of chronic

79
disease, such as type 2 diabetes, have been on the rise for decades (Adeghate,
Schattner, and Dunn, 2006) and it is no coincidence that this trend is paralleled with
reductions in consumer intake of dietary fibre (Kendall, Esfahani, and Jenkins, 2010).
As a result, the task of improving the well-being of humans today has extended
beyond health practitioners and is the responsibility of researchers to explore the most
appropriate ingredients for food formulation, food manufacturers to formulate
functional foods, and consumers to be informed about their food choices. In the early
1970’s, the dietary fibre hypothesis brought much of the awareness back to dietary
fibre research through the purported effects it has on lowering the risk of the
metabolic syndrome, cardiovascular disease, and diabetes (Burkitt and Trowell, 1977).
Many of the health benefits surrounding dietary fibre consumption are linked to
the ability of soluble fibres to thicken with digestive fluids (Eastwood and Morris,
1992) thereby promoting health benefits inside the small intestine through a
thickening effect. One of these supposed benefits includes reductions in postprandial
plasma glucose levels, which have been clinically studied for decades. In 1978,
researchers observed that viscous dietary fibres are responsible for being
therapeutically beneficial in moderating postprandial hyperglycemia (Jenkins,
Wolever, Leeds, Gassull, Haisman, Dilawari, Goff, Metz, and Alberti, 1978). This
relationship between increased luminal viscosity, which arises through soluble fibre
consumption, and the ensuing reductions in plasma glucose levels, remains to be a
fundamental explanation for decade’s worth of clinical studies focused on studying
soluble fibre functionality. Dikeman et al. (2006) indicated that foods containing
viscous fibres, such as oat bran and guar gum, may be beneficial for plasma glucose
80
and lipid profile attenuations, whereas non-viscous insoluble fibres may be better
suited to serve a laxative effect. However, it may be difficult to predict physiological
functionality by looking at solution viscosity alone, as digesta viscosity is sensitive to
changes introduced by the secretions of the GIT (Eastwood and Morris, 1992).
Moreover, other factors may be involved especially when fibres are components of a
food-matrix (Brennan, Blake, Ellis, and Schofield, 1996). The extent of starch
hydrolysis and the rate at which hydrolysis products are released may be major
determinants of the rates of increase of postprandial plasma glucose levels (Regand,
Chowdhury, Tosh, Wolever, and Wood, 2011).
In a food matrix, food structure and viscosity may influence the rate and extent
of starch hydrolysis. By increasing the viscosity of the surrounding medium, soluble
fibres may alter the accessibility of enzymes to starch granules (Brennan, 2005).
Subsequently, the release of intermediate starch hydrolysis products, such as α-limit
dextrins and other reducing sugars inside the lumen, may be attenuated. Reducing the
degradation and amylolysis of starch may provide an additional benefit and provide a
multi-faceted mechanism by which fibres are able to attenuate the glycemic response
(Regand et al., 2011). It is difficult to ascertain whether the action(s) of fibres along
the GIT are related to suppressing the hydrolysis of starch, retarding the diffusion of
glucose, or by providing other plausible effects (Sasaki and Kohyama, 2012).
Therefore, studying the activity of soluble fibres on starch hydrolysis is a necessary
step in understanding their functional properties as they may be related to reductions
in postprandial glycemia.
81
The objectives of this study were to fortify skim milk powder-starch mixtures
with soluble fibres and to investigate their rheological behaviour in solution. A second
objective was to develop a three-stage in vitro digestion model, mimicking the
salivary, gastric, and small intestinal phases of digestion, to which all solutions were
subsequently exposed. Afterwards, their viscosity was measured during each step.
Additionally, the storage and loss moduli of the fibre-fortified solutions were
examined, which describe the liquid-like and solid-like properties of a solution. A
third objective was to observe the effect that fibre fortification has on starch
hydrolysis by measuring the concentration of both reducing sugars and glucose inside
the digesta during simulated small intestinal digestion . Lastly, 5 h in vitro glucose
diffusion was measured using a dialysis system, to mimic the final stage of
carbohydrate metabolism.
4.2.Materials and methods
4.2.1. Materials
Four hydrocolloids were employed in this study, which included guar gum,
(Danisco Canada Inc., Toronto, ON, Canada), xanthan gum (Sigma Chemical Co., St.
Louis, MO, USA), soluble flaxseed gum extracted from flaxseed hulls (Fabek et al.,
2014), and DA-100 variety soy soluble polysaccharides (Fuji Oil Co. Ltd., Osaka,
Japan). Waxy corn starch, ULTRA-SPERSE®
A, was purchased from National Starch
(Bridgewater, NJ, USA). Skim milk powder was purchased from Gay Lea Food Corp.
(Mississauga, ON, Canada). Study-specific enzymes and chemicals were purchased
from the following distributors: simulated gastric fluid (SGF) from Ricca Chemical
Company (Arlington, TX, USA), purified pepsin, sodium phosphate monobasic

82
monohydrate, sodium phosphate dibasic anhydrous, potassium chloride, potassium
citrate, potassium phosphate, and sodium chloride from Fisher Scientific (Fair Lawn,
NJ, USA), pancreatin from MP Biomedicals (Solon, OH, USA), α-amylase,
amyloglucosidase (Aspergillius niger), mucin from porcine stomach, sodium L-
lactate, ammonium nitrate, urea, and uric acid sodium salt from Sigma-Aldrich (St.
Louis, MO, USA), hydrochloric acid 2N solution from Fisher Scientific (Nepean, ON,
Canada), bile salts from Fisher Science Education (Hanover Park, IL, USA).
4.2.2. Food matrix preparation
Hydrocolloids were dissolved with the addition of skim milk powder (SMP)
and waxy corn starch. The final composition of the non-dietary fibre components were
4% w/w starch and 8.65% w/w SMP. Concentrations were varied in order to
normalize the apparent viscosities from 20 to 60 s-1
, as this is the shear rate range that
is reported during the process of digestion (Steffe, 1996). All solutions were prepared
separately by mixing the powders together and then dissolving weighed quantities into
distilled water at room temperature. The solutions were left to stir until fully dissolved
(to avoid the formation of lumps), covered and then placed inside a water bath at 70oC
for 10 min, allowing for maximum hydration and thickening. All solutions were left to
cool at 4oC for 24 h prior to experimentation. The final concentrations of the solutions
are listed in Table 4-1.
83
Table 4-1. Study treatment formulation (% w/w) for control solution (CS), xanthan
gum (XG)-, guar gum (GG)-, flaxseed gum (FG)-, and soluble soy polysaccharide
(SSPS)-fortified solutions
CS
XG
GG
FG SSPS
Fibre 0 4 3 7 20
Skim milk powder 8.65 8.65 8.65 8.65 8.65
Starch 4 4 4 4 4
Water 87.35 83.35 84.35 80.35 67.35
Total 100 100 100 100 100
4.2.3. Dynamic viscoelasticity and viscosity measurements
Study treatment rheology was measured using a cone and plate configuration
(cone radius of 60 mm, a truncation gap of 50.8 μm, and an angle of 2°) on a
controlled-stress rheometer (AR 2000; TA Instruments, New Castle, DE, USA).
Dynamic viscoelasticity (G’ and G”) was measured in a frequency range of 0.01 – 10
Hz at 37oC and constant stress (0.5 Pa). At this stress level, all solutions displayed
linear viscoelastic behaviour in the preliminary stress sweep test. Flow behaviour was
also measured by applying a continuous shear rate sweep from 10 to 200 s−1
with 30
sample points. The comparative shear rate range of 20 – 60 s−1
was selected based on
reports that this is the approximate shear rate during digestion (Steffe, 1996). All
measurements were performed in triplicate.
4.2.4. In vitro digestion
A three-step in vitro digestion procedure, mimicking salivary, gastric, and
small intestinal digestion, was adapted from our earlier study (Fabek et al., 2014) with
the introduction of a brief salivary stage to initiate amylolysis of starch. 5.0 mL of
84
simulated salivary fluid (see Table 4-2), containing alpha amylase (75 U mL-1
), was
added to Erlenmeyer flasks containing 15 g samples and 4 glass balls in each, which
were used to induce churning and agitation. Salivary digestion proceeded for 5 min
inside a shaking water bath (Thermo Scientific, Marietta, OH, USA) at 37oC, at a
speed of 60 rpm, mimicking the agitation speed during swallowing (Borwankar,
1992). Afterwards, 7.0 mL of SGF [0.2%NaCl (w/w) in 0.7% HCl (w/v)] was added,
containing 3.2 mg mL-1
of pepsin (pH = 1.8 ±0.1). The mixture was incubated at
37oC, at a speed of 175 rpm, for 1 h. Following gastric digestion, 4.6 mL simulated
bile fluid (SBF), containing 8 mg mL-1
bile salts, 14 mL simulated intestinal fluid
(SIF), pH 7.6 ±0.1, containing 5 mg mL-1
pancreatin dissolved in 0.5M sodium
phosphate buffer and calcium chloride solution, and 2.9 mL of amyloglucosidase (112
U/mL) were added to each solution. The mixture was placed back in the shaking water
bath and simulated intestinal digestion proceeded at 37oC for 5 h. All digestions were
performed in triplicate.
Table 4-2. Chemical composition of simulated salivary fluid1
Chemical Amount (g L-1
)
Sodium chloride (NaCl) 1.594
Ammonium nitrate (NH4NO3) 0.328
Potassium phosphate (KH2PO4) 0.636
Potassium chloride (KCl) 0.202
Potassium citrate (K3C6H5O7.H2O) 0.308
Uric acid sodium salt (C5H3N4O3.Na) 0.021
Urea (H2NCONH2) 0.198
Porcine gastric mucin 30
Lactic acid sodium salt (C3H5O3Na) 0.146
1Adapted from Mao and McClements (2012)
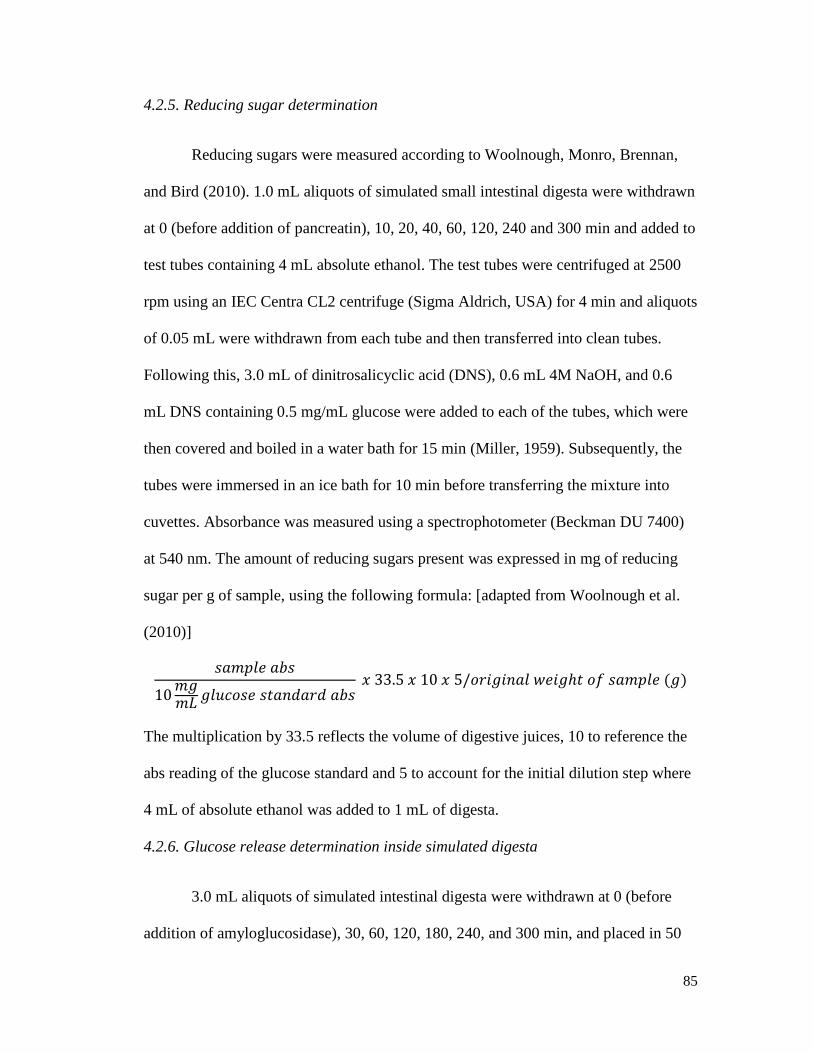
85
4.2.5. Reducing sugar determination
Reducing sugars were measured according to Woolnough, Monro, Brennan,
and Bird (2010). 1.0 mL aliquots of simulated small intestinal digesta were withdrawn
at 0 (before addition of pancreatin), 10, 20, 40, 60, 120, 240 and 300 min and added to
test tubes containing 4 mL absolute ethanol. The test tubes were centrifuged at 2500
rpm using an IEC Centra CL2 centrifuge (Sigma Aldrich, USA) for 4 min and aliquots
of 0.05 mL were withdrawn from each tube and then transferred into clean tubes.
Following this, 3.0 mL of dinitrosalicyclic acid (DNS), 0.6 mL 4M NaOH, and 0.6
mL DNS containing 0.5 mg/mL glucose were added to each of the tubes, which were
then covered and boiled in a water bath for 15 min (Miller, 1959). Subsequently, the
tubes were immersed in an ice bath for 10 min before transferring the mixture into
cuvettes. Absorbance was measured using a spectrophotometer (Beckman DU 7400)
at 540 nm. The amount of reducing sugars present was expressed in mg of reducing
sugar per g of sample, using the following formula: [adapted from Woolnough et al.
(2010)]
𝑠𝑎𝑚𝑝𝑙𝑒 𝑎𝑏𝑠
10𝑚𝑔𝑚𝐿 𝑔𝑙𝑢𝑐𝑜𝑠𝑒 𝑠𝑡𝑎𝑛𝑑𝑎𝑟𝑑 𝑎𝑏𝑠
𝑥 33.5 𝑥 10 𝑥 5/𝑜𝑟𝑖𝑔𝑖𝑛𝑎𝑙 𝑤𝑒𝑖𝑔ℎ𝑡 𝑜𝑓 𝑠𝑎𝑚𝑝𝑙𝑒 (𝑔)
The multiplication by 33.5 reflects the volume of digestive juices, 10 to reference the
abs reading of the glucose standard and 5 to account for the initial dilution step where
4 mL of absolute ethanol was added to 1 mL of digesta.
4.2.6. Glucose release determination inside simulated digesta
3.0 mL aliquots of simulated intestinal digesta were withdrawn at 0 (before
addition of amyloglucosidase), 30, 60, 120, 180, 240, and 300 min, and placed in 50
86
mL centrifuge tubes containing 30 mL absolute ethanol. The tubes were centrifuged at
4500 rpm for 15 min. The glucose concentration inside the supernatant was
determined using the GOPOD enzyme assay kit, according to the manufacturer’s
instructions (see Chapter 3). The degree of starch hydrolysis, as measured by the
amount of glucose released, was calculated using equation 4-1 (Hasjim, Lavau,
Gidley, and Gilbert, 2010):
% 𝑠𝑡𝑎𝑟𝑐ℎ ℎ𝑦𝑑𝑟𝑜𝑙𝑦𝑠𝑒𝑑 =(𝑤𝑒𝑖𝑔ℎ𝑡 𝑜𝑓 𝑔𝑙𝑢𝑐𝑜𝑠𝑒 𝑥 0.9)
𝑑𝑟𝑦 𝑤𝑒𝑖𝑔ℎ𝑡 𝑜𝑓 𝑠𝑡𝑎𝑟𝑐ℎ 𝑖𝑛 𝑠𝑜𝑙𝑢𝑡𝑖𝑜𝑛 𝑥 100% (1)
4.2.7. Glucose diffusion inside a dialysis system
Glucose measurements were done according to the protocol described earlier
(Fabek et al., 2014). Briefly, dialysis tubes were cut to 9 cm in length and were
hydrated in deionized water for 30 min and subsequently washed off to remove any
glycerol that may have adhered to the tubes. Simulated intestinal digestion was carried
out inside the dialysis system to which two glass balls were added and the tubes were
subsequently tied off and placed inside a beaker filled with 450 mL sodium phosphate
buffer. The dialysis tubes were manually inverted every 10 min to allow for sufficient
mixing. Aliquots of 0.1 mL were pipetted at 0, 10, 20, 30, 40, 50, 60, 90, 120, 150,
180, 210, 240, 270, and 300 min, replacing with 0.1 mL buffer after each withdrawal.
The glucose concentration in the dialysate was measured using the GOPOD enzyme
assay kit and the absorbance was measured at 510 nm.
4.2.8. Statistical Analysis
All experiments were performed in triplicate. Nonlinear regression analysis
was used to develop a working model for the flow curve data. The Power Law model
87
was used to analyze the flow curves and estimate the flow behaviour (n) and
consistency (K) indices, as described by Fabek et al., 2014. Linear regression was
used to attain slopes of the reducing sugar release and glucose diffusion lines, which
were used for comparison with apparent viscosity at 50 s-1
during simulated small
intestinal digestion. Analysis of variance (ANOVA) was done to determine means and
standard deviations from replicate measurements of all experiments using GraphPad
software (GraphPad Prism Software Inc., La Jolla, CA, USA). Difference test was
evaluated by using Tukey’s Multiple Comparison testing. The significance level was
set at p<0.05.
4.3.Results and discussion
4.3.1. Study treatment rheology during in vitro digestion
Figures 4-1, 4-2, 4-3 and 4-4 show the storage (G’) and loss moduli (G”) for
the fibre-fortified treatments in solution, following simulated gastric digestion, and
after 5 h in vitro digestion.
88
Figure 4-1. Storage (G') and loss moduli (G") of xanthan gum-fortified treatments –
that is (a) in solution, (b), following simulated gastric digestion, and (c) at the end of
3-stage in vitro digestion – as a function of frequency with an oscillating stress of 0.5
Pa.
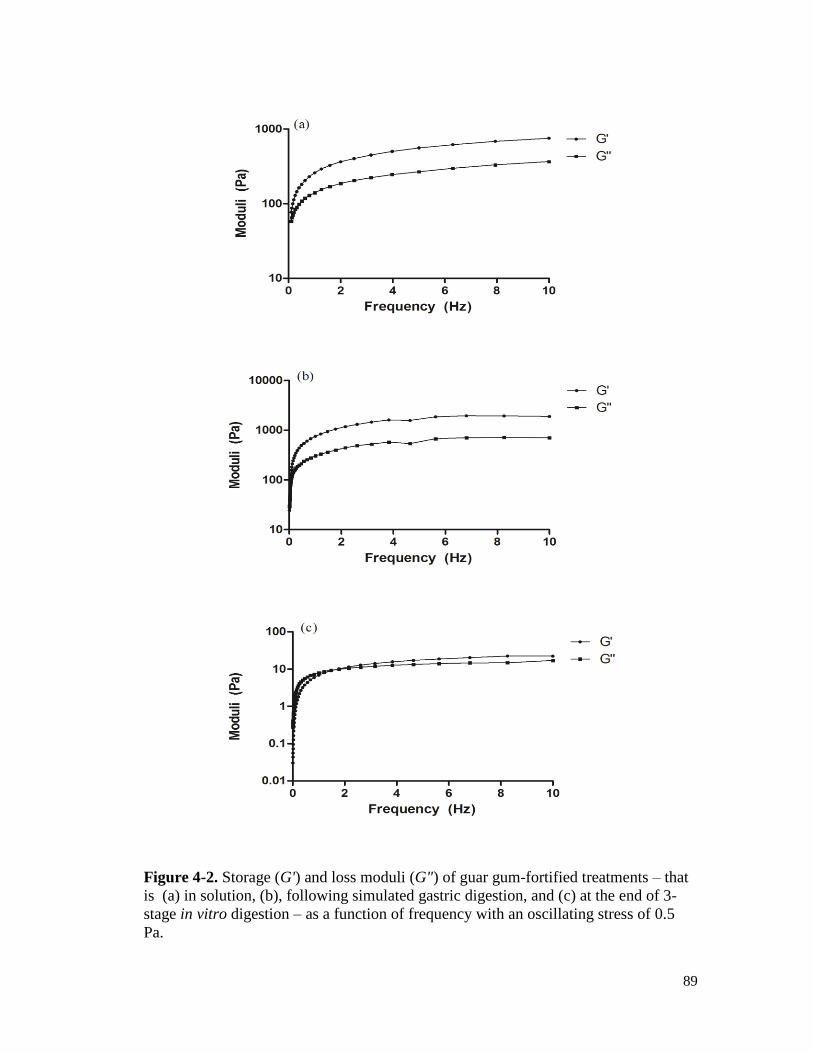
89
Figure 4-2. Storage (G') and loss moduli (G") of guar gum-fortified treatments – that
is (a) in solution, (b), following simulated gastric digestion, and (c) at the end of 3-
stage in vitro digestion – as a function of frequency with an oscillating stress of 0.5
Pa.
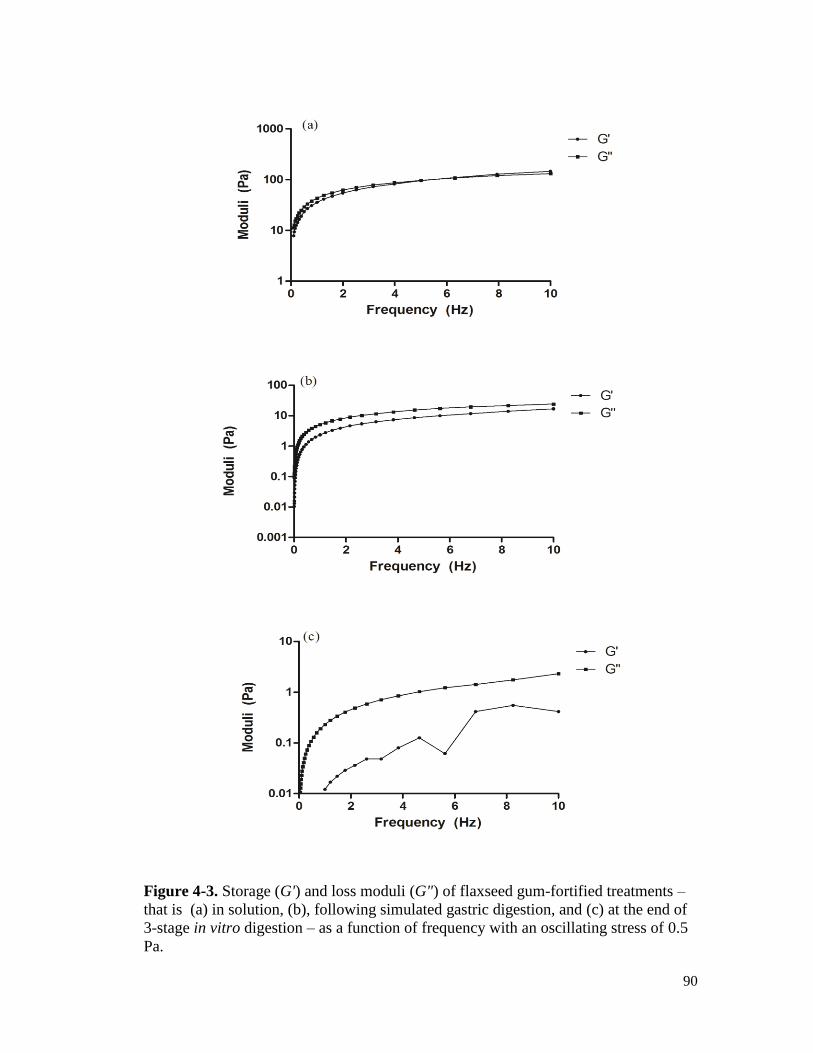
90
Figure 4-3. Storage (G') and loss moduli (G") of flaxseed gum-fortified treatments –
that is (a) in solution, (b), following simulated gastric digestion, and (c) at the end of
3-stage in vitro digestion – as a function of frequency with an oscillating stress of 0.5
Pa.
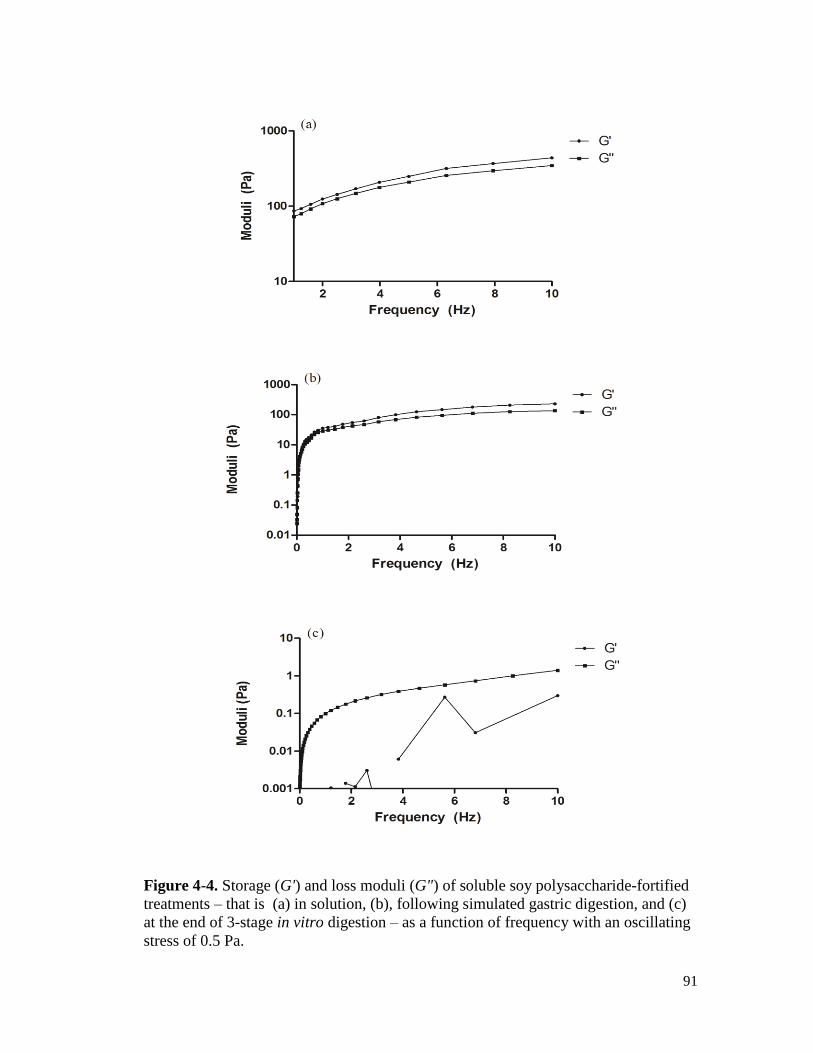
91
Figure 4-4. Storage (G') and loss moduli (G") of soluble soy polysaccharide-fortified
treatments – that is (a) in solution, (b), following simulated gastric digestion, and (c)
at the end of 3-stage in vitro digestion – as a function of frequency with an oscillating
stress of 0.5 Pa.
92
All solutions demonstrated viscoelastic behaviour with a measurable G’ throughout
the frequency sweep (Figures 4-1a, 4-2a, 4-3a and 4-4 a). The addition of the different
hydrocolloids to the solution resulted in the formation of a gel network, which was
observed in a previous study where researchers formulated puddings with both SSPS
and flaxseed gum (Au et al., 2013). Moreover, it has been shown that by adding
xanthan gum at concentrations above 0.5% to starch solutions there is a measurable
increase in the G’ thereby demonstrating a dependence of solution rheology on the
concentration of xanthan gum that is added (Sasaki and Kohyama, 2011). Both
xanthan gum and guar gum have been shown to increase the G’ values of tapioca
starch solutions (Chaisawang and Suphantharika, 2005). Interestingly, in our study G’
values remained higher than G” following simulated gastric digestion, with the
exception of flax-fortified solutions, which nonetheless still had a measurable elastic
component, as illustrated in Fig 4-3 b. This illustrates that all four fibre-fortified
solutions were able to maintain solid-like behaviour despite the simulated secretions
of both the salivary and gastric phases of the present in vitro model. However, both G’
and G” were measurably higher for xanthan- and guar-fortified solutions in
comparison to SSPS and flax, which reflects a greater extent of polymer
entanglements and a higher viscosity for those 2 solutions. Following simulated small
intestinal digestion, both flax- and SSPS-solutions showed complete loss of solid-like
behaviour made evident by the substantial reductions of the elastic modulus.
Moreover, the solutions exhibited substantially lower viscous components in
comparison to both guar gum and xanthan gum. Evidently, the entanglements or
interactions responsible for promoting structure in the flax- and SSPS- solutions were
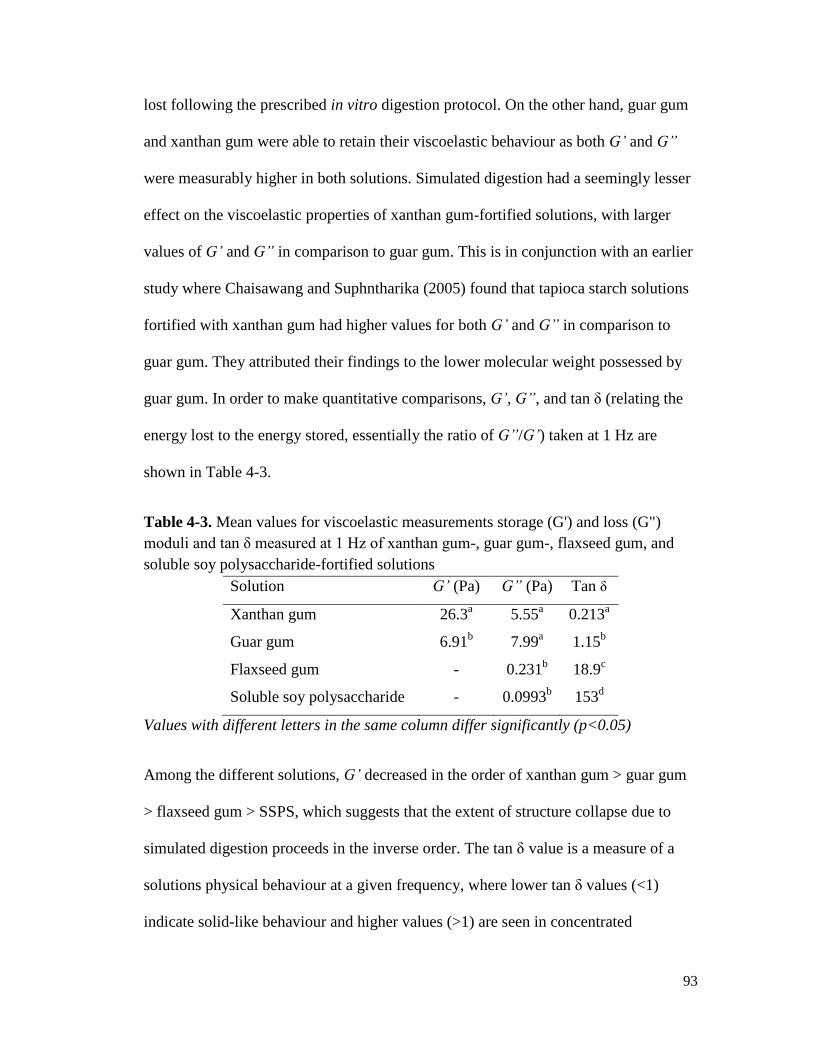
93
lost following the prescribed in vitro digestion protocol. On the other hand, guar gum
and xanthan gum were able to retain their viscoelastic behaviour as both G’ and G”
were measurably higher in both solutions. Simulated digestion had a seemingly lesser
effect on the viscoelastic properties of xanthan gum-fortified solutions, with larger
values of G’ and G” in comparison to guar gum. This is in conjunction with an earlier
study where Chaisawang and Suphntharika (2005) found that tapioca starch solutions
fortified with xanthan gum had higher values for both G’ and G” in comparison to
guar gum. They attributed their findings to the lower molecular weight possessed by
guar gum. In order to make quantitative comparisons, G’, G”, and tan δ (relating the
energy lost to the energy stored, essentially the ratio of G”/G’) taken at 1 Hz are
shown in Table 4-3.
Table 4-3. Mean values for viscoelastic measurements storage (G') and loss (G")
moduli and tan δ measured at 1 Hz of xanthan gum-, guar gum-, flaxseed gum, and
soluble soy polysaccharide-fortified solutions
Solution G’ (Pa) G” (Pa) Tan δ
Xanthan gum 26.3a
5.55a
0.213a
Guar gum 6.91b
7.99a
1.15b
Flaxseed gum - 0.231b
18.9c
Soluble soy polysaccharide - 0.0993b
153d
Values with different letters in the same column differ significantly (p<0.05)
Among the different solutions, G’ decreased in the order of xanthan gum > guar gum
> flaxseed gum > SSPS, which suggests that the extent of structure collapse due to
simulated digestion proceeds in the inverse order. The tan δ value is a measure of a
solutions physical behaviour at a given frequency, where lower tan δ values (<1)
indicate solid-like behaviour and higher values (>1) are seen in concentrated
94
solutions, and much higher values are observed in dilute solutions. Xanthan gum had a
significantly lower value for tan δ in comparison to the other 3 solutions,
demonstrating its ability to retain solid-like behaviour despite the secretions of the
simulated 3-stage digestion model. Moreover, it was the only solution that possessed a
tan δ of < 1, which is characteristic of a viscoelastic gel (true gels have tan δ values <
0.1) (Kwong, Wolever, Brummer, and Tosh, 2013). This may be attributed to the
viscoelastic properties of xanthan gum, which when placed in solution with starch
creates a weak three-dimensional network through the association of the
aforementioned helical structure and ordered chain segments, which was also reported
in earlier studies (Kim and Yoo, 2006; Doublier and Cuvelier, 1996). The other 3
treatments all behaved as solutions (tan δ > 1), however guar gum demonstrated a
much greater resistance to change, as indicated not only by a comparably lower tan δ
value (1.15, indicating the presence of a concentrated solution) but also much higher
values for G’ and G”. These results demonstrate that although all four gums employed
in the study are able to impart solid-like structures when combined with SMP and
starch, the ensuing rheological properties of the solutions following simulated
digestion are altered and become inherently dependent upon the unique
physicochemical makeup of the individual gums. Both xanthan gum and guar gum
exhibited the greatest capacity to resist changes in structure and maintained the
highest viscous component of the four treatments, with the former maintaining solid-
like behaviour.
Figure 4-5 shows apparent viscosity as a function of shear rate (10 to 200 s-1
)
for all solutions, including the control.

95
Figure 4-5. Flow behaviour of control (no gum), xanthan gum-, guar gum-, soy
soluble polysaacharide (SSPS)-, and flaxseed gum-fortified solutions across a shear
rate range of 10 to 200 s-1
.
At 20 s-1
the control solution had an apparent viscosity of 0.218 ± 0.032 Pa.s. This was
increased to 6.570 ± 0.592 Pa.s with the addition of 4% xanthan gum, 6.231 ± 0.192
Pa.s with the addition of 3% guar gum, 5.305 ± 0.317 Pa.s with the addition of 7%
flaxseed gum, and 6.239 ± 0.804 Pa.s with the addition of 20% SSPS. There was no
difference between the apparent viscosities of the fibre-fortified solutions at 20 s-1
(p>0.05). All solutions, with the exception of the control, behaved as pseudoplastic
non-Newtonian fluids, demonstrating a strong dependence on shear rate as shown by
the behaviour index values listed in Table 4-5. The viscosity of the xanthan gum
fortified solution demonstrated the greatest shear-thinning behaviour at the prescribed
shear rate range (lowest n value). This was observed in earlier studies working with
wheat starch-xanthan gum (Sajjan and Rao, 1987), corn starch-xanthan gum
(Sudhakar, Singhal, and Kulkarni, 1996) and rice starch-xanthan gum mixtures (Kim
and Yoo, 2006) and is likely due to the rigid, helical structure and high molecular
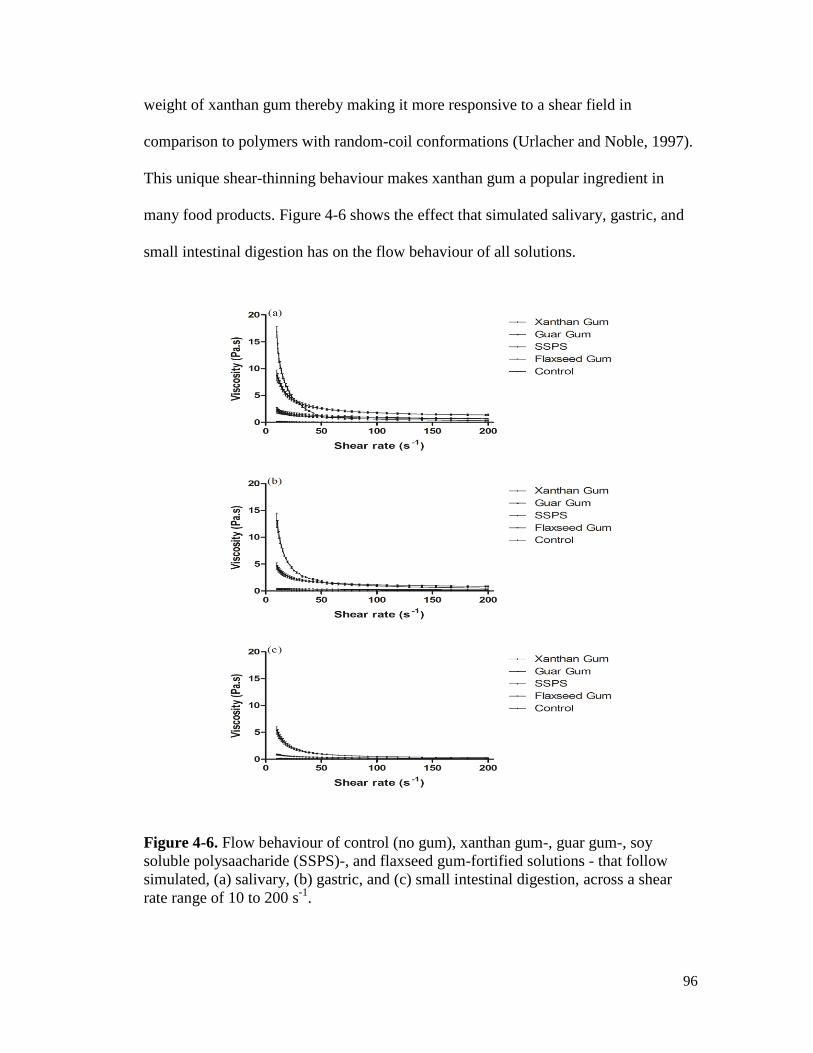
96
weight of xanthan gum thereby making it more responsive to a shear field in
comparison to polymers with random-coil conformations (Urlacher and Noble, 1997).
This unique shear-thinning behaviour makes xanthan gum a popular ingredient in
many food products. Figure 4-6 shows the effect that simulated salivary, gastric, and
small intestinal digestion has on the flow behaviour of all solutions.
Figure 4-6. Flow behaviour of control (no gum), xanthan gum-, guar gum-, soy
soluble polysaacharide (SSPS)-, and flaxseed gum-fortified solutions - that follow
simulated, (a) salivary, (b) gastric, and (c) small intestinal digestion, across a shear
rate range of 10 to 200 s-1
.

97
As expected, the viscosities decrease as the solutions pass through the 3-stage in vitro
digestion. Upon completion of the simulated small intestinal step, the flow behaviour
of both flaxseed gum- and SSPS-fortified solutions showed substantial reductions,
indicated by their respective curves in Figure 4-6 (c) and consistency index values
listed in Table 4-4.
Table 4-4. Consistency index (K, Pa.s) values of the Power Law model for control,
xanthan gum-, guar gum-, soy soluble polysaccharide (SSPS)-, and flaxseed gum-
fortified treatments in solution, following simulated salivary (SP), gastric (GP) and
small intestinal (SIP) phases of digestion.
Solution
SP
GP
SIP
Control 1.04d
0.943c
0.0240c
0.00100b
Xanthan gum 101a
80.1a
91.4a
50.1a
Guar gum 26.6b
26.8b
12.2b
3.77b
SSPS 13.8c
3.59c
0.406c 0.0400
b
Flaxseed gum 17.5b, c
5.39c
0.978c
0.193b
Values with different letters in the same column differ significantly (p<0.05)
Pseudoplastic fluids can be adequately described using the aforementioned Power
Law equation (Steffe, 1996), which is used to calculate a consistency index or a
constant proportional to viscosity, as described in Chapter 3. Guar gum retained a
greater sum of its initial viscosity following in vitro digestion in comparison to both
flaxseed gum and SSPS; however no significant difference was observed in the
viscosity constant shown in Table 4-4 or in the flow behaviour (Figure 4-6 c) when
compared with the control, flax- or SSPS-solution at shear rates > 75 s-1
. On the other
hand, xanthan gum retained a significant amount of its viscosity throughout the
prescribed shear rate range (p<0.05), which corresponds with our earlier work in
Chapter 3 where we reported on the tremendous resilience of xanthan gum towards
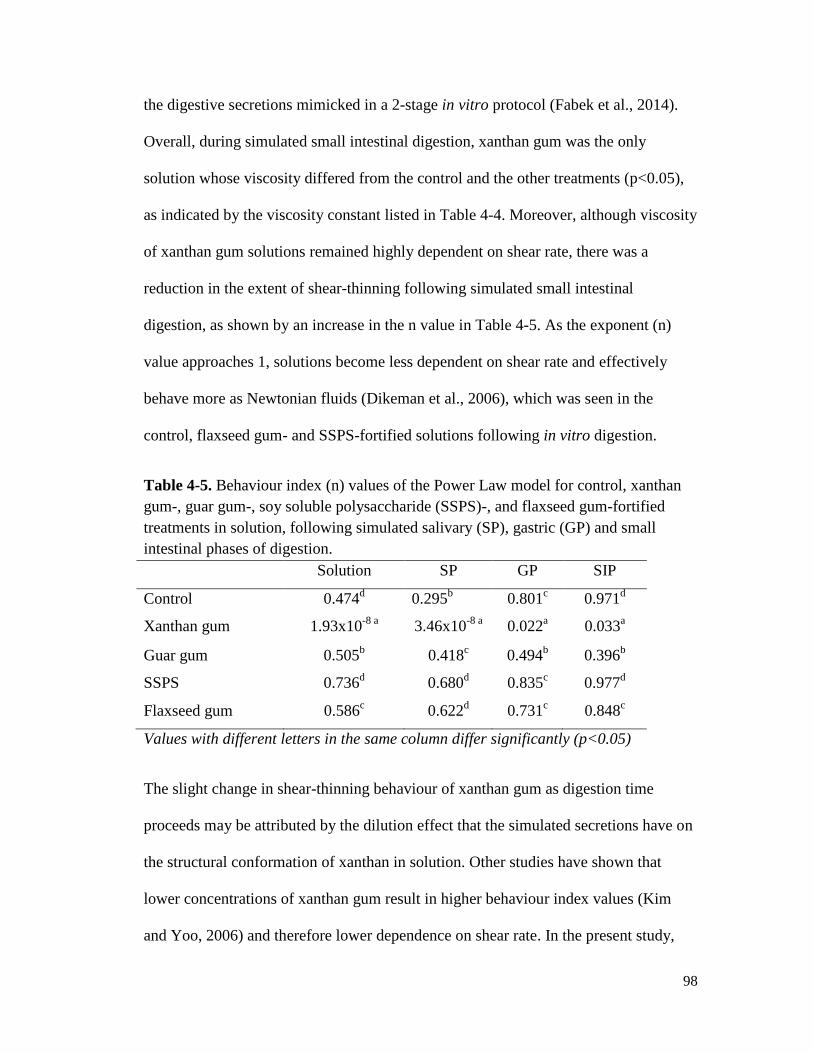
98
the digestive secretions mimicked in a 2-stage in vitro protocol (Fabek et al., 2014).
Overall, during simulated small intestinal digestion, xanthan gum was the only
solution whose viscosity differed from the control and the other treatments (p<0.05),
as indicated by the viscosity constant listed in Table 4-4. Moreover, although viscosity
of xanthan gum solutions remained highly dependent on shear rate, there was a
reduction in the extent of shear-thinning following simulated small intestinal
digestion, as shown by an increase in the n value in Table 4-5. As the exponent (n)
value approaches 1, solutions become less dependent on shear rate and effectively
behave more as Newtonian fluids (Dikeman et al., 2006), which was seen in the
control, flaxseed gum- and SSPS-fortified solutions following in vitro digestion.
Table 4-5. Behaviour index (n) values of the Power Law model for control, xanthan
gum-, guar gum-, soy soluble polysaccharide (SSPS)-, and flaxseed gum-fortified
treatments in solution, following simulated salivary (SP), gastric (GP) and small
intestinal phases of digestion.
Solution
SP
GP
SIP
Control 0.474d
0.295b
0.801c
0.971d
Xanthan gum 1.93x10⁻⁸ a
3.46x10⁻⁸ a
0.022a
0.033a
Guar gum 0.505b
0.418c
0.494b
0.396b
SSPS 0.736d
0.680d
0.835c
0.977d
Flaxseed gum 0.586c 0.622
d 0.731
c 0.848
c
Values with different letters in the same column differ significantly (p<0.05)
The slight change in shear-thinning behaviour of xanthan gum as digestion time
proceeds may be attributed by the dilution effect that the simulated secretions have on
the structural conformation of xanthan in solution. Other studies have shown that
lower concentrations of xanthan gum result in higher behaviour index values (Kim
and Yoo, 2006) and therefore lower dependence on shear rate. In the present study,
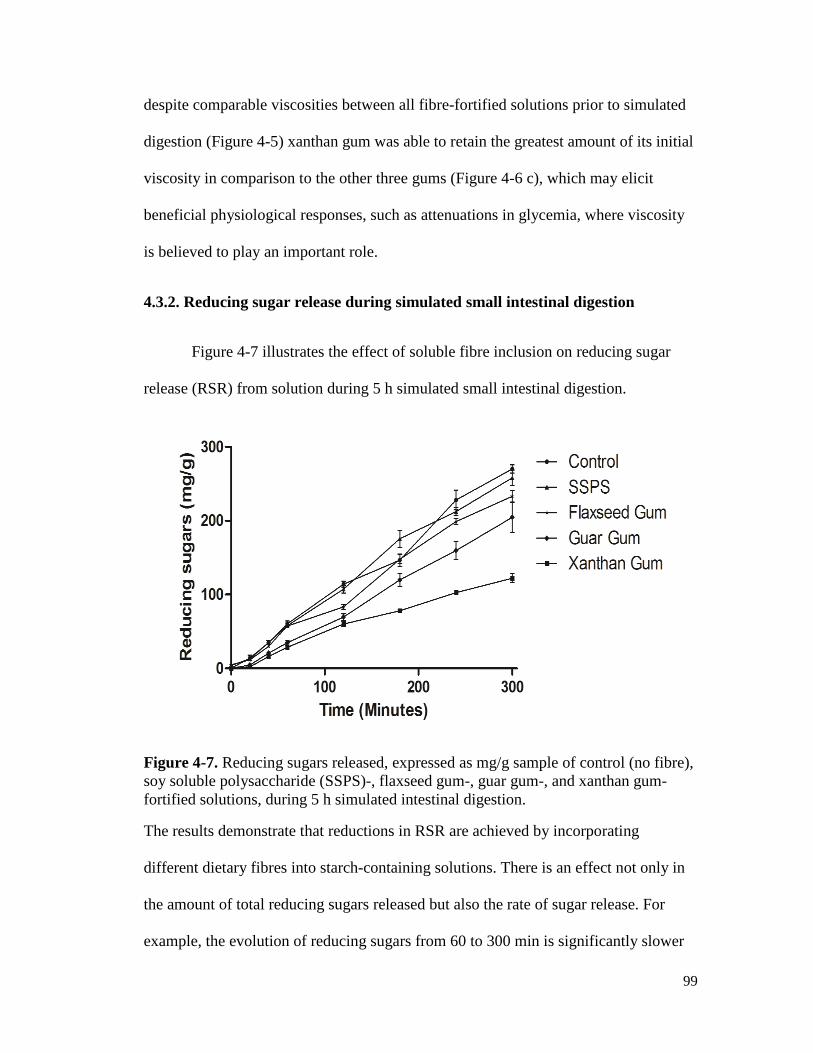
99
despite comparable viscosities between all fibre-fortified solutions prior to simulated
digestion (Figure 4-5) xanthan gum was able to retain the greatest amount of its initial
viscosity in comparison to the other three gums (Figure 4-6 c), which may elicit
beneficial physiological responses, such as attenuations in glycemia, where viscosity
is believed to play an important role.
4.3.2. Reducing sugar release during simulated small intestinal digestion
Figure 4-7 illustrates the effect of soluble fibre inclusion on reducing sugar
release (RSR) from solution during 5 h simulated small intestinal digestion.
Figure 4-7. Reducing sugars released, expressed as mg/g sample of control (no fibre),
soy soluble polysaccharide (SSPS)-, flaxseed gum-, guar gum-, and xanthan gum-
fortified solutions, during 5 h simulated intestinal digestion.
The results demonstrate that reductions in RSR are achieved by incorporating
different dietary fibres into starch-containing solutions. There is an effect not only in
the amount of total reducing sugars released but also the rate of sugar release. For
example, the evolution of reducing sugars from 60 to 300 min is significantly slower
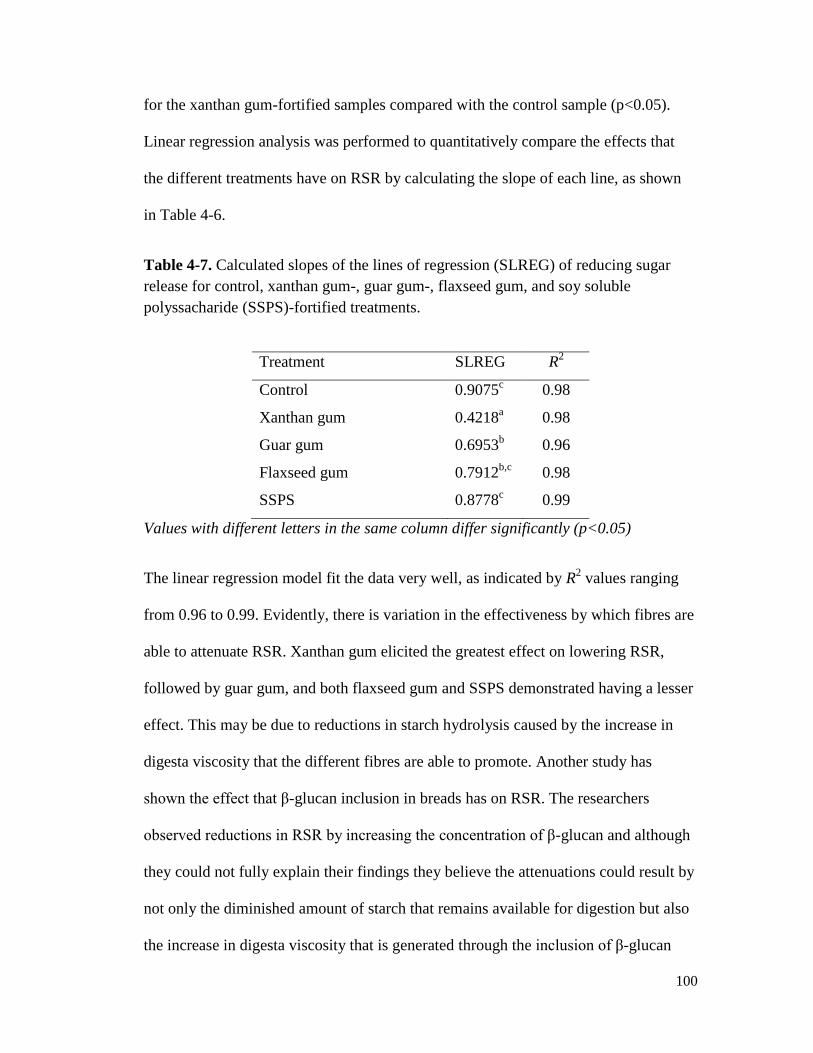
100
for the xanthan gum-fortified samples compared with the control sample (p<0.05).
Linear regression analysis was performed to quantitatively compare the effects that
the different treatments have on RSR by calculating the slope of each line, as shown
in Table 4-6.
Table 4-7. Calculated slopes of the lines of regression (SLREG) of reducing sugar
release for control, xanthan gum-, guar gum-, flaxseed gum, and soy soluble
polyssacharide (SSPS)-fortified treatments.
Treatment SLREG R2
Control 0.9075c 0.98
Xanthan gum 0.4218a
0.98
Guar gum 0.6953b
0.96
Flaxseed gum 0.7912b,c
0.98
SSPS 0.8778c
0.99
Values with different letters in the same column differ significantly (p<0.05)
The linear regression model fit the data very well, as indicated by R2 values ranging
from 0.96 to 0.99. Evidently, there is variation in the effectiveness by which fibres are
able to attenuate RSR. Xanthan gum elicited the greatest effect on lowering RSR,
followed by guar gum, and both flaxseed gum and SSPS demonstrated having a lesser
effect. This may be due to reductions in starch hydrolysis caused by the increase in
digesta viscosity that the different fibres are able to promote. Another study has
shown the effect that β-glucan inclusion in breads has on RSR. The researchers
observed reductions in RSR by increasing the concentration of β-glucan and although
they could not fully explain their findings they believe the attenuations could result by
not only the diminished amount of starch that remains available for digestion but also
the increase in digesta viscosity that is generated through the inclusion of β-glucan
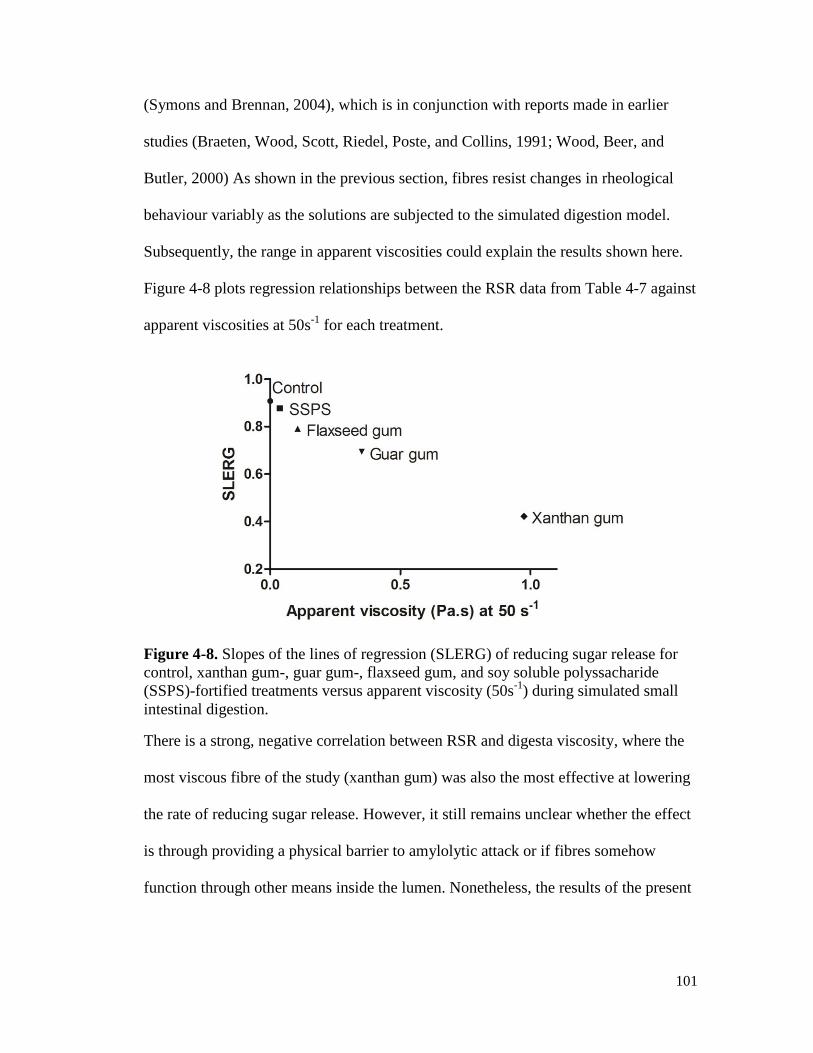
101
(Symons and Brennan, 2004), which is in conjunction with reports made in earlier
studies (Braeten, Wood, Scott, Riedel, Poste, and Collins, 1991; Wood, Beer, and
Butler, 2000) As shown in the previous section, fibres resist changes in rheological
behaviour variably as the solutions are subjected to the simulated digestion model.
Subsequently, the range in apparent viscosities could explain the results shown here.
Figure 4-8 plots regression relationships between the RSR data from Table 4-7 against
apparent viscosities at 50s-1
for each treatment.
Figure 4-8. Slopes of the lines of regression (SLERG) of reducing sugar release for
control, xanthan gum-, guar gum-, flaxseed gum, and soy soluble polyssacharide
(SSPS)-fortified treatments versus apparent viscosity (50s-1
) during simulated small
intestinal digestion.
There is a strong, negative correlation between RSR and digesta viscosity, where the
most viscous fibre of the study (xanthan gum) was also the most effective at lowering
the rate of reducing sugar release. However, it still remains unclear whether the effect
is through providing a physical barrier to amylolytic attack or if fibres somehow
function through other means inside the lumen. Nonetheless, the results of the present

102
in vitro study demonstrate a clear relationship between digesta viscosity and the extent
of RSR.
4.3.3. Effects of viscous fibres on glucose release during simulated small intestinal
digestion
The in vitro digestion behaviour of the different solutions, as measured by the
amount of glucose released inside the simulated digesta, is illustrated in Figure 4-9.
Figure 4-9. Percentage of starch hydrolysis during 5 h simulated small intestinal
digestion of control (no fibre), soy soluble polysaccharide (SSPS)-, flaxseed gum-,
guar gum-, and xanthan gum-fortified solutions (measured by the concentration of
glucose).
Nearly half of the starch was converted to glucose following the 5 h digestion step,
with the majority of hydrolysis taking place in the first 2 h. A similar trend was
observed when a starch-containing pig diet was exposed to an in vitro digestion
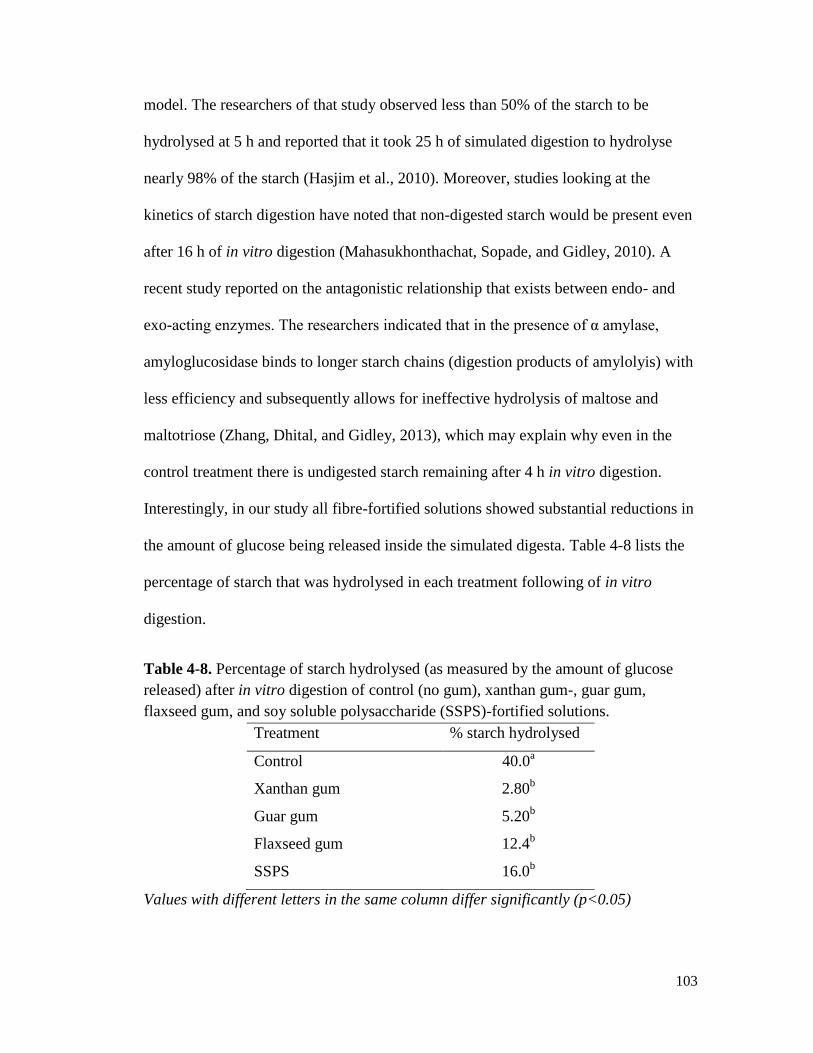
103
model. The researchers of that study observed less than 50% of the starch to be
hydrolysed at 5 h and reported that it took 25 h of simulated digestion to hydrolyse
nearly 98% of the starch (Hasjim et al., 2010). Moreover, studies looking at the
kinetics of starch digestion have noted that non-digested starch would be present even
after 16 h of in vitro digestion (Mahasukhonthachat, Sopade, and Gidley, 2010). A
recent study reported on the antagonistic relationship that exists between endo- and
exo-acting enzymes. The researchers indicated that in the presence of α amylase,
amyloglucosidase binds to longer starch chains (digestion products of amylolyis) with
less efficiency and subsequently allows for ineffective hydrolysis of maltose and
maltotriose (Zhang, Dhital, and Gidley, 2013), which may explain why even in the
control treatment there is undigested starch remaining after 4 h in vitro digestion.
Interestingly, in our study all fibre-fortified solutions showed substantial reductions in
the amount of glucose being released inside the simulated digesta. Table 4-8 lists the
percentage of starch that was hydrolysed in each treatment following of in vitro
digestion.
Table 4-8. Percentage of starch hydrolysed (as measured by the amount of glucose
released) after in vitro digestion of control (no gum), xanthan gum-, guar gum,
flaxseed gum, and soy soluble polysaccharide (SSPS)-fortified solutions.
Treatment % starch hydrolysed
Control 40.0a
Xanthan gum 2.80b
Guar gum 5.20b
Flaxseed gum 12.4b
SSPS 16.0b
Values with different letters in the same column differ significantly (p<0.05)
104
The most viscous system (xanthan gum) led to the most pronounced reduction in
starch hydrolysis; however, this effect is not significant in comparison to the other
fibre treatments, contrasting what was observed in the reducing sugar analysis. This
observation may be explained by the dualistic action that fibres may exert during
starch digestion. As discussed in Section 2, in vivo glucose release occurs at the
basolateral membrane via the action of glycolytic enzymes embedded there. However,
in order for starch to be broken down into glucose, endohydrolases (α-amylase) must
first have access to the starch (luminal digestion) and the subsequent products must
then be hydrolysed by exohydrolases (amyloglucosidase) to produce glucose
(membrane-level digestion). We have observed that both xanthan gum and guar gum
are able to lower RSR thereby providing a slower release of sugars. Subsequently,
there could be an additional concurrent mechanism by which fibres are able to
attenuate the glycemic response by also affecting the hydrolysis of luminal digestion
products (reducing sugars). In the present study, even the low viscosity fibres (SSPS
and flaxseed gum) are able to reduce the amount of glucose in the digesta, which may
be due to the viscosity of the solutions or by increasing mass transfer resistance
(Singh, Dartois, and Kaur, 2010). A recent study reported that both SSPS and flaxseed
gum inclusion in dairy products resulted in blunted postprandial glucose metabolism.
In their study, the reported viscosity in solution was approximately 75 mPa.s, for both
SSPS and flaxseed gum (Au et al., 2013), whereas in our present study simulated
digesta viscosity ranged from 40 to 120 mPa.s, for SSPS and flaxseed gum,
respectively. Moreover, an earlier study reported that viscosities as low as 10 mPa.s
(in solution) are able to modulate postprandial glucose levels with reductions in peak
105
plasma glucose reaching >12% (Wood, Braaten, Scott, Riedel, Wolynetz, and Collins,
1994). It is therefore plausible that fibres, even at low viscosities, have the potential of
lowering glucose levels by means of impacting the complete breakdown of starch;
however, this requires further investigation. Nonetheless, soluble fibre inclusion in the
present study led to pronounced reductions in starch hydrolysis, with the results
demonstrating an inverse relationship between digesta viscosity and glucose release.
However, it is difficult to ascertain whether the fibres are decreasing the rate of
glucose release through the inhibition of enzymes, or whether increases in digesta
viscosity result in limiting diffusion of amylolytic products and create impairment of
mixing of digestive contents.
Additionally, the solutions were tested for the ability of soluble fibres to retain
glucose using the in vitro diffusion assay described earlier (Fabek et al., 2014). Figure
4-10 shows the amount of glucose released through the dialysis membrane during 5 h
simulated small intestinal digestion.

106
Figure 4-10. In vitro diffusion of glucose during 5 h simulated small intestinal
digestion of control (no fibre), soy soluble polysaccharide (SSPS)-, flaxseed gum-,
guar gum-, and xanthan gum-fortified solutions.
In vitro digestion of the control solution led to significantly greater release of glucose
during the first 2 h of digestion. Interestingly, even the low viscosity fibres were
observed to exert impedance on the rate of diffusion during the first 2 h. However, this
difference was not observed upon completion of the 5 h simulated digestion.
Quantitative comparisons of regression analyses are listed in Table 4-9.
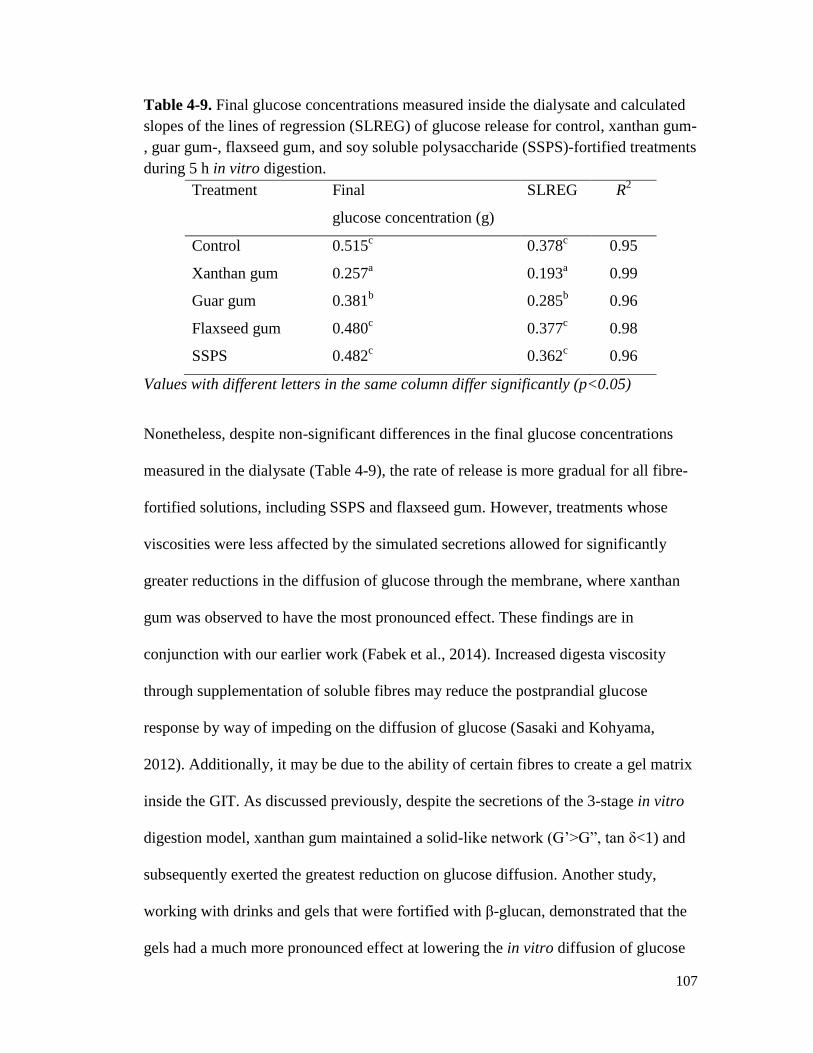
107
Table 4-9. Final glucose concentrations measured inside the dialysate and calculated
slopes of the lines of regression (SLREG) of glucose release for control, xanthan gum-
, guar gum-, flaxseed gum, and soy soluble polysaccharide (SSPS)-fortified treatments
during 5 h in vitro digestion.
Treatment Final
glucose concentration (g)
SLREG R2
Control 0.515c
0.378c 0.95
Xanthan gum 0.257a
0.193a
0.99
Guar gum 0.381b
0.285b
0.96
Flaxseed gum 0.480c
0.377c
0.98
SSPS 0.482c
0.362c
0.96
Values with different letters in the same column differ significantly (p<0.05)
Nonetheless, despite non-significant differences in the final glucose concentrations
measured in the dialysate (Table 4-9), the rate of release is more gradual for all fibre-
fortified solutions, including SSPS and flaxseed gum. However, treatments whose
viscosities were less affected by the simulated secretions allowed for significantly
greater reductions in the diffusion of glucose through the membrane, where xanthan
gum was observed to have the most pronounced effect. These findings are in
conjunction with our earlier work (Fabek et al., 2014). Increased digesta viscosity
through supplementation of soluble fibres may reduce the postprandial glucose
response by way of impeding on the diffusion of glucose (Sasaki and Kohyama,
2012). Additionally, it may be due to the ability of certain fibres to create a gel matrix
inside the GIT. As discussed previously, despite the secretions of the 3-stage in vitro
digestion model, xanthan gum maintained a solid-like network (G’>G”, tan δ<1) and
subsequently exerted the greatest reduction on glucose diffusion. Another study,
working with drinks and gels that were fortified with β-glucan, demonstrated that the
gels had a much more pronounced effect at lowering the in vitro diffusion of glucose
108
in comparison to the β-glucan-fortified drinks. However, the researchers observed the
opposite effect when measuring plasma glucose, in vivo. They explained their results
by the openness of the gel network and possible disruption of the gel matrix during
chewing, which was a condition that was absent in the in vitro portion of their study
(Kwong et al., 2013). Similarly, in our model system, in addition to promoting
viscosity it is plausible that the glucose is trapped inside the gel network, thereby
being released at a much slower rate in comparison to solutions that lack a measurable
G’, such as in the control, SSPS, and flaxseed gum treatments.
4.4.Conclusion
Starch/SMP solutions were fortified with different gums, which subsequently
increased the viscosity of the solutions and led to the formation of viscoelastic gels.
Despite similar flow behaviours in solution, after passing through the 3-stage in vitro
digestion system the rheology of the solutions changed. Both flaxseed gum and SSPS
showed complete loss of solid structure and substantial reductions in viscosity. Guar
gum exhibited slight resistance to change and maintained a measurable elastic
component and slightly higher viscosity. On the other hand, xanthan gum maintained
its solid network after a 5 h simulated digestion and had significantly higher viscosity
in comparison to the other treatments. Subsequently, an inverse relationship was
observed between viscosity and RSR, whereby xanthan gum was the most effective at
reducing starch hydrolysis. Moreover, glucose release inside the simulated digesta
was significantly reduced through fibre-fortification where even the fibres with lower
viscosity were able to affect glucose release. However, this result was less apparent
when observing the diffusion of glucose across a dialysis membrane.
109
The effects that fibre-fortified solutions have on the in vitro glycemic response
could be explained by their rheological properties and classifications inside the
simulated digesta. The presence of viscous fibres attenuates the extent by which starch
is hydrolysed, thereby limiting the release of both reducing sugars and glucose.
Moreover, having a gel network present may act to entrap glucose molecules allowing
for blunted diffusion across the membrane. Although these comparisons can be made
by means of in vitro analyses, caution must be taken when attempting to interpret
results from in vitro studies as means of explaining the physiological effects of soluble
fibres. Moreover, these effects on glycemia may not be explained by diffusion alone,
other events, such as gastric emptying, hormonal control or enzyme activity, may be
affected through fibre supplementation, which may be difficult to analyse using
current in vitro techniques. Nonetheless, as a follow up to our study further
investigations on structure-function relationships of soluble fibres will be of great
value in advancing our understanding of the impact they have on glycemic control.
Particular attention should be paid to studying the effects that fibre fortification has on
starch hydrolysis, in order to better explain the findings shown in this study.
110
5. Simulated intestinal hydrolysis of native tapioca starch:
understanding the effect of soluble fibre
Hrvoje Fabek
a and H. Douglas Goff
a,
a Department of Food Science University of Guelph, Guelph, Ontario N1G 2W1,
Canada
Abstract
Starch is an energy reserve found in grains, fruits, stems, roots and tubers and is the
primary energy source in human food and animal feed. Starch structure is directly
related to digestibility, which in turn affects human health. Rapidly available starch
leads to increases in both blood glucose and insulin levels and has been studied
extensively to determine its relation to metabolic diseases, obesity and diabetes.
Soluble fibre has been shown to have a reducing effect on plasma glucose levels,
which is of particular importance due to the rapidly increasing rates in type 2 diabetes.
Researchers speculate that an increase in digesta viscosity is responsible for lowering
glucose in the blood; however, the exact mechanism remains to be elucidated. In the
present study we examined the effect that adding viscous soluble fibres would have on
starch digestibility during simulated intestinal digestion in order to better understand
the mechanism surrounding fibre functionality.
Tapioca starch, a common inclusion in many food products, was formulated with skim
milk powder to act as a control. The treatments consisted of 4 soluble fibres: xanthan
gum, guar gum, soluble flaxseed gum and soy soluble polysaccharide (SSPS) at
constant viscosity. Subsequently, all solutions were exposed to a 3-stage in vitro
111
digestion, mimicking the salivary, gastric, and small intestinal steps. During the final
stage, starch granules were isolated at varying times to observe for changes to granule
structure. Light scattering results showed that the d(4,3) values, which ranged from 16
to 20 μm, decreased as digestion proceeded. Starch degradation was also investigated
using scanning electron and light microscopy. Images from the micrographs showed
evidence of pitting and cracking along the surface of the granules extracted from the
control, flax and SSPS solutions and both endo- and exo-corrosion were observed
upon completion of simulated small intestinal digestion. The progression of these
changes was attenuated for granules that were extracted from the guar gum and
xanthan gum solutions, which we believe is linked to their rheological behaviour as
both solutions had greater viscosities inside the digesta in comparison to the other
treatments. The results of this study suggest that the glucose-lowering ability of
viscous fibres may be related to their ability to reduce the rate at which starch granules
are hydrolysed inside the lumen.
5.1. Introduction
Starch is a major component of our everyday diet as it is the main energy source
in human food. Starch is found encapsulated inside granules in a variety of plant
tissues and organs, including roots, leaves, shoots, fruits, grains, and stems (Eliasson,
2004). In grains, it is abundant in rice, maize, barley, wheat, sorghum, pulses and
tubers (Dona, Pages, Gilbert, and Kuchel, 2010). Most naturally occurring starch
granules consist of two types of polysaccharides, amylose and amylopectin. Both are
polymers consisting of α-(1-4)-D-glucose, where amylose is the smaller of the two,
with a molecular weight (MW) of approximately 106 Da, and is a primarily linear
112
polymer with few branch points along the backbone. Amylopectin on the other hand
consists of a large number of short chains bound at the reducing ends via α-1,6-
linkages, creating a much larger (MW is approximately 108 Da) branched molecule
and it makes up approximately 70% of most starch varieties (Takeda, Hizukuri, and
Juliano, 1986; Dona, Pages, Gilbert, and Kuchel, 2010). Because both polymers are α-
glucans, starch is readily digestible in humans. It is for that reason that starch
digestibility has a tremendous impact on human health. Subsequently, many
researchers have focused their studies on analysing in vitro starch digestibility in order
to better understand the link between food consumption and chronic disease.
Although starch digestion is initiated inside the mouth through the action of
ptyalin (salivary amylase), the majority of it is carried out in the small intestine where
pancreatic α-amylase hydrolyses the polymer into smaller fragments, mainly maltose,
maltotriose and α-limit dextrins that are subsequently hydrolysed to glucose through
the action of brush-border enzymes, which are exo-glucosidases that act on the non-
reducing end of the oligomers, prior to glucose being absorbed (Gray, 1992; Boron
and Boulpaep, 2009). Subsequently, starch can be classified by its in vitro digestibility
(Englyst, Kingman, and Cummings, 1992), where rapidly digestible starch (RDS) is
hydrolysed into glucose within the first 20 min, slowly digestible starch (SDS)
releases glucose between 20 and 120 min, and resistant starch (RS) escapes digestion
in the upper small intestine and is defined as the total starch minus the amount of
glucose released during 120 min of in vitro digestion (Singh, Dartois, and Kaur,
2010). Therefore, unlike RDS, which has been shown to promote metabolic
syndrome, including insulin resistance and diabetes (Byrnes, Miller, and Denyer,

113
1995), RS remains unhydrolysed as it passes through the upper GIT and consequently
has a negligible effect on the glucose response. In addition to enzymatic hydrolysis
being affected by the physicochemical properties of the starch granules themselves,
incorporation of non-starch polysaccharides, specifically soluble fibres, have been
associated with glycemic reductions.
Soluble fibres thicken when they come in contact with digestive secretions and it
is through this increase in viscosity that soluble fibres are believed to have an effect
on glycemic reductions, as shown through both in vitro and in vivo studies (Dikeman
and Fahey Jr., 2007; Brownlee, 2011). Despite accumulating research studies
indicating the ability of soluble fibres to decrease the rate of starch degradation, the
exact mechanism(s) by which they are able to do so remain unclear. Although studies
have been done that have examined how rheological properties might impact starch
hydrolysis (Sasaki and Kohyama, 2012, Fabek et al., 2014), the researchers use sugar
release as an indicator of starch digestibility.
Recently, we reported on the ability of different fibres to not only reduce the
amount of glucose that is being liberated and diffused throughout simulated digestion,
but also the impact they have on lowering reducing sugar release. The findings of our
study indicated that soluble fibre functionality, as it pertains to in vitro glycemic
reductions, may be multi-faceted through reducing both luminal digestion of starch
and the subsequent release/mobility of glucose (Chapter 4). However, the study was
conducted using quantitative analyses of starch digestion. Brennan (2005) suggested
a potential effect of soluble fibre-induced viscosity on altering starch granule
digestion. Moreover, interactions of starch with dietary fibre in pasta and cereal
114
products have been shown to reduce starch digestion thereby lowering the glycemic
response (Granfeldt and Bjorck, 1991; Brennan and Tudorica, 2008; Aravind, Sissons,
and Fellows, 2012). However, few studies have examined the rheological properties
of fibres during simulated digestion and how they relate to starch degradation and
even fewer studies examine the effects of different types of soluble fibres. Although
most human foods that contain starch are cooked (gelatinized), cooking can greatly
modify, degrade and even destroy granular structure (Dona et al., 2010).
Subsequently, most studies using fibre-enriched foods such as cereals, pastas, and
breads allow for starch gelatinization, which makes it difficult to visualize the likely
changes occurring to the microstructure of starch granules. Despite numerous research
studies looking at the effects of dietary fibres on starch digestion, it remains unclear as
to how different types of fibre are able to impact the hydrolysis of starch granules and
therefore moderate the in vitro glycemic response.
This study was undertaken as a follow up to our earlier work, which focused on
the effects of soluble fibre inclusion on reducing sugar release (RSR) and glucose
liberation. The aim of the present study is to investigate the effects that viscous fibres,
xanthan gum (XG), guar gum (GG), soluble flaxseed gum (SFG), and soy soluble
polysaccharide (SSPS) have on (uncooked) starch granules during in vitro digestion.
Granules were extracted and purified from digesta at different times of simulated
small intestinal digestion to observe for changes in particle size using light scattering.
Microscopy analyses were also performed on isolated starch granules to visualize
changes occurring in surface topography using scanning electron microscopy and light
microscopy.
115
5.2. Materials and methods
5.2.1. Materials
Four hydrocolloids were employed in this study, which included guar gum,
(Danisco Canada Inc., Toronto, ON, Canada), xanthan gum (Sigma Chemical CO., St.
Louis, MO, USA), soluble flaxseed gum extracted from flaxseed hulls (Fabek et al.,
2014), and DA-100 variety soy soluble polysaccharides (Fuji Oil Co. Ltd., Osaka,
Japan). Tapioca starch (batch number H88 80008) was purchased from Ingredion
(Bridgewater, NJ, USA). Skim milk powder was purchased from Gay Lea Food Corp.
(Mississauga, ON, Canada). Study-specific enzymes and chemicals were purchased
from the following distributors: simulated gastric fluid (SGF) from Ricca Chemical
Company (Arlington, TX, USA), purified pepsin, sodium phosphate monobasic
monohydrate, sodium phosphate dibasic anhydrous, potassium chloride, potassium
citrate, potassium phosphate, and sodium chloride from Fisher Scientific (Fair Lawn,
NJ, USA), pancreatin from MP Biomedicals (Solon, OH, USA), α-amylase,
amyloglucosidase (Aspergillius niger), mucin from porcine stomach, sodium L-
lactate, ammonium nitrate, urea, and uric acid sodium salt from Sigma-Aldrich (St.
Louis, MO, USA), hydrochloric acid 2N solution and glycerol from Fisher Scientific
(Nepean, ON, Canada), bile salts from Fisher Science Education (Hanover Park, IL,
USA) anhydrous ethyl alcohol from Commercial Alcohols, the industrial and
beverage alcohol division of GreenField Ethanol Inc. (Brampton, ON, Canada).
116
5.2.2. Sample preparation
Solutions of commercial (native) tapioca starch and skim milk powder (SMP)
were prepared by dissolving weighed amounts of each in deionised water. To
investigate the effect of soluble fibre inclusion, XG, GG, SFG and SSPS were added,
according to their matched apparent viscosities at 20 s-1
(Chapter 4). The final
concentrations of XG, GG, SFG, and SSPS were 4% w/w, 3% w/w, 7% w/w and 20%
w/w, respectively, and all solutions contained the same concentration of starch (4%
w/w) and SMP (8.65% w/w). The solutions were left to stir until fully dissolved and
the control sample (no fibre) was left to stir at room temperature until experimentation
to avoid sedimentation of starch granules. All solutions were prepared at room
temperature to avoid granule swelling and amylose leaching in order to preserve the
granular structure of starch.
5.2.3. In vitro digestion
All treatments were digested using a three-stage in vitro digestion procedure,
mimicking salivary, gastric, and small intestinal digestion, adapted from our earlier
studies (Fabek et al., 2014; Fabek and Goff, 2015). In short, 15 g samples with 4 glass
balls (to induce churning) were preincubated with artificial salivary fluid (5.0 mL)
containing alpha amylase (75 U mL-1
) for 5 min inside a shaking water bath (Thermo
Scientific, Marietta, OH, USA) at 37oC, at a speed of 60 rpm, mimicking the agitation
speed during swallowing (Borwankar, 1992). The ensuing digest was then exposed to
7 mL simulated gastric fluid, [0.2%NaCl (w/w) in 0.7% HCl (w/v)], containing 3.2
mg mL-1
of pepsin (pH = 1.8 ±0.1). The mixture was incubated at 37oC, at a speed of
117
175 rpm, for 1 h. Following simulated gastric digestion, 4.6 mL simulated bile fluid
(SBF), containing 8 mg mL-1
bile salts, 14 mL simulated intestinal fluid (SIF), pH 7.6
±0.1, containing 5 mg mL-1
pancreatin dissolved in 0.5M sodium phosphate buffer
and calcium chloride solution, and 2.9 mL of amyloglucosidase (112 U/mL) were
added to each solution. The mixture was placed back in the shaking water bath and
simulated intestinal digestion proceeded at 37oC for 4 h. All digestions were
performed in triplicate.
5.2.4. Viscosity measurements
Study treatment viscosity was measured using a cone and plate configuration
(cone radius of 60 mm, a truncation gap of 50.8 μm, and an angle of 2°) on a
controlled-stress rheometer (AR 2000; TA Instruments, New Castle, DE, USA). Flow
behaviour was measured by applying a continuous shear rate sweep from 10 to 200 s−1
with 37 sample points. The comparative shear rate range of 20 – 60 s−1
was selected
based on earlier reports that this is the approximate shear rate during digestion
(Borwankar, 1992; Steffe, 1996). Viscosity of the digesta was also measured during
simulated small intestinal digestion and represented by the consistency index (K
value) of the Power Law model (Fabek et al., 2014). All measurements were
performed in triplicate.
5.2.5. Isolation and purification of starch granules for morphological study
Starch granules were isolated at varying times from the in vitro digesta using a
modified method of Hasjim, Lavau, Gidley, and Gilbert (2010). Aliquots of digesta
(30 mL) were filtered under vacuum through a screen with 500 μm openings.
Subsequently, the residue remaining on the screen was washed with sodium chloride
118
(0.1 M, 100 mL) and the filtrate was filtered again and the screen washed a second
time with sodium chloride solution. Toluene (75 mL) was added to the final filtrate
and stirred for 2 h. The mixture was then left to sit until the starch granules
sedimented and an emulsion layer of denatured protein formed on the top. The protein
and sodium chloride solution were discarded and another 75 mL toluene was added to
the starch layer and mixed for an additional 30 min. The mixture was once more left
to sit until the remaining protein was removed, which was evidenced by a clear
toluene solution following sedimentation of starch granules. The granules were
washed four times with 4 mL deionized water and 10 mL absolute ethanol. The
mixture was then transferred into centrifuge tubes and centrifuged at 4500 rpm for 10
min using a Heraeus Multifuge X1R centrifuge (ThermoFisher Scientific, MA, USA)
in order to separate the starch. The granules were collected and left to dry for 72 h at
room temperature inside a fumehood to prepare for further analysis. The protein
content of the starch was determined using the dumas method and was observed to be
0.4% ± 0.03 for all granules isolated from each of the five treatments.
5.2.6. Particle Size Analysis
Particle size analysis of isolated starch granules was carried out using a
Malvern Mastersizer Hydro 2000 SM (Malvern Instruments Ltd., Malvern WR14
1XZ, Worcestershire, UK). The granules were suspended in water and stirred at 2800
rpm. A general purpose analysis model was employed with particle refractive indices
of 1.52 and 0.001, respectively, while the refractive index of the dispersant (water)
was 1.33. Background corrections and system alignment were conducted before each
measurement. Particle size was defined as the volume weighted mean (d[4,3]).
119
5.2.7. Scanning electron microscopy (SEM)
Morphologies of digested starch granules isolated from the control (no fibre),
XG-, GG-, SFG- and SSPS-fortified solutions were analysed before and throughout
simulated small intestinal digestion. Observations were made after 0 h (before
addition of amyloglucosidase), 1 h, 2h, and 4h of amylolysis, by using a Hitachi
scanning electron microscope (S570, Nissei Sangyo Inc., Rexdale, ON, Canada) at an
accelerating potential of 20 kV. Dry starch samples were brushed onto the surface of
double-sided carbon adhesive tape mounted on an aluminum stub and subsequently
coated with 20 nm of gold in an argon atmosphere. Fifteen frames of pictures of each
sample were taken to represent the morphology of isolated starch granules.
5.2.8. Light microscopy
Starch granules isolated from in vitro digesta were suspended in 50% glycerol
(v/v) and observed under a light microscope (magnification 40x) using an Olympus
BX60 trinocular microscope (Olympus America Inc., Center Valley, PA, USA)
equipped with cellSens Entry 1.9 digital imaging software, which was used for image
capture.
5.2.9. Statistical analysis
Analytical determinations and all experiments were performed in triplicate.
Analysis of variance (ANOVA) was done to determine both means and standard
deviations and a comparison of means was performed using Tukey’s Multiple
Comparison testing at a 5% level of significance using GraphPad software (GraphPad
Prism Software Inc., La Jolla, CA, USA).
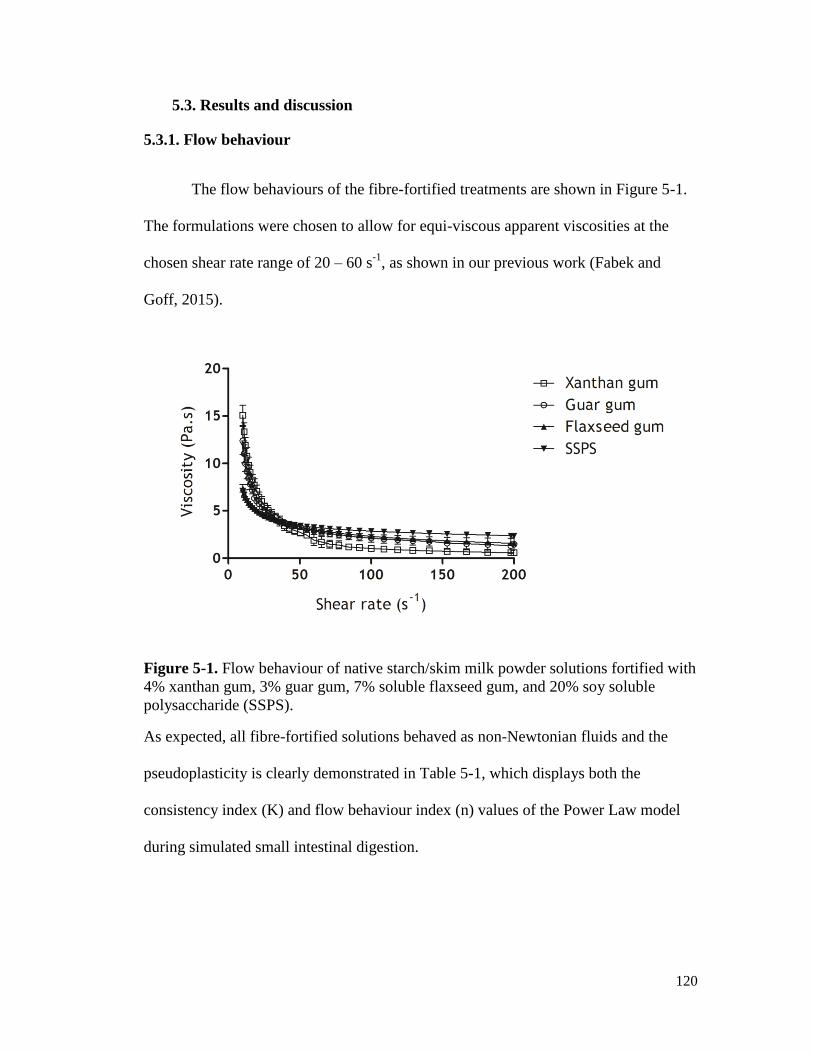
120
5.3. Results and discussion
5.3.1. Flow behaviour
The flow behaviours of the fibre-fortified treatments are shown in Figure 5-1.
The formulations were chosen to allow for equi-viscous apparent viscosities at the
chosen shear rate range of 20 – 60 s-1
, as shown in our previous work (Fabek and
Goff, 2015).
Figure 5-1. Flow behaviour of native starch/skim milk powder solutions fortified with
4% xanthan gum, 3% guar gum, 7% soluble flaxseed gum, and 20% soy soluble
polysaccharide (SSPS).
As expected, all fibre-fortified solutions behaved as non-Newtonian fluids and the
pseudoplasticity is clearly demonstrated in Table 5-1, which displays both the
consistency index (K) and flow behaviour index (n) values of the Power Law model
during simulated small intestinal digestion.
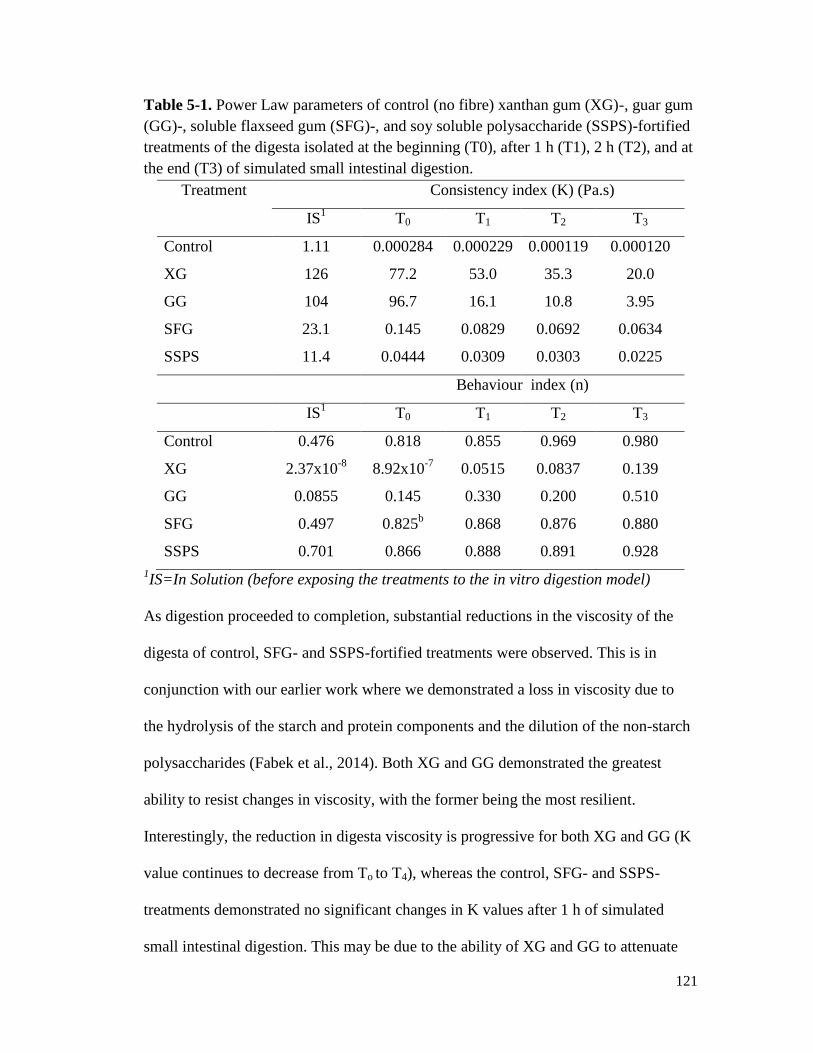
121
Table 5-1. Power Law parameters of control (no fibre) xanthan gum (XG)-, guar gum
(GG)-, soluble flaxseed gum (SFG)-, and soy soluble polysaccharide (SSPS)-fortified
treatments of the digesta isolated at the beginning (T0), after 1 h (T1), 2 h (T2), and at
the end (T3) of simulated small intestinal digestion.
Treatment Consistency index (K) (Pa.s)
IS1
T0 T1 T2 T3
Control 1.11 0.000284 0.000229
0.000119
0.000120
XG 126 77.2 53.0 35.3 20.0
GG 104 96.7 16.1 10.8 3.95
SFG 23.1 0.145 0.0829 0.0692 0.0634
SSPS 11.4 0.0444 0.0309 0.0303 0.0225
Behaviour index (n)
IS1
T0 T1 T2 T3
Control 0.476 0.818
0.855 0.969 0.980
XG 2.37x10⁻⁸
8.92x10⁻⁷
0.0515 0.0837 0.139
GG 0.0855 0.145
0.330 0.200 0.510
SFG 0.497 0.825b
0.868 0.876 0.880
SSPS 0.701 0.866
0.888 0.891 0.928
1IS=In Solution (before exposing the treatments to the in vitro digestion model)
As digestion proceeded to completion, substantial reductions in the viscosity of the
digesta of control, SFG- and SSPS-fortified treatments were observed. This is in
conjunction with our earlier work where we demonstrated a loss in viscosity due to
the hydrolysis of the starch and protein components and the dilution of the non-starch
polysaccharides (Fabek et al., 2014). Both XG and GG demonstrated the greatest
ability to resist changes in viscosity, with the former being the most resilient.
Interestingly, the reduction in digesta viscosity is progressive for both XG and GG (K
value continues to decrease from To to T4), whereas the control, SFG- and SSPS-
treatments demonstrated no significant changes in K values after 1 h of simulated
small intestinal digestion. This may be due to the ability of XG and GG to attenuate

122
starch hydrolysis. In our earlier study we observed suppressive effects of both gums
on RSR and glucose release, with XG (the most viscous fibre) eliciting the greatest
effect on the subsequent release of sugars. As a result, the progressive breakdown of
starch in the solutions could explain why there is a gradual loss in viscosity. The
ability of XG to resist rheological changes during in vitro digestion was discussed in
our earlier work (Chapter 4) and remains consistent in the present study despite the
substitution for native (non-gelatinized) starch. The behaviour index values
demonstrate that all treatments behaved as shear-thinning solutions before being
subjected to the in vitro digestion model, with a high dependence on shear rate. This
trend was less apparent as hydrolysis continued, with the control, SFG- and SSPS-
fortified solutions behaving as Newtonian fluids upon completion of simulated small
intestinal digestion (n values close to 1). Moreover, despite an increase in the n value,
the unique helical conformation of XG allowed it to remain strongly shear-thinning
throughout in vitro digestion.
5.3.2. Particle size distribution of hydrolysed starch granules
The presence of soluble fibres in solution influenced the particle size of the
starch granules, and generally, the lower the viscosity of the medium the smaller the
size, as shown in Table 5-2. Further discussion concentrated on the volume weighted
mean (d[4,3]) will be simply referred to as particle size.

123
Table 5-2. Apparent viscosity of simulated digesta and particle size [as defined by the
volume weighted mean d(4,3)] of granules isolated from in vitro digesta before the
addition of amyloglucosidase (T0) after 1 h (T1), 2 h (T3), and 4 h (T3) of simulated
small intestinal digestion.
Treatment Apparent viscosity of digesta (Pa.s)1
T0 T1 T2 T3
Control 0.0001825d
0.0001375c
0.0001067d
0.0001193d
XG 1.515b
1.329a
0.9314a
0.7895a
GG 3.058a
1.097a
0.5548b
0.4288b
SFG 0.0762c
0.04938b
0.0423c
0.04096c
SSPS 0.02736c
0.01989b
0.01985c
0.01751c
Volume weighted mean d(4,3) (µm)
T0 T1 T2 T3
Control 18.62b 16.65
b 16.00
b 15.90
b
XG 166.9a 101.9
a 78.94
a 42.86
a
GG 175.1a 91.92
a 82.88
a 63.64
a
SFG 20.49b 18.55
b 18.33
b 18.00
b
SSPS 17.13b 16.74
b 16.73
b 16.22
b
1Apparent viscosity was measured at 50 s
-1
Figures 5-2, 5-3, 5-4, and 5-5 illustrate the particle size distribution patterns of starch
granules isolated at the beginning, following 1 h, following 2h, and at the end of
simulated small intestinal digestion, respectively. The results show primarily
unimodal particle size distributions (5 – 50 μm), which corresponds with literature
values for granule size distributions of tapioca starch, reported to be in the range of 5 -
40 μm (Eliasson, 2004). Interestingly, the granules extracted from XG and GG digesta
show bimodal size distributions patterns (5-60 and 60 – 1000 μm) and much higher
particle sizes for both (Table 5-2).

124
Figure 5-2. Particle size distribution of starch granules isolated from the in vitro
digesta of control- and fibre-fortified solutions at the beginning of simulated small
intestinal hydrolysis.
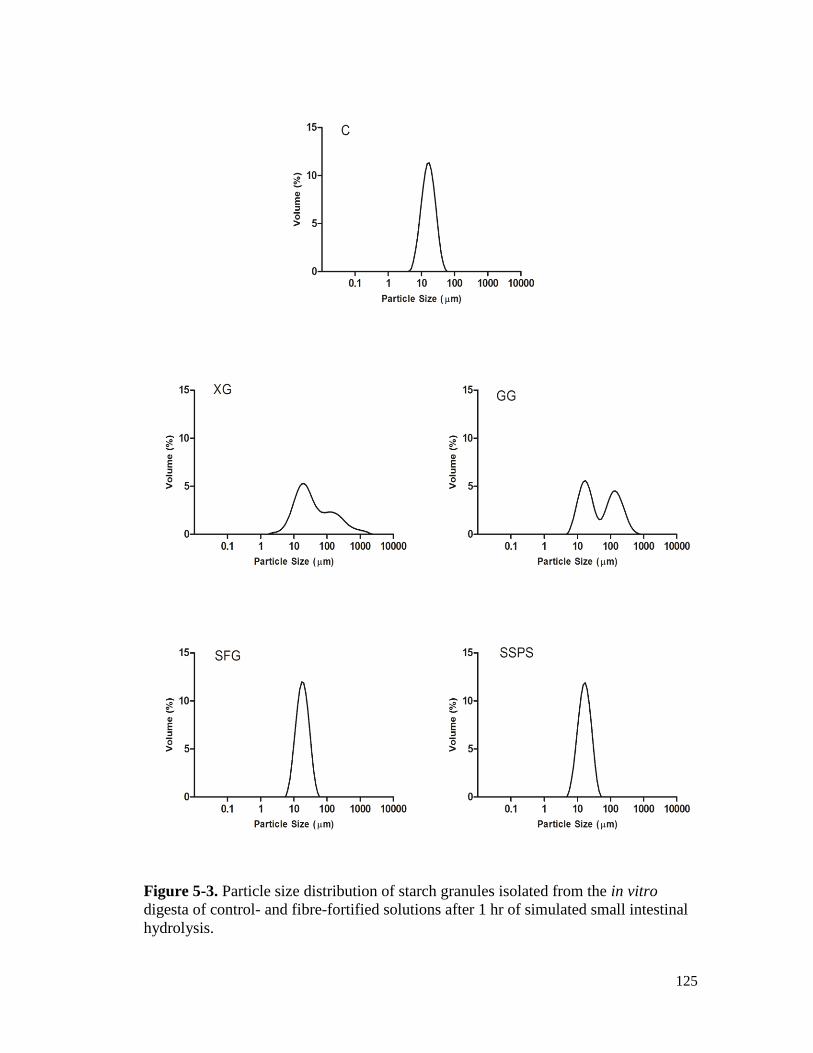
125
Figure 5-3. Particle size distribution of starch granules isolated from the in vitro
digesta of control- and fibre-fortified solutions after 1 hr of simulated small intestinal
hydrolysis.
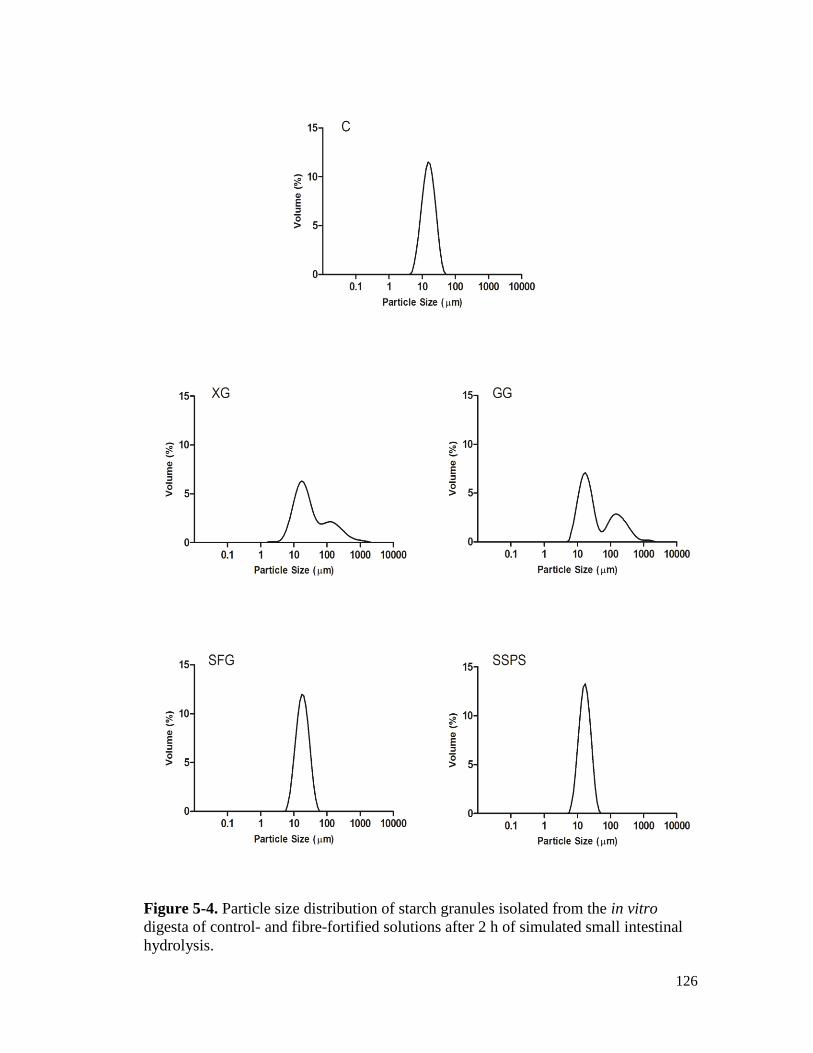
126
Figure 5-4. Particle size distribution of starch granules isolated from the in vitro
digesta of control- and fibre-fortified solutions after 2 h of simulated small intestinal
hydrolysis.
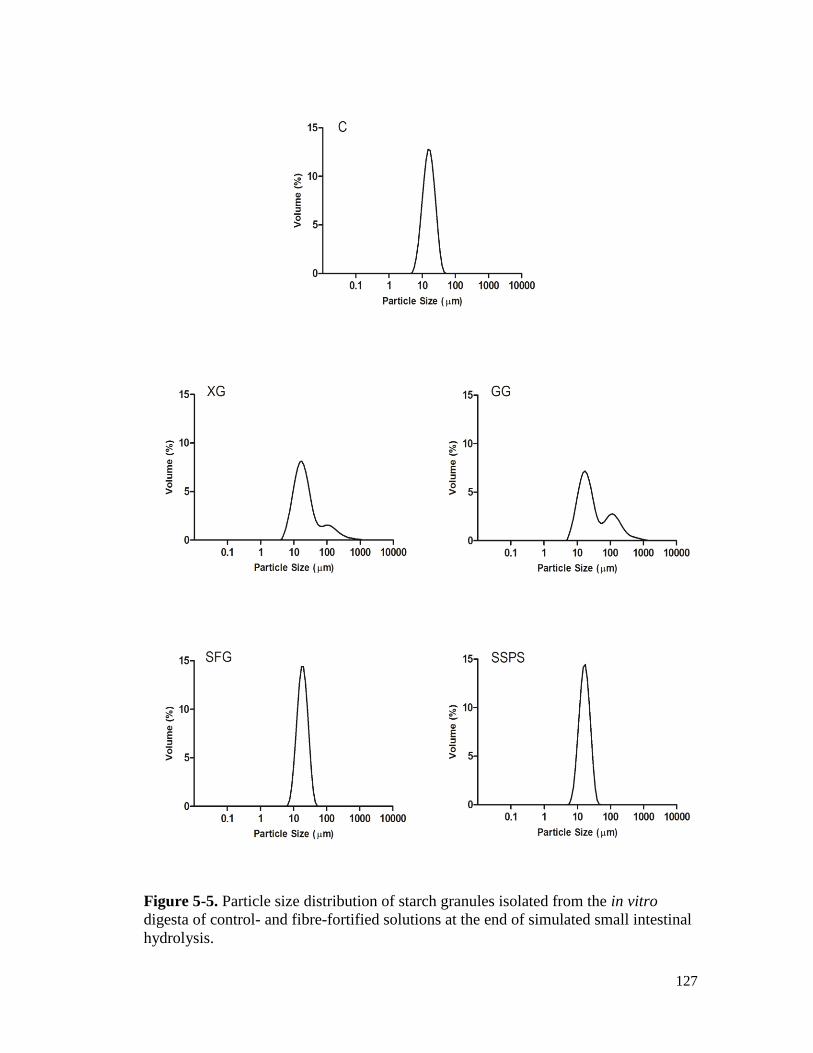
127
Figure 5-5. Particle size distribution of starch granules isolated from the in vitro
digesta of control- and fibre-fortified solutions at the end of simulated small intestinal
hydrolysis.
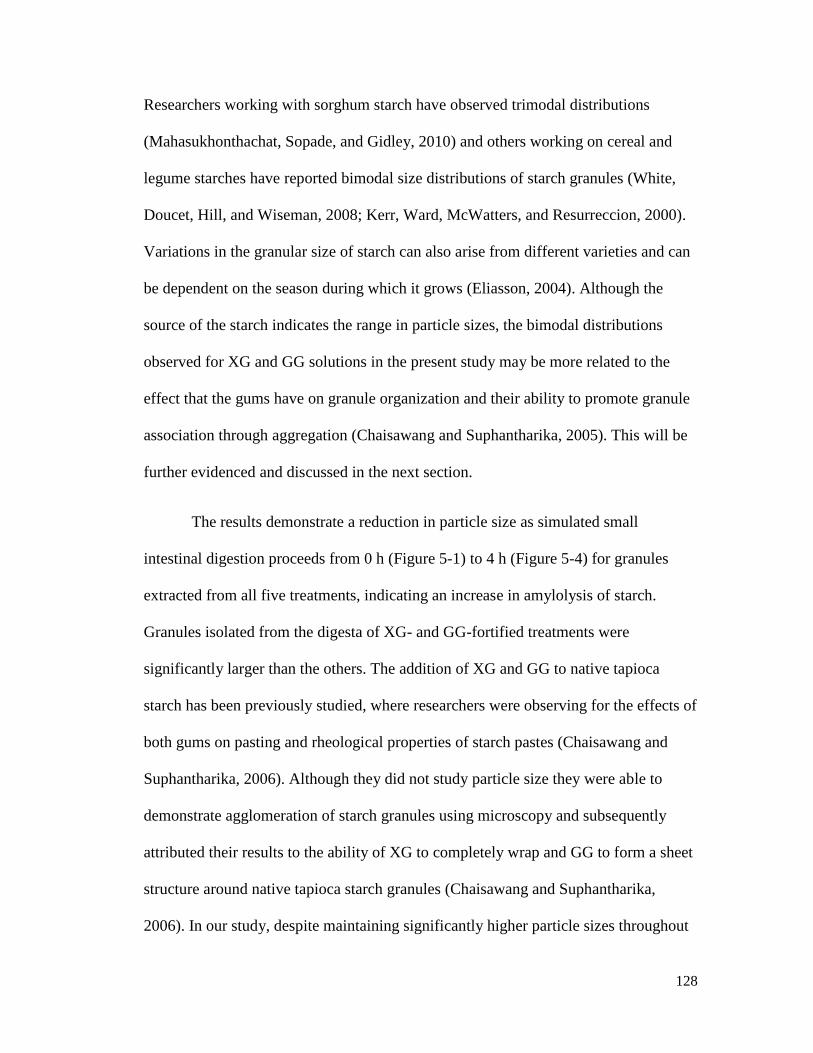
128
Researchers working with sorghum starch have observed trimodal distributions
(Mahasukhonthachat, Sopade, and Gidley, 2010) and others working on cereal and
legume starches have reported bimodal size distributions of starch granules (White,
Doucet, Hill, and Wiseman, 2008; Kerr, Ward, McWatters, and Resurreccion, 2000).
Variations in the granular size of starch can also arise from different varieties and can
be dependent on the season during which it grows (Eliasson, 2004). Although the
source of the starch indicates the range in particle sizes, the bimodal distributions
observed for XG and GG solutions in the present study may be more related to the
effect that the gums have on granule organization and their ability to promote granule
association through aggregation (Chaisawang and Suphantharika, 2005). This will be
further evidenced and discussed in the next section.
The results demonstrate a reduction in particle size as simulated small
intestinal digestion proceeds from 0 h (Figure 5-1) to 4 h (Figure 5-4) for granules
extracted from all five treatments, indicating an increase in amylolysis of starch.
Granules isolated from the digesta of XG- and GG-fortified treatments were
significantly larger than the others. The addition of XG and GG to native tapioca
starch has been previously studied, where researchers were observing for the effects of
both gums on pasting and rheological properties of starch pastes (Chaisawang and
Suphantharika, 2006). Although they did not study particle size they were able to
demonstrate agglomeration of starch granules using microscopy and subsequently
attributed their results to the ability of XG to completely wrap and GG to form a sheet
structure around native tapioca starch granules (Chaisawang and Suphantharika,
2006). In our study, despite maintaining significantly higher particle sizes throughout
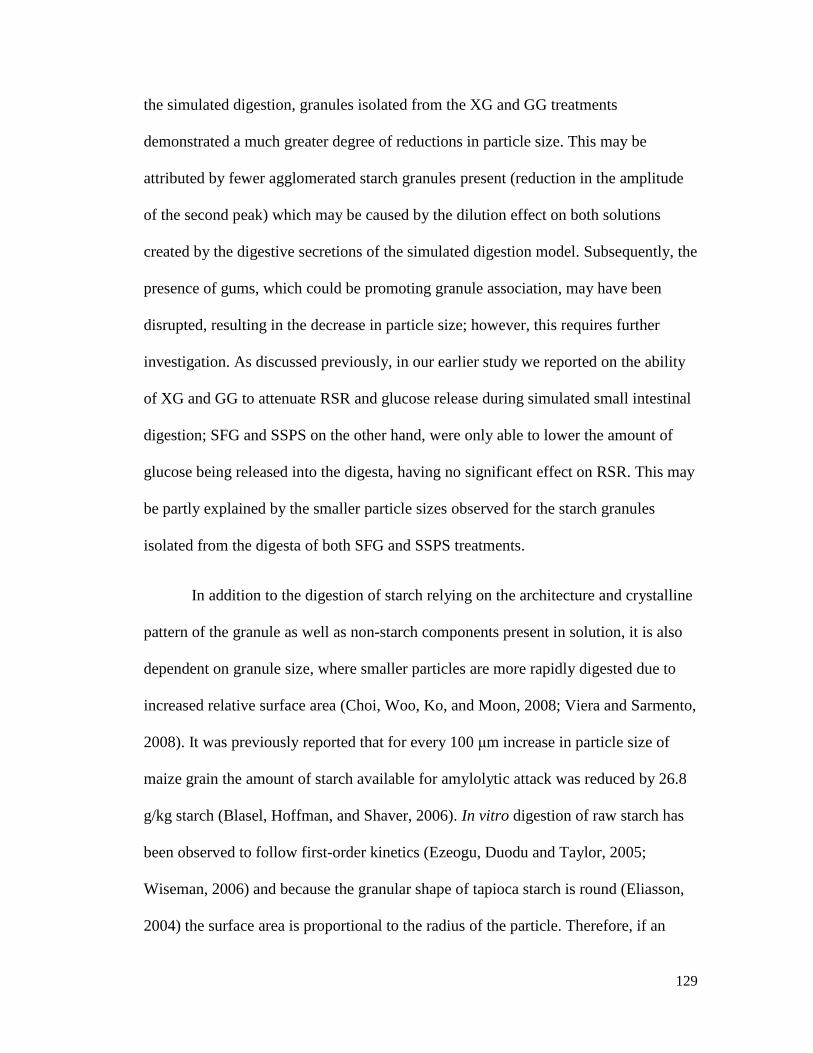
129
the simulated digestion, granules isolated from the XG and GG treatments
demonstrated a much greater degree of reductions in particle size. This may be
attributed by fewer agglomerated starch granules present (reduction in the amplitude
of the second peak) which may be caused by the dilution effect on both solutions
created by the digestive secretions of the simulated digestion model. Subsequently, the
presence of gums, which could be promoting granule association, may have been
disrupted, resulting in the decrease in particle size; however, this requires further
investigation. As discussed previously, in our earlier study we reported on the ability
of XG and GG to attenuate RSR and glucose release during simulated small intestinal
digestion; SFG and SSPS on the other hand, were only able to lower the amount of
glucose being released into the digesta, having no significant effect on RSR. This may
be partly explained by the smaller particle sizes observed for the starch granules
isolated from the digesta of both SFG and SSPS treatments.
In addition to the digestion of starch relying on the architecture and crystalline
pattern of the granule as well as non-starch components present in solution, it is also
dependent on granule size, where smaller particles are more rapidly digested due to
increased relative surface area (Choi, Woo, Ko, and Moon, 2008; Viera and Sarmento,
2008). It was previously reported that for every 100 μm increase in particle size of
maize grain the amount of starch available for amylolytic attack was reduced by 26.8
g/kg starch (Blasel, Hoffman, and Shaver, 2006). In vitro digestion of raw starch has
been observed to follow first-order kinetics (Ezeogu, Duodu and Taylor, 2005;
Wiseman, 2006) and because the granular shape of tapioca starch is round (Eliasson,
2004) the surface area is proportional to the radius of the particle. Therefore, if an
130
enzyme diffuses onto the surface of spherical particles the rate at which they are
digested is related to the average particle size (Al-Rabadi, Gilbert and Gidley, 2009;
Mahasukhonthachat et al., 2010). Although this requires further investigation,
reductions in RSR observed in our earlier study (Chapter 4) may be related to not only
the viscosity that XG and GG are able to promote but also their ability to allow
granules to come together. If the primary step in starch digestion is the diffusion of
enzymes onto the surface of starch granules then it is plausible that XG and GG are
more efficient at lowering the rate of starch hydrolysis (and therefore the release of
RSR) by not only reducing the diffusion of amylase enzymes inside the simulated
lumen but by also increasing the particle size of starch granules; subsequently, leading
to a reduction in the relative surface area being exposed to amylolytic attack.
5.3.3. Starch Morphology
5.3.3.1. Scanning electron microscopy (SEM)
SEM micrographs of native (unhydrolysed) starch granules isolated from the
five different treatments are presented in Figure 5-6. The surface of the granules
appears smooth with no indication of granular degradation, which would be evidenced
through the manifestation of cracks, pores or fissures along the exterior of the starch
granule. Although there was heterogeneity in the observed size, the majority of the
starch granules ranged between 10 and 50 µm, with some granules adhering to each
other as shown in Figure 5-6.
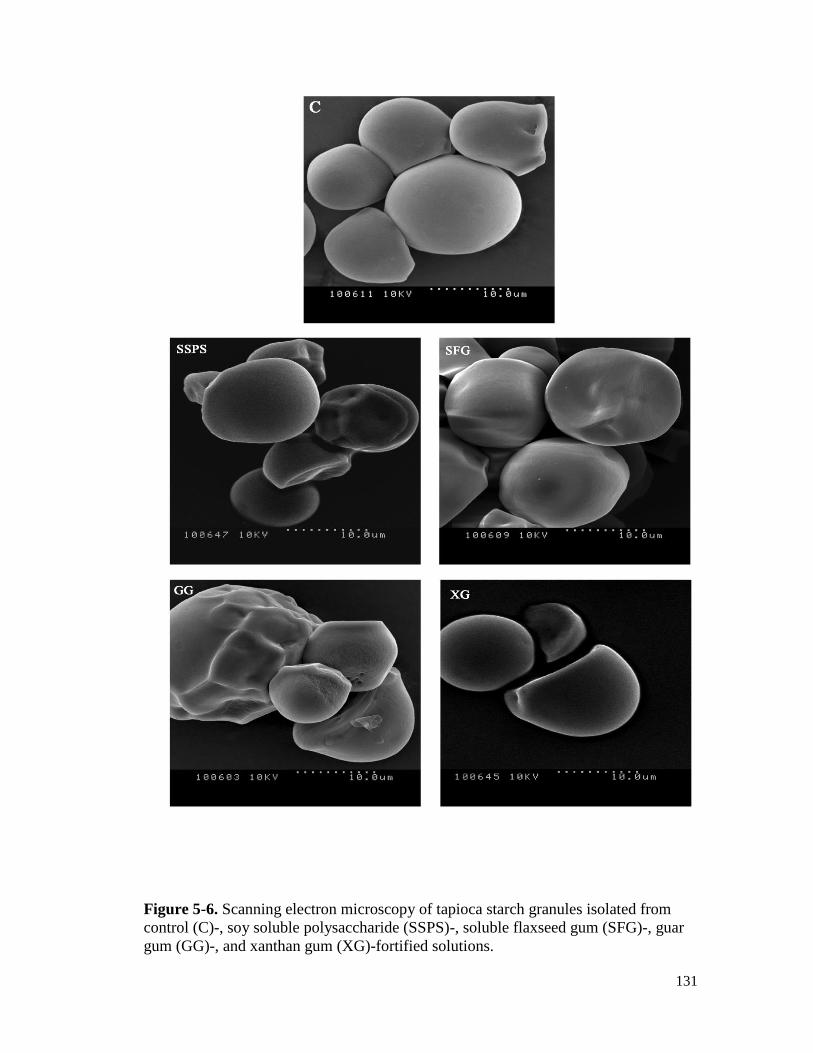
131
Figure 5-6. Scanning electron microscopy of tapioca starch granules isolated from
control (C)-, soy soluble polysaccharide (SSPS)-, soluble flaxseed gum (SFG)-, guar
gum (GG)-, and xanthan gum (XG)-fortified solutions.
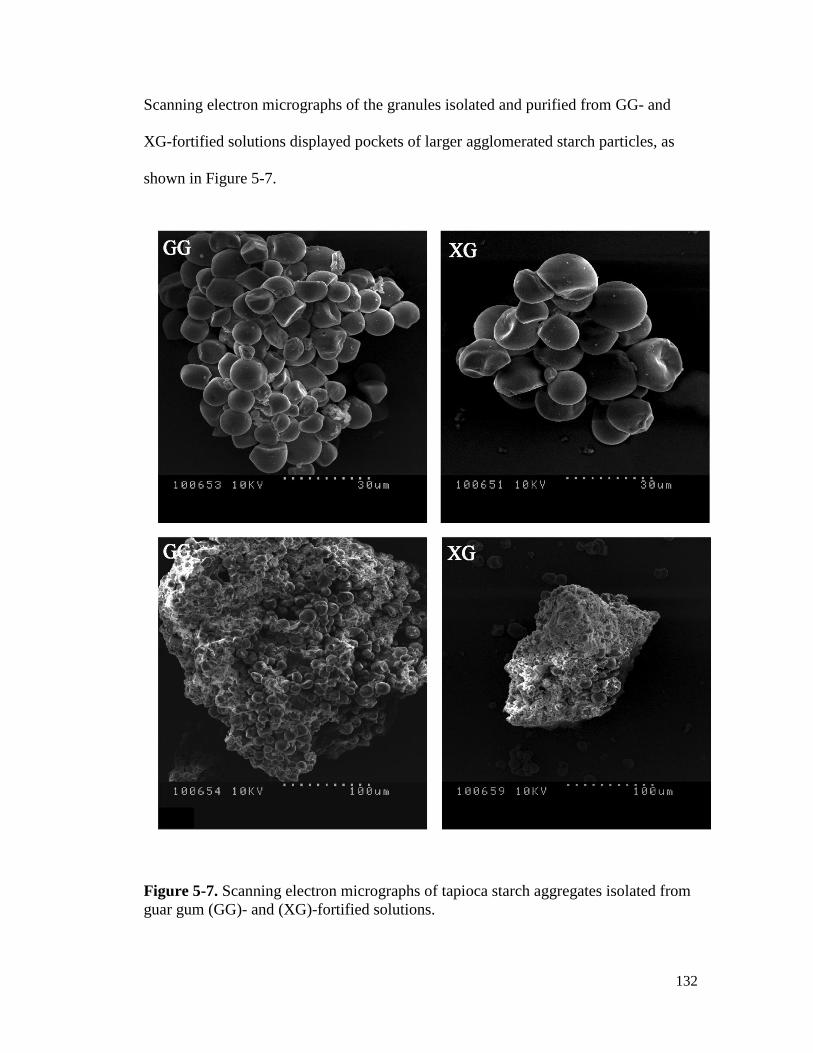
132
Scanning electron micrographs of the granules isolated and purified from GG- and
XG-fortified solutions displayed pockets of larger agglomerated starch particles, as
shown in Figure 5-7.
Figure 5-7. Scanning electron micrographs of tapioca starch aggregates isolated from
guar gum (GG)- and (XG)-fortified solutions.
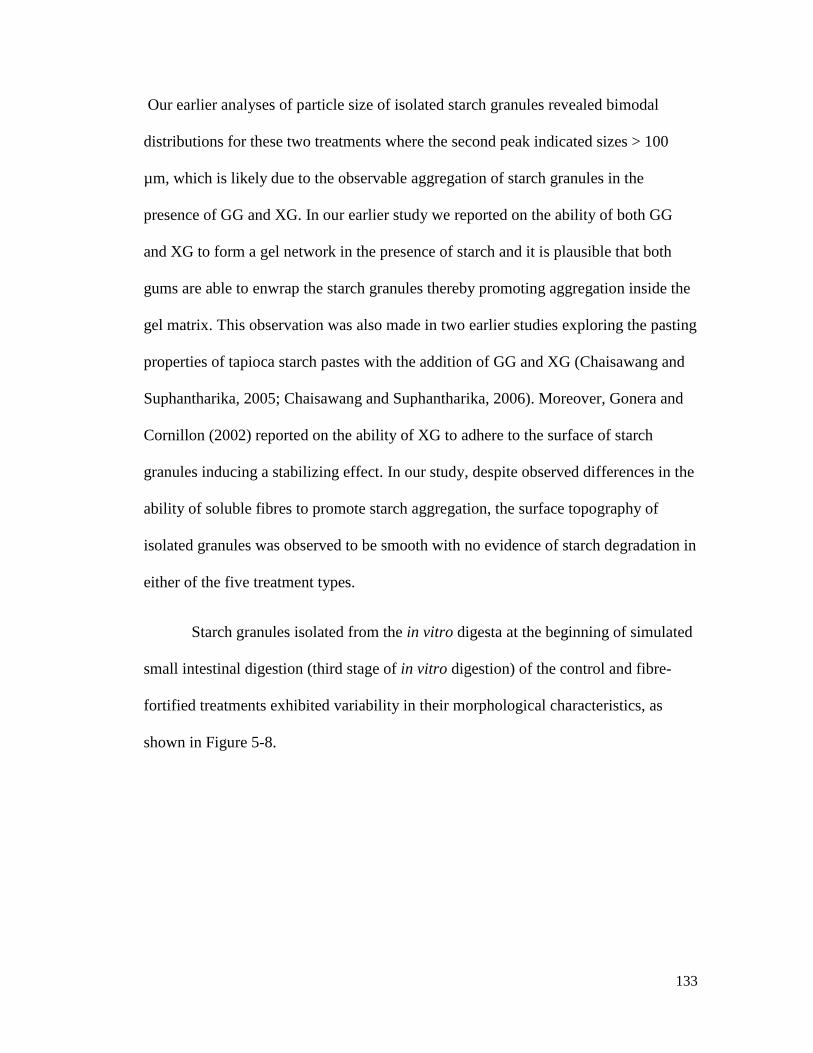
133
Our earlier analyses of particle size of isolated starch granules revealed bimodal
distributions for these two treatments where the second peak indicated sizes > 100
µm, which is likely due to the observable aggregation of starch granules in the
presence of GG and XG. In our earlier study we reported on the ability of both GG
and XG to form a gel network in the presence of starch and it is plausible that both
gums are able to enwrap the starch granules thereby promoting aggregation inside the
gel matrix. This observation was also made in two earlier studies exploring the pasting
properties of tapioca starch pastes with the addition of GG and XG (Chaisawang and
Suphantharika, 2005; Chaisawang and Suphantharika, 2006). Moreover, Gonera and
Cornillon (2002) reported on the ability of XG to adhere to the surface of starch
granules inducing a stabilizing effect. In our study, despite observed differences in the
ability of soluble fibres to promote starch aggregation, the surface topography of
isolated granules was observed to be smooth with no evidence of starch degradation in
either of the five treatment types.
Starch granules isolated from the in vitro digesta at the beginning of simulated
small intestinal digestion (third stage of in vitro digestion) of the control and fibre-
fortified treatments exhibited variability in their morphological characteristics, as
shown in Figure 5-8.
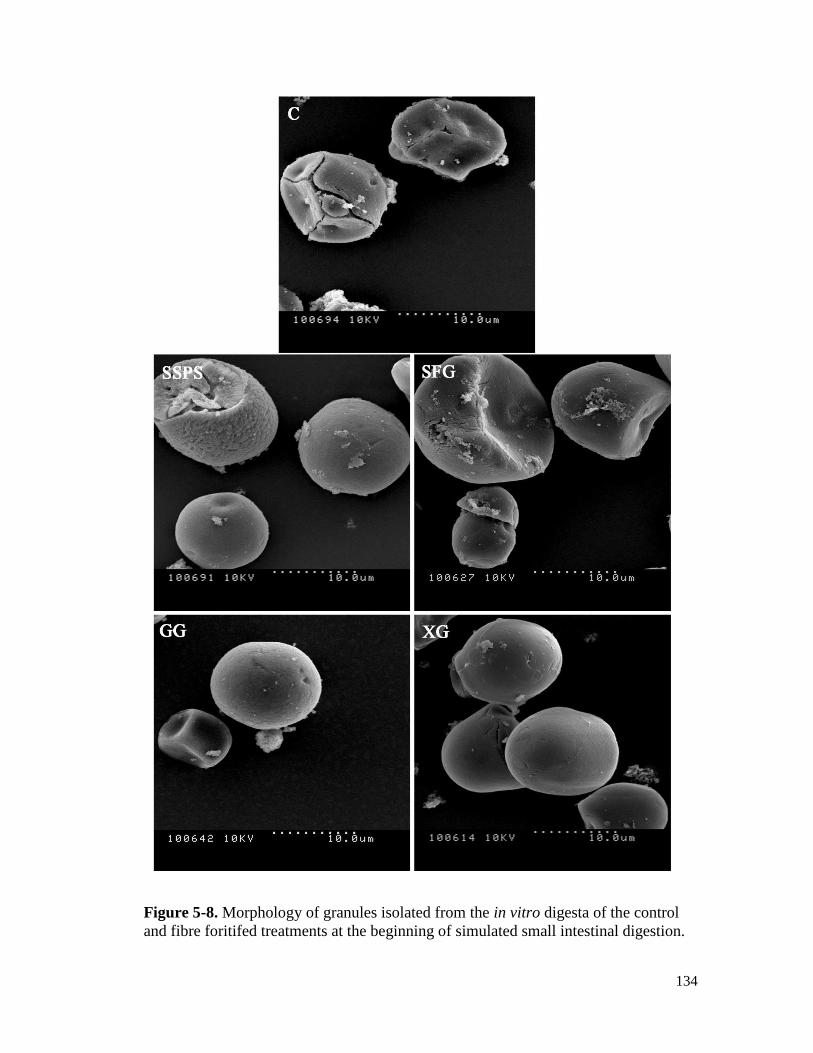
134
Figure 5-8. Morphology of granules isolated from the in vitro digesta of the control
and fibre foritifed treatments at the beginning of simulated small intestinal digestion.
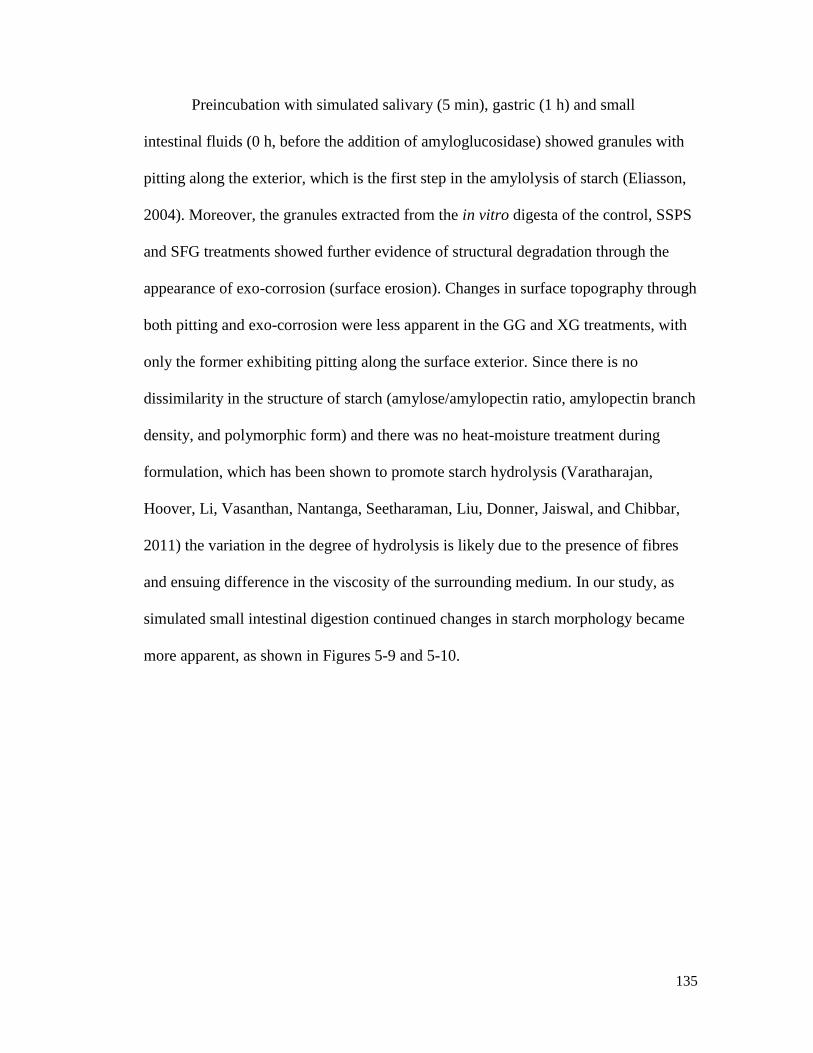
135
Preincubation with simulated salivary (5 min), gastric (1 h) and small
intestinal fluids (0 h, before the addition of amyloglucosidase) showed granules with
pitting along the exterior, which is the first step in the amylolysis of starch (Eliasson,
2004). Moreover, the granules extracted from the in vitro digesta of the control, SSPS
and SFG treatments showed further evidence of structural degradation through the
appearance of exo-corrosion (surface erosion). Changes in surface topography through
both pitting and exo-corrosion were less apparent in the GG and XG treatments, with
only the former exhibiting pitting along the surface exterior. Since there is no
dissimilarity in the structure of starch (amylose/amylopectin ratio, amylopectin branch
density, and polymorphic form) and there was no heat-moisture treatment during
formulation, which has been shown to promote starch hydrolysis (Varatharajan,
Hoover, Li, Vasanthan, Nantanga, Seetharaman, Liu, Donner, Jaiswal, and Chibbar,
2011) the variation in the degree of hydrolysis is likely due to the presence of fibres
and ensuing difference in the viscosity of the surrounding medium. In our study, as
simulated small intestinal digestion continued changes in starch morphology became
more apparent, as shown in Figures 5-9 and 5-10.
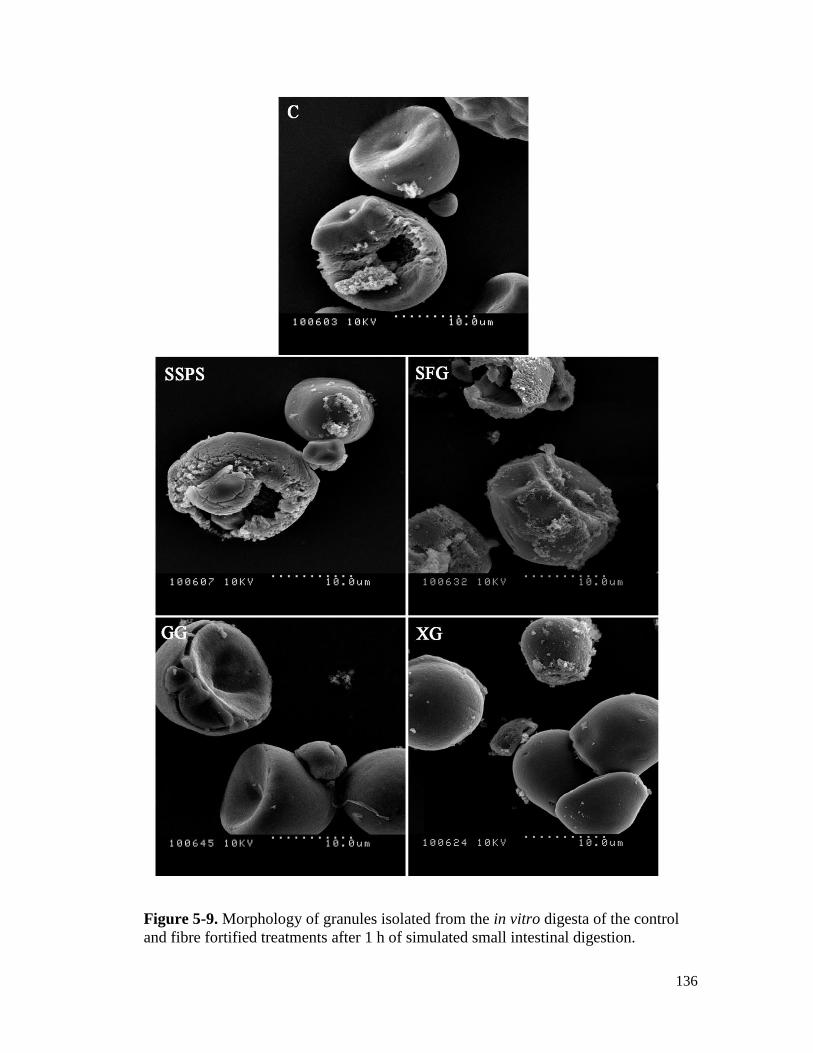
136
Figure 5-9. Morphology of granules isolated from the in vitro digesta of the control
and fibre fortified treatments after 1 h of simulated small intestinal digestion.
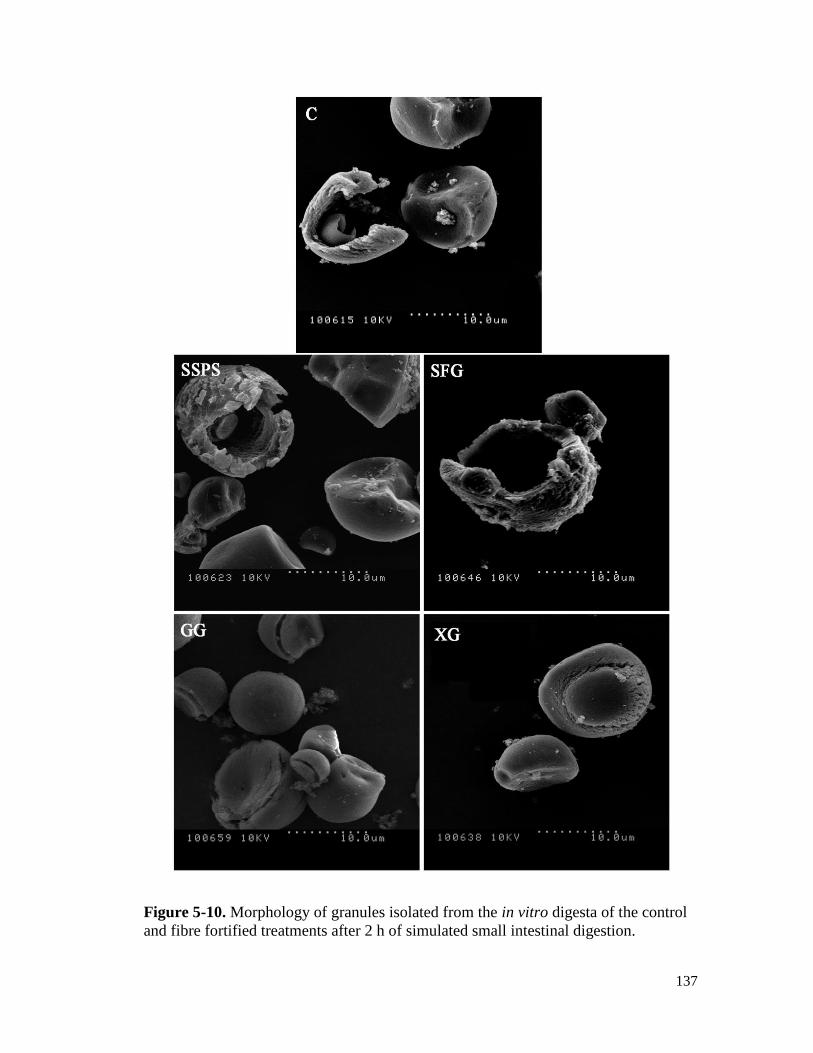
137
Figure 5-10. Morphology of granules isolated from the in vitro digesta of the control
and fibre fortified treatments after 2 h of simulated small intestinal digestion.
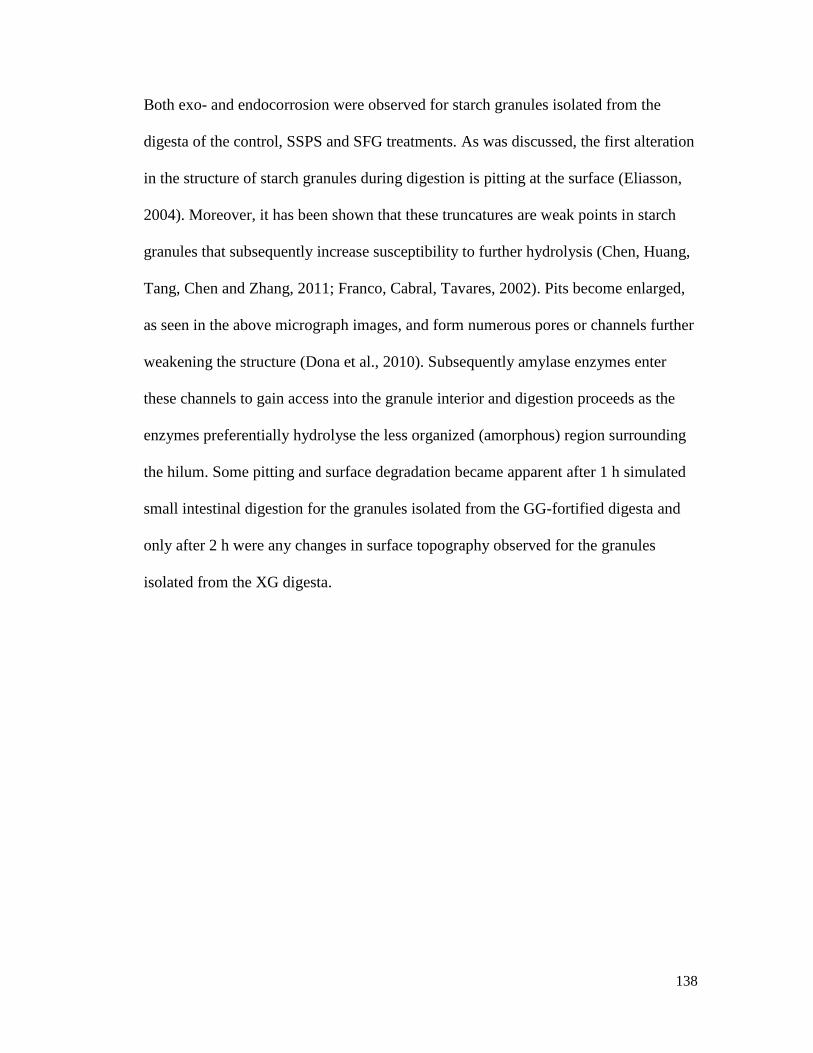
138
Both exo- and endocorrosion were observed for starch granules isolated from the
digesta of the control, SSPS and SFG treatments. As was discussed, the first alteration
in the structure of starch granules during digestion is pitting at the surface (Eliasson,
2004). Moreover, it has been shown that these truncatures are weak points in starch
granules that subsequently increase susceptibility to further hydrolysis (Chen, Huang,
Tang, Chen and Zhang, 2011; Franco, Cabral, Tavares, 2002). Pits become enlarged,
as seen in the above micrograph images, and form numerous pores or channels further
weakening the structure (Dona et al., 2010). Subsequently amylase enzymes enter
these channels to gain access into the granule interior and digestion proceeds as the
enzymes preferentially hydrolyse the less organized (amorphous) region surrounding
the hilum. Some pitting and surface degradation became apparent after 1 h simulated
small intestinal digestion for the granules isolated from the GG-fortified digesta and
only after 2 h were any changes in surface topography observed for the granules
isolated from the XG digesta.
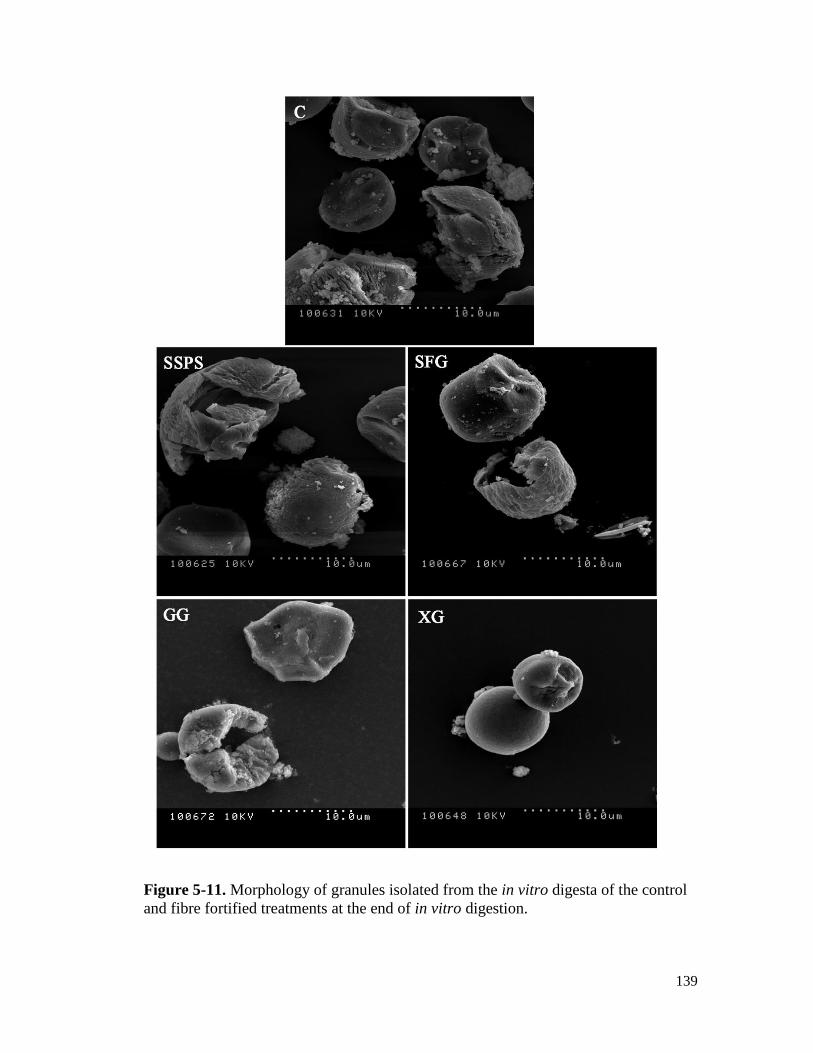
139
Figure 5-11. Morphology of granules isolated from the in vitro digesta of the control
and fibre fortified treatments at the end of in vitro digestion.
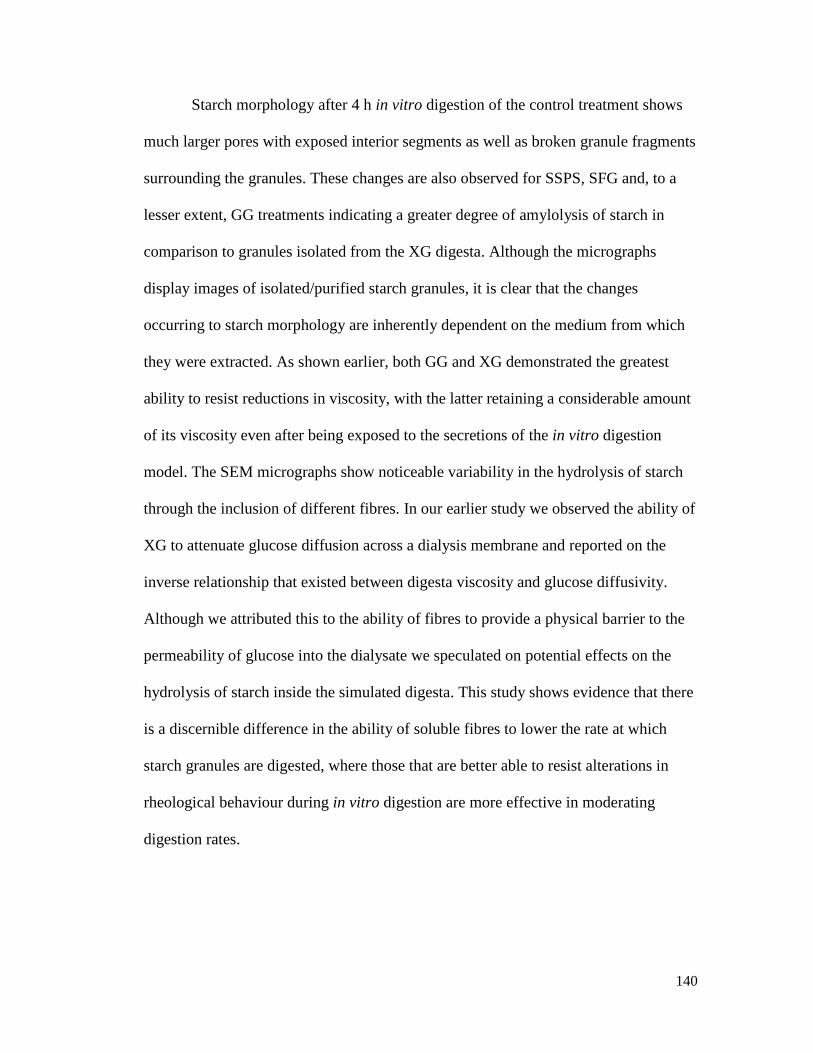
140
Starch morphology after 4 h in vitro digestion of the control treatment shows
much larger pores with exposed interior segments as well as broken granule fragments
surrounding the granules. These changes are also observed for SSPS, SFG and, to a
lesser extent, GG treatments indicating a greater degree of amylolysis of starch in
comparison to granules isolated from the XG digesta. Although the micrographs
display images of isolated/purified starch granules, it is clear that the changes
occurring to starch morphology are inherently dependent on the medium from which
they were extracted. As shown earlier, both GG and XG demonstrated the greatest
ability to resist reductions in viscosity, with the latter retaining a considerable amount
of its viscosity even after being exposed to the secretions of the in vitro digestion
model. The SEM micrographs show noticeable variability in the hydrolysis of starch
through the inclusion of different fibres. In our earlier study we observed the ability of
XG to attenuate glucose diffusion across a dialysis membrane and reported on the
inverse relationship that existed between digesta viscosity and glucose diffusivity.
Although we attributed this to the ability of fibres to provide a physical barrier to the
permeability of glucose into the dialysate we speculated on potential effects on the
hydrolysis of starch inside the simulated digesta. This study shows evidence that there
is a discernible difference in the ability of soluble fibres to lower the rate at which
starch granules are digested, where those that are better able to resist alterations in
rheological behaviour during in vitro digestion are more effective in moderating
digestion rates.
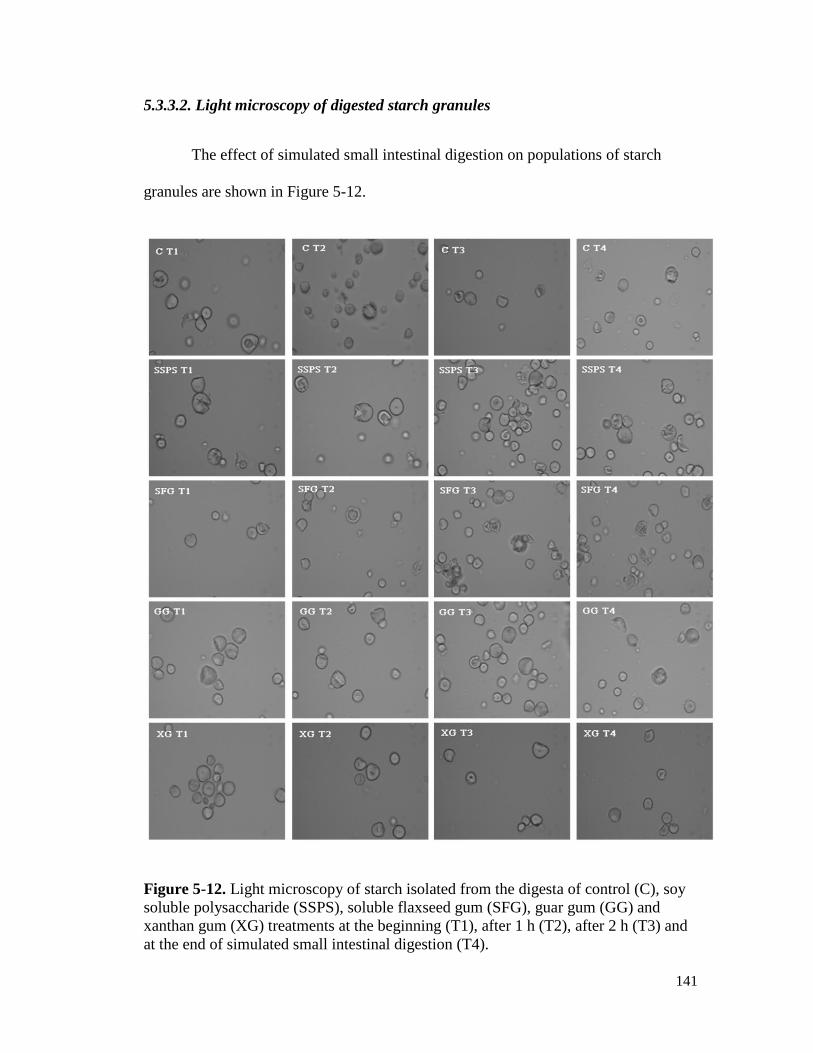
141
5.3.3.2. Light microscopy of digested starch granules
The effect of simulated small intestinal digestion on populations of starch
granules are shown in Figure 5-12.
Figure 5-12. Light microscopy of starch isolated from the digesta of control (C), soy
soluble polysaccharide (SSPS), soluble flaxseed gum (SFG), guar gum (GG) and
xanthan gum (XG) treatments at the beginning (T1), after 1 h (T2), after 2 h (T3) and
at the end of simulated small intestinal digestion (T4).
142
In conjunction with the SEM micrographs, continued digestion led to pronounced
changes in starch morphology, as evidenced by the manifestation of channels and
openings along the granule exterior. These changes are present at the initial stage of
digestion (T0 images) for the control, SSPS, and SFG-isolated granules, indicating a
greater susceptibility to amylolysis in comparison to starch granules extracted from
the digesta of GG and XG treatments. Upon completion of in vitro digestion, some
granules were completely hydrolysed while others showed evidence of fragmentation
with residual starch being left behind. Interestingly, light microscopy revealed that at
the end of simulated digestion many granules remained intact, even for the control
treatment, demonstrating heterogeneity in starch hydrolysis during in vitro digestion.
Hasjim et al. (2010) made a similar observation where they reported on the presence
of undigested granules even after 25 h of in vitro digestion. This finding might explain
why in our earlier study we reported on only 40% of the starch being hydrolysed for
the control treatment. Moreover, in that study we measured starch digestibility by
computing the rate of RSR and observed that XG had the most pronounced effect on
lowering the rate of release of sugars, followed by GG. Although we attributed this to
an increase in digesta viscosity, it remained unclear whether the result was due to the
effect the soluble fibres exerted on the hydrolysis of starch or whether there was
another mechanism by which they were modulating the release of sugars. The light
microscopy images confirm the variability in the digestion pattern of tapioca starch
and the influence of soluble fibres.
Although our present study does not look at the effects of soluble fibre
inclusion on enzyme activity, it is important to discuss the potential effects they may

143
have on moderating such events. It has been reported that if amylase activity can be
inhibited by controlling parameters that affect amylase diffusion then there could be
nutritional implications (Al-Rabadi, et al., 2009), such as those related to reductions in
postprandial glycemia. As was mentioned in our previous discussion regarding starch
particle size, the digestion of both cooked and raw starches follows first order kinetics
(Equation 5-1) (Goni, Garcia-Alonso and Saura-Calixto, 1997)
𝐶 = 𝐶∞(1 − 𝑒−𝑘𝑡) (Equation 5-1)
where C is the concentration of glucose at a given time, C∞ is the concentration of
glucose upon completion of the reaction and k is a first order kinetic constant.
However, starch hydrolysis is a complex system where many factors have the
potential of influencing the rate of the reaction and subsequent glucose release, such
as by means of inhibiting enzyme activity. Inhibition of enzyme activity can either be
competitive or non-competitive.
During competitive-inhibition the inhibitor directly binds to the enzyme
thereby preventing the binding of the substrate to the enzymes active site.
Subsequently, a variety of models exist that can be used to explain the enzyme
kinetics of starch digestibility, with some integrating but slightly deviating from the
well-known Michaelis-Menten model (Fujii and Kawamura, 1985; Wang, Zeng, Liu
and Yuan, 2006; Dona et al., 2010) (Equation 5-2).
𝐷[𝑃]
𝐷𝑡=
𝑉𝑚𝑎𝑥[𝑆]
𝐾𝑚 (1+ [𝑃]
𝐾𝑖)+ [𝑆]
(Equation 5-2)

144
where [P] is the concentration of product at any given time, Vmax is the maximum
velocity of the reaction, Km is the Michaelis constant (from the Michaelis-Menten
equation), [S] is the substrate concentration and Ki is the product inhibition constant.
The proposed model has been used to describe the product inhibition of glucoamylase
and amylase by glucose. However, there is a so-called “grace zone” where inhibition
is absent below a threshold concentration of glucose (Wang et al., 2006). Moreover,
many studies modelling product-inhibited reactions lack reasonable explanations as to
why the proposed time courses show deviation from the shape of Michaelis-Menten
reactions and therefore it has been reported that product inhibition reactions are not
useful in modelling starch digestion curves (Dona et al., 2010). During non-
competitive inhibition, the inhibitor has an indistinguishable affinity for the enzyme
and uncompetitive inhibition is where the inhibitor binds solely with the enzyme-
substrate complex (Kuchel and Ralston, 1997); in either case the result is a decrease in
the rate of the reaction. Although both types of inhibition (competitive or non-
competitive/uncompetitive) may occur during starch digestion, physical properties of
the digesta, such as viscosity, may also influence the rate of starch hydrolysis by
inducing diffusional restrictions (Dona et al., 2010).
As we have shown in our study, the presence of soluble fibres in solution has a
tremendous impact on their subsequent rheological properties. Moreover, SEM and
light microscopy images indicate the plausible effect that fibres exert on the
amylolysis of starch granules, likely due to the increase in digesta viscosity.
Therefore, it can be assumed that kinetic behaviour can be partly influenced by
diffusional restrictions, as shown by equation 5-3, which demonstrates reduced rates
145
of reaction by increasing substrate concentration (Pastrana, Gonzalez, Miron and
Murado, 1998).
𝐷[𝑃]
𝐷𝑡=
𝑉𝑚𝑎𝑥[𝑆]
𝐾𝑚 + [𝑆] 𝑒𝐷𝑣𝑅 (Equation 5-3)
where Dv is a first order coefficient used to characterize the relationship between the
rate of the reaction and diffusional restrictions and the term ‘R’ is derived from:
𝑅 = 𝑅𝑚 + (𝑅0 − 𝑅𝑚)𝑒−𝜇[𝑆] (Equation 5-4)
where Ro is the diffusional restriction when [S]=0 and Rm is the largest value
attainable for the diffusional restriction and μ is a diffusional restriction coefficient.
Although the equation assumes increasing substrate concentration translates into
higher viscosities and therefore greater diffusion restrictions, it does not account for
variability amongst different polysaccharides. In our system, much higher
concentrations were required for SSPS and SFG in order to match the apparent
viscosity of XG and GG. Moreover, the viscosity inside the simulated digesta was
much higher for XG, which also had a lower initial concentration. Therefore, viscosity
may be a more valid mechanistic indicator of diffusional restrictions than
concentration. This is especially true as the addition of XG to starch solutions led to
the most pronounced reductions in starch hydrolysis as evidenced by the changes in
starch morphology as well as the effects we observed on RSR and glucose diffusivity
(Chapter 4). Nonetheless, a mathematical model incorporating a diffusion coefficient
may be useful in attempting to relate soluble fibre functionality to starch hydrolysis.

146
The quantitative analysis of starch digestion and mathematical and empirical
modeling of enzyme kinetics can be very useful tools in advancing our understanding
of starch digestibility. Moreover, they may help researchers better understand how
complex polymer systems influence the rate at which starch is hydrolysed and how the
presence of soluble fibres might play a role at promoting glycemic reductions.
5.4.Conclusion
Starch suspensions were formulated with native tapioca starch and different
soluble fibres. Formulations were designed to produce equi-viscous solutions at lower
shear rates. Subsequently, starch granules were isolated and purified from the digesta
at various times of simulated small intestinal digestion for analysis of particle size and
starch morphology. Granules extracted from the digesta of the control, SSPS and SFG
treatments showed unimodal size distributions (5 – 50 μm) whereas those purified
from the GG and XG treatments showed bimodal distributions (5 – 60 μm, 60 – 1000
μm), which we believe is attributed to the ability of both GG and XG to enwrap starch
granules allowing for granular associations, as evidenced by the micrograph images.
The size of starch granules decreased as digestion proceeded due to the continued
hydrolysis of starch. The SEM micrographs revealed pitting and surface erosion at the
beginning of simulated small intestinal digestion for granules extracted from low
viscosity digesta (control, SSPS, SFG). As digestion continued these changes became
more apparent as both exo- and endo-corrosion were visible showing extensive
degradation of starch granules, which was also observed for the GG treatment.
Granules extracted from the digesta of XG-fortified solutions showed fewer changes
in surface topography, which we believe is due to the ability of XG to retain a

147
measurable amount of its viscosity throughout in vitro digestion. Light microscopy
showed that despite variability in the extent of starch hydrolysis between the different
treatments there was also heterogeneity in the hydrolysis of starch within each
treatment (some granules remained unaltered while others were completely degraded).
The results of our previous studies, where we explored the ability of soluble
fibres to attenuate RSR, glucose liberation and diffusion, may be explained by their
ability, or inability, to affect the hydrolysis of starch. Although the agreement amongst
researchers studying the glucose-lowering ability of soluble fibres is that the effects
are due to the increase in digesta viscosity; the mechanism(s) by which fibres might
modulate the in vitro glycemic response remain unclear. From our study, it is apparent
that fibre-fortification leads to attenuations in the hydrolysis of starch. Moreover, the
effects are only observed for fibres that are able to retain a measurable amount of
viscosity during simulated digestion, where those less viscous (during digestion) are
much less effective. It is conceivable then that increasing the viscosity of the
surrounding medium leads to less effective amylolysis of starch granules through
interfering with the diffusion of enzymes onto the surface of starch granules. The
effects may also be due to the ability of some gums to allow starch granules to
agglomerate thereby reducing the relative surface area exposed to digestive enzymes.
To augment the findings of this study, it would be vital to explore the effects that
soluble fibres might have on enzyme (amylase, glucoamylase) activity to gain further
understanding of the mechanism by which soluble fibres are able to modulate the in
vitro glycemic response.
148
6. Study strengths and limitations
There are a number of strengths associated with this work. Investigations focused
on understanding the functionality of soluble dietary fibres as they relate to glycemic
reductions often employ clinical trials to observe the effects of fibre fortification.
Subsequently, the results of many of these studies show positive outcomes (enhanced
glycemic reductions) and the discussion is centred on the increase in viscosity that
fibres are able to generate. Although such studies are fundamentally imperative they
pose many questions concerning the mechanism of action. As outlined in Chapter 2,
the GIT is a complex system and the breakdown of starch into glucose occurs in
several stages inside the small intestine. Many in vitro and in vivo studies use a single
marker, most commonly glucose levels, as a measure of functionality from which a
discussion and theoretical models are generated. Our experimental setup included
looking at the different stages of starch hydrolysis, attempting to observe how fibre-
fortification may lead to reductions in RSR (simulated luminal digestion), glucose
release (simulated membrane-level digestion) and finally glucose diffusion.
Understanding how one or more of these events are influenced by dietary fibres will
help generate a more balanced and comprehensive understanding of their glucose-
lowering ability.
Despite possessing physicochemical characteristics that allow fibres to thicken
when dispersed in solution, the secretions of the GIT have a profound influence on
their rheological properties, which as a result may alter their in vivo functionality. In
our study, we closely monitor changes in rheological behaviour (both viscosity and
viscoelastic properties) of different dietary fibres in order to gain a snapshot of their
149
“physiological flow behaviour”, which is one that should be looked at when
attempting to relate viscosity or gelation to their purported physiological effects, in
this case glycemic reductions.
Moreover, this study uses different techniques to attain both quantitative and
qualitative information to divulge the functionality of dietary fibres using the
prescribed in vitro system. By extracting whole starch granules from the simulated
digesta we were able to visualize the changes occurring when starch was dispersed
both in the absence and presence of select dietary fibres. Light scattering data and
micrograph images augment the RSR and glucose release data we acquired, which
create a more balanced approach in studying the ability of soluble fibres to moderate
the in vitro glycemic response.
The limitations of the study are present just like in any other in vitro digestion
model where mimicking the in vivo conditions can never be fully accurate. Despite
using a three-stage digestion model where we were able to control many essential
elements, such as temperature, pH, agitation/mixing and enzyme activity, these events
are highly dynamic and influenced by a variety of factors, as we outlined in Chapter 2.
Neurohumoral regulation, gastric emptying and muscular contractions, variability in
shear rates and the rate of release and levels of secretions are difficult to mimic using
a static digestion model. Nonetheless, using such models allows researchers to gain a
better understanding of how food materials and polymer systems function inside the
GIT, despite the accompanying limitations in the design protocol.
150
7. Conclusion and future directions
The ability of different dietary fibres to influence the in vitro glycemic response
was the focus of the present study. Xanthan gum (XG), guar gum (GG), soluble
flaxseed gum (SFG) and soy soluble polysaccharide (SSPS) were added to protein-
starch solutions. Subsequently, all solutions were subjected to a three-stage in vitro
digestion model mimicking the salivary, gastric and small intestinal steps, and their
rheological behaviour was monitored throughout. The concentrations of fibres were
selected to create similar apparent viscosities at lower shear rates (20 – 50 s-1
), to
mimic the shear rates reported during digestion (Borwankar, 1992; Steffe, 1996). Prior
to simulated digestion, all solutions exhibited pseudoplastic flow as indicated by their
behaviour index values. Moreover, oscillatory testing revealed the presence of
viscoelastic gels for all solutions; however, rheological behaviour was greatly
influenced by the secretions of the digestion model.
Despite showing comparable viscosities in solution, the flow behaviours of the
different treatments were drastically changed as they progressed through each stage of
simulated digestion. The decrease in viscosity was in the order of: control < SSPS <
SFG < GG < XG where it was observed that only GG and XG retained a measurable
amount of their initial viscosity. The control, SSPS and SFG behaved as Newtonian
fluids by the time in vitro digestion had culminated. Moreover, of the four fibre-
fortified treatments, XG was the only one able to retain its solid-like network, while
GG behaved as a concentrated solution and SSPS and SFG both displayed complete
loss of G’ (large value for tan δ). Interestingly, the loss in viscosity throughout
simulated small intestinal digestion was nearly instantaneous for the control, SSPS
151
and SFG treatments whereas the losses were observed to be more gradual in the GG
and XG treatments. We attributed this to the variability in the hydrolysis of the starch
component, where both GG and XG are likely influencing the rate of digestion of
starch, therefore allowing for a steadier reduction in flow behaviour.
The ability of soluble fibres to moderate starch hydrolysis was examined by
measuring the amount of reducing sugars released inside the simulated digesta. There
was an inverse relationship between digesta viscosity and reducing sugar release
(RSR) where the most viscous treatment (XG) elicited the greatest reduction in both
the final concentration and the rate of release. As the viscosity of the digestive
contents increased it is plausible that the mixing of the secretions with the solutions
becomes less effective, allowing for a steadier hydrolysis of starch due to a decrease
in amylolytic attack. Despite having a negligible effect on RSR, when we measured
the concentration of glucose in the digesta even the treatments with much lower
viscosities (SFG and SSPS) were able to moderate the amount of glucose being
generated inside the digesta in comparison to the control. The apparent viscosities of
the fibre-fortified digest of SSPS and SFG ranged between 60 and120 mPa.s,
respectively (higher than what was observed for the control treatment, which had
values similar to that of water). When simulated digestion was carried out inside a
dialysis system only XG (and to a lesser extent, GG), which had measurable elastic
components throughout digestion, were able to attenuate the rate of diffusion of
glucose. The results indicate that the functionality of soluble fibres, as related to their
ability to attenuate the in vitro glycemic response, may be multi-faceted and reliant on
more than just their ability to increase viscosity. The capacity of fibres to maintain a

152
gel network inside the simulated lumen may be crucial in allowing them to entrap
glucose molecules thereby lowering their rate of diffusion into the dialysate.
In the final portion of the study, replacing pregelatinized starch with native
tapioca starch allowed for more accurate investigation of starch degradation by
observing changes in particle size and granule morphology. Particle size distribution,
as defined by the volume weighted mean - d[4,3] value, showed unimodal distribution
(5 to 50 μm) for isolated starch granules. The addition of XG and GG to starch
suspensions resulted in a shift to bimodal size distributions demonstrating an
aggregating effect on starch granules, which was confirmed by both SEM and light
microscopy (granule bridging led to aggregates > 100 μm). Light scattering showed a
drop in particle size throughout simulated small intestinal digestion due to the
amylolysis of starch granules. Micrograph images of starch showed spherical granules
with smooth surfaces and no evidence of structural degradation caused by the
isolation/purification method employed. Extracting granules from the in vitro digest
showed heterogeneity in changes done to surface topography where those extracted
from less viscous system (control, SFG and SSPS) showed evidence of continued and
extensive hydrolysis as time went on. Pitting along the surface, followed by the
formation of crack (exo-corrosion) were the first changes observed. Subsequently,
extensive degradation of the granule interior (endo-corrosion) was observed with
some granules having been fully digested upon completion of in vitro digestion. The
progression of these changes was delayed in granules isolated from more viscous
systems and only after 4 h small intestinal digestion of the XG-fortified treatment did
granules show signs of amylolysis. These findings augment the earlier portion of the
153
study and highlight the ability of viscous fibre to attenuate the hydrolysis of starch.
This study shows that fibre-fortification may have variable effects on the hydrolysis of
starch and subsequent release and diffusion of glucose. Despite the substantiation of
our study of the notion that viscous fibres are able to modulate glucose levels, other
investigations would be essential in allowing us to fully understand the mechanism by
which they are able to attenuate blood glucose levels.
In tandem with the findings of our study, exploring the potential (inhibitory)
effects of dietary fibres on enzyme activity will be essential in allowing researchers to
better understand the mechanism surrounding their glucose-lowering ability. Studies
have shown that α-amylase activity can be inhibited by polyphenolic compounds that
are present in high-fibre foods (Sreerama, Sashikala, and Pratape, 2012). Moreover,
results of several studies have reported that anthocyanins found in fibre-rich foods
such as fruits and vegetables have both in vivo and in vitro inhibitory activity towards
α-glucosidase (McDougall, Dobson, Shpiro, Smith, Stewart, and Fyffe, 2005) and that
the GI values of foods were shown to be inversely related to their respective
polyphenol content (Ramdath, Padhi, Hawke, Sivaramalingam, and Tsao, 2014).
Although the studies focus on anthocyanin content and that the reports are
contradictory, with some studies showing that some compounds such as lignin may in
fact stimulate enzyme activity (Zhang, Cui, Yin, Sun, and Li, 2013), it would be
essential to explore how soluble fibres, which have been observed to attenuate starch
hydrolysis, might play a role in mediating enzyme activity. Although antidiabetic
drugs, such as acarbose and miglitol, which are designed to inhibit amylase activity
are available on the market they are associated with a range of undesirable side effects
154
(Etxeberria, de La Garza, Campion, Martinez, and Milagro, 2012; Lordan, Smyth,
Soler-Vila, Stanton, and Ross, 2013); it would therefore be more beneficial to
discover natural sources to augment current strategies in diabetic therapies. The
digestibility and glucose-release behaviour of starch is of both metabolic and clinical
importance. As a result, future investigations on soluble fibre structure-function
relationships are essential to researchers seeking to develop novel functional foods
designed to promote glycemic reductions.

155
References
Adeghate, E., Schattner, P., & Dunn, E. (2006). An update on the etiology and
epidemiology of diabetes mellitus. Annals of the New York Academy of Sciences,
1084(1), 1-29.
Al-Rabadi, G. J., Gilbert, R. G., & Gidley, M. J. (2009). Effect of particle size on
kinetics of starch digestion in milled barley and sorghum grains by porcine alpha-
amylase. Journal of Cereal Science, 50(2), 198-204.
Alzueta, C., Rodriguez, M., Cutuli, M., Rebole, A., Ortiz, L., Centeno, C., et al.
(2003). Effect of whole and demucilaged linseed in broiler chicken diets on
digesta viscosity, nutrient utilisation and intestinal microflora. British Poultry
Science, 44(1), 67-74.
Anderson, J. W., Randles, K. M., Kendall, C. W., & Jenkins, D. J. (2004).
Carbohydrate and fiber recommendations for individuals with diabetes: A
quantitative assessment and meta-analysis of the evidence. Journal of the
American College of Nutrition, 23(1), 5-17.
Anderson, G. H., Cho, C. E., Akhavan, T., Mollard, R. C., Luhovyy, B. L., &
Finocchiaro, E. T. (2010). Relation between estimates of cornstarch digestibility
by the englyst in vitro method and glycemic response, subjective appetite, and
short-term food intake in young men. The American Journal of Clinical
Nutrition, 91(4), 932-939.

156
ANZFA (Australia New Zealand Food Authority) (2000) Notice of a Proposed
Change to Food Regulation and Further Invitation for Submissions. Application
277 . Inulin and Fructooligosaccharides as Dietary Fibre.
Aravind, N., Sissons, M., Egan, N., & Fellows, C. (2012). Effect of insoluble dietary
fibre addition on technological, sensory, and structural properties of durum wheat
spaghetti. Food Chemistry, 130(2), 299-309.
Au, M. M., Goff, H. D., Kisch, J. A., Coulson, A., & Wright, A. J. (2013). Effects of
soy-soluble fiber and flaxseed gum on the glycemic and insulinemic responses to
glucose solutions and dairy products in healthy adult males. Journal of the
American College of Nutrition, 32(2), 98-110.
Barclay, A. W., Petocz, P., McMillan-Price, J., Flood, V. M., Prvan, T., Mitchell, P.,
et al. (2008). Glycemic index, glycemic load, and chronic disease risk--a meta-
analysis of observational studies. The American Journal of Clinical Nutrition,
87(3), 627-637.
Behall, K. M., Scholfield, D. J., & Hallfrisch, J. (2005). Comparison of hormone and
glucose responses of overweight women to barley and oats. Journal of the
American College of Nutrition, 24(3), 182-188.
Blasel, H., Hoffman, P., & Shaver, R. (2006). Degree of starch access: An enzymatic
method to determine starch degradation potential of corn grain and corn silage.
Animal Feed Science and Technology, 128(1), 96-107.
157
Bobboi, A., & Stephens, A. (1996). The effects of electrolyte and hydrogen ion
concentrations on guar gum and glucose tolerance following intraduodenal
administration. Nutrition Research, 16(8), 1403-1409.
Boron, W. F., & Boulpaep, E. L. (2009). Medical physiology. A cellular and
molecular approach. saunders.
Borwankar, R. P. (1992). Food texture and rheology: A tutorial review. Journal of
Food Engineering, 16(1), 1-16.
Braaten, J. T., Wood, P. J., Scott, F. W., Riedel, K. D., Poste, L. M., & Collins, M. W.
(1991). Oat gum lowers glucose and insulin after an oral glucose load. The
American Journal of Clinical Nutrition, 53(6), 1425-1430.
Brenelli, S., Campos, S., & Saad, M. (1997). Viscosity of gums in vitro and their
ability to reduce postprandial hyperglycemia in normal subjects. Brazilian
Journal of Medical and Biological Research, 30(12), 1437-1440.
Brennan, C. S. (2005). Dietary fibre, glycaemic response, and diabetes. Molecular
Nutrition & Food Research, 49(6), 560-570.
Brennan, C. S., & Cleary, L. J. (2005). The potential use of cereal (1→ 3, 1→ 4)-β-D-
glucans as functional food ingredients. Journal of Cereal Science, 42(1), 1-13.
Brennan, C. S., & Tudorica, C. M. (2008). Evaluation of potential mechanisms by
which dietary fibre additions reduce the predicted glycaemic index of fresh
pastas. International Journal of Food Science & Technology, 43(12), 2151-2162.
158
Brennan, C., Blake, D., Ellis, P., & Schofield, J. (1996). Effects of guar
galactomannan on wheat bread microstructure and on theIn vitroandIn
vivoDigestibility of starch in bread. Journal of Cereal Science, 24(2), 151-160.
Brennan, M. A., Derbyshire, E. J., Brennan, C. S., & Tiwari, B. K. (2012). Impact of
dietary fibre‐enriched ready‐to‐eat extruded snacks on the postprandial glycaemic
response of non‐diabetic patients. Molecular Nutrition & Food Research, 56(5),
834-837.
Brennan, M. A., Monro, J. A., & Brennan, C. S. (2008). Effect of inclusion of soluble
and insoluble fibres into extruded breakfast cereal products made with reverse
screw configuration. International Journal of Food Science & Technology,
43(12), 2278-2288.
Brighenti, F., Pellegrini, N., Casiraghi, M., & Testolin, G. (1995). In vitro studies to
predict physiological effects of dietary fibre. European Journal of Clinical
Nutrition, 49(S12), S81-S88.
Brown, K. H., Perez, F., Peerson, J. M., Fadel, J., Brunsgaard, G., Ostrom, K. M., et
al. (1993). Effect of dietary fiber (soy polysaccharide) on the severity, duration,
and nutritional outcome of acute, watery diarrhea in children. Pediatrics, 92(2),
241-247.
Brownlee, I. A. (2011). The physiological roles of dietary fibre. Food Hydrocolloids,
25(2), 238-250.
159
Brownlee, I. A., Dettmar, P. W., Strugala, V., & Pearson, J. P. (2006). The interaction
of dietary fibres with the colon. Current Nutrition & Food Science, 2(3), 243-
264.
Burkitt, D. P., & Trowell, H. C. (1977). Dietary fibre and western diseases. Irish
Medical Journal, 70(9), 272-277.
Byrnes, S. E., Miller, J. C., & Denyer, G. S. (1995). Amylopectin starch promotes the
development of insulin resistance in rats. The Journal of Nutrition, 125(6), 1430-
1437.
Cairns, P., Miles, M., & Morris, V. (1986). Intermolecular binding of xanthan gum
and carob gum.
Cameron-Smith, D., Collier, G., & O'dea, K. (1994). Effect of soluble dietary fibre on
the viscosity of gastrointestinal contents and the acute glycaemic response in the
rat. British Journal of Nutrition, 71(04), 563-571.
Camilleri, M., Malagelada, J. R., Brown, M. L., Becker, G., & Zinsmeister, A. R.
(1985). Relation between antral motility and gastric emptying of solids and
liquids in humans. The American Journal of Physiology, 249(5 Pt 1), G580-5.
Canadian Diabetes Association. (2009). The prevalence and costs of diabetes. clinical
practice guidelines. Retrieved September 17, 2014, from
http://www.diabetes.ca/publications-newsletters/advocacy-reports/economic-
tsunami-the-cost-of-diabetes-in-canada

160
Chaisawang, M., & Suphantharika, M. (2005). Effects of guar gum and xanthan gum
additions on physical and rheological properties of cationic tapioca starch.
Carbohydrate Polymers, 61(3), 288-295.
Chaisawang, M., & Suphantharika, M. (2006). Pasting and rheological properties of
native and anionic tapioca starches as modified by guar gum and xanthan gum.
Food Hydrocolloids, 20(5), 641-649.
Chang, E. B., Sitrin, M. D., & Black, D. D. (1996). Gastrointestinal, hepatobiliary,
and nutritional physiology. JB Lippincott Company.
Chawla, R., & Patil, G. (2010). Soluble dietary fiber. Comprehensive Reviews in Food
Science and Food Safety, 9(2), 178-196.
Chen, Y., Huang, S., Tang, Z., Chen, X., & Zhang, Z. (2011). Structural changes of
cassava starch granules hydrolyzed by a mixture of α-amylase and glucoamylase.
Carbohydrate Polymers, 85(1), 272-275.
Chessa, S., Huatan, H., Levina, M., Mehta, R., Ferrizzi, D., & Rajabi-Siahboomi, A.
(2014). Application of the dynamic gastric model to evaluate the effect of food on
the drug release characteristics of a hydrophilic matrix formulation. International
Journal of Pharmaceutics, 466(1), 359-367.
Chivero, P., Gohtani, S., Ikeda, S., & Nakamura, A. (2014). The structure of soy
soluble polysaccharide in aqueous solution. Food Hydrocolloids, 35, 279-286.
161
Codex Alimentarius Commission, ALINORM 10/33/26, Report of the 31st Session of the
Codex Committee on Nutrition and Foods for Special Dietary Uses, Düsseldorf,
Germany, 2 - 6 November 2009 Retrieved September 11, 2014, from
http://ftp.fao.org/codex/Alinorm10/al33_26e.pdf
Cui, W., & Mazza, G. (1996). Physicochemical characteristics of flaxseed gum. Food
Research International, 29(3), 397-402.
Cunnane, S., & Thompson, L. U. (1995). Flaxseed in human nutrition. AOCS Press.
Dhital, S., Warren, F. J., Zhang, B., & Gidley, M. J. (2014). Amylase binding to starch
granules under hydrolysing and non-hydrolysing conditions. Carbohydrate
Polymers, 113, 97-107.
Dikeman, C. L., & Fahey Jr, G. C. (2006). Viscosity as related to dietary fiber: A
review. Critical Reviews in Food Science and Nutrition, 46(8), 649-663.
Dikeman, C. L., Murphy, M. R., & Fahey, G. C.,Jr. (2006). Dietary fibers affect
viscosity of solutions and simulated human gastric and small intestinal digesta.
The Journal of Nutrition, 136(4), 913-919.
Ding, H. H., Cui, S. W., Goff, H. D., Wang, Q., Chen, J., & Han, N. F. (2014).
Soluble polysaccharides from flaxseed kernel as a new source of dietary fibres:
Extraction and physicochemical characterization. Food Research International,
56, 166-173.
162
Dona, A. C., Pages, G., Gilbert, R. G., & Kuchel, P. W. (2010). Digestion of starch: In
vivo and in vitro kinetic models used to characterise oligosaccharide or glucose
release. Carbohydrate Polymers, 80(3), 599-617.
Doublier, J., & Cuvelier, G. (1996). Gums and HydrocoIIoids functional aspects.
Carbohydrates in Food, (74), 283.
Eastwood, M. A., & Morris, E. R. (1992). Physical properties of dietary fiber that
influence physiological function: A model for polymers along the gastrointestinal
tract. The American Journal of Clinical Nutrition, 55(2), 436-442.
Edwards, C. H., Warren, F. J., Milligan, P. J., Butterworth, P. J., & Ellis, P. R. (2014).
A novel method for classifying starch digestion by modelling the amylolysis of
plant foods using first-order enzyme kinetic principles. Food & Function, 5(11),
2751-2758.
Edwards, C. A., Johnson, I. T., & Read, N. W. (1988). Do viscous polysaccharides
slow absorption by inhibiting diffusion or convection? European Journal of
Clinical Nutrition, 42(4), 307-312.
EFSA (European Food Safety Authority). Outcome of the Public consultation on the
Draft Opinion of the Scientific Panel on Dietetic products, Nutrition, and
Allergies (NDA) on Dietary Reference Values for carbohydrates and dietary
fibre. EFSA Journal 2010; 8(5):1508.
Eliasson, A. (2004). Starch in food: Structure, function and applications CRC Press.
163
Ellegård, L. H., Andersson, S. W., Normén, A. L., & Andersson, H. A. (2007).
Dietary plant sterols and cholesterol metabolism. Nutrition Reviews, 65(1), 39-45.
Ellegård, L., & Andersson, H. (2007). Oat bran rapidly increases bile acid excretion
and bile acid synthesis: An ileostomy study. European Journal of Clinical
Nutrition, 61(8), 938-945.
Englyst, H. N., Kingman, S. M., & Cummings, J. H. (1992). Classification and
measurement of nutritionally important starch fractions. European Journal of
Clinical Nutrition, 46 Suppl 2, S33-50.
Englyst, K. N., Englyst, H. N., Hudson, G. J., Cole, T. J., & Cummings, J. H. (1999).
Rapidly available glucose in foods: An in vitro measurement that reflects the
glycemic response. The American Journal of Clinical Nutrition, 69(3), 448-454.
Etxeberria, U., de la Garza, A. L., Campión, J., Martínez, J. A., & Milagro, F. I.
(2012). Antidiabetic effects of natural plant extracts via inhibition of
carbohydrate hydrolysis enzymes with emphasis on pancreatic alpha amylase.
Expert opinion on therapeutic targets, 16(3), 269-297.
Ezeogu, L., Duodu, K., & Taylor, J. (2005). Effects of endosperm texture and cooking
conditions on the in vitro starch digestibility of sorghum and maize flours.
Journal of Cereal Science, 42(1), 33-44.
Fabek, H. (2011). Effect of in Vitro Human Digestion on the Viscosity of
Hydrocolloids in Solution: A Dietary Fibre Study (Master’s dissertation),
164
Fabek, H., Messerschmidt, S., Brulport, V., & Goff, H. D. (2014). The effect of in
vitro digestive processes on the viscosity of dietary fibres and their influence on
glucose diffusion. Food Hydrocolloids, 35, 718-726.
Fafaungwithayakul, N., Hongsprabhas, P., & Hongsprabhas, P. (2011). Effect of soy
soluble polysaccharide on the stability of soy-stabilised emulsions during in vitro
protein digestion. Food Biophysics, 6(3), 407-415.
Ferrua, M. J., & Singh, R. P. (2010). Modeling the fluid dynamics in a human
stomach to gain insight of food digestion. Journal of Food Science, 75(7), R151-
62.
Field, C. J., McBurney, M. I., Massimino, S., Hayek, M. G., & Sunvold, G. D. (1999).
The fermentable fiber content of the diet alters the function and composition of
canine gut associated lymphoid tissue. Veterinary Immunology and
Immunopathology, 72(3), 325-341.
Fodje, A. M., Chang, P. R., & Leterme, P. (2009). In vitro bile acid binding and short-
chain fatty acid profile of flax fiber and ethanol co-products. Journal of
Medicinal Food, 12(5), 1065-1073.
Franco, C. M., Cabral, R. A., & Tavares, D. Q. (2002). Structural and
physicochemical characteristics of lintnerized native and sour cassava starches.
Starch‐stärke, 54(10), 469-475.
165
Fujii, M., & Kawamura, Y. (1985). Synergistic action of α‐amylase and glucoamylase
on hydrolysis of starch. Biotechnology and Bioengineering, 27(3), 260-265.
Furuta, H., & Maeda, H. (1999). Rheological properties of water-soluble soybean
polysaccharides extracted under weak acidic condition. Food Hydrocolloids,
13(3), 267-274.
Garcıa-Ochoa, F., Santos, V., Casas, J., & Gomez, E. (2000). Xanthan gum:
Production, recovery, and properties. Biotechnology Advances, 18(7), 549-579.
Gidley, M. J. (2013). Hydrocolloids in the digestive tract and related health
implications. Current Opinion in Colloid & Interface Science, 18(4), 371-378.
Gonera, A., & Cornillon, P. (2002). Gelatinization of starch/gum/sugar systems
studied by using DSC, NMR, and CSLM. Starch‐stärke, 54(11), 508-516.
Goñi, I., Garcia-Alonso, A., & Saura-Calixto, F. (1997). A starch hydrolysis
procedure to estimate glycemic index. Nutrition Research, 17(3), 427-437.
Granfeldt, Y., & Björck, I. (1991). Glycemic response to starch in pasta: A study of
mechanisms of limited enzyme availability. Journal of Cereal Science, 14(1), 47-
61.
Gråsten, S., Liukkonen, K., Chrevatidis, A., El-Nezami, H., Poutanen, K., &
Mykkänen, H. (2003). Effects of wheat pentosan and inulin on the metabolic
activity of fecal microbiota and on bowel function in healthy humans. Nutrition
Research, 23(11), 1503-1514.
166
Gray, G. M. (1992). Starch digestion and absorption in nonruminants. The Journal of
Nutrition, 122(1), 172-177.
Guerra, A., Etienne-Mesmin, L., Livrelli, V., Denis, S., Blanquet-Diot, S., & Alric, M.
(2012). Relevance and challenges in modeling human gastric and small intestinal
digestion. Trends in Biotechnology, 30(11), 591-600.
Gularte, M. A., & Rosell, C. M. (2011). Physicochemical properties and enzymatic
hydrolysis of different starches in the presence of hydrocolloids. Carbohydrate
Polymers, 85(1), 237-244.
Gunness, P., Flanagan, B. M., Shelat, K., Gilbert, R. G., & Gidley, M. J. (2012).
Kinetic analysis of bile salt passage across a dialysis membrane in the presence of
cereal soluble dietary fibre polymers. Food Chemistry, 134(4), 2007-2013.
Gunness, P., & Gidley, M. J. (2010). Mechanisms underlying the cholesterol-lowering
properties of soluble dietary fibre polysaccharides. Food & Function, 1(2), 149-
155.
Guyton, A., & Hall, J. (2010). Textbook of medical physiology (12th ed.). Saunders,
London: Elsevier.
Hall, C., Tulbek, M. C., & Xu, Y. (2006). Flaxseed. Advances in Food and Nutrition
Research, 51, 1-97.

167
Halton, T. L., & Hu, F. B. (2004). The effects of high protein diets on thermogenesis,
satiety and weight loss: A critical review. Journal of the American College of
Nutrition, 23(5), 373-385.
Hasjim, J., Lavau, G. C., Gidley, M. J., & Gilbert, R. G. (2010). In vivo and in vitro
starch digestion: Are current in vitro techniques adequate? Biomacromolecules,
11(12), 3600-3608.
Health Canada and Statistics Canada. (2004). Canadian community health survey,
cycle 2.2, nutrition. provincial, regional and national summary data tables.
Retrieved September 11, 2014, from http://www.hc-sc.gc.ca/fn-
an/surveill/nutrition/commun/cchs_focus-volet_escc-eng.php
Health Canada. (2010). Proposed Policy: Definition and Energy Value for Dietary
Fibre. Retrieved September 11, 2014, from http://www.hc-sc.gc.ca/fn-
an/alt_formats/pdf/consult/policy-Definition-politique-eng.pdf
Health and Welfare Canada (1985). Report of the Expert Advisory Committee on
Dietary Fibre. Ottawa: Supply and Services Canada
Hengst, C., Ptok, S., Roessler, A., Fechner, A., & Jahreis, G. (2008). Effects of
polydextrose supplementation on different faecal parameters in healthy
volunteers. International Journal of Food Sciences and Nutrition, 60(s5), 96-105.
HIPSLEY, E. H. (1953). Dietary "fibre" and pregnancy toxaemia. British Medical
Journal, 2(4833), 420-422.

168
Hollebeeck, S., Borlon, F., Schneider, Y., Larondelle, Y., & Rogez, H. (2013).
Development of a standardised human in vitro digestion protocol based on
macronutrient digestion using response surface methodology. Food Chemistry,
138(2), 1936-1944.
Homann, H. H., Kemen, M., Fuessenich, C., Senkal, M., & Zumtobel, V. (1994).
Reduction in diarrhea incidence by soluble fiber in patients receiving total or
supplemental enteral nutrition. JPEN.Journal of Parenteral and Enteral
Nutrition, 18(6), 486-490.
Hur, S. J., Lim, B. O., Decker, E. A., & McClements, D. J. (2011). In vitro human
digestion models for food applications. Food Chemistry, 125(1), 1-12.
Institute of Medicine of the National Academies. (2009). Proposed definition of
dietary fibre. Retrieved September 10, 2014, from
http://www.iom.edu/Activities/Nutrition/DietaryFiberDef.aspx
J Wood, P., Braaten, J. T., Scott, F. W., Riedel, K. D., Wolynetz, M. S., & Collins, M.
W. (1994). Effect of dose and modification of viscous properties of oat gum on
plasma glucose and insulin following an oral glucose load. British Journal of
Nutrition, 72(05), 731-743.
Jarjis, H. A., Blackburn, N. A., Redfern, J. S., & Read, N. W. (1984). The effect of
ispaghula (fybogel and metamucil) and guar gum on glucose tolerance in man.
British Journal of Nutrition, 51(03), 371-378.
169
Jenkins, D. J., Kendall, C. W., Axelsen, M., Augustin, L. S., & Vuksan, V. (2000).
Viscous and nonviscous fibres, nonabsorbable and low glycaemic index
carbohydrates, blood lipids and coronary heart disease. Current Opinion in
Lipidology, 11(1), 49-56.
Jenkins, A. L., Jenkins, D. J., Zdravkovic, U., Wursch, P., & Vuksan, V. (2002).
Depression of the glycemic index by high levels of beta-glucan fiber in two
functional foods tested in type 2 diabetes. European Journal of Clinical
Nutrition, 56(7), 622-628.
Jenkins, D. J., Wolever, T. M., Taylor, R. H., Barker, H., Fielden, H., Baldwin, J. M.,
et al. (1981). Glycemic index of foods: A physiological basis for carbohydrate
exchange. The American Journal of Clinical Nutrition, 34(3), 362-366.
Jenkins, D. J. A., Leeds, A. R., Gassull, M. A., Cochet, B., & Alberti, K. G. M. M.
(1977). Decrease in postprandial insulin and glucose concentrations by guar and
pectin. Annals of Internal Medicine, 86(1), 20-23.
Jie, Z., Bang-Yao, L., Ming-Jie, X., Hai-Wei, L., Zu-Kang, Z., Ting-Song, W., et al.
(2000). Studies on the effects of polydextrose intake on physiologic functions in
chinese people. The American Journal of Clinical Nutrition, 72(6), 1503-1509.
Johnson, L. R. (1991). Gastrointestinal physiology. Missouri, St. Louis: Mosby Year
Book.
170
Johnson, L. R. (2014). Gastrointestinal physiology (8th ed.). Philadelphia, PA:
Elsevier Mosby.
Jones, J. R., Lineback, D. M., & Levine, M. J. (2006). Dietary reference intakes:
Implications for fiber labeling and consumption: A summary of the international
life sciences institute north america fiber workshop, june 1–2, 2004, washington,
DC. Nutrition Reviews, 64(1), 31-38.
Judd, P. A., & Ellis, P. R. (2005). 14 plant polysaccharides in the prevention and
treatment of diabetes mellitus. Traditional Medicines for Modern Times:
Antidiabetic Plants, 257.
Juvonen, K. R., Purhonen, A. K., Salmenkallio-Marttila, M., Lahteenmaki, L.,
Laaksonen, D. E., Herzig, K. H., et al. (2009). Viscosity of oat bran-enriched
beverages influences gastrointestinal hormonal responses in healthy humans. The
Journal of Nutrition, 139(3), 461-466.
Kahlon, T., Chiu, M., & Chapman, M. (2009). In vitro bile-acid-binding of whole vs.
pearled wheat grain. Cereal Chemistry, 86(3), 329-332.
Kang, K., & Pettit, D. (1993). Industrial gums. Polysaccharides and their Derivatives,
Kellett, G. L., & Brot-Laroche, E. (2005). Apical GLUT2: A major pathway of
intestinal sugar absorption. Diabetes, 54(10), 3056-3062.
Kendall, C. W., Esfahani, A., & Jenkins, D. J. (2010). The link between dietary fibre
and human health. Food Hydrocolloids, 24(1), 42-48.
171
Kerr, W., Ward, C., McWatters, K., & Resurreccion, A. A.(2000). effect of milling
and particle size on functionality and physicochemical properties of cowpea
flour. Cereal Chemistry, 77(2), 213-219.
Kim, C., & Yoo, B. (2006). Rheological properties of rice starch–xanthan gum
mixtures. Journal of Food Engineering, 75(1), 120-128.
Kristensen, M., & Jensen, M. G. (2011). Dietary fibres in the regulation of appetite
and food intake. importance of viscosity. Appetite, 56(1), 65-70.
Kuchel, P.W., & Ralston, G.B. (1997). Enzyme kinetics. In Schaum’s outline of
theory and problems in biochemistry (2nd
ed., pp. 251-274). New York, NY:
McGraw-Hill.
Kulicke, W., Eidam, D., Kath, F., Kix, M., & Kull, A. H. (1996). Hydrocolloids and
rheology: Regulation of Visco‐elastic characteristics of waxy rice starch in
mixtures with galactomannans. Starch‐stärke, 48(3), 105-114.
Kwong, M. G., Wolever, T. M., Brummer, Y., & Tosh, S. M. (2013). Attenuation of
glycemic responses by oat β-glucan solutions and viscoelastic gels is dependent
on molecular weight distribution. Food & Function, 4(3), 401-408.
Lee, R. E., Manthey, F. A., & Hall III, C. A. (2003). Effects of boiling, refrigerating,
and microwave heating on cooked quality and stability of lipids in macaroni
containing ground flaxseed. Cereal Chemistry, 80(5), 570-574.
172
Logan, K., Wright, A. J., & Goff, H. D. (2015). Correlating the structure and in vitro
digestion viscosities of different pectin fibers to in vivo human satiety. Food &
Function, 6(1), 62-70.
Mahasukhonthachat, K., Sopade, P., & Gidley, M. (2010). Kinetics of starch digestion
in sorghum as affected by particle size. Journal of Food Engineering, 96(1), 18-
28.
Maljaars, J., Peters, H., & Masclee, A. (2007). Review article: The gastrointestinal
tract: Neuroendocrine regulation of satiety and food intake. Alimentary
Pharmacology & Therapeutics, 26(s2), 241-250.
Mälkki, Y. (2001). Physical properties of dietary fiber as keys to physiological
functions. Cereal Foods World, 46(5), 196-199.
Mao, Y., & McClements, D. J. (2012). Influence of electrostatic heteroaggregation of
lipid droplets on their stability and digestibility under simulated gastrointestinal
conditions. Food & Function, 3(10), 1025-1034.
Marciani, L., Gowland, P. A., Fillery-Travis, A., Manoj, P., Wright, J., Smith, A., et
al. (2001). Assessment of antral grinding of a model solid meal with echo-planar
imaging. American Journal of Physiology.Gastrointestinal and Liver Physiology,
280(5), G844-9.
Marciani, L., Gowland, P. A., Spiller, R. C., Manoj, P., Moore, R. J., Young, P., et al.
(2000). Gastric response to increased meal viscosity assessed by echo-planar
173
magnetic resonance imaging in humans. The Journal of Nutrition, 130(1), 122-
127.
Marlett, J. A., & Fischer, M. H. (2003). The active fraction of psyllium seed husk.
Proceedings of the Nutrition Society, 62(01), 207-209.
Mazza, G., & Biliaderis, C. (1989). Functional properties of flax seed mucilage.
Journal of Food Science, 54(5), 1302-1305.
McDougall, G., Dobson, P., Shpiro, F., Smith, P., Stewart, D., & Fyffe, S. (2005,
August). Assessing bioavailability of soft fruit polyphenols in vitro. In I
International Symposium on Human Health Effects of Fruits and Vegetables 744
(pp. 135-148).
Milas, M., & Rinaudo, M. (1979). Conformational investigation on the bacterial
polysaccharide xanthan. Carbohydrate Research, 76(1), 189-196.
Miller, G. L. (1959). Use of dinitrosalicylic acid reagent for determination of reducing
sugar. Analytical Chemistry, 31(3), 426-428.
Minekus, M., Alminger, M., Alvito, P., Ballance, S., Bohn, T., Bourlieu, C., et al.
(2014). A standardised static in vitro digestion method suitable for food–an
international consensus. Food & Function, 5(6), 1113-1124.
Morris, D. H. (2001). Essential nutrients and other functional compounds in flaxseed.
Nutrition Today, 36(3), 159-162.
174
Nakamura, A., Fujii, N., Tobe, J., Adachi, N., & Hirotsuka, M. (2012).
Characterization and functional properties of soybean high-molecular-mass
polysaccharide complex. Food Hydrocolloids, 29(1), 75-84.
Nakamura, A., Furuta, H., Maeda, H., Takao, T., & Nagamatsu, Y. (2002). Structural
studies by stepwise enzymatic degradation of the main backbone of soybean
soluble polysaccharides consisting of galacturonan and rhamnogalacturonan.
Bioscience, Biotechnology, and Biochemistry, 66(6), 1301-1313.
Nakamura, A., Yoshida, R., Maeda, H., & Corredig, M. (2006). Soy soluble
polysaccharide stabilization at oil–water interfaces. Food Hydrocolloids, 20(2),
277-283.
Nalin, T., Koen, V., Weinstein, D. A., de Souza, C. F., Perry, I. D., van Wandelen, M.
T., et al. (2014). In vitro digestion of starches in a dynamic gastrointestinal
model: An innovative study to optimize dietary management of patients with
hepatic glycogen storage diseases. Journal of Inherited Metabolic Disease, , 1-8.
Nik, A. M., Wright, A. J., & Corredig, M. (2010). Surface adsorption alters the
susceptibility of whey proteins to pepsin-digestion. Journal of Colloid and
Interface Science, 344(2), 372-381.
Nilsson, A. C., Ostman, E. M., Holst, J. J., & Bjorck, I. M. (2008). Including
indigestible carbohydrates in the evening meal of healthy subjects improves
glucose tolerance, lowers inflammatory markers, and increases satiety after a
subsequent standardized breakfast. The Journal of Nutrition, 138(4), 732-739.
175
Oomen, A., Rompelberg, C., Bruil, M., Dobbe, C., Pereboom, D., & Sips, A. (2003).
Development of an in vitro digestion model for estimating the bioaccessibility of
soil contaminants. Archives of Environmental Contamination and Toxicology,
44(3), 0281-0287.
Owusu-Asiedu, A., Patience, J., Laarveld, B., Van Kessel, A., Simmins, P., & Zijlstra,
R. (2006). Effects of guar gum and cellulose on digesta passage rate, ileal
microbial populations, energy and protein digestibility, and performance of
grower pigs. Journal of Animal Science, 84(4), 843-852.
Panahi, S., Ezatagha, A., Temelli, F., Vasanthan, T., & Vuksan, V. (2007). β-Glucan
from two sources of oat concentrates affect postprandial glycemia in relation to
the level of viscosity. Journal of the American College of Nutrition, 26(6), 639-
644.
Pastrana, L., Gonzalez, M., Mirón, J., & Murado, M. (1998). A new device for
measuring diffusional restrictions and modelling substrate inhibition in a starch-
glucoamylase system. Biotechnology Letters, 20(2), 127-130.
Paxman, J., Richardson, J., Dettmar, P., & Corfe, B. (2008). Daily ingestion of
alginate reduces energy intake in free-living subjects. Appetite, 51(3), 713-719.
Phillips, G. O. (2013). Dietary fibre: A chemical category or a health ingredient?
Bioactive Carbohydrates and Dietary Fibre, 1(1), 3-9.
176
Public Health Agency of Canada. (2009). Tracking heart disease and stroke in
Canada. Retrieved September 10, 2014, from http://www.phac-
aspc.gc.ca/publicat/2009/cvd-avc/pdf/cvd-avs-2009-eng.pdf
Public Health Agency of Canada. (2013). Preventing chronic disease strategic plan
2013-2016. Retrieved September 10, 2014, from http://www.phac-aspc.gc.ca/cd-
mc/diabetes-diabete/strategy_plan-plan_strategique-eng.php
Qian, K., Cui, S., Wu, Y., & Goff, H. (2012). Flaxseed gum from flaxseed hulls:
Extraction, fractionation, and characterization. Food Hydrocolloids, 28(2), 275-
283.
Ramdath, D. D., Padhi, E., Hawke, A., Sivaramalingam, T., & Tsao, R. (2014). The
glycemic index of pigmented potatoes is related to their polyphenol content. Food
& function, 5(5), 909-915.
Redard, C. L., Davis, P. A., & Schneeman, B. O. (1990). Dietary fiber and gender:
Effect on postprandial lipemia. The American Journal of Clinical Nutrition,
52(5), 837-845.
Regand, A., Chowdhury, Z., Tosh, S. M., Wolever, T. M., & Wood, P. (2011). The
molecular weight, solubility and viscosity of oat beta-glucan affect human
glycemic response by modifying starch digestibility. Food Chemistry, 129(2),
297-304.
177
Renou, F., Petibon, O., Malhiac, C., & Grisel, M. (2013). Effect of xanthan structure
on its interaction with locust bean gum: Toward prediction of rheological
properties. Food Hydrocolloids, 32(2), 331-340.
Rinaudo, M., & Milas, M. (1982). Xanthan properties in aqueous solution.
Carbohydrate Polymers, 2(4), 264-269.
Roberfroid, M. B., Van Loo, J. A., & Gibson, G. R. (1998). The bifidogenic nature of
chicory inulin and its hydrolysis products. The Journal of Nutrition, 128(1), 11-
19.
Roberts, F., Smith, H., Low, A., Ellis, P., Morris, E., & Sambrook, I. (1989).
Influence of guar gum flour of different molecular weights on viscosity of jejunal
digesta in the pig. Proc Nutr Soc, 49, 53A.
Roberts, K. (2011). The physiological and rheological effects of foods supplemented
with guar gum. Food Research International, 44(5), 1109-1114.
Sajjan, S. U., & Rao, M. R. (1987). Effect of hydrocolloids on the rheological
properties of wheat starch. Carbohydrate Polymers, 7(5), 395-402.
Sasaki, T., & Kohyama, K. (2011). Effect of non-starch polysaccharides on the in
vitro digestibility and rheological properties of rice starch gel. Food Chemistry,
127(2), 541-546.
178
Sasaki, T., & Kohyama, K. (2012). Influence of non-starch polysaccharides on the in
vitro digestibility and viscosity of starch suspensions. Food Chemistry, 133(4),
1420-1426.
Schneeman, B. O. (1998). Dietary fiber and gastrointestinal function. Nutrition
Research, 18(4), 625-632.
Schulze, M. B., & Hu, F. B. (2005). Primary prevention of diabetes: What can be done
and how much can be prevented? Annu.Rev.Public Health, 26, 445-467.
Shimotoyodome, A., Meguro, S., Hase, T., Tokimitsu, I., & Sakata, T. (2001).
Sulfated polysaccharides, but not cellulose, increase colonic mucus in rats with
loperamide-induced constipation. Digestive Diseases and Sciences, 46(7), 1482-
1489.
Singh, J., Dartois, A., & Kaur, L. (2010). Starch digestibility in food matrix: A
review. Trends in Food Science & Technology, 21(4), 168-180.
Slavin, J., & Green, H. (2007). Dietary fibre and satiety. Nutrition Bulletin, 32(s1),
32-42.
Slavin, J. (2013). Fiber and prebiotics: Mechanisms and health benefits. Nutrients,
5(4), 1417-1435.
Slavin, J., & Jacobs Jr, D. R. (2010). Dietary fiber: All fibers are not alike. Nutrition
guide for physicians (pp. 13-24) Springer.
179
Southgate, D. (1969). Determination of carbohydrates in foods II.—Unavailable
carbohydrates. Journal of the Science of Food and Agriculture, 20(6), 331-335.
Sreerama, Y. N., Sashikala, V. B., & Pratape, V. M. (2012). Phenolic compounds in
cowpea and horse gram flours in comparison to chickpea flour: Evaluation of
their antioxidant and enzyme inhibitory properties associated with hyperglycemia
and hypertension. Food Chemistry, 133(1), 156-162.
Steffe, J. F. (1996). Rheological methods in food process engineering Freeman press.
Streppel, M. T., Arends, L. R., van’t Veer, P., Grobbee, D. E., & Geleijnse, J. M.
(2005). Dietary fiber and blood pressure: A meta-analysis of randomized
placebo-controlled trials. Archives of Internal Medicine, 165(2), 150-156.
Sudhakar, V., Singhal, R., & Kulkarni, P. (1996). Starch-galactomannan interactions:
Functionality and rheological aspects. Food Chemistry, 55(3), 259-264.
Symons, L., & Brennan, C. (2004). The influence of (1→ 3)(1→ 4)‐β‐D‐Glucan‐rich
fractions from barley on the physicochemical properties and in vitro reducing
sugar release of white wheat breads. Journal of Food Science, 69(6), C463-C467.
Takahashi, H., Wako, N., Okubo, T., Ishihara, N., Yamanaka, J., & Yamamoto, T.
(1994). Influence of partially hydrolyzed guar gum on constipation in women.
Journal of Nutritional Science and Vitaminology, 40(3), 251-259.
Takeda, Y., Hizukuri, S., & Juliano, B. O. (1986). Purification and structure of
amylose from rice starch. Carbohydrate Research, 148(2), 299-308.
180
Teaford, M. F., & Ungar, P. S. (2000). Diet and the evolution of the earliest human
ancestors. Proceedings of the National Academy of Sciences of the United States
of America, 97(25), 13506-13511.
Thakur, G., Mitra, A., Pal, K., & Rousseau, D. (2009). Effect of flaxseed gum on
reduction of blood glucose and cholesterol in type 2 diabetic patients.
International Journal of Food Sciences and Nutrition, 60(s6), 126-136.
Tharakan, A., Norton, I., Fryer, P., & Bakalis, S. (2010). Mass transfer and nutrient
absorption in a simulated model of small intestine. Journal of Food Science,
75(6), E339-E346.
Tharakan, A., Norton, I., Fryer, P., & Bakalis, S. (2010). Mass transfer and nutrient
absorption in a simulated model of small intestine. Journal of Food Science,
75(6), E339-E346.
Threapleton, D. E., Greenwood, D. C., Evans, C. E., Cleghorn, C. L., Nykjaer, C.,
Woodhead, C., et al. (2013). Dietary fibre intake and risk of cardiovascular
disease: Systematic review and meta-analysis. BMJ (Clinical Research Ed.), 347,
f6879.
Topping, D. L., & Clifton, P. M. (2001). Short-chain fatty acids and human colonic
function: Roles of resistant starch and nonstarch polysaccharides. Physiological
Reviews, 81(3), 1031-1064.

181
Tsai, A. C., Mott, E. L., Owen, G. M., Bennick, M. R., Lo, G. S., & Steinke, F. H.
(1983). Effects of soy polysaccharide on gastrointestinal functions, nutrient
balance, steroid excretions, glucose tolerance, serum lipids, and other parameters
in humans. The American Journal of Clinical Nutrition, 38(4), 504-511.
Tungland, B., & Meyer, D. (2002). Nondigestible oligo‐and polysaccharides (dietary
fiber): Their physiology and role in human health and food. Comprehensive
Reviews in Food Science and Food Safety, 1(3), 90-109.
U.S. Food and Drug Administration (FDA). (2013). Guidance for industry: A food
labeling guide (11. appendix C: Health claims). Retrieved September 25, 2014,
from
http://www.fda.gov/Food/GuidanceRegulation/GuidanceDocumentsRegulatoryIn
formation/LabelingNutrition/ucm064919.htm
Urlacher, B., & Noble, O. (1997). Xanthan gum. Thickening and gelling agents for
food (pp. 284-311) Springer.
Varatharajan, V., Hoover, R., Li, J., Vasanthan, T., Nantanga, K., Seetharaman, K., et
al. (2011). Impact of structural changes due to heat-moisture treatment at
different temperatures on the susceptibility of normal and waxy potato starches
towards hydrolysis by porcine pancreatic alpha amylase. Food Research
International, 44(9), 2594-2606.
Vardakou, M., Mercuri, A., Barker, S. A., Craig, D. Q., Faulks, R. M., & Wickham,
M. S. (2011). Achieving antral grinding forces in biorelevant in vitro models:
182
Comparing the USP dissolution apparatus II and the dynamic gastric model with
human in vivo data. Aaps Pharmscitech, 12(2), 620-626.
Vieira, F. C., & Sarmento, S. (2008). Heat‐Moisture treatment and enzymatic
digestibility of peruvian carrot, sweet potato and ginger starches. Starch‐stärke,
60(5), 223-232.
Wang, J., Zeng, A., Liu, Z., & Yuan, X. (2006). Kinetics of glucoamylase hydrolysis
of corn starch. Journal of Chemical Technology and Biotechnology, 81(4), 727-
729.
White, G., Doucet, F., Hill, S., & Wiseman, J. (2008). Physicochemical changes to
starch granules during micronisation and extrusion processing of wheat, and their
implications for starch digestibility in the newly weaned piglet. Animal, 2:9,
1312–1323
Wickham, M., Faulks, R., Mann, J., & Mandalari, G. (2012). The design, operation,
and application of a dynamic gastric model. Dissolution Technologies, 19(3), 15-
22.
Wielinga W. (2010). Seed Gums (From Imeson A’s Food Stabilisers, Thickeners and
Gelling Agents). Ames, Iowa: Wiley-Blackwell Publishing Ltd.
Wielinga W. & Maehall AG. (2000). Galactomannans (From Phillips’ & Williams’
Handbook of Hydrocolloids). NY, New York: CRC Press.
183
Wiseman, J. (2006). Variations in starch digestibility in non-ruminants. Animal Feed
Science and Technology, 130(1), 66-77.
Wolever, T. M., Tosh, S. M., Gibbs, A. L., Brand-Miller, J., Duncan, A. M., Hart, V.,
et al. (2010). Physicochemical properties of oat beta-glucan influence its ability
to reduce serum LDL cholesterol in humans: A randomized clinical trial. The
American Journal of Clinical Nutrition, 92(4), 723-732.
Wood, P., Braaten, J. T., Scott, F.W., Riedel, K.D., Wolynetz, M.S., & Collins, M.W.
(1994). Effect of dose and modification of viscous properties of oat gum on
plasma glucose and insulin following an oral glucose load. British Journal of
Nutrition, 72:731-743.
Wood, P., Beer, M., & Butler, G. (2000). Evaluation of role of concentration and
molecular weight of oat β-glucan in determining effect of viscosity on plasma
glucose and insulin following an oral glucose load. British Journal of Nutrition,
84(01), 19-23.
Woolnough, J. W., Monro, J. A., Brennan, C. S., & Bird, A. R. (2008). Simulating
human carbohydrate digestion in vitro: A review of methods and the need for
standardisation. International Journal of Food Science & Technology, 43(12),
2245-2256.
World Health Organization. (2003). Screening for type 2 diabetes. Retrieved
September 10 2014, from
http://www.who.int/diabetes/publications/en/screening_mnc03.pdf
184
Wrick, K. L., Robertson, J. B., Van Soest, P. J., Lewis, B. A., Rivers, J. M., Roe, D.
A., et al. (1983). The influence of dietary fiber source on human intestinal transit
and stool output. The Journal of Nutrition, 113(8), 1464-1479.
Wursch, P., & Pi-Sunyer, F. X. (1997). The role of viscous soluble fiber in the
metabolic control of diabetes. A review with special emphasis on cereals rich in
beta-glucan. Diabetes Care, 20(11), 1774-1780.
Yamatoya, K., Kuwano, K., & Suzuki, J. (1997). Effects of hydrolyzed guar gum on
cholesterol and glucose in humans. Food Hydrocolloids, 11(2), 239-242.
Zhang, J., Cui, J. H., Yin, T., Sun, L., & Li, G. (2013). Activated effect of lignin on α-
amylase. Food Chemistry, 141(3), 2229-2237.


![Alpha-synucleinaltersdifferentlygeneexpressionofSirts ... · mers which subsequently can aggregate into soluble protofibrils and insoluble β-amyloid fibres [9]. Recent data haveindicated](https://img.pdfslide.us/doc/110x75/5e634eabc469ab7a0c1b0dc3/alpha-synucleinaltersdifferentlygeneexpressionofsirts-mers-which-subsequently.jpg)