Embed Size (px)
Citation preview

Understanding the economic impact of Brexit
Gemma Tetlow | Alex Stojanovic

October 2018
About this reportThe UK’s exit from the EU marks a step-change in the country’s economic relationship with the bloc. The UK will be moving away from close integration and co-operation with its nearest neighbours, while potentially reopening the opportunity to negotiate trade deals directly with non-EU countries.
Many analyses have tried to estimate what effect Brexit is likely to have on the UK economy. These economic considerations are one of the questions that will weigh on MPs’ minds when they come to scrutinise and vote on the Government’s withdrawal agreement later this year. Prime Minister Theresa May has said her government will publish its assessment of the likely economic impact of the proposed Brexit deal with the EU, which should help MPs decide how to cast their ‘meaningful vote’ on the agreement.
Most studies published to date conclude that Brexit will reduce economic growth – although the scale of the predicted reduction varies widely. This report attempts to make clear the assumptions that different studies have made, what evidence they have to support them, and why this leads to such diverse conclusions about the possible economic consequences of Brexit for the UK economy.

Contents
List of figures and tables 2
Summary and recommendations 3
1. Introduction 7
Immediate economic impact of the vote for Brexit 8
Long-term economic impact of Brexit 10
Outline of this report 11
2. How Brexit might affect the UK economy 12
Trade 12
Foreign direct investment 14
Number and type of workers 15
Regulations 16
Productivity 17
Value of sterling 18
Other policy responses 18
3. How large is the impact likely to be? 20
Describing the long-term economic impact of Brexit 23
What would happen if the UK stayed in the EU? 24
Ways of modelling the economy 25
Trade costs 27
Investment 41
Domestic regulations 42
Migration 44
Contributions to the EU budget 45
Productivity growth 46
4. How will the impact vary across the UK? 48
Distributional implications of the Economists for Free Trade model 48
How will Brexit affect different sectors of the economy? 49
How will Brexit affect different regions of the UK? 53
How will Brexit affect people in different income groups? 55

2 UNDERSTANDING THE ECONOMIC IMPACT OF BREXIT
5. From here to there: the economic implications of adapting to a new relationship 57
Short-term disruption could be significant… 57
…but some costs associated with divergence could take time to emerge 58
Conclusion 60
Appendix: Overview of existing studies of the economic impact of Brexit 64
References 67
List of figures and tables
Figure 1 Forecast long-term impact of Brexit on GDP, relative to remaining in the EU 4
Figure 2 Forecast long-term impact of Brexit on GDP, relative to remaining in the EU 22
Figure 3 Forecast long-term impact of Brexit on per capita GDP, relative to remaining in the EU 24
Figure 4 Comparison of estimates of non-tariff barriers by sector (% tariff rate equivalent) 33
Table 1 Assumptions about free trade agreements with non-EU countries 31
Table 2 How much would non-tariff barriers to trade change following Brexit? 38
Table 3 Comparing the estimated impact of Brexit on UK economic output, with and without allowance for an effect on productivity 47
Table 4 Uncertainty around the central projections for the economic impact of Brexit 64
Table 5 Assumptions about changes to foreign direct investment (FDI) post-Brexit 65
Table 6 Assumptions about changes to migration post-Brexit 66

3SUMMARY AND RECOMMENDATIONS
Summary and recommendationsThe UK’s exit from the EU marks a step-change in the country’s economic relationship with the bloc. The UK will be moving away from close integration and co-operation with its nearest neighbours, but potentially reopening the opportunity to negotiate trade deals directly with non-EU countries.
Economic considerations are one important part of the Brexit debate, but not the only question that will weigh on MPs’ minds when they come to scrutinise and vote on the Government’s withdrawal agreement and proposed framework for a future relationship with the EU later this year.
Prime Minister Theresa May has said that her government will publish its assessment of the likely economic impact of the proposed Brexit deal with the EU as set out in the political declaration on the future framework, even though the legal binding element on which MPs will be voting is the withdrawal agreement itself. This information should help MPs decide how to cast their ‘meaningful vote’ on the agreement.
Many different organisations have published estimates already of how Brexit might affect the UK economy in the longer term, including two produced by government: one published officially by the Treasury before the referendum, and a preliminary version of some government analysis leaked to the press in January 2018. All of these analyses have tried to provide answers to the question: “How much larger or smaller will the UK economy be in future if the UK leaves the EU than it would have been, had the UK remained a member of the bloc?”
The answers vary hugely, as Figure 1 shows. The vast majority of studies conclude that Brexit will reduce economic growth – although the scale of reduction predicted differs. Only one study (by the Economists for Free Trade, EFT) concludes that the UK economy would receive a significant boost from Brexit. Mostly, the differences are not down to hard-to-fathom variation in the complex underlying economic models. Instead, the different answers largely reflect variation in the assumptions fed into those models.
This report attempts to make clear the assumptions that different studies have made, what evidence they have to support them, and why this leads them to reach diverse conclusions about the possible economic consequences of Brexit for the UK economy.
While these long-term projections provide important information about how Brexit will affect the UK economy, they do not provide a full picture of the possible, shorter-term impact of any particular Brexit deal (or lack thereof). In particular, long-term projections for a scenario in which the UK and EU trade with one another on World Trade Organization (WTO) terms are often referred to in the public debate as a ‘no deal’ scenario. However, the short-term impact of talks breaking down and the UK crashing out of the EU without any form of deal would likely be much more disruptive than these long-term WTO projections suggest.

4 UNDERSTANDING THE ECONOMIC IMPACT OF BREXIT
Figure 1: Forecast long-term impact of Brexit on GDP, relative to remaining in the EU
Rabobank
CEP Dynamic
CPB DynamicTreasury HMG
CPB StaticRand
NIESROxford
PwCCEP Static
CiuriakBertelsmann
OE
EFT
-20%
-15%
-10%
-5%
0%
5%
10%
European Economic Area Swiss bilaterals Free Trade Agreement World Trade Organization Unilateral Free TradeTrading scenario
Source: Institute for Government analysis
CEP – Centre for Economic Performance, CPB – Netherlands Bureau for Economic Policy Analysis, EFT – Economists for Free Trade, HMG – HM Government, NIESR – National Institute of Economic and Social Research, OE – Open Europe, Oxford – Oxford Economics
The headline estimates of the long-term impact of Brexit could also hide variation across different types of businesses, regions of the country, or richer and poorer individuals. Most of the economic models that have been used to predict Brexit’s overall effect on the UK economy cannot look at this more granular detail. However, these sorts of distributional questions are likely to be of interest to MPs, to help them understand how any proposed deal could affect their constituency.
To get a handle on these questions, a number of economists have tried to use insights from big picture economic models to infer something about the distributional implications. These analyses suggest that certain sectors such as clothing manufacturing, and high-tech industries such as aerospace, will be heavily affected by Brexit because of these industries’ reliance on imports from and exports to the EU. Meanwhile, some sectors such as agriculture and food processing could benefit from any new trade barriers that arise between the UK and the EU.
Looking at the impact across the income distribution, most analysis published so far suggests that all income groups will be hit similarly hard by any negative impact of Brexit. Lower-income households are likely to be more adversely affected by increases in the price of goods (particularly food), but higher-income households are more likely to be adversely affected through lower wages, as they are more likely to work for export-oriented businesses.
Existing studies have reached mixed conclusions about the impact on different areas of the country. It is unclear whether Brexit is likely to exacerbate or diminish existing regional inequalities. At least one study has concluded that London and the South East – with their large service sectors – could be most adversely affected. However, other studies have suggested that the Midlands and parts of the North, which have a greater reliance on manufacturing industries that are heavily integrated into European supply chains, could be most affected instead.

5SUMMARY AND RECOMMENDATIONS
On the basis of our analysis of other studies, we have nine recommendations for what the Government must do when presenting its final analysis, to help ensure that MPs (and other interested observers) are able to:
• assess whether the Government’s conclusion is a reasonable, central estimate on the basis of the best available evidence
• weigh up what impact Brexit might have on their constituency
• ultimately decide how to cast their vote.
Recommendations
1. Make assumptions transparent. Assumptions made about the impact of Brexit on trade barriers, migration, investment and, in particular, productivity can have large effects on the estimates of the economic consequences of leaving the EU. The final results of the Government’s analysis must be transparent about what has been assumed in these areas.
2. Clarify migration and regulatory policy assumptions.Brexit opens up the possibility of changing migration policy, regulations and trade arrangements with non-EU countries, which could have material economic consequences. Not all of these policy changes will be nailed down in the next few months, but the Government must still make clear in its final analysis what has been assumed about future changes in these areas.
3. Exclude non-Brexit policy changes. In our view, the Government should not factor into its Brexit projections any policy changes that would have been possible even without Brexit. Some commentators have argued that Brexit will provide an impetus to, for example, radically reform skills training in the UK. While the Government should continue to consider such policies on their own merit, they should not be presented as being part of the economic consequence of Brexit.
4. Clarify baseline assumptions. All the assessments of Brexit’s economic impact that have been published so far (including the leaked Government analysis) have assessed how UK economic output post-Brexit would compare to output in a hypothetical future world in which the UK remained a member of the EU. If the Government’s final analysis also follows this approach, it needs to make clear what is assumed to happen in this future world, and what exactly the UK forgoes or benefits from by exiting the EU.
5. Ensure the consistency and plausibility of assumptions. The Government must avoid the trap that some independent studies have fallen into of including inconsistent or implausible sets of assumptions. The most common pitfall that some studies have fallen into is presenting a scenario that includes both a deep relationship with the EU, and a free trade agreement with the USA. This is likely to be impossible, due to the incompatibilities of regulations in the two systems.

6 UNDERSTANDING THE ECONOMIC IMPACT OF BREXIT
6. Provide a range of uncertainty.There will be considerable uncertainty surrounding any estimate of the Brexit impact. To help MPs and other interested observers to understand how to interpret the figures, the Government should publish a confidence interval around any central estimate: that is, a range within which they are reasonably certain the figure will lie.
7. Show the sensitivity of results. To provide further reassurance that the predictions reflect the best central estimate of the likely effect, the Government should show the sensitivity of its results to alternative plausible assumptions. This should help avoid the analysis being presented as a definitive guide to the future, and instead make clear that it is just a reasonable simulation of certain evidence-based assumptions.
8. Set out regional and sectoral impacts. As far as possible, the Government should make clear how different sectors and regions of the economy are likely to be affected by the proposed deal – particularly in cases where the effect on a specific sector or region is expected to be very different from the average effect for the country as a whole.
9. Outline short-term impacts. MPs and UK residents will care not only about the long-term impact of the Brexit deal, but also about what happens in the short-term – particularly if this could be more disruptive than long-term projections suggest. Even if the Government does not provide a full medium-term economic forecast, it should outline whether and how it expects the short-term impact of Brexit to differ from the projected long-term impact.

7INTRODUCTION
1. Introduction“Given the vital role that Parliament will play in approving the terms of our withdrawal from the EU and the framework for our future relationship, the Government has committed to providing Parliament with appropriate analysis prior to the vote being held. This information will ensure that Parliament can make an informed decision about the implications of our new relationship with the EU in all areas.”1
The UK’s exit from the EU marks a step-change in the country’s economic relationship with the bloc. The UK will be moving away from close integration and co-operation with its nearest neighbours, but potentially reopening the opportunity to negotiate trade deals directly with non-EU countries.
Economic considerations are one important part of the Brexit debate, but not the only question that will weigh on MPs’ minds when they come to scrutinise and vote on the Government’s withdrawal agreement and proposed framework for a future relationship with the EU later this year.
Prime Minister Theresa May said in January 20182 that the Government’s own assessment of the long-term economic impact would be published imminently, providing “appropriate analysis” to allow MPs to make an “informed decision”.
But economic predictions always entail a degree of uncertainty, and those produced in relation to Brexit – including by the Government – have provoked inevitable disagreement. Preliminary government analysis – leaked to Buzzfeed News earlier this year – was quickly dismissed by some Brexit supporters as being further biased analysis from Treasury officials intent on undermining Brexit.* When asked about this analysis in Parliament, David Davis – then Secretary of State for Exiting the EU – downplayed the results by saying “we are trying to do something that is incredibly difficult. Every institution that has tried it has failed… Every forecast that has been made about the period post-referendum has been wrong”.3
The febrile political atmosphere that surrounds Brexit means that it is essential for politicians and interested members of the public to understand how to interpret the projections that have been made about the economic impact of Brexit, what economists do and do not know, and why different analyses have come up with seemingly very different answers.** Without a proper understanding of how to interpret
* In an extraordinary move, Steve Baker (at the time a junior minister) told Parliament in February 2018 that it was “essentially correct” to say that “officials in the Treasury have deliberately developed a model to show that all options other than staying in the Customs Union are bad, and that officials intend to use the model to influence policy”. ‘Oral Answers to Questions’, Hansard, 1 February 2018, vol. 635, retrieved 10 October 2018, https://hansard.parliament.uk/Commons/2018-02-01/debates/7A6FD82E-03C2-406C-9816-13FD2EE4AA0B/OralAnswersToQuestions
** We are certainly not the first to attempt to provide a summary of studies that have estimated the economic impact of Brexit. Emmerson, Johnson, Mitchell and Phillips in 2016 and Busch and Matthes in 2016 are excellent examples. However, we have attempted to add to these existing pieces by including more recently published studies and providing an explanation of the main issues aimed at a non-technical audience. Emmerson C, Johnson P, Mitchell I and Phillips D, ‘Brexit and the UK’s Public Finances’, IFS Report 116, 2016, retrieved on 11 October 2018, www.ifs.org.uk/uploads/publications/comms/r116.pdf. Busch B and Matthes J, ‘Brexit: The Economic Impact – A Survey’, CESifo, 2016, retrieved on 11 October 2018, www.cesifo-group.de/DocDL/forum-2016-2-busch-matthes-brexit-june.pdf

8 UNDERSTANDING THE ECONOMIC IMPACT OF BREXIT
these figures, any analysis published by the Government risks being dismissed by one side or the other as partial and biased, rather than being soberly analysed, critiqued and used by MPs to help them decide how to vote.
At the core of every analysis is an assessment of how Brexit will affect the UK’s trading arrangements with the EU and other countries, and how this in turn will affect UK economic growth. Stronger economic growth means that household incomes rise more rapidly on average, allowing voters to enjoy higher living standards. It also means that tax revenues tend to grow more strongly, which could make more resources available for public services. Different patterns of economic growth benefit different parts of the country, and different sectors of the economy.
Projecting what the economic impact of Brexit will be is not a trivial task, but economists draw on a number of methods, tools and evidence to highlight the ways in which Brexit is likely to impact the economy, and to guide policy makers on their likely magnitude. In this report we highlight the strength of the available evidence, and which judgements matter most for the size of Brexit impact that each study has predicted.
Immediate economic impact of the vote for BrexitBefore the referendum, the Treasury predicted that a vote for Brexit would lead to an immediate recession.4 The Bank of England’s central forecast was for the UK economy to keep growing, but the Bank’s Governor Mark Carney said that the risks of a vote to leave “could possibly include a technical recession” – that is, economic output would contract for at least two consecutive quarters.5 This possibility, which, even at the time, many other economic forecasters thought unlikely,* did not in fact materialise. While UK economic growth has slowed since June 2016, there has been no recession.**
The Treasury’s short-term forecasts were proved wrong because they assumed that several things would happen, which ultimately did not.
First, they assumed that the prospect of leaving the EU – and uncertainty about how it would happen – would cause households and businesses to take fright and immediately cut back on their spending, as they hunkered down to wait and see how events would unfold.
Second, they assumed that the Bank of England would do nothing. Third, they assumed that the Chancellor would respond to a ‘Leave’ vote by immediately announcing an emergency budget to raise taxes and cut spending. Former Chancellor George Osborne warned before the referendum that this would be unavoidable.6
* Other forecasters – including the International Monetary Fund (IMF), Organisation for Economic Cooperation and Development (OECD) and National Institute of Economic and Social Research (NIESR) – predicted in their pre-referendum forecasts that the UK economy would continue to grow in 2016 and 2017, albeit less quickly than in 2015. For an assessment of the performance of various pre-Brexit forecasts, see Kara A, Brexit Forecasters: How did they perform?, National Institute of Economic and Social Research, 2017, retrieved 11 October 2018 www.niesr.ac.uk/blog/brexit-forecasters-how-did-they-perform
** For a recent summary of UK economic growth since the Brexit referendum, see Giles C, ‘The UK economy since the Brexit vote – in 5 charts’, Financial Times, 31 July 2018, retrieved 10 0ctober 2018, www.ft.com/content/cf51e840-7147-11e7-93ff-99f383b09ff9. For a discussion of how growth since the referendum has compared to forecasts made before the vote, see Giles C, ‘What are the economic effects of Brexit so far?’ Financial Times, 24 June 2018, retrieved 10 October 2018, www.ft.com/content/dfafc806-762d-11e8-a8c4-408cfba4327c

9INTRODUCTION
Since the referendum, business investment growth has slowed. Business investment in the first quarter of 2018 was only 2.3% higher than at the time of the referendum, compared to the Bank of England’s pre-referendum forecast for 13% growth. Surveys of business decision makers suggest that some businesses are holding back from making irreversible investment decisions until it is clear what the UK’s future relationship with the EU and other countries will be.7
However, households have carried on spending. This fact probably should not have come as a surprise, since more than half of those who cast a vote thought that Brexit would be a positive outcome for the country – but it is not what some economists had factored into their short-term forecasts.
Rather than do nothing, the Bank of England’s Monetary Policy Committee stepped in straight after the referendum to cut interest rates, increase liquidity by purchasing government and corporate debt, and provide banks with access to cheap finance to help support lending to businesses and households. Mark Carney estimates that these actions have helped to boost economic growth by between 0.5% and 1% over the past two years.
Meanwhile the new Chancellor, Philip Hammond, allowed fiscal policy to support the economy, rather than depressing growth by raising taxes and cutting spending. In the 2016 Autumn Statement, the Office for Budget Responsibility estimated that government borrowing was likely to be £73 billion (bn) higher over the four years from 2017/18 to 2020/21 as a result of a deterioration in the economic outlook. Rather than stepping in to offset this, the Chancellor allowed borrowing to increase and actually chose to increase government borrowing somewhat further (by an additional £25bn over this period) by increasing investment spending, rowing back from some previously planned cuts to benefits, and cancelling planned increases in fuel duties.8
Even though the UK has not had a recession since the referendum, there is a variety of evidence that economic performance has been weaker than it probably would have been, had the British public voted ‘Remain’. The pound has devalued by 11% against other major currencies* – an indication that foreign investors have less confidence in the UK’s economic prospects. UK economic growth has been weaker since 2016 than pre-referendum forecasts suggested, while all other major economies have experienced stronger than expected growth.9 The Centre for European Reform has estimated that the UK economy was around 2.5% smaller by the end of June 2018 than it would have been, had the vote gone the other way.10 Using a similar sort of approach, other researchers have concluded that the UK economy is 2% smaller than it otherwise would have been, and predict that this will rise to 3.4% by the end of 2019.11
As a result, the UK has dropped from the top to the bottom of the league table in terms of economic growth among the G7 group of major advanced economies.12 Other researchers also have concluded that UK exports have grown less quickly13 than they would have done, had the vote gone the other way – with around 5% fewer firms
* Between 23 June 2016 and 21 September 2018, the UK’s effective exchange rate (measured against a trade-weighted basket of currencies) depreciated by 11%. Source: Bank of England, Effective Exchange Rate Index, XUDLBK67.

10 UNDERSTANDING THE ECONOMIC IMPACT OF BREXIT
starting to export to the EU, and more dropping out of the EU export market than otherwise would have happened.14
Long-term economic impact of BrexitThose short-term economic forecasts have attracted much attention and criticism. Because the economy did not enter a recession, as the gloomiest pre-referendum forecasts suggested, some commentators have cast doubt on all the predictions that have been made by economists about the likely economic consequences of Brexit.*
However, the short-term forecasts use very different methods and assumptions from the studies that attempt to project what Brexit’s longer-term impact will be on the UK economy. While the short-term forecasts sought to answer the question “How quickly will the economy grow over the next few years?”, the long-term forecasts seek to answer the question: “How much larger or smaller will the UK economy be in 2030 following Brexit than it would have been, had the UK remained an EU member?”
Often, the two different types of forecasts – understandably, but unhelpfully – are conflated and confused in the public debate. Nevertheless, clarity is urgently needed as we approach the crucial parliamentary vote on the proposed deal. There are grounds on which to critique and debate any single Brexit impact projection, but this must be done on appropriate, rather than spurious, grounds.
The aim of this report is to help non-economists to interpret the range of available information, making clear:
• what is known (and with what degree of precision) about what the most appropriate assumptions are, to put into the models
• which aspects of the deal and other future policies are most important for determining how the UK economy is likely to be affected by leaving the EU.
Drawing on our analysis of a range of published studies,** we highlight what questions need to be answered when the Government publishes its own analysis. Answering these questions will ensure that MPs have the information they need to scrutinise the Government’s analysis, and to cast an informed vote.
The political debate around the official analysis of the Brexit impact has been unusually heated. Despite the multitude of existing work examining the possible long-term economic impact of Brexit, the debate within both government and Parliament remains polarised, with no agreement – even among government ministers – on what the impact of different Brexit deals is likely to be.
* For example, see Wallace M, ‘Don’t believe the Brexit doomsayers: Project Fear’s predictions in 2016 were wrong. They will be wrong again’, iNews, 30 July 2018, retrieved 2 October 2018, https://inews.co.uk/opinion/brexit-project-fear-david-cameron
** We include 12 independent studies – this covers virtually all of the publicly available ones of which we are aware plus some others (such as those from the NIESR) that are not freely available, but have made an important contribution to the debate. We also include the two sets of long-term projections produced by the Government: one from the Treasury before the referendum, and the Government analysis leaked to the media in January 2018.

11INTRODUCTION
It is always desirable for governments to be transparent, but in this instance it is particularly crucial that the Government makes clear how it has reached its answers about the impact of Brexit.
Outline of this reportThe vast majority – although not all – of existing studies suggest that leaving the EU will reduce UK economic growth, compared to what would happen if the UK remained in the EU. However, the estimates vary of exactly how large this hit will be.
Chapter 2 outlines how, in principle, Brexit might affect the UK economy in the longer term.
Chapter 3 summarises the results of a range of studies estimating the potential impact of Brexit on the UK economy. It describes the main approaches that have been taken, the main assumptions that underlie the different estimates, and the strength of the evidence on which they are based.
Chapter 4 examines how any given deal with the EU is likely to affect different sectors of the economy and regions of the country – digging beneath the headline estimates of the impact on aggregate economic output in order to understand which areas, and which people, could be more or less affected.
The analysis focuses on the impact of Brexit on UK economic output in the longer term – that is, after the UK has adjusted to a new relationship with the EU and the rest of the world.
Chapter 5 provides a brief discussion of the short- and medium-term costs of adjusting to this new world.
Chapter 6 concludes the report. The Appendix provides an overview of the assumptions and results from the existing government and independent studies reviewed in this report.

12 UNDERSTANDING THE ECONOMIC IMPACT OF BREXIT
2. How Brexit might affect the UK economyLike any modern, open economy, the UK economy is complex. There are several ways in which Brexit might impact on the UK’s ability to produce and sell goods and services: this chapter briefly outlines these.
Economists typically think that a country’s ability to produce output depends on three basic factors: labour, capital and technology. The quantity of labour that a country has depends on how many people live there, what skills they have, and how willing and able they are to work. Traditionally, capital comprises buildings, vehicles and machinery, but in modern service-based economies, it is also important to have intangible capital such as a good brand.
The third factor – technology – is what has allowed for the transformation of living standards in the developed world since the early 19th century. New inventions, from electricity and mass production to better management practices and paperclips, allow workers to produce more in every hour of the day (that is, these new technologies have boosted workers’ productivity).
However, there is no point in producing something if no one will buy it. Therefore, the output of the UK economy also depends on how much demand there is for the goods and services that it produces. Since the UK is an open, trading nation, this demand depends not only on how much the UK’s government, businesses and consumers want to buy, but also on how much customers overseas – in the EU and beyond – want to buy, and at what price.
UK residents’ economic wellbeing will depend on their income – including what wage they can command – and on the prices they must pay for the goods and services they want to buy.
Brexit could affect many of these elements of the economy. For ease of exposition, we describe each of them in turn below. However, the EU is founded on the principle that there are important synergies between these elements. The EU’s ‘four freedoms’ – free movement of goods, services, capital and people – are designed to work together to enable member states to gain maximum benefit from engaging openly with one another in all these dimensions. For example, trade in services is thought to be particularly reliant on the easy movement of capital and people across borders.
TradeA significant share of UK economic output is bought by overseas buyers, while a significant share of what UK consumers and businesses buy comes from overseas. Economists have long argued that trade can improve living standards for all countries involved. By focusing on producing those goods and services for which each country has a ‘comparative advantage’, all countries collectively can produce, and therefore consume, more.

13HOW BREXIT MIGHT AFFECT THE UK ECONOMY
How much other countries want to buy from the UK depends on the size of their economies (that is, how much they buy in total each year), and how expensive UK goods and services are relative to those from other sellers elsewhere in the world. The former will be essentially unaffected by Brexit, since Brexit is likely to have at most a small impact on the economic growth of other countries.*
The cost of UK goods and services to consumers in another country is influenced by three main factors beyond simple local production costs.
First, there are transport costs which can increase the cost of trading with countries that are further away. It is typically more expensive to send goods over longer distances.
Second, tariffs – that is, taxes imposed by another country’s government on the import of UK goods – can add to the cost of UK goods bought abroad. There are no tariffs on goods that move between countries within the EU, but the EU does impose tariffs on imports from some other countries, as do non-EU countries on imports from the EU.
Third, a variety of non-tariff barriers can add to the cost of UK goods and services bought abroad, and vice versa. Non-tariff barriers (also referred to as non-tariff measures) cover virtually anything that creates a barrier to trade but is not a tariff. Some of these barriers relate to government policy. This includes requirements for products to be produced to a certain standard, or for people to hold particular professional qualifications to be able to provide a service. Others reflect underlying cultural differences between countries that impede trade.
Two major non-tariff barriers that are becoming increasingly the focus of trade agreements are regulatory barriers and customs checks. Regulatory barriers arise as long as different countries (quite legitimately) have different legal regulations on health, safety and environmental protection. Customs checks – including any other paperwork required at the border, such as rules of origin paperwork and customs declarations – can cause delays and costs.
The level of tariffs and non-tariff measures applying to imports to the UK and exports from the UK could be affected by Brexit. These barriers to trade could go up or down, depending on the agreements reached between the UK, EU and non-EU countries.
Non-tariff barriers between the UK and the EU could be lower than those facing other non-EU countries, because the UK and EU start with identical regulations. However, depending on the deal reached, there still could be some barriers. For example, if the UK is outside the EU Customs Union, there still could be additional costs for exporters to complete the necessary paperwork, in order to demonstrate rules of origin. The EU also offers less access to financial services and other markets to businesses based outside the Single Market.
* The exception to this is Ireland which, because of its close economic links to the UK, could be relatively significantly affected by Brexit.

14 UNDERSTANDING THE ECONOMIC IMPACT OF BREXIT
How a change in trade barriers with a particular country feeds through into a change in UK economic output will depend on the (actual and potential) importance of that country for UK trade. For example, since trade with the EU accounts for around half of UK imports and exports, any increase in barriers to trade with the EU would have a more significant negative impact on UK growth in the short- and medium-term than any positive impact from reducing barriers to trade with China, for example. In the longer term, UK trade might reorient towards countries with whom trade barriers are lower. However, the net negative impact of higher barriers to trade with the EU still could be significant, given the other advantages that the EU27 nations offer as trading partners: namely, that they are a large economic area (currently accounting for 14% of global output in purchasing power parity terms),1 and they are nearby.
Foreign direct investmentInvestment is one of the most important drivers of long-term gross domestic product (GDP) growth. Domestic private and public investment and foreign investment can all lead to an increase in the number and quality of machines, buildings and technologies that workers have at their disposal, greater technical progress and improved productivity.
Over time, as barriers to trade have been reduced around the world, cross-border investment has grown. Foreign direct investment (FDI) contributes directly to national income, providing firms with additional funds to invest in expanding their businesses. It also can help raise productivity by giving companies access to new ideas from abroad.
The UK is one of the biggest recipients of FDI among major advanced economies.* About two fifths (42.6%, as of January 2018) of foreign investment in the UK comes from other EU countries. The Netherlands is officially the largest EU investor in the UK; however, some of this investment may not originate in the Netherlands, but simply be routed through there for tax reasons.2 The fraction of total investment into the UK coming from the EU has fallen from 48.8% in 2011.
Leaving the EU could affect the UK’s attractiveness to foreign investors. There are at least three reasons why FDI into the UK might have been boosted by being a member of the EU – and thus why it could be reduced as a result of Brexit.
1. Free movement of capital – one of the ‘four freedoms’ central to the EU Single Market – has made it easier for investors from other EU member states to invest in the UK.
2. Being in the EU Single Market makes the UK an attractive export platform for multinationals. They can take advantage of the UK’s relatively attractive business environment, while also being able to enjoy frictionless trade with the rest of the EU.
* Figures from the OECD suggest that the UK ranked fourth in 2017 among its 36 members in terms of the dollar value of FDI received. Although investment figures are volatile from year to year, and can be heavily skewed by major company acquisitions, the UK has ranked somewhere between first and eighth in every year since 2005. Source: OECD, Foreign Direct Investment Statistics: Data, Analysis and Forecasts, FDI statistics database, 2018, retrieved 9 October 2018, www.oecd.org/corporate/mne/statistics.htm

15HOW BREXIT MIGHT AFFECT THE UK ECONOMY
3. Operating from an EU country is particularly attractive for large multinational companies which have complex supply chains or networks of subsidiaries across different countries within the bloc. The EU Single Market – including common regulations and the ability to move staff freely between countries – reduces co-ordination costs for these kinds of companies.
Similar arguments could be made for why increasing trade and investment links with non-EU countries post-Brexit might act to boost foreign investment. However, existing free trade agreements (FTAs) do not go as far in reducing barriers to cross-border investment, or facilitating the same kind of easy movement of services, capital and people between countries that the Single Market’s ‘four freedoms’ has achieved.
Overall, existing evidence based on data from the Organisation for Economic Cooperation and Development (OECD) suggests that EU membership has contributed to FDI growth in the UK by enhancing access to a larger market.*
Number and type of workersAll other things being equal, more output will be produced in the UK if there are more or better qualified workers – or rather, a better mix of workers whose skills complement each other. Output per person, which is important for average living standards, depends only on the latter.
The quantity and quality of available labour depends not only on how many people are born in the UK, but also how many migrants come to the country to work. As a member of the EU, the UK is limited in its ability to prevent nationals of other EU member states from coming to the country to work, if they have a job to go to in the UK. The perceived inability of the UK government to control levels of immigration from other EU countries was one important factor driving support for Brexit, although some have noted that there is more that the UK government could have done to limit immigration, even as an EU member.**
Therefore, one important way in which Brexit may have an impact on economic growth is by precipitating changes to immigration policy. This could become more restrictive for EU nationals, or more targeted on attracting certain types of migrants. Changes also could be made to immigration rules for non-EU nationals, which may not have been considered feasible before because of the large number of EU immigrants.***
* Dhingra and others, for example, estimate that EU membership has boosted FDI into the EU by somewhere between 14% and 38%. Dhingra S, Ottaviano G, Sampson T and Van Reenen J, The impact of Brexit on Foreign Investment in the UK, Centre for Economic Performance Paper No. 03, April 2016, retrieved 10 October 2018, http://cep.lse.ac.uk/pubs/download/brexit03.pdf
** Portes J, Free Movement after Brexit: Policy options, The UK in a Changing Europe, October 2017, p. 18, retrieved 10 October 2018, http://ukandeu.ac.uk/wp-content/uploads/2017/11/Free-movement-after-Brexit-policy-options.pdf. In setting out policy options Portes notes that modifications of free movement are not qualitatively different from controls that are already permitted under free movement elsewhere.
*** Some commentators (see for example, Bickerton in 2018) have suggested that Brexit – and the fall in the number of EU migrants that could follow – could provide a spur to sort out long-running problems with education and skills policy in the UK. None of the Brexit studies we summarise allow for such an impact. This seems to us the right approach, since it has always been within the UK government’s gift to improve skills policy, and Brexit does not change that. Bickerton C, Brexit and the British Growth Model, Policy Exchange, 2018, retrieved 11 October 2018, https://policyexchange.org.uk/publication/brexit-and-the-british-growth-model/

16 UNDERSTANDING THE ECONOMIC IMPACT OF BREXIT
Existing evidence summarised by the Migration Advisory Committee (MAC) – an independent group of experts appointed by the UK government to advise on migration policy – suggests that increases in immigration have little or no impact on the overall employment or earnings of UK-born workers.3 There is at most limited evidence that immigration has marginally reduced employment and earnings of low-skilled, UK-born workers, while increasing them for the high-skilled. In other words, the UK’s past experience has been that migrants produce additional economic output, rather than taking jobs that native-born workers would have otherwise done.
Moreover, immigration can affect the UK’s productivity. The direction of this effect is theoretically ambiguous.4 On the one hand, migrants may have skills that are complementary to those of UK workers, allowing them to produce more together; or the arrival of migrant workers could spur UK-born workers to improve their skills. On the other hand, easy access to a ready supply of workers could reduce incentives for firms to invest in productivity-enhancing technology and machines.
A recent report by the MAC found that most existing studies of the relationship between migration and productivity find large positive effects, with the impacts being larger for high-skilled than for low-skilled workers. Based on this existing evidence, Forte and Portes estimate that reductions in migration following Brexit could have nearly as large an effect on GDP per person as reductions in trade.5 However, the MAC said that in many cases, “the implied magnitude of the effects are implausibly large”, and that “more work is needed”.6
RegulationsDomestic regulations affect how cost-effectively businesses are able to use workers, capital and technology to produce output. As we have noted, they affect cross-border trade flows too. Some have argued that leaving the EU would offer the opportunity to adapt regulations to better suit the UK’s needs, and so boost economic output.7
However, some regulations – such as competition and state aid policies – are designed to increase economic output and consumers’ economic wellbeing by ensuring that no single company can gain, and then exploit, a dominant market position. For example, one concern highlighted by John Vickers, former Director-General of the UK Office of Fair Trading, is that the UK’s exit from the EU will remove restrictions on the use of state aid, opening the Government up to new pressure from domestic interest groups to implement policies that could distort competition.8
Other regulations in place in the UK are designed to achieve objectives beyond simply maximising economic output. For example, workers’ rights to fair treatment, holiday pay, sick pay and parental leave are prescribed by law. Businesses are restricted in their ability to pollute the environment, and required to contribute towards the Government’s objectives for renewable energy generation; regulations are also in place to promote prudent behaviour in the financial sector. Companies are required to ensure their goods and services meet certain standards: for example, farmers have to comply with standards on animal welfare.
Many of these regulations have been set at the EU level, meaning that Brexit opens up the possibility of tailoring them to better suit the UK’s needs. Reducing regulatory

17HOW BREXIT MIGHT AFFECT THE UK ECONOMY
costs could free up business resources for more productive purposes, increasing overall output and productivity. But such gains could come at the cost of reducing the protections offered to, for example, workers and the environment.
International surveys suggest that product and labour markets in the UK are already among the least regulated internationally, suggesting limited scope for further deregulation.9 Moreover, it may be politically difficult for the UK government to relax many of the current rules and regulations. The UK has gone further in many areas than has been strictly necessary to comply with EU rules, and it would remain a signatory of many international organisations which provide the bedrock for some of the rules in the first place.*
The EU is concerned that the UK might relax regulations and standards (such as those around environmental impact and labour standards) which are designed to ensure that businesses across the EU compete on a level playing field. In its draft negotiating guidelines, it stated that binding commitments would be necessary for an agreement to be reached.10 Since then, the Government has sought to offer assurances to the EU that it will not pursue deregulation, and has included binding commitments on level playing field provisions in its Chequers proposal.11,12
ProductivityStrong productivity growth is the holy grail for any economy. Becoming more productive means that workers can produce increasingly large quantities of high-quality output, without needing any more capital with which to work. Growing productivity is crucial for raising living standards.
Nonetheless, the factors that drive productivity growth are poorly understood. Productivity in the UK grew steadily at around 2% a year in the decades before the financial crisis – but since 2007, productivity in the UK has stagnated. The reasons for this are still being puzzled over by economists.13
By affecting levels of trade, FDI and migration, Brexit could affect the level and growth rate of productivity in the UK for several sound theoretical reasons.14,15 For ease of exposition, in what follows we will describe the benefits that are thought to come from removing trade barriers. However, most studies of Brexit predict that leaving the EU will lead to an overall increase in trade barriers between the UK and other countries.
First, there is strong evidence that removing trade barriers can lead to so-called ‘static gains’ from trade. As David Ricardo first postulated, free trade in principle allows countries to specialise in goods and services that they have a comparative advantage in producing.16 By giving companies access to a larger market, it can help them to exploit returns to scale in production – that is, by producing on a much larger scale, they can reduce the average cost of each unit of output. These effects are described as ‘static’ because they provide a one-off boost to productivity once trade barriers are removed, but provide no ongoing boost to productivity growth.
* For example, the UK’s climate change commitments in Paris would remain even if the UK left the EU, which would prohibit certain policy choices if the UK wanted to comply with it.

18 UNDERSTANDING THE ECONOMIC IMPACT OF BREXIT
Second, there could be so-called ‘dynamic’ gains from trade: that is, greater openness to trade could raise levels of innovation, research and development, and thus permanently boost productivity growth. There are several reasons why this might happen. Greater competition from foreign firms may encourage firms to innovate more. The prospect of being able to sell to a wider market may increase the returns on any investment in research and development. Trading with other countries (and people moving between countries) also increases the chance that domestic firms will come into contact with new technologies, and learn from how firms in other countries do things. These ‘dynamic’ gains could have a significantly larger impact on economic output in the long term than the ‘static’ gains.
Value of sterlingThe value of the UK’s currency – which floats freely against other countries’ currencies – is a measure of the country’s economic strength and stability, although currency values are affected by numerous other factors. The deterioration of sterling since the Brexit vote is, to an extent, an indication that the vote caused market participants to take a more negative view of the UK’s economic strength – in other words, it is a direct reflection of the majority view among economists that Brexit will reduce economic growth.
But the changing value of the currency has different effects on different parts of the economy. A weaker pound will raise the price of imports, which feeds through into higher prices for consumers – particularly for those products (such as many types of food) that are sourced from abroad, and which UK businesses would struggle to produce. It has been estimated that the depreciation of sterling since the Brexit vote has increased inflation by 1.7 percentage points.17
In addition, sterling’s depreciation will raise the cost of any inputs to the production process that are either imported (such as the many car parts used to assemble a Bentley at the Volkswagen plant in Crewe),18 or priced globally in dollars (such as oil). This will raise costs for businesses that use inputs which at some point have come from overseas.
Conversely, and all else being equal, the depreciation of sterling provides a boost to businesses which sell their products abroad. This is because a UK-produced good or service will become cheaper to foreign buyers. Many politicians and commentators have emphasised this benefit.19 However, while the depreciation of sterling in the early 1990s (when the UK government stopped trying to defend sterling’s peg to the Deutschmark) provided a significant boost to the economy, more recent experience suggests that currency depreciations have done little to help exporters.20
Other policy responsesIn addition to these direct impacts that Brexit might have on the UK economy, exiting the EU could be a catalyst for more radical reform of domestic policy. For example, Policy Exchange has suggested that the Government should use this as an opportunity to overhaul skills policy,21 while the Shadow Chancellor John McDonnell has suggested that the “mess” a future government could inherit would require a “radical” response.22

19HOW BREXIT MIGHT AFFECT THE UK ECONOMY
The existing projections of the long-term impact of Brexit – rightly, in our view – do not include these other possible policy changes when assessing Brexit’s economic consequences.* Such policies could have important effects and, in practice, will shape how the UK economy evolves over the coming decades – but those policies should be considered separately on their merits.
All of the first six areas mentioned above – from trade to the value of the currency – could be directly affected by the UK’s decision to leave the EU. Consequently, the Government’s Brexit impact assessment will need to factor in these elements and be explicit about what has been assumed in each area. We believe that the Government should follow other studies’ lead, and not include in its final assessment of Brexit any policy changes that are prompted (but not newly enabled) by Brexit.
* Rabobank is an exception. In the case where the UK and EU fall back on World Trade Organization (WTO) rules, it assumes that the UK government will reduce corporation tax following Brexit, from 19% to 12.5% over a five-year period. It assumes that this is paid for by raising income tax. Erken H, Hayat R, Heijmerikx M, Prins C and de Vreeded I, Assessing the Economic Impact of Brexit: Background report, Rabobank, 12 October 2017, p. 14, retrieved 9 October 2018, https://economics.rabobank.com/publications/2017/october/assessing-economic-impact-brexit-background-report/

20 UNDERSTANDING THE ECONOMIC IMPACT OF BREXIT
3. How large is the impact likely to be?A large number of studies have now been published attempting to quantify the long-term economic impact of Brexit. Two official government estimates have been produced, along with numerous estimates published by independent organisations.*
Producing any such estimate is difficult. The Government analysis was probably only slightly overstating the case when it said that analysing the likely impact of different exit scenarios (particularly those with no similar example within existing global relations) was an “unprecedented challenge”.1 However, there is a body of economic evidence which can be used to help work out the direction and (with greater uncertainty) the possible size of the effect relative to a world in which Brexit did not happen.
Most of the published studies have focused on modelling ‘off-the-shelf’ options for a future UK–EU trading relationship: such as trading under WTO rules, signing a Canada-style FTA, or the UK remaining in the European Economic Area (EEA). Most have not attempted to model the endpoint that the UK government signalled it would like to achieve in the Chequers plan.2 Doing the latter is hampered by a lack of clarity about what exactly the UK government is aiming for.** There is also considerable uncertainty about whether the final deal will be along the lines outlined in the Chequers proposal – some Cabinet ministers rejected the vision that was laid out,3 and the other 27 EU countries have made clear that they will not accept the plan in its current form.4
However, it is reasonable to assume that the economic impact of the deal that the UK government ultimately hopes to achieve would lie somewhere in the range of the already published estimates.*** This is because the policies that are likely to be adopted – in particular, the trading relationship between the UK, EU and non-EU countries – are likely to be some permutation of the scenarios which have been modelled.
* Other studies have attempted to answer the reverse question, that is: “How much larger is the UK economy now than it would have been if the UK had not joined the EU?” Campos and others estimated that EU membership has boosted member states’ output by 8.6% on average: Campos N, Coricelli F and Moretti L, ‘Economic growth and political integration: Estimating the benefits from membership of the European Union using the Synthetic Counterfactuals Method’, CEPR Discussion Paper No. 9968, 2014, retrieved 10 October 2018, https://cepr.org/active/publications/discussion_papers/dp.php?dpno=9968. Crafts estimates that EU membership is likely to have raised UK economic output by 10.6%: Crafts N, ‘The growth effects of EU membership for the UK’, April 2016, retrieved 10 October 2018, www.smf.co.uk/wp-content/uploads/2016/04/SMF-CAGE-The-Growth-Effects-of-EU-Membership-for-the-UK-a-Review-of-the-Evidence-.pdf
** The only paper that we are aware of that has attempted to model the impact of the Chequers deal is a study by NIESR. This concluded that the Chequers deal would lead to economic output being 2.5% lower in 10 years’ time than it would be if the UK were a member of the EEA. Kara A, Hantzsche A, Lennard J, Lenoel C, Lopresto M, Piggott R and Young G, ‘Prospects for the UK economy’, National Institute Economic Review, 2018, No. 245, pp. F10–40, retrieved 11 October 2018 www.niesr.ac.uk/publications/prospects-uk-economy-32
*** Comparing the white paper proposals to the World Bank’s database of preferential trade agreements (which provides a detailed measure of the depth of all agreements worldwide that have been signed since 1957), NIESR concludes that ‘the trade intensity of the White Paper proposals is comparable to Switzerland or Canada and is less comprehensive than a Norway-style EEA arrangement’. Kara A, Hantzsche A, Lennard J, Lenoel C, Lopresto M, Piggott R and Young G, ‘Prospects for the UK economy’, National Institute Economic Review, 2018, No. 245, pp. F10–40, retrieved 11 October 2018 www.niesr.ac.uk/publications/prospects-uk-economy-32, p. F12

21HOW LARGE IS THE IMPACT LIKELY TO BE?
Some of the scenarios that have been presented – such as trading under WTO rules, or unilaterally adopting completely free trade – are useful to consider even if they are not the Government’s preferred option, because they provide an illustration of the possible long-term impact of the UK failing to reach an agreement with the EU. However, these scenarios do not provide a good guide to the likely short-term impact of a ‘no deal’ exit (we return to this issue in Chapter 5).5
The projections that have been made so far only include policy changes that are directly linked to Brexit: that is, changes to trading relationships, domestic regulations and migration rules. They do not include any policy changes that might be catalysed by Brexit.6 In our view, this is the right approach to take, since it focuses attention on the direct impact of Brexit and any specific deal proposed. The Government should separately consider the merits of other policies that could boost the UK economy.
The estimates that have been produced so far for Brexit’s long-term economic impact are summarised in Figure 2. Most of these studies have projected the impact of Brexit on UK economic output in 2030. There are three exceptions to this: the forecasts published by HM Treasury before the referendum, the Government and the Economists for Free Trade (EFT) post-referendum. These three studies project the economic impact of Brexit 15 years’ hence (meaning their results relate to 2031, 2032 and 2032, respectively).
The Government has produced two sets of projections so far. The first was published by the Treasury and approved by then Chancellor George Osborne before the referendum (‘Treasury’ in Figure 2).7 The second, preliminary government analysis was leaked to the media in January 2018 (‘HMG’ in Figure 2).8 In addition to these two sets of official forecasts, we also describe the results of studies by 12 independent organisations: seven published before the referendum, three initially published before the referendum but updated since, and two after.*
Published before the referendum:
• Bertelsmann Stiftung (Bertelsmann)9
• CPB Netherlands Bureau for Economic Policy Analysis10
• NIESR11
• OECD12
• Oxford Economics13
• Open Europe14
• PwC15
Initially published before the referendum and since updated:
• Centre for Economic Performance (CEP) at the London School of Economics16
• Ciuriak Consulting (Ciuriak)17
• EFT18
* The published reports that summarise the projections made by each organisation are referenced in the end-notes attached to each organisations name in the list below. In three cases (CEP, EFT and NIESR) several papers have been published and we draw on all of these in this report.
22 UNDERSTANDING THE ECONOMIC IMPACT OF BREXIT
Published since the referendum:
• Rabobank19
• RAND20
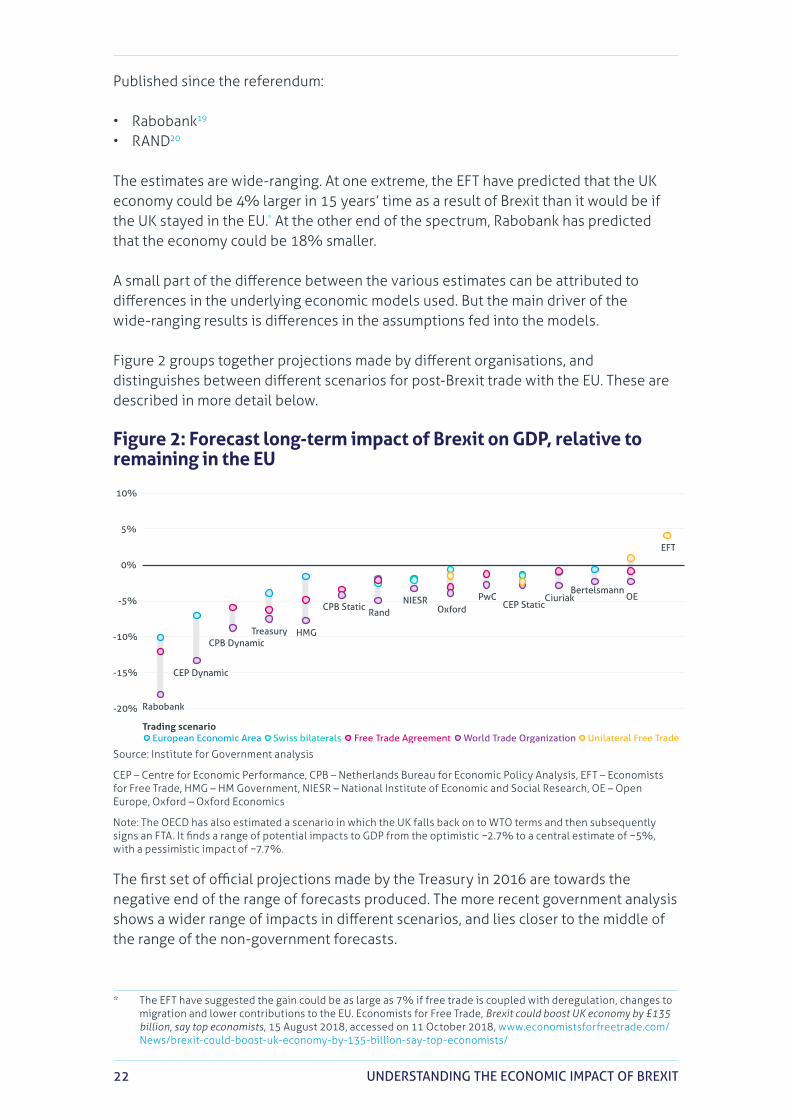
The estimates are wide-ranging. At one extreme, the EFT have predicted that the UK economy could be 4% larger in 15 years’ time as a result of Brexit than it would be if the UK stayed in the EU.* At the other end of the spectrum, Rabobank has predicted that the economy could be 18% smaller.
A small part of the difference between the various estimates can be attributed to differences in the underlying economic models used. But the main driver of the wide-ranging results is differences in the assumptions fed into the models.
Figure 2 groups together projections made by different organisations, and distinguishes between different scenarios for post-Brexit trade with the EU. These are described in more detail below.
Figure 2: Forecast long-term impact of Brexit on GDP, relative to remaining in the EU
Rabobank
CEP Dynamic
CPB DynamicTreasury HMG
CPB StaticRand
NIESROxford
PwCCEP Static
CiuriakBertelsmann
OE
EFT
-20%
-15%
-10%
-5%
0%
5%
10%
European Economic Area Swiss bilaterals Free Trade Agreement World Trade Organization Unilateral Free TradeTrading scenario
Source: Institute for Government analysis
CEP – Centre for Economic Performance, CPB – Netherlands Bureau for Economic Policy Analysis, EFT – Economists for Free Trade, HMG – HM Government, NIESR – National Institute of Economic and Social Research, OE – Open Europe, Oxford – Oxford Economics
Note: The OECD has also estimated a scenario in which the UK falls back on to WTO terms and then subsequently signs an FTA. It finds a range of potential impacts to GDP from the optimistic −2.7% to a central estimate of −5%, with a pessimistic impact of −7.7%.
The first set of official projections made by the Treasury in 2016 are towards the negative end of the range of forecasts produced. The more recent government analysis shows a wider range of impacts in different scenarios, and lies closer to the middle of the range of the non-government forecasts.
* The EFT have suggested the gain could be as large as 7% if free trade is coupled with deregulation, changes to migration and lower contributions to the EU. Economists for Free Trade, Brexit could boost UK economy by £135 billion, say top economists, 15 August 2018, accessed on 11 October 2018, www.economistsforfreetrade.com/News/brexit-could-boost-uk-economy-by-135-billion-say-top-economists/

23HOW LARGE IS THE IMPACT LIKELY TO BE?
Describing the long-term economic impact of BrexitIt is important to make clear what economists mean when they say that economic output would be ‘increased’ or ‘decreased’ by Brexit.
The studies that have been published so far have attempted to work out how much larger or smaller UK economic output (that is, GDP) would be in future if the UK left the EU than it would be if the UK remained a member of the bloc. These figures do not mean that economic output is predicted to be, say, 4% higher or 18% lower than it is today. Rather, the figures are expressed relative to some other alternative future world.
To take a concrete example, the leaked government analysis assumes that UK economic output would grow in real terms by 1.5% a year over the next 15 years if the UK were to remain a member of the EU, but would grow 0.4 percentage points less quickly on average each year if the UK leaves and trades with the EU on WTO terms.21 As a result, UK economic output in 15 years’ time would be 7.7% smaller under the Brexit scenario than under the ‘Remain’ scenario. However, economic output would still be 17% larger than it is today. None of the models predict anything like the year-on-year falls in output that were experienced during 2008 or earlier recessions.
Media and other commentary often quotes very precise figures for the estimated impact of Brexit on the UK economy. However, there is uncertainty in the projections that have been made, and many studies provide a range within which they predict the impact will lie – either instead of, or in addition to, a central estimate. For example, the Government analysis suggested that GDP could be reduced by between 5% and 10.3% if the UK were to trade with the EU under WTO rules in future, with the midpoint of these figures (−7.7%) most frequently cited. (For simplicity, these ranges are not shown in Figure 2, but are provided in Table 4 in the Appendix.)
While total economic output may matter for some purposes – for example, larger economies typically wield more influence on the global stage – individual voters may care more about how output per person is expected to change. This is what will influence average living standards. Output per person will be affected by Brexit differently from total output, if an economic model predicts (as many do) that Brexit will affect net migration.
Figure 3 summarises predictions which have been made for the impact of Brexit on output per person, relative to a ‘Remain’ scenario. These results correspond to the same scenarios presented in Figure 2, but express the model predictions in terms of the impact on GDP per person, rather than total GDP. Unfortunately, not all of the studies that have been published have included estimates of the impact on output per person. Consequently, in the remainder of this report we focus mainly on the projected impact of Brexit on total output.
These predictions do not sound catastrophic. Even in the most pessimistic scenarios considered, all the models suggest that UK residents would still be better off in future

24 UNDERSTANDING THE ECONOMIC IMPACT OF BREXIT
than today.* For example, the Government’s projection for a WTO scenario implies that GDP per person would be about 10% higher in real terms in 15 years’ time than it is today.**
However, even slower growth can cause discontent about living standards. For example, subdued economic growth since the financial crisis (with growth in GDP per person averaging just 0.3% a year over the decade from 2007 to 2017) has left those in their thirties being paid 7% less in real terms than their counterparts were 10 years ago.22 This is the first time since the Second World War that later generations have experienced lower living standards than earlier ones.23
In addition, slow economic growth over the past decade has increased the difficulty faced by government in trying to reduce public borrowing, and made it more difficult to meet the needs of the UK’s ageing population.24 The Government’s projections for a WTO scenario imply that GDP per person would grow by an average of 0.7% a year over the next 15 years.
Figure 3: Forecast long-term impact of Brexit on per capita GDP, relative to remaining in the EU
CEP Dynamic
TreasuryHMG
Oxford BertelsmannNIESR PwC CEP Static OE
-20%
-15%
-10%
-5%
0%
5%
10%
European Economic Area Swiss bilaterals Free Trade Agreement World Trade Organization Unilateral Free TradeTrading scenario
Source: Institute for Government analysis CEP – Centre for Economic Performance, HMG – HM Government, NIESR – National Institute of Economic and Social Research, OE – Open Europe, Oxford – Oxford Economics
What would happen if the UK stayed in the EU?As mentioned previously, forecasts for the impact of Brexit focus on describing the difference in economic output at some future date between a world in which the UK leaves the EU (with some specific deal), and some other alternative future world. In all the cases we describe here, this other world is one in which the UK remains a member of the EU.*** Therefore, the estimated impact of Brexit depends not only on the
* This statement relies on an assumption about what happens in the ‘Remain’ counterfactual scenario. The latest government analysis was explicit about this – stating that GDP was predicted to grow by 25% over the next 15 years in the ‘Remain’ scenario. This was based on extrapolating the latest five-year economic forecast from the Office for Budget Responsibility. However, none of the other studies provide an explicit forecast for the ‘Remain’ counterfactual.
** This is roughly the same amount of growth as occurred over the three years from 1995 to 1998.*** A more recent forecast produced by NIESR attempts to model the impact of the Chequers deal, comparing
economic growth under those terms to the growth that would be expected if the UK were to remain a member of the EEA, rather than remaining in the EU.

25HOW LARGE IS THE IMPACT LIKELY TO BE?
assumptions made about the ‘Leave’ scenario, but also on what is assumed would happen if the UK were to remain in the EU.
Different studies make different assumptions about this ‘Remain’ scenario. Some, for example, assume that intra-EU trade barriers continue to be broken down in future, while others do not. The former assumption tends to increase the estimated impact of leaving the EU, since by leaving the UK is assumed to forgo the benefit of future EU integration.
Four of the studies we review (CEP, NIESR, PwC and RAND) explicitly assume that there would be continued future EU integration. Ten studies assume that there would not be (Bertlesmann, Ciuriak, CPB, EFT, HMG, OECD, Open Europe, Oxford Economics, Treasury* and Rabobank).
Ways of modelling the economyThe various studies of the long-term economic impact of Brexit use one of two types of model. Since Brexit will affect the UK’s trading relationships with the rest of the world, both types of model include not only a characterisation of the UK economy, but also consider the global economy of which the UK is a part. We briefly describe each of the two approaches in turn.
Computable General Equilibrium modelsOne way of modelling the global economy is to use a computable general equilibrium (CGE) model, which captures many industrial sectors, countries and regions of the global economy. As the name suggests, such models allow shocks or changes in one part of the global economy to ripple through to other sectors and countries, allowing the world economy to reach a new equilibrium.
These models are made up of a set of equations which describe the global economy. The structure of these equations is based on economic theories about how different parts of the global economy interact with one another. For example, the models contain equations describing how an increase in tariffs leads to a rise in prices and consequent changes in the supply of a particular good, and the knock-on effect on demand and trade flows. Some of the parameters in these models – that is, the numbers that describe how different elements of the model relate to one another – are chosen based on empirical evidence on these relationships. Other parameters are chosen to ensure that the sorts of predictions the model makes match past experience; this is a process known as calibration.
In such models, Brexit affects the UK economy in three main ways. First, changes to trade barriers affect the price of imported and exported goods – this affects both the costs of production (for firms that use imported inputs), and consumer prices. This in turn affects households’ consumption, UK businesses’ production and purchasing decisions, and overseas demand for UK products. Second, Brexit could affect immigration rules, which would affect labour supply and how responsive this is to
* In a separate analysis (part 3) HM Treasury assesses the potential gains from integration and adds these to the main results.

26 UNDERSTANDING THE ECONOMIC IMPACT OF BREXIT
changes in wages. Third, Brexit could affect how freely capital can flow into the UK from investors from the EU and elsewhere.
Three of the studies we summarise here (Ciuriak, HMG, Open Europe) use one specific CGE model – that developed by the Global Trade Analysis Partnership.* Bertelsmann, CEP, CPB, PwC and RAND each use their own in-house CGE models, and Patrick Minford and the other EFT use a CGE model developed by Cardiff Business School.
Some of these models – including Bertelsmann, CEP and RAND – fall into a category of models known as new quantitative trade models or structural gravity models, which use insights from gravity modelling in a general equilibrium model.25 The next section describes what gravity models are and the insights they offer.
Armed with their calibrated models, researchers then use it to simulate what would happen in an alternative post-Brexit world. For example, they can change the level of trade barriers between the UK and EU, and rerun the entire model to see how this specific change ripples through the world economy.
Patrick Minford has asserted – but provides no evidence – that the Cardiff model provides a better approximation to patterns of UK trade than the Global Trade Analysis Partnership model does.26 However, as we describe below – and as Patrick Minford has himself illustrated27 – the main differences between the various studies’ predictions for the impact of Brexit are not driven by differences in the structure of the models, but rather by differences in the assumptions fed into the models. We compare these below.
Gravity-based modelsRather than using a CGE model, some studies (NIESR, OECD, Oxford Economics, Rabobank and Treasury) have instead used an alternative approach, which leans more heavily on empirical evidence. These papers all used gravity-based models to estimate how changes to trade barriers are likely to affect trade flows, investment and productivity in the UK alone. Then, they feed these estimates into a model of UK and world economic activity.
Gravity models use data on trade flows between different countries over long periods of time to estimate how trade and investment are related to tariff and non-tariff barriers. Gravity models grew out of efforts to describe these empirical relationships; they were not initially based on any theory about how trade barriers should affect the economy. However, more recently, it has been shown that the gravity relationship can also be derived from theory.28
One strength of the gravity model approach is that it is based on strong empirical evidence about factors that affect trade, with numerous papers showing the importance of distance and economic size in determining how intensively different countries trade with each other. Their disadvantage in the context of modelling Brexit
* For a technical description of the model see: Hertel T and Tsigas ME, ‘Structure of GTAP’, Chapter 2 in Hertel TW (ed), Global Trade Analysis: Modeling and Applications, Cambridge University Press, 1997. For a discussion of the degree of confidence in CGE estimates, see: Hertel T, Hummels D, Ivanic M and Keeney R. ‘How confident can we be in CGE based assessments of Free Trade Agreements?’, GTAP Working Paper No.26, 2003.

27HOW LARGE IS THE IMPACT LIKELY TO BE?
is that researchers using these models must try to infer an unprecedented action (Britain leaving the EU single market) from data on the effect of trade integration between other countries in the past.
Most of the Brexit impact assessments that have taken this approach (NIESR, OECD, Rabobank, Treasury) have used one specific model – the National Institute Global Econometric Model (NiGEM) – to estimate how changes to trade and investment flows then feed through to other parts of the economy, and so we focus our comments here on describing the important features of that particular model. Oxford Economics uses an in-house model with similar properties.
NiGEM contains individual models for numerous countries – including all those in the OECD and other important economies, such as Brazil, India and Russia – plus models for other regional blocs. The models for each individual economy consider the determinants of domestic demand, export and import volumes, prices, the current account and net assets. Different countries are connected together through trade, competitiveness and financial markets.
Simulating the impact of Brexit in NiGEM proceeds in three steps. First, an estimate is made of the impact on trade and FDI of changes to the UK’s trading relationships. This is done using a gravity model applied to real-world data. (We describe gravity modelling more fully in the section on tariffs below.) Second, again based on empirical evidence, the researchers estimate how changes to trade and FDI might affect UK productivity growth. The final step is then to feed these estimates of the impact on trade, FDI and productivity into the global macroeconomic model to simulate the overall impact on UK growth and growth in other countries.*
Both types of model are informed by estimates of economic relationships derived from historic data. Observed patterns of, for example, trade and economic growth will have been influenced by numerous factors – meaning that it is not a trivial task to extract information on the relationships in which economists are most interested, but there is a vast academic literature and well-developed toolkit to help them do this. As a result, while there will be some uncertainty around any point prediction produced by these models, they are not simply arbitrarily chosen figures.
Trade costsEU rules and institutions play a big role in how member countries trade with one another. The EU is also responsible for negotiating and signing trade deals between the bloc and other non-EU countries. Therefore, one of the most obvious and direct impacts of leaving the EU will be on how, and at what cost, the UK is able to trade goods and services with the EU and with non-EU countries in future.
Changes to trade could affect UK economic output both directly by changing overall levels of demand and prices in the UK, and indirectly through the knock-on effects of
* Annex A of the Treasury report provides a more complete description of how NiGEM can be used to simulate the long-term impact of Brexit. HM Treasury, ‘The long-term economic impact of EU membership and the alternatives’, Cm 9250, April 2016, retrieved on 11 October 2018, https://assets.publishing.service.gov.uk/government/uploads/system/uploads/attachment_data/file/517415/treasury_analysis_economic_impact_of_eu_membership_web.pdf

28 UNDERSTANDING THE ECONOMIC IMPACT OF BREXIT
trade openness on productivity levels. This section focuses on the direct impact, while the later section on productivity addresses indirect effects.
Each study modelling the impact of Brexit on the UK economy makes two important sets of assumptions about future trade costs.
1. How the size of tariffs and non-tariff measures to which UK imports and exports are subjected (coming to and from the EU and non-EU countries) will change after Brexit (described in the first two subsections below).
2. How these changes in trade costs will affect trade flows, and thus economic growth (summarised at the end of this section on trade costs).
All of the studies of the longer-term impact of Brexit are based on a belief that there is a positive relationship between lower trade barriers and trade volumes, and in turn between trade volumes and economic growth.* The differences between the studies’ predictions for how Brexit will affect trade are driven mainly by:
• different assumptions about how Brexit will affect trade barriers
• (to a lesser extent) different assumptions about how much trade is discouraged or encouraged by increasing or reducing barriers to trade.
The stark difference between the positive prediction of the EFT29 and virtually all other studies that predict a negative impact is explained by differences between the two groups in how Brexit is expected to affect the degree of trade openness in the UK. The EFT judge that Brexit will result in a significant increase in trade openness (not only in terms of the UK’s openness to other countries, but also vice versa), whereas all the other studies we examined judge that Brexit will reduce trade openness overall.
The assumptions that each study has made are informed by historical evidence (although to differing extents in each of the studies, as we discuss below). However, as there is no precedent for a country like the UK leaving a trading bloc, any quantitative estimate of the likely impact is subject to a high degree of uncertainty – this uncertainty is arguably greater, as mentioned above, for those studies that use gravity modelling. The evidence that is available on how changing trade relationships affects economic growth is virtually all derived from instances in the past when countries have joined or formed, rather than left, trading blocs or FTAs. The impact of leaving a trading bloc may not be the opposite of the impact of joining.
* For evidence to support this belief, see: Organisation for Economic Cooperation and Development, ‘The Economic Consequences of Brexit: A Taxing Decision’, OECD Economic Policy Paper, April 2016, retrieved on 11 October 2018, www.oecd-ilibrary.org/docserver/5jm0lsvdkf6k-en.pdf?expires=1539256744&id=id&accname=guest&checksum=149E08E05FABA6469279D9744C841C86; Dhingra S, Huang H, Ottaviano, G., Pessoa J P, Sampson T and Van Reenen J, ‘The Costs and Benefits of Leaving the EU: Trade Effects’, CEP Discussion Paper, No.1478, April 2017, retrieved on 11 October 2018, http://eprints.lse.ac.uk/83612/1/dp1478.pdf. However, it is worth noting that even though trade is thought to be positive overall for economic growth, it can have negative consequences for some groups. Chapter 4 discusses how the impact of Brexit may differ across different sectors of the economy and regions of the UK.

29HOW LARGE IS THE IMPACT LIKELY TO BE?
TariffsFor countries such as the UK, which are members of the WTO, the maximum tariff that can be imposed on the import of a particular good from any other WTO member country is what is (slightly misleadingly) known as the Most Favoured Nation (MFN) tariff.* This is the tariff that applies to any country with which the member state does not have a preferential trade agreement, and is set out in a schedule approved by other WTO members.**
A lower tariff may be charged on imports from a particular country if the UK and that other country sign an FTA covering substantially all trade.*** While the UK is a member of the EU, these FTAs are negotiated by the EU. However, depending on the precise details of the Brexit deal signed with the EU, the UK may be able to negotiate its own FTAs in future.
Tariffs on UK imports push up the price of goods sold in the UK, reducing consumers’ economic wellbeing. How much a change in tariffs affects the prices faced by consumers depends both on the size of the tariff, and on how much of this is passed on to consumers, rather than being absorbed by the firms importing the goods. Some goods imported to the UK face very high tariffs – for example, the average tariff on processed food imports is 15.8%30 – but most do not. Currently, the average tariff applied to all goods that the UK imports is around 2.8%. Analysis by the Institute for Fiscal Studies demonstrates that the abolition of all UK import tariffs would reduce average consumer prices by at most about 1%; this figure assumes that the entirety of the tariff reduction would be passed on to consumers.**** 31 This is smaller than the increase in prices which has occurred already since the Brexit referendum, as a result of the depreciation of sterling.
Moreover, by increasing competition from foreign producers, tariff reductions can lead to an increase in the quality of goods that consumers are able to buy at a given price, rather than a reduction in the price of goods of the same quality. Recent evidence suggests that in practice, tariff reductions have tended to have a greater impact on quality than on price.32
What tariffs will be imposed on goods traded between the UK and the EU after Brexit?Manufacturing accounts for 10% of UK economic output, 8% of jobs and 44% of UK exports (by value).33 In 2017, 48% of all UK goods exports (by value) went to the EU.34 More than half (54%) of all goods imported to the UK came from the EU.35 The studies that have been published on the long-term economic impact of Brexit include one or
* The WTO has 164 members, including all major global economies. World Trade Organization, ‘Members and observers’, 2018, retrieved 11 October 2018, www.wto.org/english/thewto_e/whatis_e/tif_e/org6_e.htm
** World Trade Organization, ‘Welcome to the tariff download facility’, retrieved 11 October 2018, http://tariffdata.wto.org/
*** To qualify, under WTO rules, free trade agreements must cover “substantially all trade” in goods between the countries.
**** Such a tariff reduction would cause a one-off fall in the level of consumer prices, rather than having an ongoing impact on consumer price inflation.

30 UNDERSTANDING THE ECONOMIC IMPACT OF BREXIT
more of four basic scenarios for what might happen to tariffs imposed on goods traded between the EU and UK after Brexit.* These are as follows.
1. EEA – the UK remains a member of the EU Single Market, and thus no tariffs are imposed on goods traded between the UK and the EU, provided that goods meet UK and EU rules of origin.**
2. FTA – the UK and EU sign a comprehensive FTA, which reduces tariffs on goods traded between the UK and EU to below the EU’s current MFN rates. The EU’s guidelines state that it would want tariff-free trade; however, some studies model scenarios in which some tariffs remain.
3. WTO rules – the UK and EU trade with each other in future under WTO rules, with each imposing MFN tariffs on the other. The UK is assumed to continue to levy the same MFN tariffs as the EU currently does.
4. Unilateral free trade (UFT) – the UK is assumed to face EU MFN tariffs for any goods sold to the EU, but the UK government unilaterally abolishes all tariffs on imported goods (from the EU and all other countries).
These scenarios also have implications for what might happen to non-tariff barriers to trade, and what freedom the UK might have to strike new trade deals with non-EU countries or to change rules on migration after Brexit. (We return to these issues below.)
What tariffs will apply to goods traded between the UK and non-EU countries after Brexit?As a member of the EU, the UK currently benefits from FTAs with more than 60 other countries, which mean the UK faces (imposes) lower tariffs on the goods that it sells to (buys from) those countries than it would simply as a WTO member. Trade with these other countries accounted for 12% of UK imports and 13% of exports in 2016.36
Many of the studies we describe here assume that the UK continues to benefit from these same preferential trade arrangements, even after leaving the bloc (Ciuriak, Open Europe, HMG, Oxford Economics, EFT; PwC in its FTA scenario; Bertelsmann in its EEA scenario). But there are exceptions: the OECD and NIESR assume that the UK loses access to these and does not manage to reinstate them. Other studies (PwC in its WTO scenario; Rabobank; Treasury) assume that the UK loses access initially, but manages to renegotiate some or all of them over the following few years. The assumptions made are summarised in Table 1.
* In addition to these scenarios, Oxford Economics also models what would happen if the UK were to remain in a Customs Union with the EU. It predicts that this would allow UK businesses to avoid some of the administrative costs that would arise in the other scenarios. It predicts only a very small (0.1%) loss of GDP in the long run, in a scenario in which the UK and EU form a Customs Union (and the UK also implements only moderately more restrictive migration policies, embarks on an ambitious programme of deregulation, and uses tax cuts to encourage business investment and consumption).
** In addition to the 28 EU member states, the four members of the European Free Trade Area (EFTA) are also members of the EEA. These four countries are: Iceland, Liechtenstein, Norway and Switzerland.

31HOW LARGE IS THE IMPACT LIKELY TO BE?
At the end of August 2018, Theresa May announced that she had reached an understanding with six southern African nations who currently have a trade deal with the EU that this could continue to cover the UK after Brexit.*
After the UK leaves the EU, the UK also might be able to strike new FTAs with non-EU countries that the EU does not have a deal with – something which it is prevented from doing as an EU member. The UK’s freedom to do this would depend on the nature of the deal agreed with the EU. These other countries currently account for around 40% of UK exports, and 35% of imports to the UK.
Most of the studies of the economic impact of Brexit assume the UK would sign no new FTAs (Bertelsmann, CEP, Ciuriak,** CPB, EFT, Treasury, NIESR, OECD, Open Europe, Oxford Economics and Rabobank). Only three of the analyses (HMG, PwC and RAND) assume that the UK would be successful in signing new FTAs, which would reduce the
* The six countries are: Botswana, Lesotho, Mozambique, Namibia, South Africa and Swaziland. Watts J, ‘Theresa May announces UK has secured its first post-Brexit trade deal during trip to Africa’, Independent, 28 August 2018, retrieved 12 October 2018, www.independent.co.uk/news/uk/politics/theresa-may-uk-post-brexit-trade-deal-africa-visit-cape-town-leave-eu-a8510761.html
** The main scenarios presented by Ciuriak exclude new trade deals with non-EU countries. However, in additional analysis, it shows that the economic costs of leaving the EU and becoming a member of the EEA could be slightly more than offset, if doing so allows the UK more quickly to reach a FTA with the USA.
Existing EU FTAs New FTAs
Bertelsmann EEA – retain access WTO – lose access
None
CEP Retain access None
CPB Retain access None
Ciuriak Retain access USA: +0.3% to GDP China, Japan, ASEAN and India: +0.6% to GDP
EFT Retain access None
HMG Retain access USA: +0.1%–0.3% to GDPChina, Australia, New Zealand, Japan, ASEAN and India: +0.1–0.4% to GDP
NIESR Lose access None
OECD Lose access None
Open Europe Retain access See Ciuriak37
Oxford Economics Retain access None
PwC FTA – retain access WTO – renegotiate by 2026
USA deal (2021): Cuts cost of exports by 0.4% USA deal (2026): Cuts cost of exports by 0.4%
Rabobank Lose access but renegotiate 40% of them
None
RAND Retain access USA deal: +2.4% (relative to a WTO baseline)
Treasury Lose access but renegotiate over 15 years
None
Table 1: Assumptions about free trade agreements with non-EU countries

32 UNDERSTANDING THE ECONOMIC IMPACT OF BREXIT
tariffs imposed on UK exports to countries such as the USA, China and India. Table 1 summarises what each study assumes about new FTAs under each scenario modelled.
Non-tariff measuresNon-tariff measures are estimated to be costlier in many cases for sellers to overcome than tariff barriers.38 Increasingly in recent years, international trade agreements have focused on reducing these non-tariff barriers, rather than doing more to reduce (already low) tariffs.39 For the UK, non-tariff measures will play an important role in determining the impact of Brexit, through changing the cost of imports and exports of goods and services.
Non-tariff barriers are typically harder to reduce than tariffs. Many of the barriers stem from regulations which cannot just be removed, since they serve some domestic policy purpose: for example, protecting consumers or the environment. Modern trade agreements seek to reduce these barriers by, for example, aligning regulatory approaches where countries are interested in achieving similar ends, mutually recognising professional qualifications, or removing restrictions on foreign companies’ rights to set up business.
However, there are some things that make trade with another country inherently harder than trading with someone in your own country, which may be impossible to eliminate completely. For example, some of what economists refer to as ‘non-tariff barriers’ reflect differences in culture, history or voter preferences that are very difficult to change quickly – if at all. Following an extensive study, Berden and others40 concluded that around half of the existing non-tariff barriers to trade between the USA and the EU could be eliminated, if the political will to do so existed.*
The projections of the long-run economic impact of Brexit consider two important questions in relation to non-tariff measures.
1. How, and to what extent, will new non-tariff measures be applied (by either side) to trade between the UK and the EU after Brexit?
2. How, and to what extent, will existing non-tariff measures applied to UK trade with non-EU countries be relaxed after Brexit?**
How large are existing non-tariff barriers on imports to the EU from non-EU countries?To answer both of the questions above, most studies have attempted to examine the size of non-tariff barriers that currently exist between the EU and non-EU countries. In particular, many studies have focused on the barriers that exist between the EU and the USA – two economic blocs that trade with each other largely on WTO terms.
* Even this is likely to be optimistic in practice – irreconcilable differences in regulatory approach are at least part of the reason that the negotiations between the EU and USA are now on ice.
** In principle, non-tariff barriers to trade with non-EU countries could be heightened following Brexit (for example, if the UK is unable to roll over existing EU trade deals); but none of the existing studies incorporate such an outcome. So we focus here only on the possibility of lower trade barriers between the UK and non-EU countries following Brexit.

33HOW LARGE IS THE IMPACT LIKELY TO BE?
This provides an indication of:
• what scope there is for reducing non-tariff barriers between the UK and non-EU countries
• what sorts of non-tariff barriers could emerge between the UK and the EU in future, were the UK to trade with the EU on the same sort of terms as other countries currently do.
(Table 2 summarises the assumptions made about the latter point in the various different studies of the economic impact of Brexit.)
While it is relatively simple to measure the size of tariff barriers to trade, the importance of non-tariff barriers is more difficult to gauge.41 Figure 4 demonstrates that there can be considerable variation in assessment of sectoral non-tariff barriers.
Two broad approaches have been taken to trying to quantify the importance of non-tariff barriers to trade: top-down and bottom-up. Top-down approaches try to estimate the overall size of all existing non-tariff barriers, while bottom-up approaches try to estimate the cost of each individual barrier (such as filling in a form or waiting at customs), and then add them all together. The disadvantage of the latter approach is that it is possible to underestimate the size of barriers, if one fails to include something. The disadvantage of the former approach is that a cost may be erroneously classified as being driven by non-tariff barriers, when in fact it is caused by something else.
Figure 4: Comparison of estimates of non-tariff barriers by sector (% tariff rate equivalent)
0%
5%
10%
15%
20%
25%
IMF staff HMG Berden et al.
Agricultu
re
Minin
gFo
od
Textil
es
Wood
Paper
Petroleum
Chemicals
Plastic
Minera
ls
Basic m
etals
Metal p
roducts
Electrica
ls
Transp
ort equip
ment
Machin
ery
Electrici
ty
Constructi
on
Wholesa
le trade
Retail t
rade
Hospita
lity
Inland transp
ort
Wate
r tra
nsport
Air tra
nsport
Other t
ransp
ort
Postal
Financia
l inte
rmediatio
n
Real esta
te
Other b
usiness
Educatio
n
Health
Other s
ervice
s
Source: International Monetary Fund, Euro Area Policies: Selected Issues, Country Report No. 18/224, 19 July 2018, retrieved 9 October 2018, www.imf.org/en/Publications/CR/Issues/2018/07/18/Euro-Area-Policies-Selected-Issues-46097
Top-down: Gravity modellingOne of the most common top-down approaches uses data on trade flows between the UK and lots of other countries over time to estimate what is known as a ‘gravity model’
34 UNDERSTANDING THE ECONOMIC IMPACT OF BREXIT
of trade flows.* Gravity models are an empirical description of global trade flows. Observed patterns of trade – in numerous different types of goods and services, between numerous countries, over long periods of time – are used to estimate the importance of various factors in determining the volume of trade between countries.
The factors that are allowed for include:
• the size of the countries• the distance between them• whether countries share a land border• the level of tariffs imposed• exchange rate movements• levels of corruption• whether countries share a common language or colonial heritage.**
A robust finding of numerous studies – using data on trade flows between dozens of countries over many years – is that trade flows are larger between larger economies that are geographically closer together.42
Economists have taken two approaches to using this sort of equation to estimate the size of non-tariff barriers. One option demonstrated by PwC43 is a so-called ‘residual’ approach. A gravity model is estimated including a range of factors (as outlined above) that are thought to affect trade flows. This model is then used to predict how much trade should happen between the UK and another country. The difference between this predicted figure and actual observed trade flows is assumed to reflect the degree of trade discouraged by non-tariff barriers. These non-tariff barriers can be expressed as a tariff-rate equivalent by working out what level of tariff would lead to the same reduction in trade volumes. The downside of this residual approach is that it classifies as a non-tariff barrier anything that otherwise cannot be explained, which could overstate the true scale of non-tariff barriers.
Using this approach, PwC estimates that non-tariff barriers to trade between the UK and non-EU countries are substantial, ranging from a 10.5% tariff-rate equivalent on imports of manufactured products (aside from food and transport equipment) to 125% for imports of food and accommodation services.44
An alternative approach – taken by Berden and others in 2009, and Egger and others in 2015 – is to include an indicator of the level and extent of non-tariff barriers in the gravity model when it is estimated. Berden and others constructed indexes of non-tariff barriers for different types of goods and services, using responses to a survey of businesses combined with information from OECD trade restrictiveness indicators.*** Egger and others included indicators for the depth of any preferential trade agreement in place between two countries as a summary indicator of the non-tariff barriers remaining. Once estimated, this equation provides an indication of how much trade is
* This is sometimes also referred to as the ‘quantity’ approach.** The first two of these (size and distance) are what lend the gravity model its name.*** Even though the single market in services is not complete, OECD analysis suggests that non-tariff barriers to
services trade are on average four times greater between EU and non-EU countries than between EU member states. Giles C, ‘A goods-only Brexit deal puts UK services sector jobs at risk’, Financial Times, 5 July 2018, retrieved on 12 October 2018, www.ft.com/content/f3f5506c-7f6d-11e8-8e67-1e1a0846c475

35HOW LARGE IS THE IMPACT LIKELY TO BE?
discouraged by non-tariff barriers and – in the same way as described above – the non-tariff barriers can be expressed as a tariff-rate equivalent.
Using this approach, Egger and others estimated that intra-EU goods trade faces significantly lower non-tariff barriers than goods coming from countries with which the EU does not have a preferential trade agreement. The difference is estimated to be equivalent to a 13% tariff on average. This is large compared to the average MFN tariffs imposed on imports to the EU from the USA (2.1%).45
Egger and others also estimated that services imports to the EU face non-tariff barriers equivalent to a 13% tariff. In their modelling of the impact of the Transatlantic Trade and Investment Partnership (TTIP), they assumed that barriers equivalent to a 9.9% tariff on services imports to the EU could be removed. However, they noted that existing preferential trade agreements (at the time of writing) had done little to reduce those sorts of barriers.
Berden and others also estimated the additional barriers facing transatlantic trade that do not face intra-EU trade. Looking at trade in non-agricultural goods and services, they estimated the additional non-tariff barriers to be equivalent to an 18% tariff.46
Top-down: Comparing producer prices*
An alternative top-down approach is to compare the prices of products in different countries to infer the size of non-tariff barriers.47 This is the approach used by the EFT.
The EFT attempt to estimate the combined size of tariffs and non-tariff measures by comparing the prices received by producers of goods in different countries (adjusted for transport costs). Their argument is that in a world of free trade, without any trade barriers, producers in different countries would receive exactly the same price for the goods that they produce. Therefore – the authors claim – any differences in price must reflect tariff or non-tariff barriers, which raise the price of imported goods and so allow EU-based producers to remain in business, even if they charge higher prices than foreign producers.
Using data that is now rather out of date (only covering the period up to 2002), the EFT look at the differences between the prices of around 3,000 goods sold in the EU and other countries that are members of the OECD group of advanced economies.** They concluded that manufactured goods were on average 21% more expensive in the EU in 2002 than in the lowest cost OECD supplier (after adjusting for transport costs).
* This is sometimes simply referred to as the ‘price’ approach. This section draws on the analysis presented in Sampson T, Dhingra S, Ottaviano G and Van Reenen J, ‘Economists for Brexit: A Critique’, CEP Brexit Analysis No.6, 2016, retrieved on 11 October 2018, http://cep.lse.ac.uk/pubs/download/brexit06.pdf.
** The OECD aims to collect data (as far as possible) on the same products sold in different countries. For example, for manufactured goods it compares prices for the same make and model, while for goods such as food it endeavours to collect prices for products of the same size and quality in each country. However, the figures that are eventually published do not contain such a high degree of granularity. Matters are further complicated by the fact that the OECD collects information on prices paid by consumers, whereas estimating non-tariff barriers requires a comparison of the price received by producers in each country. These are not directly observed, so the EFT estimate them by taking the consumer prices and deducting an estimate of distribution margins and trade costs.

36 UNDERSTANDING THE ECONOMIC IMPACT OF BREXIT
This is about half the level estimated in a similar manner by Bradford in 200348 using prices from 1993, suggesting that non-tariff barriers reduced by about half between 1993 and 2002. The EFT assume – ‘to avoid an impression of spurious accuracy’ – that the price differential would fall further (halving again to 10%) by 2020.49
As mentioned above, the average tariff charged on EU imports is 2.8%, meaning that the remaining 7.2 percentage points would be attributable to non-tariff measures. There are three downsides to this approach to estimating the size of trade barriers. First, it is not possible to observe producer prices directly: these must be inferred by adjusting consumer prices to strip out estimated distribution margins and trade costs.
Second, it is difficult to collect prices for identical products across different countries, particularly where some products (or products of a particular quality) are not produced or consumed in all countries. Both of these factors mean that part of the difference in price could be attributed to non-tariff barriers, when in fact it reflects something else – such as differences in product quality or distribution costs.
Third, unlike the methods described above and below, it does not allow one to estimate the size of non-tariff barriers to trade in services, which are an important part of the UK economy and trade.
The second problem – failing to account properly for differences in quality – is thought to be particularly acute by many trade economists. This means the estimated difference in producer prices highlighted by EFT is unlikely to wholly reflect unwarranted protectionist trade measures.
Bottom-upThe alternative way to estimate the size of non-tariff barriers to trade is a bottom-up approach. This aims to estimate the cost of each individual non-tariff measure, and add these up to calculate an overall figure. The leaked government analysis stated that government departments are in the process of looking at case studies across a number of sectors, in order to estimate how large specific non-tariff barriers could be.
Ciuriak uses the World Bank’s Doing Business Survey to estimate the time and out-of-pocket costs associated with getting goods across the EU border. This suggests that it takes roughly one extra day to get goods into and out of the EU than it does to move them between member states. Previous studies suggest that each day’s delay adds a cost equivalent to a tariff of about 1.3%.50
In addition to these time delays, anyone importing goods from the USA into the Single Market (or exporting to the USA from the EU) is required to fill in additional paperwork. They estimate that in the past, this has added a cost of around $175 ($180) per container imported (exported) – but they assume that this cost has been reduced to $100 per container since a single administration document was introduced.
Taking together these border and administrative costs, Ciuriak estimates that they raise the cost of imports from the USA to the EU by the equivalent of a 3.26% tariff on average.

37HOW LARGE IS THE IMPACT LIKELY TO BE?
Berden and others supplement a top-down gravity model approach with business surveys and interviews with sectoral experts, to evaluate the scale of non-tariff barriers faced by particular industries. Based on responses to business surveys and interviews with sector experts, Berden and others estimate that non-tariff barriers between the EU and USA add costs equivalent to a 7–8% tariff on average, although the magnitude varies markedly across sectors.
As the Government’s latest analysis noted, identifying the cost of individual or sector-specific non-tariff barriers generally tends to come up with lower estimates than a top-down approach.51 One reason for this is that the approach does not take account of the linkages between sectors. For example, if the non-tariff barriers for chemicals are reduced it can lead to lower prices, which could lower production costs for industries that use chemicals as an input.
Basing estimates of trade barriers solely on a bottom-up approach could understate the true size of non-tariff barriers to trade. Conversely, the top-down approaches risk attributing some differences in prices or trade flows between countries to the impact of non-tariff barriers, when in fact they reflect something else entirely. How non-tariff barriers are likely to change after Brexit is uncertain, and any assumption must be based on researchers’ judgement based on all the available evidence.
How will non-tariff barriers between the UK and EU be affected by Brexit?Whichever method is used, the available evidence suggests that currently there are significant non-tariff barriers to goods and services imported from outside the European Single Market. Estimates of the size of non-tariff measures imposed by the EU on imports from non-EU members range from 7% to 21%, depending on the estimation method used and which countries are being considered. As a member of the EU, the UK is able to avoid many of these barriers. Therefore, a crucial question is what, if any, additional non-tariff barriers the UK might face after Brexit.
Other FTAs that have been signed by the EU offer less close integration of goods and particularly services trade than the EU Single Market does. For example, even Switzerland – which has the most comprehensive set of bilateral trade agreements with the EU of any country in the world – does not have the same rights to provide financial services to EU residents as EU or EEA member states do. Other FTAs do not typically improve much on what is provided by WTO rules alone for a host of services.52
Most studies of the impact of Brexit assume that there will be little increase in non-tariff barriers to trade between the EU and UK after Brexit, if the UK remains a member of the EEA. In practice, there could be some increase in non-tariff barriers to trade with the EU, even in that circumstance. This is because EEA countries are outside the EU Customs Union, and so must satisfy rules of origin to qualify for tariff-free trade with the EU. This could increase costs of trade, particularly for industries with complex global supply chains. As a member of the EEA, the UK would remain a member of the European Single Market – continuing to abide by EU rules and policies, but with less ability to shape them.

38 UNDERSTANDING THE ECONOMIC IMPACT OF BREXIT
In other scenarios – whether the UK and EU sign some form of FTA or trade under WTO rules – many studies assume that there will be some increase in non-tariff barriers. Exactly how large this increase is predicted to be in each case is summarised for each study and each scenario in Table 2. It is not always clear exactly what is assumed in every study, and there is room for differences in opinion here.
Many studies – including, PwC, Oxford Economics, CEP, RAND and Rabobank – base their estimates of the likely size of non-tariff barriers between the UK and EU after Brexit on what currently applies to trade between the EU and USA, or the rest of the world. One reason for this is that detailed work on non-tariffs barriers has been carried out for estimates of the impact of TTIP which do not exist elsewhere. Another is that the USA may provide a suitable case study because it is English-speaking and has not-dissimilar institutions and trades on the basis of WTO rules – although as we note in Chapter 5, the USA has signed a host of other bilateral agreements with the EU to support co-operation on, for example, aviation, data and customs processes.
The studies mentioned above estimate that the non-tariff barriers facing goods and services imported from the USA are equivalent to a 10–14% tariff. All of these studies assume that trade between the EU and the UK post-Brexit would be somewhat less subject to non-tariff barriers than trade between the EU and the USA. The rationale is that currently, the UK enforces identical standards, legislation and procedures as the EU, and would be likely to remain more in line with EU practices than the USA – although this would be less the case if a far-reaching deal with the USA were struck.
Table 2: How much would non-tariff barriers to trade change following Brexit? Study Predicted change in non-tariff barriers with the EU (% tariff-rate
equivalent)
EEA FTA WTO UFT
EFT – – – No change
Ciuriak / Open Europe
+3.26%*
CEP +2.8% – +8.3% +8.3%
PwC – ** ** –
Rabobank +3.3% +5.9% +8.7% –
HMG +4% +7% +10% –
CPB – +6% +12.9% –
* This figure includes only the additional costs of border procedures and paperwork. Ciuriak’s modelling (which is also used in the Open Europe report) also includes additional non-tariff barriers to services trade but the published report does not state how large these are predicted to be.
** PwC assume that in an FTA scenario, non-tariff barriers between the UK and EU would rise by one quarter of the difference between those that currently exist between the UK and EU and those between the UK and non-EU countries. In a WTO scenario they assume barriers rise by three quarters of this difference. However, they do not provide a figure for the overall average increase in non-tariff barriers in either scenario.
Notes: All the other studies (Bertelsmann, NIESR, OECD, Oxford Economics, Treasury) assume there is some increase in non-tariff barriers between the UK and EU in all scenarios but do not spell out how large these are predicted to be in terms of the tariff-rate equivalent.

39HOW LARGE IS THE IMPACT LIKELY TO BE?
Nevertheless, these studies estimate that the increase in non-tariff barriers alone could still result in a significant impact on the UK’s GDP, ranging from −1.3% to −2% relative to the counterfactual.
What are the exceptions?EFT are unique in assuming that there would be no increase in non-tariff barriers between the UK and EU after Brexit, even if there is no formal trade agreement between the two countries. This is despite that fact that, as described above, the authors estimate that the EU currently imposes significant tariff and non-tariff barriers on imports from non-EU countries, which raise the price of those goods by 21%. To justify this assumption, EFT appeal to the rules of the WTO. In a recent article, Patrick Minford noted that ‘WTO law is very clear… there can be no discrimination in standards laid down by the EU or the UK’.53 He also notes that the WTO requires members to seek to minimise customs bureaucracy.*
While WTO rules do encourage the recognition of similar rules and regulations, they do not imply that trading under them means avoiding non-tariff (or tariff) barriers. WTO law is not strong enough to compel the EU to abandon the legal requirements of the Single Market, which mean that Third Countries are treated differently to members.54 The WTO encourages countries to enter into consultations with a view to agreeing that each other’s rules are equivalent, but ultimately it is up to the importing country to decide what qualifies.55 The EU’s view, set out in its notice to stakeholders,56 makes clear that in the absence of other agreements, the UK will be treated as any other Third Country because it will have left the treaties and institutions of the EU. As a result, all other things being equal, the UK would face immediate non-tariff barriers across the economy.
Under such circumstances, the UK could attempt to pursue its case at the WTO. However, Emily Lydgate, an expert in trade law at the UK Trade Policy Observatory, has concluded that even though the WTO encourages the recognition of equivalence, ‘From a legal realist perspective it is difficult to imagine that the WTO dispute settlement bodies would want to undermine the functioning of the [Single Market].’57 Even in the event that the UK were to receive a positive ruling, the most the WTO could do is to authorise the UK to impose retaliatory tariffs on the EU, thereby increasing barriers to trade rather than removing them. An assumption of no increase at all in non-tariff barriers to trade with the EU is an extreme one – reflecting the most positive possible outcome, rather than the best guess of what is actually likely to happen if the UK fails to reach an agreement on trade with the EU.
How will non-tariff barriers between the UK and non-EU countries be affected by Brexit?How non-tariff barriers between the UK and non-EU countries might change after Brexit depends in part on what deal is agreed between the UK and EU. For example, in certain softer scenarios – including the Chequers proposition, where the UK agrees to
* Alasdair Smith, Emeritus Professor of Economics at the University of Sussex, described Patrick Minford’s estimates of EU non-tariff barriers as: ‘Schroedinger’s [non-tariff barriers]: alive and kicking in at almost 20% tariff-equivalent on imports from non-EU countries when the UK is an EU member, but killed by WTO rules when the UK is not an EU member.’ Smith A, Written Evidence to the International Trade Committee, 23 May 2018, retrieved 9 October 2018, http://data.parliament.uk/writtenevidence/committeeevidence.svc/evidencedocument/international-trade-committee/the-economic-effects-of-trade-policy/written/83106.html

40 UNDERSTANDING THE ECONOMIC IMPACT OF BREXIT
maintain a ‘Common Rulebook’ on goods with the EU – the possibility and scope of trade deals with other countries could be dramatically reduced, because the UK would be constrained in its ability to alter regulations or import goods that do not meet EU standards.
An immediate priority for the UK government is to ensure continuation of the current trade deals that the UK has by virtue of EU membership. Many of the studies assume that the UK continues to benefit from the EU’s preferential trade agreements with Third Countries, which cover 13% of UK exports. However, this is not yet guaranteed, and there could be complications which could reduce the benefits of these trade deals, once the UK is no longer an EU member.* 58
Some of the studies and scenarios published assume that the UK is able to sign new FTAs with other non-EU countries (as outlined in Table 1). The timeline over which these deals are assumed to be signed varies between the studies and across different scenarios. Some assume that the deals could be signed almost straight away after Brexit, while others assume that they could take up to five years after the end of the transition period to finalise.
However, most studies predict that the likely boost to economic output from signing any new FTAs would be small, relative to the loss of output from higher barriers to trade with the EU. For example, the leaked government analysis estimated that a FTA with the USA would add up to 0.3% to economic output, and that trade deals with Australia, China, India, Gulf countries and nations of South-East Asia would add, in total, a further 0.1% to 0.4% to GDP.59 This is consistent with most assessments of past FTAs, which find that they have not provided large gains to overall GDP. However, these existing studies have tended to focus on the gains from removing tariff barriers – rather than non-tariff barriers - in circumstances where the trade flows involved were relatively small and so do not reflect the gains possible from very close trade integration, such as within the EU single market.
Some have argued that the Government’s assessment of the possible benefits is unduly pessimistic.60 But even with optimistic assumptions about the ability to remove non-tariff barriers, a report for the Department for Business Innovation and Skills in 2013 estimated that a trade deal between the USA and the EU would provide a maximum 0.35% increase in GDP to the UK.61
Whatever the size of the gains, we can expect that these deals will take years to complete after Brexit, and so will not benefit the UK until well after initial impacts of leaving the EU have worked their way through the economy.** 62
Under a UFT scenario (such as Ciuriak, CEP and EFT present), the UK would unilaterally remove tariffs on imports from all other countries. Estimates of the benefits of this to UK GDP vary. HMG63 estimates that adopting UFT would boost UK GDP by 0.2%
* For example, once the UK leaves the EU, UK companies may no longer be able to count EU inputs to help them qualify for rules of origin.
** For example, analysis of regional trade deals conducted over the past 20 years found an average duration of 28 months, with a very high variance. Significantly, the number of countries involved is strongly positively correlated with duration.

41HOW LARGE IS THE IMPACT LIKELY TO BE?
relative to the situation of trading on WTO terms. The CEP model suggests that adopting UFT would raise GDP by 0.3%, Ciuriak estimates a somewhat larger gain of 0.75% – again both expressed relative to a scenario in which the UK trades with the EU on WTO terms.*
However, with the exception of the EFT, researchers have concluded that the benefits of adopting UFT would be insufficient on their own to outweigh the costs of giving up membership of the Single Market. By contrast, the EFT suggest that unilaterally adopting free trade would eliminate all non-tariff barriers between the UK and non-EU countries – while leaving non-tariff barriers between the UK and EU unchanged – leading to a significant net benefit to the UK and boosting GDP by 4%.
If the UK adopted UFT, in principle there still would be scope for the UK to sign FTAs with other countries. The benefit of doing so, for example, would be to mutually tackle non-tariff barriers. However, having already removed all tariffs, the UK would have less to offer in return for other countries making concessions. None of the UFT scenarios modelled allow for new FTAs with non-EU countries.
What will be the impact of changes to trade barriers on trade and economic growth?As described above, most economic analyses of Brexit predict that leaving the EU will result in higher trade barriers. Based on past evidence on the relationship between trade barriers and economic growth, the studies predict that this increase in tariff and non-tariff barriers would lead to lower economic growth. (The exception is the above-mentioned study by the EFT, which predicts that barriers to trade with the EU will be unchanged.)
The reduction in economic growth as a result of lower trade with the EU is predicted to be partially – but in most cases, not entirely – offset by an increase in trade and growth as a result of lower barriers to trade with non-EU countries.
The exact size of the overall impact on trade and growth depends in large part on how much barriers to trade are expected to rise or fall. It also depends on the parameters used in the economic model: that is, the significance of the impact that trade barriers are thought to have on growth. The studies that have been published so far suggest that the direct impact of changes to trade barriers post-Brexit would be to reduce economic output in the longer term by between 0.5% and 4.9%. The largest negative impact is predicted by RAND under a scenario in which the UK trades in future with the EU under WTO rules. EFT is the only study that assumes trade barriers will fall overall, leading them to predict that increases in trade will directly boost economic output by 4%.
InvestmentInward investment to the UK amounted to just under $40bn in 2015. Investment flows are volatile from year to year, but the UK has consistently been one of the top recipients of foreign investment among the major advanced economies, according to figures from the OECD.64
* Open Europe also uses Ciuriak’s estimate of the gain from adopting unilateral free trade.

42 UNDERSTANDING THE ECONOMIC IMPACT OF BREXIT
How Brexit might affect investment is closely related to what happens to the UK’s trading relationship with the EU and other countries. Although here we discuss investment separately from trade, the two are intimately related – both in reality and in the economic models used to project the impact of Brexit.
Most studies predict that Brexit will reduce FDI into the UK (the assumptions made are summarised in Table 5 in the Appendix). Past evidence suggests that EU membership has boosted member states’ FDI flows by somewhere between 14% and 28%, suggesting that Brexit could reduce UK FDI by about 22%.65
The exception is EFT. In line with their assumption that adopting UFT after Brexit will increase UK trade flows and growth, EFT also assume that such a scenario will result in higher levels of foreign investment in the UK.66
In general, studies find that changes in FDI on their own play only a small part in determining the path of UK economic growth post-Brexit. NIESR, for example, finds that under a Swiss trading scenario, the consequent fall in FDI would lead to a 0.5% reduction in GDP relative to remaining in the EU.67
However, falls in FDI could have a larger impact on growth if they also affect productivity.68 At least four studies (CEP, Treasury, NIESR and Rabobank) allow for this so-called ‘dynamic’ effect. The CEP finds that, allowing for these dynamic effects of FDI on productivity, lower FDI flows following Brexit could on their own reduce UK economic output by 3.4%.69 (The section on productivity below outlines more fully the implications for the likely economic impact if changes to trade and investment are assumed to affect UK productivity.)
Table 5 in the Appendix summarises what each study and scenario assumes about how Brexit affects FDI into the UK, and the predicted effect of this on UK GDP.
Domestic regulationsAfter leaving the EU, the UK government could change rules and regulations that are currently set in Brussels to better suit the UK’s needs and preferences. The UK’s freedom to do this will depend on the relationship that it agrees with the EU, domestic political constraints, and the UK’s continuing international commitments to global standards and conventions. Of course, as described in Chapter 2, it is by no means guaranteed that the UK would regulate better* – in some cases such as competition policy, divergence could have costs as well as benefits.70
In any case, the EU’s guidelines for negotiating the future relationship state that because of the location of the UK, any deal will need to include commitments from the UK on, among other things, state aid, the environment and social protections.71 If the EU sticks to this position, it would remove some of the scope for divergence. A scenario involving closer UK–EU integration – such as the Chequers plan or remaining in the EEA – would further reduce the scope for gains from deregulation.
* The advantage of co-ordinating regulation and state aid policy at the EU level is that it prevents policy makers in any one country being tempted to introduce policies or targeted protections to help specific vested interest groups. Therefore, it is possible that leaving the EU could harm economic activity, if it increases the likelihood of economically harmful policies being implemented.

43HOW LARGE IS THE IMPACT LIKELY TO BE?
The majority of the studies that project the long-term impact of Brexit have ignored potential gains from deregulation (the exceptions are HMG, Open Europe, PwC, Oxford Economics and EFT).
What are the possible benefits from changing regulations?A small number of studies have attempted to identify regulations that could be changed, and to quantify the possible economic impact of doing so. Open Europe identifies 1.3% of GDP of possible regulatory gains, but it judges that only 0.7% of GDP of this saving (or £12.8 bn a year) would be ‘politically feasible’.72 These projected savings would come from changing regulations on social and employment protection, health and safety, product standards, and environment and climate change. Open Europe assumes, for example, that the UK government would scrap the EU’s Agency Worker Directive and amend renewables targets. The size of the gains that Open Europe estimates are possible is based on more than 2,300 regulatory impact assessments carried out by the UK government before the policies were implemented (and published between 1998 and 2009).*
PwC also includes this estimate of possible regulatory gains in its modelling. However, it also notes that these estimates may overstate the benefits of deregulation, since they only include gross assessments of cost impact, and do not consider any economic benefits which can arise from good regulation.73
The Institute of Economic Affairs has suggested that GDP could be raised by as much as 7.25% by 2034 if the UK were able to reach agreement with the USA and signatories of the Comprehensive and Progressive Trans-Pacific Partnership to reduce regulatory distortions.74 However, trade experts are sceptical that such widespread changes to regulation would be possible without harming consumer protections75 that are important to UK voters or leading to greater barriers to trade with the EU because of regulatory divergence.76
Oxford Economics estimates much smaller savings from deregulation. Its analysis suggests that there could be a 0–0.13% of GDP benefit if the UK moves towards the standards and regulations adopted by the countries judged the ‘best performers’ by the OECD.
The OECD states that the UK’s regulation of both network industries and the labour market already has been the least restrictive among OECD countries, which limits the scope for improvement. The Confederation of British Industry’s (CBI) more granular analysis suggests that while there are some marginal gains to be had, there is no great appetite for large-scale deregulation among most UK industries.77
* These figures could overstate the gains that could be achieved through deregulation since, in some cases, subsequent evaluations of the policies have suggested the economic costs were not as large as initially anticipated. For example, Open Europe estimates the total cost of the Working Time Directive to be £4.2bn a year. However, other studies have questioned whether there is much evidence of any sizeable additional burden on British businesses, with evidence suggesting that shorter working hours for some workers have been offset by increased employment of others. Barysch K, The Working Time Directive: What’s the fuss about? Centre for European Reform, April 2013, retrieved 11 October 2018 www.cer.eu/sites/default/files/publications/attachments/pdf/2013/pb_workingtimedir_kb_26april13_bl-7268.pdf; Department for Business Innovation and Skills, The Impact of the Working Time Regulations on the UK Labour Market: A review of evidence, BIS Analysis Paper No. 5, December 2014, retrieved 11 October 2018 https://assets.publishing.service.gov.uk/government/uploads/system/uploads/attachment_data/file/389676/bis-14-1287-the-impact-of-the-working-time-regulations-on-the-uk-labour-market-a-review-of-evidence.pdf
44 UNDERSTANDING THE ECONOMIC IMPACT OF BREXIT
In one version of their modelling – which predicts an overall GDP gain of 7% – EFT assume there will be gains from deregulation that boost UK GDP by 2% after 15 years.
MigrationA minority of the existing studies of the long-term economic impact of Brexit allow for changes in immigration from the EU and/or non-EU countries. As described in Chapter 2, immigration can affect aggregate economic growth in a purely mechanical way: that is, by increasing the number of workers available to produce output. However, it can also affect output and output per person indirectly, by changing productivity. By increasing competition for jobs, immigrants may encourage native workers to become more productive. In addition, immigrants may have different skills and knowledge than the native-born workforce, which can further affect productivity.
How does migration affect UK economic growth?Exactly how – and how significantly – immigration affects economic growth is an empirical question. The way that researchers have attempted to quantify the impact of migration on economic growth is similar to the approach used to estimate the impact of trade on growth: that is, by using data on multiple countries over many years to examine the relationship between migration and growth. However, compared to the large literature on the effects of trade on economic growth, the empirical literature on the effects of migration on growth is more meagre, as Portes and Forte observe.78
The recent MAC report summarised the evidence on the impact of migration on the UK economy. Immigration clearly increases the number of workers available, which in itself boosts total output. Beyond that, the MAC report concluded that EEA migration to the UK has had ‘neither the large negative effects claimed by some nor the clear benefits claimed by others’.79 The MAC concluded that there was clearer evidence of a positive impact – on wages, employment and productivity – from high-skilled migrants than from low-skilled migrants.
How will migration be affected by Brexit?As a member of the EU, the UK government cannot restrict immigration from EU nationals wanting to work in the UK. After Brexit – depending on exactly what deal is struck between the UK and the EU – the Government may be able to choose what controls to impose on migrants from the EU. These could apply to all EU migrants, or be targeted at specific groups.
Currently, the UK imposes restrictions on non-EU migrants. In general, would-be migrants need to show they have been offered a skilled job in the UK that will pay them at least £30,000 a year, or be filling a post in a shortage occupation. These rules are designed to help the Government achieve its target of reducing net migration to the tens of thousands. Special rules also apply to students and family members joining UK residents.
In principle, the UK government is free to ease existing restrictions on non-EU migrants at any time. However, Brexit may create new opportunities to do this because it could open up the opportunity to impose greater restrictions on EU migration at the same time.

45HOW LARGE IS THE IMPACT LIKELY TO BE?
Five of the studies (HMG, OECD, Oxford Economics, PwC and Rabobank) assume that Brexit will lead to a fall in net migration to the UK. For example, PwC assumes in its FTA scenario that in future, low-skilled migration from the EU is subject to the same strict constraints as currently apply to low-skilled non-EU migrants, but that restrictions on high-skilled immigration from outside the EU are relaxed – somewhat similar to the proposal recently put forward by the MAC. These studies find that this reduction in migration leads to a loss of between 0.2% and 1.6% of GDP, depending on the assumptions made about the strictness of the migration regime. PwC estimates that reduced migration – even in a scenario as just described, where restrictions on high-skilled non-EU migrants are relaxed – would reduce long-term economic output by 1%.
Only two studies (by Oxford Economics and Rabobank) allow for a further, albeit small, effect of lower immigration on productivity (addressed later in this chapter).
The Government’s analysis assumed – under its WTO scenario – that EU migration would be subject to the same rules as currently apply to non-EU migrants. Under its FTA scenario, the Government assumed that EU migrants would be subject to slightly more relaxed rules, although stricter than free movement. It did not allow for any change to the rules for non-EU migrants. It predicted that lower migration would reduce long-run UK GDP by 0.5% in an FTA scenario, and 1.2% in a WTO scenario.
(The assumptions made by the other studies and the conclusions that they reach are summarised in Table 6 in the Appendix.)
Since the UK electorate voted to leave the EU, there has been a notable fall already in net migration from the EU, but an increase in net migration from outside the EU.80
Contributions to the EU budgetThe possible benefits from regaining control of money sent each year to Brussels played a major part in the Brexit referendum debate. Brexit supporters made much of the fact that the UK could reclaim £350 million (m) a week that is sent to Brussels, saying this could be better spent on the NHS.
The idea that such a large sum would be available for new domestic spending priorities has been widely debunked. As Browne, Johnson and Phillips showed,81 the UK’s actual net contribution to the EU budget (that is, after accounting for the UK’s rebate and for EU spending in the UK) is only around £8bn a year (or around £150m a week, equal to roughly 0.4% of GDP). Furthermore, the overall effect of Brexit on the UK’s public finances (and thus the funding available for the NHS) will depend on what impact Brexit has on the economy.
Nonetheless, the possible benefit that could come from regaining control of this money has continued to feature in the public debate, with Theresa May claiming that a recent pledge to spend £20bn a year more on the NHS would be part-funded by this Brexit dividend.82
Most of the studies of the long-term economic impact of Brexit assume that there will be a reduced annual contribution to the EU budget. Exactly how large the saving will be is likely to depend on the deal reached with the EU. If the UK wants to keep

46 UNDERSTANDING THE ECONOMIC IMPACT OF BREXIT
privileged access to the EU internal market, it will most likely have to keep contributing to the EU budget as well. Norway, for example, is a member of the EEA and makes roughly two thirds of the per-person contribution to the EU budget that the UK does.83
However, the precise assumption made about the UK’s future contribution to the EU budget makes only a modest difference to the overall economic effects predicted. The scale of the budget contribution is dwarfed by the other impacts that Brexit could have on the UK economy. For example, a rough rule of thumb suggests that a 1% loss of output will raise public borrowing – by suppressing growth in tax revenues and raising demands on public spending – by 0.7% of GDP within two years.
As Figure 2 shows, studies published to date estimate that Brexit could reduce UK economic output by somewhere between 1% and 18%, suggesting that upward pressure on borrowing as a result of lower economic output would be likely to outweigh any reduction from lower direct contributions to the EU budget. Even in the study produced by the EFT, which predicts large gains from Brexit – the boost to the public finances from the sort of increase in economic output that they forecast would dominate any gain from ceasing to make payments to the EU.
Productivity growthAs mentioned in Chapter 2, there are some strong theoretical reasons for thinking that greater openness to trade and investment provides a permanent boost to productivity growth – and thus strong theoretical reasons to believe that Brexit could damage productivity growth, if it leads to a reduction in the UK’s openness to trade and investment. However, these dynamic gains from trade are less well understood and harder to estimate empirically. By their nature, any such effects occur gradually over time and through multiple interconnected mechanisms which are hard to pinpoint. Some studies over the past decade have made headway in demonstrating robustly the existence of a relationship between trade openness (or more generally, globalisation) and productivity growth.84,85,86 However, because these studies look at specific examples of when trade barriers were increased or decreased, the results may not perfectly translate to the current situation.
Many of the studies that have been published projecting the impact of Brexit on the UK economy assume that it has no effect on the UK’s long-term technological capability. In other words, those studies assume that the impact of Brexit is restricted to the effects that it has on trade barriers, labour supply and levels of investment – and factoring in only the static effect on productivity. This approach is taken by the CEP in its ‘static’ projection, and also by PwC and NIESR. This assumption minimises the difference predicted between what would happen to economic growth if the UK remained in the EU, and what would happen post-Brexit. If lower trade and investment does impact on productivity, these ‘static’ models will underestimate the impact of Brexit – based on existing evidence on how EU integration has boosted incomes, Busch and Matthes argue that this underestimation could be significant.87
A minority of the studies to date (Treasury, OECD, Rabobank, CEP and CPB in their ‘dynamic’ projections) explicitly allow for Brexit to have a permanent impact on growth in the UK’s technological capability. Allowing for this impact on productivity

47HOW LARGE IS THE IMPACT LIKELY TO BE?
significantly increases the estimated impact of Brexit on the UK economy. As Table 3 shows, the CEP finds that joining the EEA rather than remaining in the EU would be associated with 1.3% lower GDP by 2030 using a ‘static’ model; but a larger (6.3–9.5%) reduction if a ‘dynamic’ model is used instead. Rabobank reaches a similar conclusion.88
It is unclear exactly how much of the dynamic impact of Brexit on the UK economy is captured in the latest government analysis. One way to reduce the estimated size of Brexit’s impact would be to switch to the ‘static’ modelling approach used by some other studies. The Government’s forthcoming analysis will need to make clear what it assumes about the effects of Brexit on long-run productivity, and why it has chosen that approach.
Table 3: Comparing the estimated impact of Brexit on UK economic output, with and without allowance for an effect on productivity
Study and scenario Estimated impact on GDP
Static (no productivity impact) Dynamic (with productivity impact)
CEP EEA -1.3% -6.3% to -9.5%
Rabobank EEA n/a -10%
Rabobank FTA n/a -12%
Rabobank WTO n/a -18%
CPB FTA -3.4% -5.9%
CPB WTO -4.1% -8.7%
Treasury EEA n/a -3.4% to -4.3%
Treasury FTA n/a -4.6% to -7.8%
Treasury WTO n/a -5.4% to -9.5%
NIESR WTO -2.7% -7.8%

48 UNDERSTANDING THE ECONOMIC IMPACT OF BREXIT
4. How will the impact vary across the UK?The focus of the studies that we have surveyed above – and much of the public debate – has been on the overall impact of Brexit on the economy. Yet Brexit’s impact will not be felt uniformly across the country. Relatively small aggregate figures could mask deep impacts in some industries or effects concentrated in particular regions. Likewise, large aggregate losses (or gains) could obscure benefits (losses) to some sectors and regions.
Many of the global macroeconomic models used to estimate the overall long-term impact of Brexit do not allow analysts to look at the effect on individual sectors, regions or income groups. However, some complementary studies – which we describe in this chapter – have attempted to shed light on this question.
In general, these analyses suggest that the impact on individual industries, regions and income groups is in the same direction as the impact predicted for the economy as a whole. That is, studies that conclude that Brexit would harm UK economic output also tend to imply that output in each sector and each region also would be reduced. There are a small number of exceptions, which we draw out below.
As we set out in Chapter 3, the vast majority of Brexit impact assessments conclude that leaving the EU will increase barriers to trade, and so harm economic growth to some extent. This chapter focuses on summarising what this overall conclusion means for different sectors, regions and income groups, drawing on a number of complementary studies.
However, before we do this, we look at the distributional implications of the projections published by the EFT, which indicate that Brexit (and specifically, the unilateral adoption of free trade) could have significant overall economic gains for the UK.
Distributional implications of the Economists for Free Trade modelUnder the assumption that the UK unilaterally adopts free trade, the EFT conclude that UK economic output as a whole would be boosted by 4% – but the implications for each sector of the economy vary considerably. Looking at the impact across different sectors of the economy, the EFT conclude that unilaterally removing barriers to trade for manufactured goods and agricultural products would ‘raise service output and effectively eliminate manufacturing’1 and large parts of the agricultural sector.2
In the long run, the EFT’s expectation is that the economy will adjust, with workers moving out of manufacturing to find new jobs in the services sector. However, as Alasdair Smith from the UK Trade Policy Observatory notes: ‘The employees of the car assembly plants in Sunderland, Swindon and Burnaston can look at the communities affected by the decline of the coal, steel and textile industries in the 1980s and make
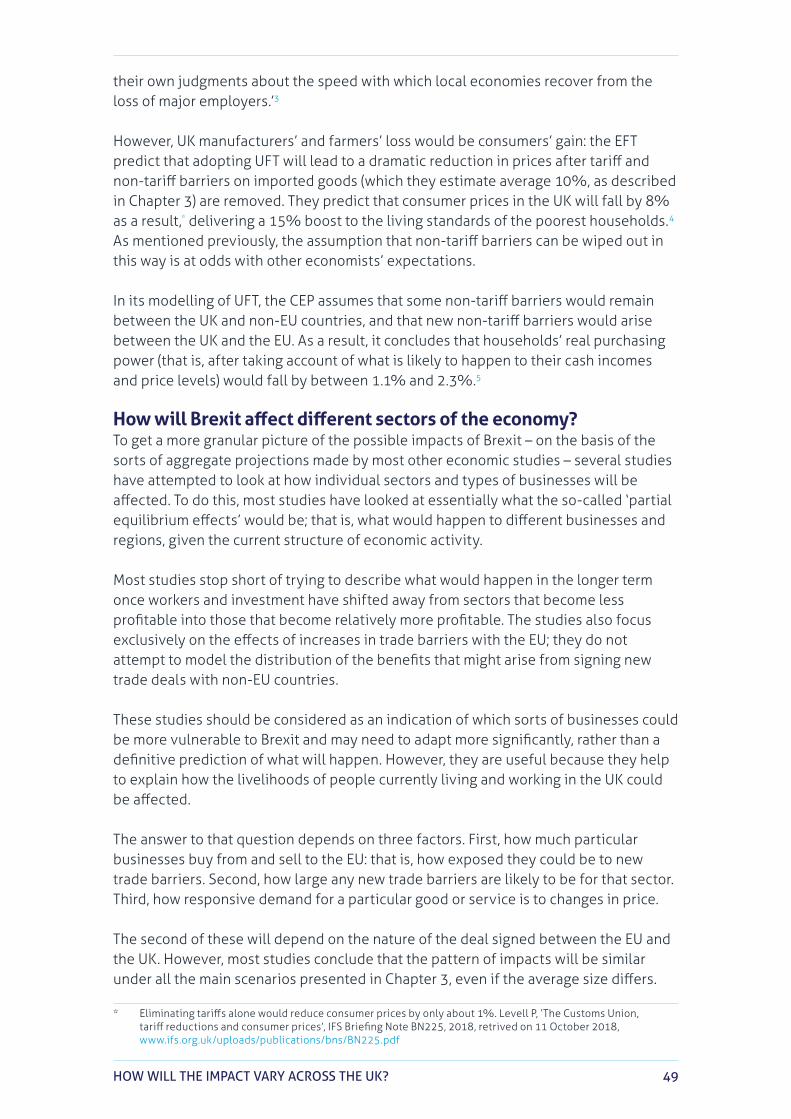
49HOW WILL THE IMPACT VARY ACROSS THE UK?
their own judgments about the speed with which local economies recover from the loss of major employers.’3
However, UK manufacturers’ and farmers’ loss would be consumers’ gain: the EFT predict that adopting UFT will lead to a dramatic reduction in prices after tariff and non-tariff barriers on imported goods (which they estimate average 10%, as described in Chapter 3) are removed. They predict that consumer prices in the UK will fall by 8% as a result,* delivering a 15% boost to the living standards of the poorest households.4 As mentioned previously, the assumption that non-tariff barriers can be wiped out in this way is at odds with other economists’ expectations.
In its modelling of UFT, the CEP assumes that some non-tariff barriers would remain between the UK and non-EU countries, and that new non-tariff barriers would arise between the UK and the EU. As a result, it concludes that households’ real purchasing power (that is, after taking account of what is likely to happen to their cash incomes and price levels) would fall by between 1.1% and 2.3%.5
How will Brexit affect different sectors of the economy?To get a more granular picture of the possible impacts of Brexit – on the basis of the sorts of aggregate projections made by most other economic studies – several studies have attempted to look at how individual sectors and types of businesses will be affected. To do this, most studies have looked at essentially what the so-called ‘partial equilibrium effects’ would be; that is, what would happen to different businesses and regions, given the current structure of economic activity.
Most studies stop short of trying to describe what would happen in the longer term once workers and investment have shifted away from sectors that become less profitable into those that become relatively more profitable. The studies also focus exclusively on the effects of increases in trade barriers with the EU; they do not attempt to model the distribution of the benefits that might arise from signing new trade deals with non-EU countries.
These studies should be considered as an indication of which sorts of businesses could be more vulnerable to Brexit and may need to adapt more significantly, rather than a definitive prediction of what will happen. However, they are useful because they help to explain how the livelihoods of people currently living and working in the UK could be affected.
The answer to that question depends on three factors. First, how much particular businesses buy from and sell to the EU: that is, how exposed they could be to new trade barriers. Second, how large any new trade barriers are likely to be for that sector. Third, how responsive demand for a particular good or service is to changes in price.
The second of these will depend on the nature of the deal signed between the EU and the UK. However, most studies conclude that the pattern of impacts will be similar under all the main scenarios presented in Chapter 3, even if the average size differs.
* Eliminating tariffs alone would reduce consumer prices by only about 1%. Levell P, ‘The Customs Union, tariff reductions and consumer prices’, IFS Briefing Note BN225, 2018, retrived on 11 October 2018, www.ifs.org.uk/uploads/publications/bns/BN225.pdf

50 UNDERSTANDING THE ECONOMIC IMPACT OF BREXIT
So we focus below on the predictions that have been made, assuming that the UK and EU trade with each other under WTO rules.
The last factor – the responsiveness of demand to price changes – depends on the product: for example, Apple was quick to raise the price of its products following the depreciation of sterling in 2016,6 but other companies were more cautious.
What would happen to manufacturing?Manufacturing accounts for around one tenth of UK economic output, and 8% of employment, but makes up 80% of UK goods exports and 44% of all UK exports.
In a comprehensive analysis of the manufacturing sector, researchers at the UK Trade Policy Observatory find that the overall effect of Brexit – including possible increases in both tariff and non-tariff barriers – for most areas of manufacturing would be negative, leading to lower production.7 Their findings are broadly consistent with other studies that have also looked at this question.8 They estimate that manufacturing output would be reduced by 5.5% overall, and manufacturing exports by 19.5% under a ‘no deal’ scenario, in which the UK leaves the EU without a deal and fails to sign any new trade deals with other countries or to ‘grandfather’ existing EU trade deals.
A number of studies consistently conclude that the clothing and textile industry would be one of the most highly affected. This is for two reasons. First, EU MFN tariffs on clothing and textiles are high. Second, UK-based manufacturers of clothing and textiles sell a lot of their output to the EU.9
The chemicals and pharmaceutical industry and the automotive sector are also predicted to be relatively heavily affected. In these cases, it is because these industries import a lot of inputs from the EU and export a lot of outputs back again, while the UK-based processing adds relatively little value in the middle.
At the other end of the scale, the UK Trade Policy Observatory estimates that about one third of sectors would be likely to buck the trend of lower output.10 It finds that the processed foods sector (in particular, macaroni producers) could gain from a WTO Brexit, as imports of these products would fall substantially, raising demand for domestically produced alternatives.
However, these gains would be more than offset by falls in output across all other manufacturing sectors. The impact is predicted to be largest for high- and medium-high-tech sectors such as consumer electronics, pharmaceutical and medical chemicals, and air and spacecraft.
Agriculture and fisheriesAgriculture and fishing make up a very small share of the UK economy – just 0.6% and 0.1%,11 respectively. Only half a million people work in the two sectors combined, out of a workforce of more than 32 million in the UK. But these industries are crucial to some communities, and could be significantly affected by Brexit, depending on exactly what deal is struck.

51HOW WILL THE IMPACT VARY ACROSS THE UK?
UK farmers could experience a large boost to demand if the UK imposes the same tariffs on agricultural imports from the EU as the EU currently does on imports from countries with which the bloc does not have a preferential trade agreement.* However, this would come at the expense of consumers, who would face higher food prices. The EU’s tariffs on agricultural goods are relatively high, and consumers seem to view UK produce as a close substitute for EU imports. As a result, even relatively small increases in the price of EU imports could cause consumers to switch to buying UK products instead.12
Similarly, agriculture would be particularly exposed if the Government were to decide unilaterally to adopt free trade, or sign new FTAs with non-EU countries (such as the USA) that include commitments to reduce agricultural tariffs. Removing tariffs on agricultural imports from outside the EU would expose UK farmers to much greater competition from foreign suppliers.
The outlook for agriculture also will depend on what policy the Government puts in place to replace the payments currently made to farmers under the EU’s Common Agricultural Policy. Currently these payments make up around 50–60% of farm income in England.13 In terms of employment and GDP, Northern Ireland is more dependent on the agricultural sector (including the agri-food business) than any other area of the UK.14
For the fishing industry, an important question is how fishing quotas will be set and allocated to different countries in the future. A detailed study by the UK Trade Policy Observatory concluded that if the only change post-Brexit is an increase in tariffs and non-tariff barriers, then UK fishing output would be likely to decline: EU MFN tariffs on fish range up to 16% for nephrops and scallops. But these negatives could be more than offset if the UK government were able to negotiate higher fishing quota allocations with the EU, and if UK fishermen were still able to sell to EU consumers. This could offer large gains to some parts of the fishing industry.15
What would happen to financial services?The Office for National Statistics estimates the financial services sector to account for 6.5% of UK economic output, and employing 1.1 million people.16 Just over one third of these jobs are in London, 11% in the wider South East, and the remainder (53%) across the rest of the UK. The UK runs a trade surplus in financial services, and one third of financial services exports go to the EU.
Financial services have featured heavily in the debate on the impact of Brexit. The EU is an important market for UK-based financial services companies, and the cost of serving this market could be significantly increased if the UK cannot improve on WTO terms of access to the Single Market. Typically, non-EU firms wanting to supply financial services in the EU would need to establish a subsidiary there, and also need the EU to agree that their home-country regulation is ‘equivalent’. However, more so than with other sectors, EU businesses rely on being able to buy financial services from the UK. London is the world’s leading financial centre, and EU businesses have no alternative source for such efficient, cost-effective financial services.17
* These are the so-called Most Favoured Nation (MFN) tariffs agreed with other WTO members.

52 UNDERSTANDING THE ECONOMIC IMPACT OF BREXIT
The main risks to the financial sector stem from the loss of market assess through ‘passporting’, which is unlikely to be fully offset by any new equivalence regime or bespoke trade agreement. Oliver Wyman suggests that if the UK were to trade with the EU on WTO terms, approximately £18–20bn in revenue and up to an estimated 31,000 to 35,000 jobs could be at risk, along with approximately £3–5bn of tax revenues a year.18 The study by Los and his co-authors finds a similar number of jobs at risk as a result of Brexit.19
The eventual impact – and what additional barriers are imposed on UK financial services businesses wishing to trade with the EU – will depend on the deal that is struck between the UK and EU. As described above, the Government’s latest analysis suggests that non-tariff barriers to financial services trade would be relatively modest – equivalent to around a 5% tariff in an FTA scenario. This is consistent with the findings of Berden and others in 2009, but at odds with recent analysis from the International Monetary Fund (IMF), which suggests that the barriers would be significantly higher – equivalent to around a 13% tariff.20
What would happen to non-financial services?Non-financial services make up around 70% of the UK economy21 and 36% of UK exports.22 The services sector covers a heterogeneous range of activities, including legal, accounting and business support services, restaurants and hotels, digital and creative industries, health and social care, and transport services.23
Brexit will predominantly affect the services sector through its impact on non-tariff barriers to trade in services. As discussed previously, while a FTA could eliminate tariffs on goods, it may do little to reduce non-tariff barriers to services trade, meaning that the impact on service industries could be similar under an FTA scenario as under a WTO scenario. As the House of Lords study on non-financial services notes, even an advanced FTA such as the one signed recently between the EU and Canada involves ‘hundreds of pages of restrictions’ when it comes to services.24
However, because efforts so far to reduce barriers to services trade worldwide have been relatively limited, there is far less extensive evidence on how services trade responds to changes in non-tariff barriers than how goods trade responds to changes in tariff and non-tariff barriers. This makes it harder to predict how the UK’s exit from the EU is likely to affect services trade.
The Government’s analysis suggests that non-tariff barriers to services trade would be increased most significantly for wholesale and retail trade. Under a WTO scenario, the Government’s analysis suggests that non-tariff barriers would be equivalent to a 20% tariff on wholesale and retail trade, 13% in an FTA scenario, and 7% if the UK stays in the EEA. Education, health and care services are also predicted by the Government to face relatively high non-tariff barriers (a 17% tariff-rate equivalent) in a WTO scenario. In contrast, business and real estate services would be some of the least affected.25
Using these figures, an analysis by the Institute for Fiscal Studies suggests that service sectors would be less affected than manufacturing overall if the UK falls back on WTO trading rules with the EU after Brexit. However, because certain parts of the service

53HOW WILL THE IMPACT VARY ACROSS THE UK?
sector make up a large share of the UK economy – and in spite of the fact that the service sector as a whole is less reliant on trade with the EU than manufacturing – any increase in non-tariff barriers to services trade could translate into a relatively large impact on overall economic activity. For example, the Institute for Fiscal Studies estimates that under a WTO Brexit scenario, around one quarter of the overall loss of economic output (relative to a remain scenario) could come from lower output from the wholesale and retail services sector (which employs 3.7 million people).
The Chequers deal set out by Theresa May focused on keeping the UK goods market closely aligned with the EU, but made little provision for minimising future barriers to services trade with the EU. Similarly, many existing FTAs go a long way to eliminating barriers to goods trade, but do little to remove barriers to services trade.
How will Brexit affect different regions of the UK?The impact on different sectors of the economy outlined above has implications for how different regions of the UK are likely to be affected, given that certain industries are concentrated in particular parts of the country.
Greater job losses are likely to arise in those regions which have:
• industries significantly impacted by trade barriers – such as the financial services sector, if the UK loses its ‘passporting’ rights
• a high dependence on trade with the EU – whether buying inputs, selling final products or being part of an EU-wide supply chain (as is the case for car manufacturers).*
If regions appear to be highly specialised – that is, with a lot of jobs dependent on making a particular product or service (such as the Midlands’ reliance on car manufacturing) – the effects on an area could be more severe, because workers who lose their jobs may find it harder to find work elsewhere.
However, the studies that have been published so far present apparently contradictory conclusions about which parts of the country will be most affected by Brexit. These conflicting results stem from differences in the way that researchers have tried to approach this question, and serve to highlight some important unknowns about how Brexit could affect different parts of the country.
All of the studies find that the average impact across the country would be larger in the event of a harder Brexit: one in which trade barriers between the UK and EU rise significantly. They also all conclude that there is a considerable degree of regional variation (because some parts of the country are more specialised in sectors that are predicted to be hit hard by Brexit), and that the extent of variation is likely to be larger in the event of a harder Brexit.26
However, there is no clear consensus among existing studies as to which regions of the UK will be more or less affected by Brexit. At least four independent studies have
* More precisely in this report, it is assumed a 5% impact in output leads to a 5% reduction in employment.

54 UNDERSTANDING THE ECONOMIC IMPACT OF BREXIT
attempted to look comprehensively at the likely regional impact of Brexit (Dhingra, Machin and Overman; Chen and others; Levell and Norris Keiller; Cambridge Econometrics), and HMG also considered how the impact could differ across the country.27 The findings are inconclusive, in part because of uncertainty about the size of non-tariff barriers that might arise in certain sectors, and how responsive demand for certain goods and services is to the price charged. The lack of a clear answer also reflects the lack of adequate data to understand exactly how reliant businesses in different parts of the country are on imports from and exports to the EU.
There is particular disagreement about whether London and the South East would be more or less affected than other areas on average. Chen and others, the Institute for Fiscal Studies, Cambridge Econometrics and HMG conclude that London and the South East would be least affected by Brexit, while Dhingra and others conclude that parts of London and the South East would be most affected.28 Comparing the various analyses that have been produced so far, four points emerge.
1. Reliance on trade with the EU varies across the country – not only because of differences in the types of businesses operating in each area, but also because of different trade propensities within a given sector.29 For example, since the EU is clustered round the south and east coasts of the UK, ports in those areas that are focused on serving the EU market could be particularly adversely affected by higher barriers to trade with the EU.30
2. Because the composition of industry varies across the UK, the impact on any particular region will depend to a large degree on which industries experience the greatest increase in tariff and non-tariff barriers. For example, part of the reason that the leaked government analysis predicts that London will be relatively unaffected, is that it predicts a relatively small increase in non-tariff barriers for the financial sector.31 Financial services account for twice as large a share of employment in London as other UK regions, meaning that the outlook for London is particularly sensitive to what happens to barriers to financial services trade.
3. The impact on a particular region also will depend on how responsive demand is to any increase in price: that is, to what degree increases in tariff and non-tariff barriers translate into falls in demand for a business’ product. One of the reasons that Dhingra and others find that part of London and the South East will be relatively heavily affected, is that they estimate that trade in services is much more responsive to price changes than trade in goods – and services make up a large share of the economy in London and the South East.32
4. The eventual impact of Brexit on each area will also depend on how readily each area can adapt – in particular, how easy workers in different parts of the country will find it to get a new job if their employer is badly affected. Cambridge Econometrics argues that London is more resilient than other parts of the country and so better placed to adapt to any adverse shock, as perhaps evidenced by the experience after the financial crisis.33 Meanwhile, the Institute for Fiscal Studies notes that some parts of the country have an unusually large share of low-educated workers employed in highly exposed industries.34 For example, in Northern Ireland and the West Midlands, around one quarter of low-educated men (compared

55HOW WILL THE IMPACT VARY ACROSS THE UK?
to a nationwide average of 19%) work in industries that the Institute for Fiscal Studies defines as ‘highly exposed’ to Brexit (in terms of the likely decline in output from that sector). These workers may find it particularly difficult to find new jobs in their area.
How will Brexit affect people in different income groups?There are two main ways in which individual UK residents might be directly affected by Brexit. The first is through changes in prices for the goods and services that they buy every day. The second is through changes to their wages or employment opportunities.
Distributional impacts of price risesThe vote for Brexit has already reduced UK households’ purchasing power. The depreciation of sterling since the referendum, by raising the price of imported goods, has raised average consumer prices by nearly 2% over the year following the vote.35 Researchers at the CEP estimate that this increase in prices has affected households at all income levels roughly equally.36 But Brexit itself could have a further impact on prices if it leads to an increase in tariffs or non-tariff barriers to trade.
The Resolution Foundation and UK Trade Policy Observatory have estimated that the price of an average family’s weekly shop would rise by 2.7% if the UK were to impose the equivalent of the EU’s MFN tariffs on imports from the EU to the UK (that is, in a WTO scenario). But they conclude that the impact of this rise in goods’ prices would be greater for low-income households than for high-income households, with the poorest tenth of households having their disposable income reduced by 1% compared to 0.8% for high-income households. This is because of differences in the types of goods they each purchase, and differences in the tariffs that apply to different goods. In particular, low-income households spend a greater proportion of their budgets on food and clothing.37
However, analysis produced by CEP suggests that the lower costs for high-income households are eliminated once increases in the costs of both goods and services as a result of higher non-tariff barriers are taken into account. They conclude that households across the income distribution would all lose a similar share of their income (between 3.4% and 4.2% relative to a ‘Remain’ scenario, with the smallest losses for the poorest tenth of households).38
Distributional impacts through wagesA detailed analysis by the Institute for Fiscal Studies suggests that the workers who are most exposed to higher trade barriers as a result of Brexit are disproportionately male, and have lower levels of formal education.39 The single most affected group is predicted to be process, plant and machine operatives, who are typically older men with skills specific to their occupation.
However, firms that trade more intensively tend to pay higher wages – and men earn more on average than women. Consequently, the Institute for Fiscal Studies concludes that workers in the top half of the income distribution are likely to lose more on

56 UNDERSTANDING THE ECONOMIC IMPACT OF BREXIT
average than those in the bottom half.* This means that wages for all workers would be lower than in the absence of Brexit, but wage inequality would be somewhat reduced.
However, while low-wage workers may be less affected proportionately, they start off with lower resources and may have fewer transferable skills than high-wage workers. As the CEP notes, those on higher wages may be able to more easily weather shocks.40
* The analysis by the EFT – which suggests the UK economy would be boosted by the UK adopting UFT after Brexit – provides a symmetric prediction for the distributional impact. The EFT analysis predicts that wages for skilled workers would increase by 11%, while those for unskilled workers would fall by 14%. Source: Sampson T, Dhingra S, Ottaviano G and Van Reenen J, Economists for Brexit: A critique, CEP Brexit Analysis No. 6, May 2016, retrieved 9 October 2018, http://cep.lse.ac.uk/pubs/download/brexit06.pdf
57FROM HERE TO THERE
5. From here to there: the economic implications of adapting to a new relationshipThis report has focused principally on the long-term economic impact of Brexit – with most studies we have described looking 10 to 15 years’ hence. This provides a useful picture of the main ways in which the UK economy is likely to be different in a new equilibrium: outside rather than inside the EU. This is what will be important for future generations. But these long-term projections tell us little about how the UK will adapt to life outside the EU, which are also likely to be important to MPs voting on any Brexit deal.
Some economists have attempted to project how the UK economy will grow in the near term as the UK adjusts to a new relationship with the EU. However, doing so requires taking a view on how this transition takes place and how long it lasts. As a recent report from the Office for Budget Responsibility noted: ‘judgements made on this in existing studies have generally been fairly arbitrary’.1
On the one hand, in some dimensions – and under some scenarios for the deal reached between the UK and EU – the short-term impact of Brexit could be more painful than the long-term projections suggest. On the other hand, there are some reasons to think that the short-term impact could be smaller.
Short-term disruption could be significant…There are three main reasons to think that the short-term costs of adjusting to Brexit could be larger than the long-term costs.
First, the Government will need to set up new systems to operate outside the EU – such as systems for monitoring and processing immigration from the EU, more extensive customs and other checks on imports from and exports to the EU, and setting up new regulatory bodies.2 Businesses will face additional costs to adapt to new rules and regulations. Exactly how large these costs might be will depend on the nature of the deal reached between the UK and EU.
The adjustments required would be larger if the UK and EU were to trade with each other under WTO rules, than if they retained a similar relationship to that at the moment. Some of the potentially extreme costs of failing to put the necessary systems in place have been highlighted by discussions about the possibility of ‘Operation Stack’,3 where the Port of Dover would be effectively blocked, with major implications for businesses with EU supply chains.
Second, the long-term projections effectively assume that certain agreements will be in place to support UK–EU economic engagement, which limit the apparent

58 UNDERSTANDING THE ECONOMIC IMPACT OF BREXIT
costs of Brexit in the long term. This is particularly important in the WTO scenarios. As described previously, many of the WTO scenarios are based on evidence about the economic barriers between the EU and the USA. However, while the USA and EU do not have a FTA, they do have a number of bilateral agreements (such as those governing air travel, data, electricity, financial services and customs), which facilitate trade and investment between the countries. As a result, the WTO scenarios outlined above are likely to underestimate the short-term economic costs of the UK exiting the EU without any sort of deal with the EU. The notices that the EU has issued to stakeholders, which outline what would happen in the event of there being no deal, suggest a much more disruptive economic impact than the long-term WTO scenarios outlined above envisage.4 For example, the EU’s notice on food law details that ‘As of the withdrawal date, the importation of food of animal origin from the United Kingdom into the EU-27 is prohibited, unless certain requirements are met’.5 In other words, first the UK has to be listed by the EU as a suitable exporting country before it can even begin to be permitted to export.
Third, some of the possible long-term gains from Brexit – particularly those arising from the ability to strike new FTAs and from deregulation – may take some time to materialise. On average, recent FTAs have taken four years to be agreed.6 This does not include time for prior consultation, or time to application. It took more than seven years before the recent FTA with Canada was even provisionally applied, and it is yet to be fully applied.7 Even when a deal is fully up and running, it takes time for business to reorient its activity to take advantage of any new trading opportunities.
The most disruptive scenario in the short term would be an abrupt and disorderly exit. The Office for Budget Responsibility has noted that it is ‘next to impossible to calibrate with any confidence the potential impact of this scenario in advance’ but noted the fall in GDP that had occurred in 1974 when energy shortages and miners’ increased militancy led to the introduction of a three-day working week.8
…but some costs associated with divergence could take time to emergeThere are also two main reasons why some of the long-term costs that studies have projected may not materialise immediately.
First, many of the costs predicted in the long run – particularly under the FTA and WTO scenarios – arise from divergence between UK and EU rules and regulations. There could be costs of this from day one: it is more onerous for businesses in non-EU countries to demonstrate that their goods and services meet EU requirements than it is for those based in member states. But as HMG9 sets out, some of the costs of divergence may only materialise gradually over time, as the UK’s regulations and standards actually diverge from those in place in the EU.
Second, economic costs are expected to arise from the unravelling of supply chains between the UK and the EU, as economic divergence makes it costlier for EU businesses to source from the UK and vice versa. It is possible that the UK and the EU would pursue co-ordinated policy responses to limit the impact. However, this cannot be guaranteed, and would come at a price. As the EU’s chief negotiator, Michel Barnier, said last month: “If there is a no deal there is no more discussion.

59FROM HERE TO THERE
There is no more negotiation. It is over and each side will take its own unilateral contingency measures.”10
If the UK and EU reach an amicable agreement and economic divergence happens only slowly – and if the UK government adapts migration rules gradually – it would allow businesses time to reconfigure their supply chains and to change their staffing models. However, if the split is acrimonious, or if either side fails to put in place the systems necessary to screen and process imports and exports leading to trade flows seizing up, supply chains would have to adjust much more quickly.
Moreover, there could be short-term problems if businesses find it difficult to get necessary licences or to re-register their products for sale in the EU, or to prove that existing regulatory oversight and standards accreditation are adequate for the EU’s purposes. Similarly, businesses could struggle to adapt quickly enough if migration rules became much tighter very quickly, reducing access to the current ready supply of workers from across the EU.

60 UNDERSTANDING THE ECONOMIC IMPACT OF BREXIT
6. ConclusionBrexit will lead to a significant change in the UK’s relationship with other European countries. Later this year, MPs are expected to be given the opportunity to cast a meaningful vote on any deal that Theresa May brings back from Brussels.
One – but not the only – important factor that will shape MPs’ and voters’ opinions about the merits of any eventual Brexit deal is the impact it will have on the economy. Therefore, it is very important that politicians and the public understand what is and is not known about how Brexit might affect the UK economy.
As we have summarised in this report, numerous studies have now been published setting out a range of projections for how Brexit is likely to affect UK economic growth in the longer term (typically up to 2030). The vast majority of these studies predict that the UK economy will be smaller following Brexit than it would have been, had the UK remained a member of the EU. This is because most studies predict that Brexit will increase trade barriers between the UK and other countries on average – and there is an extensive body of economic evidence which demonstrates that stronger trade, investment and migratory links in the past between countries have been associated with faster economic growth.
Only one study (that produced by the EFT) predicts that Brexit will provide a significant boost to the UK economy. It forecasts that UK national income could be 4% larger in 15 years’ time, if the UK leaves the EU and unilaterally adopts completely free trade, than if the UK were to remain an EU member. However, its prediction is at odds with those of other studies, which suggest that leaving the EU and adopting a UFT policy would reduce economic growth – or at best, offer a much smaller benefit.
Even among the bulk of studies that predict a negative impact, there is a range of estimates for how large this could be: from a negligible cost to an 18% reduction in output in 2030. The predictions are more pessimistic for scenarios in which significant barriers to trade develop between the UK and EU: for example, if the UK and EU were to trade with each other on WTO terms.
The differences between the studies’ predictions are driven mainly by differences in the assumptions fed into the models, rather than major differences in the structure of the underlying economic models. In particular, assumptions about how large non-tariff barriers might be, how migration policy could be changed, and how foreign investment might be affected, can have a large impact on the predictions obtained.
The largest negative impacts of Brexit are predicted by those studies which allow reductions in trade, investment and migration to have a permanent effect on the UK’s innovative activity, and so permanently reduce productivity growth. Most studies do not factor this in because it is hard empirically to identify the size of the relationship between economic openness and productivity growth. But leaving it out means these studies could understate the long-term costs of leaving the EU. NIESR estimates, for example, that trading with the EU on WTO terms rather than remaining a member

61CONCLUSION
would reduce UK GDP by 2.7% in 2030, if there is no knock-on impact on productivity growth. But it estimates a much larger effect – a 7.8% loss of output – if an effect on productivity is allowed for.
Much has been made of the UK’s ability to offset losses in trade with the EU with new FTAs with other countries. But all the studies that have attempted to quantify the benefits of such deals conclude that they are likely to be relatively modest.
The latest government study – which goes into greatest detail on the subject – estimated that a FTA with the USA would add at most 0.3% to economic output, and that trade deals with Australia, China, India, the Gulf countries and the nations of South-East Asia would add in total a further 0.1% to 0.4% to GDP. This is consistent with most assessments of past FTAs, which find that they have not provided large gains to overall GDP.
One of the other benefits that has been claimed of Brexit is the possibility of changing currently EU-set regulations to suit the UK’s needs better, and reduce costs to businesses. A minority of the studies published so far attempt to quantify the benefit that might be gained from doing this. The estimates range from close to zero (0–0.13% of GDP predicted by Oxford Economics) to a maximum of 1.3% (Open Europe and PwC). But this maximum falls to 0.7% when Open Europe considers the political feasibility of deregulation.
Nevertheless, deregulation might not simply result in a cost-saving. Regulations such as competition policy and state aid rules are designed to help boost overall economic output, and other regulations are in place to help achieve outcomes that voters care about, such as protecting the environment. Allowing UK regulations to diverge from those in place across the EU could lead to an increased cost to trade with the EU. For example, if the UK and EU have different requirements on product standards, businesses could have to produce different products for the UK and EU markets, or face additional paperwork when exporting to the EU to prove that their products do meet all EU requirements. The more dramatic the divergence, the larger those costs are likely to be.
The studies that project the largest gains and losses from Brexit do so because they combine assumptions that are all at the more extreme end of what could happen. At one end of the spectrum, the EFT project that Brexit will boost economic output by 4% in 15 years’ time. This positive outlook results from having made a set of assumptions that are all at the most positive end of – and many others believe, beyond the end of – the scale of what is plausible. They assume that Brexit (coupled with the unilateral adoption of free trade) will eliminate all barriers to trade between the UK and non-EU countries, while doing nothing to increase barriers to trade with the EU. These are very strong assumptions, and all the other studies predict instead that leaving the EU will increase trade barriers with the EU – at least to some extent.
At the other end of the spectrum, Rabobank projects that leaving the EU on WTO terms would reduce economic output by 18% in 2030. This particularly large negative figure arises from the fact that it makes a set of assumptions that are all towards the gloomier

62 UNDERSTANDING THE ECONOMIC IMPACT OF BREXIT
end of what is possible – although none are individually out of line with what other economists believe to be plausible.
Unlike many other studies, Rabobank assumes that under a WTO scenario the UK would lose access to 60% of the EU’s existing FTAs with non-EU countries. This could mean higher barriers to trade with existing trading partners such as South Korea. It also assumes that the UK would not manage to sign any other new FTAs by 2030. Further, it assumes that new non-tariff barriers to trade with the EU would be equivalent to a 9% tariff on all exports; this is towards (although not at) the top end of what is assumed in the other studies. It assumes that the Government would clamp down heavily on migration – resulting in a 44% fall in net migration – and that lower trade and investment would have an adverse knock-on impact on productivity growth.
The sort of macroeconomic models used to project the overall impact of Brexit on the UK economy are not well suited to predicting the impact on individual parts of the country, or sectors of the economy. However, Brexit is likely to result in varying impacts in different sectors, regions and possibly income brackets, depending on exactly what deal is agreed. Most of the studies of the long-term impact of Brexit do not look at these distributional consequences. However, some other pieces of work have tried to use the insights from the macroeconomic models to predict what could happen for different industries, regions and people with higher and lower incomes.
These analyses suggest that most groups would be impacted in the same direction as the overall effect: that is, if the overall effect is positive, most groups are predicted to be positively affected, and vice versa. However, the size of the impact varies, and there are some industries that would be likely to buck the trend.
Looking at the impact across different income groups, economists have concluded that the impact is likely to be quite even. Looking across different types of businesses, the main exceptions to the general pattern are the agricultural sector and the fishing and food processing industries. The EU imposes relatively high tariffs on imports of food products, and so trading with the EU on WTO terms could have a significant positive impact on domestic demand for UK-produced food, helping British farmers and food producers, even while it might harm overall economic growth and reduce household living standards on average. Conversely, even though the EFT predict that UFT would be good for the UK economy as a whole, they also predict that the abolition of tariffs on all food imports would essentially wipe out the UK’s agricultural sector.
The fishing industry (which makes up a very small share of the UK economy) also could benefit from Brexit, even if other sectors do not, if the UK government is able to negotiate higher fishing quotas for UK fisherman. But other businesses, particularly high-tech ones such as aerospace, are predicted to be hit hardest, as their competitiveness in foreign markets declines.
Various studies that have tried to look at regional differences in the possible economic impact of Brexit reach conflicting conclusions, and provide no clear evidence that Brexit is likely to either reduce or increase existing regional disparities. There are three factors that ultimately will be particularly important in determining how different parts of the country are affected.

63CONCLUSION
First, how much businesses in each region rely on imports from and exports to the EU. Second, the types of businesses that operate in different parts of the country, and how any deal struck with the EU affects particular sectors. Third, how readily each area can adapt to any Brexit shock, including whether workers displaced from one industry find it easy or hard to find new jobs somewhere else. The latter could be made easier by appropriate changes to government policy – for example, to help workers retrain.
The studies of the economic impact of Brexit that we focus on in this report attempt to predict how much larger or smaller the UK economy will be in 2030 – that is, once the UK and the EU have adjusted to a new relationship with one another. But MPs and the general public are also likely to care about what will happen in the shorter term. Over the next few years, the economic impact could be significantly more disruptive than the long-term projections suggest or less so, depending on how the negotiations play out.
If the UK and the EU reach an amicable agreement and make good progress in putting in place the new systems needed to facilitate a new trading relationship, the short-term impact could be much smaller than the long-term effects predicted. For example, it could take some time for any differences in UK and EU regulations to materialise, and so some time for any costs to become apparent.
However, if talks break down without agreement, the short-term economic impact could be much more severe than the predictions for a long-term WTO-based relationship suggest. These WTO scenarios are largely based on looking at current patterns of trade between the USA and the EU. In the absence of an overarching FTA, these are backed up by a series of side deals – covering everything from aviation to data – and reflect the activity of businesses which are familiar with the administrative hoops that they have to jump through to trade across the Atlantic. Without such side deals – which themselves would take time to negotiate – the immediate economic disruption could be more severe.
MPs will soon face a crucial vote on the withdrawal agreement that the Prime Minister brings back from Brussels. One factor that is likely to shape their views is the possible economic impact of what is proposed.
To ensure that MPs are properly informed, we have made nine recommendations (outlined at the start of this report) for what the Government needs to do and to make clear when it publishes its final analysis of this question. With this information, MPs should be well placed to interpret the information provided to them, and to decide how to cast their vote.

64 UNDERSTANDING THE ECONOMIC IMPACT OF BREXIT
Appendix: Overview of existing studies of the economic impact of BrexitTable 4. Uncertainty around the central projections for the economic impact of BrexitStudy Long-term* impact on GDP (% difference relative to remaining in the
EU), under different future trading scenarios
EEA FTA WTO UFT
Rabobank -10 (-8.4 to -11)
-12.5 (-11.3 to -13.7)
-18 (-18 to -18.5)
–
CEP dynamic (-6.3 to -9.5) – – –
CPB dynamic – -5.9 -8.7 –
Treasury -3.8 (-3.4 to -4.3)
-6.2 (-4.6 to -7.8)
-7.5 (-5.4 to -9.5)
–
HMG -1.6 (-0.6 to -2.6)
-4.8 (-3.1 to -6.6)
-7.7 (-5.0 to -10.3)
–
CPB static** – -3.4 -4.1 –
RAND -1.7 -1.9 -4.9 –
NIESR -1.8 (-1.5 to -2.1)
-2.1 (-1.9 to -2.3)
-3.2 (-2.7 to -3.7)
–
Oxford Economics - (-0.8 to -2.3) (-1.5 to -3.9) -
PwC – -1.2 -3.5 –
CEP static** -1.3 – -2.7 -2.3
Ciuriak -1.0 – -2.8 –
Bertelsmann -0.6 – (-1.6 to -3.0) –
Open Europe – -0.8 -2.2 +1.6
EFT +4***
Notes: Where both are available, the table shows the central estimate first and then the range within which the GDP impact is predicted to lie is given in brackets afterwards. Some studies only provide one or other of these pieces of information. The OECD present only one scenario, in which the UK initially trades with the EU on WTO terms and then signs an FTA; under this scenario, they predict the long-term impact on GDP would be between 2.7% and 7.7%.
* Most of the studies project the impact on economic output in 2030. The three exceptions are EFT, HMG and Treasury, which project forward 15 years (implying an end date of 2032, 2032 and 2031, respectively).
** CEP and CPB show the sensitivity of their results to various alternative assumptions. However, neither provides a forecast range in the same format as some of the other studies.
*** This figure relates only to the gains from free trade. EFT modelling suggests there could be additional gains of 2.8% of GDP from deregulation, changes to immigration and lower budget contributions to the EU. Economists for Free Trade, ‘Brexit could boost UK economy by £135bn, say top economists’, 15 August 2017, accessed on 11 October 2018, www.economistsforfreetrade.com/News/brexit-could-boost-uk-economy-by-135-billion-say-top-economists/

65APPENDIX: OVERVIEW OF EXISTING STUDIES OF THE ECONOMIC IMPACT OF BREXIT
Table 5: Assumptions about changes to foreign direct investment (FDI) post-BrexitStudy Scenario Inward FDI flows Impact on GDP
CEP (‘dynamic’) Swiss, FTA -22% 3.4%*
NIESR EEA Swiss WTO
-8 to -11.3% -11.3 to -22.9% -20.4 to -26.9%
-0.2% -0.5%
OECD FTA -10% to -45% –
Open Europe/Ciuriak WTO – -0.002%
Oxford Economics CU** WTO***
– -0.01%**** -0.32%
Rabobank EEA FTA WTO
-12% -20% -28%
–
RAND EEA, Swiss, CU FTA WTO US FTA
0% -9% -20.6%***** 12.2%
-3.3%*
HMT EEA FTA WTO
-10% -15% to -20% -18% to -26%
–
Note: Six of the studies we examine do not set out explicit assumptions about exactly what is expected to happen to FDI after Brexit. These are: Bertelsmann, CEP’s static model, CPB, EFT, HMG and PwC.
CU = Customs Union
* CEP and RAND estimate a larger impact of FDI on GDP because they allow for reductions in FDI to reduce productivity growth.
** The scenario assumes liberal migration regime and ‘pro-business’ reforms of tax cuts and deregulation.
*** This assumes a restrictive migration policy and no deregulatory agenda.
**** FDI impact on GDP through productivity.
***** The absolute and percentage loss of FDI is only given for the FTA scenario. Therefore percentage loss of FDI inflows is calculated as the ratio of absolute loss of FDI of US$3.4bn in the FTA scenario to US$7.8bn in the WTO scenario.

66 UNDERSTANDING THE ECONOMIC IMPACT OF BREXIT
Table 6: Assumptions about changes to migration post-Brexit*Study Scenario What assumptions are made about
migration?Net migration
Impact on UK GDP
HMG EEA Status quo Status quo 0%
FTA £25,000 salary threshold -40,000 -0.5%
WTO A skill level threshold, a £30,000 salary threshold and a job offer requirement
-90,000 -1.2%
PwC FTA Restriction on low-skilled migration relative to 2013 projections. High-skilled stays
-0.70% -1.0%
WTO Both high-skilled and low-skilled migration are reduced relative to 2013 projections
-1.4% -1.6%
Rabobank EEA Free movement continues Status quo 0%
FTA Only migrants with a job offer or who want to study can enter 8% who are planning to leave based on KPMG survey do so**
-174,000 –
WTO Only migrants with job guarantees are allowed as well as 50% of all migrants who apply to study 28% of current EU migrants leave based on KPMG survey results
-555,000 –
OECD FTA (with WTO transition)
Net inward migration declines 75% of this is reflected in the labour force which contributes to lowering output
-116,000 to -50,000
–
Oxford Economics
FTA + WTO Models different policy choices for scenarios -0.2% -1.1%
Note: Nine of the studies we examine either don’t include or do not set out explicit assumptions about exactly what is expected to happen to migration after Brexit. These are: Bertelsmann, CEP, Ciuriak, CPB, EFT, NIESR, PwC, RAND and Treasury.
* HMG and Oxford Economics assume an impact on productivity which are included in the estimated impact of migration on GDP.
** Briggs K, Birly, P, Coles A, Essex M, Falvey M, Paul M, and Payne P, The Brexit effect on EU nationals: A survey on what European workers will do now, KPMG, August 2017, retrieved 11 October 2018, https://assets.kpmg.com/content/dam/kpmg/uk/pdf/2017/08/the-brexit-effect-on-eu-nationals.pdf
67REFERENCES
References1. Introduction
1 Department for Exiting the European Union, Legislating for the Withdrawal Agreement between the United Kingdom and the European Union, Cm 9674, July 2018, retrieved 2 October 2018, https://assets.publishing.service.gov.uk/government/uploads/system/uploads/attachment_data/file/728757/6.4737_Cm9674_Legislating_for_the_withdrawl_agreement_FINAL_230718_v3a_WEB_PM.pdf
2 Watts J, ‘Brexit: Theresa May promises to publish full impact assessment for deal she agrees with EU’, Independent, 31 January 2018, retrieved 10 October 2018, www.independent.co.uk/news/uk/politics/brexit-latest-theresa-may-impact-assessment-leaked-a8186401.html
3 ‘Oral answers to questions’, Hansard, 1 February 2018, vol. 635, retrieved 2 October 2018, https://hansard.parliament.uk/Commons/2018-02-01/debates/7A6FD82E-03C2-406C-9816-13FD2EE4AA0B/OralAnswersToQuestions
4 HM Treasury and Osborne G, The Immediate Economic Impact of Leaving the EU, Cm 9292, 23 May 2016, retrieved 2 October 2018, www.gov.uk/government/publications/hm-treasury-analysis-the-immediate-economic-impact-of-leaving-the-eu
5 Giles C, Tetlow G and Parker G, ‘Brexit carries risk of recession, warns Bank of England’, Financial Times, 12 May 2016, retrieved 2 October 2018, www.ft.com/content/54c975cc-1831-11e6-b197-a4af20d5575e
6 Asthana A, Mason R and Inman P, ‘George Osborne: Vote for Brexit and face £30bn of taxes and spending cuts’ The Guardian, 15 June 2016, retrieved 2 October 2018, www.theguardian.com/politics/2016/jun/14/osborne-predicts-30bn-hole-in-public-finance-if-uk-votes-to-leave-eu
7 Bloom N, Bunn P, Mizen P, Smietanka P, Thwaites G and Young G, Tracking the Views of British Businesses: Evidence from the Decision Maker Panel, Bank of England, Quarterly Bulletin 2017 Q2 article, 16 June 2017, retrieved 2 October 2018, www.bankofengland.co.uk/quarterly-bulletin/2017/q2/tracking-the-views-of-british-businesses-evidence-from-the-dmp
8 Office for Budget Responsibility, Economic and Fiscal Outlook: November 2016, Cm 9346, 23 November 2016, Table 1.3, retrieved 9 October 2018, http://obr.uk/efo/economic-and-fiscal-outlook-november-2016/
9 Giles C, ‘What are the economic effects of Brexit so far?’, Financial Times, 24 June 2018, retrieved 2 October 2018, www.ft.com/content/dfafc806-762d-11e8-a8c4-408cfba4327c
10 Springford J, ‘The cost of Brexit to June 2018’, Centre for European Reform, 30 September 2018, retrieved 9 October 2018, https://cer.eu/insights/cost-brexit-june-2018
11 Born B, Müller G, Schularick M and Sedláček P, ‘£350 million a week: The output cost of the Brexit vote’, Vox EU, 30 September 2018, retrieved 9 October 2018, https://voxeu.org/article/300-million-week-output-cost-brexit-vote.
12 Giles C, ‘The UK economy since the Brexit vote – in 5 charts’, Financial Times, 31 July 2018, retrieved 2 October 2018, www.ft.com/content/cf51e840-7147-11e7-93ff-99f383b09ff9
13 Douch M and others, ‘Estimating the trade effects of the Brexit announcement shock’, UK in a Changing Europe, 28 September 2018, retrieved 2 October 2018, http://ukandeu.ac.uk/estimating-the-trade-effects-of-the-brexit-announcement-shock/
14 Crowley M, Exton O and Han L,‘Renegotation of trade agreements and firm exporting decisions: Evidence from the impact of Brexit on UK exports’, UK in a Changing Europe, 18 July 2018, retrieved 2 October 2018, http://ukandeu.ac.uk/research-papers/renegotation-of-trade-agreements-and-firm-exporting-decision-evidence-from-the-impact-of-brexit-on-uk-exports/
2. How Brexit might affect the UK economy
1 IMF World Economic Outlook Database, April 2018, retrieved 11 October 2018, https://www.imf.org/external/pubs/ft/weo/2018/01/weodata/index.aspx
2 Boffey D, ‘Netherlands and UK are biggest channels for corporate tax avoidance’, 25 July 2017, retrieved 9 October 2018, www.theguardian.com/world/2017/jul/25/netherlands-and-uk-are-biggest-channels-for-corporate-tax-avoidance.
3 Migration Advisory Committee, EEA Migration in the UK: Final report, September 2018, p. 2, retrieved 9 October 2018, https://assets.publishing.service.gov.uk/government/uploads/system/uploads/attachment_data/file/741926/Final_EEA_report.PDF

68 UNDERSTANDING THE ECONOMIC IMPACT OF BREXIT
4 Portes J, ‘New evidence on the economics of immigration to the UK’, Vox EU, 4 October 2018, retrieved 9 October 2018, https://voxeu.org/article/new-evidence-economics-immigration-uk
5 Portes J, ‘The economic impacts of immigration to the UK’, Vox CEPR Policy Portal, 6 April 2018, retrieved on 14 October 2018, https://voxeu.org/article/economic-impacts-immigration-uk
6 Migration Advisory Committee, EEA Migration in the UK: Final report, September 2018, p. 59, para 2.39, retrieved 9 October 2018, https://assets.publishing.service.gov.uk/government/uploads/system/uploads/attachment_data/file/741926/Final_EEA_report.PDF
7 Singham S and Tylecote R, Plan A+: Creating a prosperous post-Brexit UK, Institute of Economic Affairs, November 2018, retrieved 10 October 2018, https://iea.org.uk/wp-content/uploads/2018/09/PLAN-A-FINAL.pdf
8 Vickers J, ‘Consequences of Brexit for competition law and policy’, Oxford Review of Economic Policy, vol. 33, no. S1, pp. S70–8, retrieved 9 October 2018, https://academic.oup.com/oxrep/article/33/suppl_1/S70/3066075
9 OECD, ‘Employment protection legislation’, 2018, retrieved 11 October 2018, www.oecd.org/els/emp/oecdindicatorsofemploymentprotection.htm; OECD, ‘Indicators of product market regulation’, 2018, retrieved 11 October 2018, www.oecd.org/eco/growth/indicatorsofproductmarketregulationhomepage.htm
10 Council of the European Union, Draft Negotiating Guidelines, 7 March 2018, p. 5, para. 9, retrieved 9 October 2018, https://g8fip1kplyr33r3krz5b97d1-wpengine.netdna-ssl.com/wp-content/uploads/2018/03/European-council-Art.50-23-March-2018-Draft-Guidelines-1.pdf
11 HM Government, The Future Relationship between the United Kingdom and the European Union, Cm 9593, July 2018, retrieved 9 October 2018, https://assets.publishing.service.gov.uk/government/uploads/system/uploads/attachment_data/file/725288/The_future_relationship_between_the_United_Kingdom_and_the_European_Union.pdf
12 Davis D, ‘David Davis’ foundations of the future economic partnership speech’, Department for Exiting the EU, 20 February 2018, retrieved 9 October 2018, www.gov.uk/government/news/david-davis-foundations-of-the-future-economic-partnership-speech
13 Financial Times, ‘UK productivity series’, 2018, retrieved 9 October 2018, www.ft.com/content/b9fd12e6-9edf-11e8-85da-eeb7a9ce36e4
14 Ebell M and Warren J, ‘The long-term economic impact of leaving the EU’, National Institute of Economic and Social Research, 25 May 2016, p. 122, retrieved 9 October 2018, www.niesr.ac.uk/sites/default/files/publications/National%20Institute%20Economic%20Review-2016-Ebell-121-38.pdf
15 See also Busch B and Matthes J, Brexit – the economic impact: A meta-analysis, IW-Report No. 10/2016, Institut der deutschen Wirtschaft Köln, October 2016, pp. 60–1, retrieved 9 October 2018, https://econpapers.repec.org/paper/zbwiwkrep/102016.htm
16 Eaton J and Kortum S, ‘Technology, geography, and trade’, Econometrica, 2004, vol. 70, No. 5, pp. 1741–79, retrieved 9 October 2018, https://onlinelibrary.wiley.com/doi/abs/10.1111/1468-0262.00352
17 Breinlich H, Leromain E, Novy D and Sampton T, ‘The consequences of the Brexit vote for UK inflation and living standards: First evidence’, Vox EU, 20 November 2017, retrieved 9 October 2018, https://voxeu.org/article/consequences-brexit-uk-inflation-and-living-standards-first-evidence
18 Cambell P, ‘UK car industry fears effects of Brexit tariffs on supply chain’, Financial Times, 16 October 2016, retrieved 9 October 2018, www.ft.com/content/c397f174-9205-11e6-a72e-b428cb934b78
19 Kentish B, ‘Jeremy Corbyn to highlight the economic “benefit” of Brexit as he demands UK stop relying on cheap labour from abroad’, Independent, 24 July 2018, retrieved 9 October 2018, www.independent.co.uk/news/uk/politics/url-jeremy-corbyn-brexit-economic-labour-party-cheap-labour-migrants-eu-a8460696.html
20 Giles C, ‘A weaker British pound makes no economic sense’, Financial Times, 13 September 2018, retrieved 9 October 2018, www.ft.com/content/0e60de82-b694-11e8-b3ef-799c8613f4a1
21 Bickerton C, Brexit and the British Growth Model, Policy Exchange, 23 July 2018, retrieved 9 October 2018, https://policyexchange.org.uk/pxevents/brexit-and-britains-failed-growth-model/
22 McDonnell J, ‘John McDonnell’s full speech to Labour Conference 2018’, Labour Party, 24 September 2018, retrieved 9 October 2018, https://labour.org.uk/press/john-mcdonnells-full-speech-labour-conference-2018/
3. How large is the impact likely to be?
1 House of Commons Exiting the European Union Committee, EU Exit Analysis: Cross Whitehall briefing, January 2018, slide 2, retrieved 9 October 2018, www.parliament.uk/documents/commons-committees/Exiting-the-European-Union/17-19/Cross-Whitehall-briefing/EU-Exit-Analysis-Cross-Whitehall-Briefing.pdf

69REFERENCES
2 HM Government, The Future Relationship between the United Kingdom and the European Union, Cm 9593, 17 July 2018, retrieved 3 October 2018, https://assets.publishing.service.gov.uk/government/uploads/system/uploads/attachment_data/file/725288/The_future_relationship_between_the_United_Kingdom_and_the_European_Union.pdf
3 Stewart H, Crerar P and Sabbagh D, ‘May’s plan “sticks in the throat”, says Boris Johnson as he resigns over Brexit’, The Guardian, 9 July 2018, retrieved 9 October 2018, www.theguardian.com/politics/2018/jul/09/boris-johnson-resigns-as-foreign-secretary-brexit.
4 Cooper C, ‘British MP: Michel Barnier said Chequers proposal is “dead”’, Politico, 5 September 2018, retrieved 9 October 2018, www.politico.eu/article/brexit-deal-british-mp-stephen-kinnock-michel-barnier-said-chequers-proposal-is-dead.
5 Tetlow G, ‘The short-term economic impact of a no deal Brexit matters too’, Institute for Government, 18 September 2018, retrieved 9 October 2018, www.instituteforgovernment.org.uk/blog/short-term-economic-impact-no-deal-brexit-matters-too
6 Bickerton C, Brexit and the British Growth Model, Policy Exchange, 23 July 2018, retrieved 9 October 2018, https://policyexchange.org.uk/pxevents/brexit-and-britains-failed-growth-model/
7 HM Treasury, HM Treasury Analysis: The long-term economic impact of EU membership and the alternatives, Cm 9250, April 2016, https://assets.publishing.service.gov.uk/government/uploads/system/uploads/attachment_data/file/517415/treasury_analysis_economic_impact_of_eu_membership_web.pdf
8 House of Commons Exiting the EU Committee, EU Exit Analysis Cross Whitehall Briefing: Preliminary Results, January 2018, slide 2, retrieved 9 October 2018, www.parliament.uk/documents/commons-committees/Exiting-the-European-Union/17-19/Cross-Whitehall-briefing/EU-Exit-Analysis-Cross-Whitehall-Briefing.pdf
9 Bertelsmann Stiftung, Costs and Benefits of a United Kingdom Exit from the European Union, GED Study, 2015, www.bertelsmann-stiftung.de/fileadmin/files/BSt/Publikationen/GrauePublikationen/NW_BREXIT_EN.pdf
10 Rojas-Romagosa H, Trade Effects of Brexit for the Netherlands, CPB Background Document, CPB Netherlands Bureau for Economic Policy Analysis, June 2016 retrieved 10 October 2018, www.cpb.nl/sites/default/files/omnidownload/CPB-Backgroud-Document-June-2016-Trade-effects-of-brexit-for-the-netherlands.pdf
11 Ebell M and Warren J, ‘The Long-Term Economic Impact of Leaving the EU’, National Institute Economic Review, No.236, May 2016.
12 Kierzenkowski R, Pain N, Rusticelli E and Zwart S, ‘The economics consequences of Brexit: A taxing decision’, OECD Economic Policy Paper, April 2016, www.oecd-ilibrary.org/docserver/5jm0lsvdkf6k-en.pdf?expires=1539157843&id=id&accname=guest&checksum=4D5FC3D21CCEB07B9BE147089C4E6601
13 Oxford Economics, Executive Summary: Assessing the Economic Implications of Brexit, 2016, retrieved 11 October 2018, www.oxfordeconomics.com/brexit
14 Booth S, Howarth C, Persson M, Ruparel R and Swidlicki P, What if…? The consequences, challenges and opportunities facing Britain outside the EU, Open Europe, 2015, retrieved 9 October 2018, http://2ihmoy1d3v7630ar9h2rsglp-wpengine.netdna-ssl.com/wp-content/uploads/2015/03/150507-Open-Europe-What-If-Report-Final-Digital-Copy.pdf
15 Gillham, J, Sentance A, Teow J, Lambe C, Lancefield D, Hawksworth, J and others, Leaving the EU: Implications for the UK economy, PwC, March 2016, www.pwc.co.uk/economic-services/assets/leaving-the-eu-implications-for-the-uk-economy.pdf
16 Dhingra S, Huang, H, Ottaviano G, Pessoa J, Sampson T and Van Reenen J, The Costs and Benefits of Leaving the EU: Trade Effects, Centre for Economic Performance, Discussion Paper No. 1478, April 2017, p. 28, retrieved 9 October 2018, http://cep.lse.ac.uk/pubs/download/dp1478.pdf; Dhingra S, Ottaviano G, Sampson T and Van Reenen J, The impact of Brexit on Foreign Investment in the UK, Centre for Economic Performance Paper No. 03, April 2016, retrieved 10 October 2018, http://cep.lse.ac.uk/pubs/download/brexit03.pdf
17 Ciuriak D, Xiao J, Ciuriak N, Dadkhah D, Lysenko D and Badri Narayanan G, The Trade-related Impact of a UK Exit from the EU Single Market, 2015, retrieved 10 October 2018, https://papers.ssrn.com/sol3/papers.cfm?abstract_id=2620718
18 Bootle R, Jessop J, Lyons G and Minford P, Alternative Brexit Economic Analysis, February 2018, www.economistsforfreetrade.com/wp-content/uploads/2018/03/Alternative-Brexit-Economic-Analysis-Final-2-Mar-18.pdf; Economists for Brexit, ‘The Economy after Brexit’, 2016, retrieved on 11 October 2018, https://issuu.com/efbkl/docs/economists_for_brexit_v2; Economists for Free Trade, ‘Brexit could boost UK economy by £135bn, say top economists’, 15 August 2017, retrieved on 11 October 2018, www.economistsforfreetrade.com/News/brexit-could-boost-uk-economy-by-135-billion-say-top-economists/; Economists for Free Trade, ‘From Project Fear to Project Prosperity’, September 2017, retrieved on 11 October 2018, www.economistsforfreetrade.com/wp-content/uploads/2017/12/From-Project-Fear-to-Project-Prosperity-Full-Report-1.pdf. Minford P, Gupta S, Phuong Mai Le V, Mahambare V and Xu Y, Should Britain Leave the EU? An Economic Analysis of a Troubled Relationship, Second Edition, 2015, Edward Elgar.

70 UNDERSTANDING THE ECONOMIC IMPACT OF BREXIT
19 Rabobank, ‘Assessing the economic impact of Brexit: Background report’, 12 October 2017, retrieved 10 October 2018, https://economics.rabobank.com/publications/2017/october/assessing-economic-impact-brexit-background-report/
20 Ries C, Hafner M, Smith T, Burwell F, Egel D, Han E and others, ‘After Brexit: Alternative forms of Brexit and their implications for the United Kingdom, the European Union and the United States’, RAND Corporation, 2017, retrieved 10 October 2018, www.rand.org/pubs/research_reports/RR2200.html
21 House of Commons Exiting the EU Committee, EU Exit Analysis Cross Whitehall briefing, January 2018, slide 2, retrieved 9 October 2018, www.parliament.uk/documents/commons-committees/Exiting-the-European-Union/17-19/Cross-Whitehall-briefing/EU-Exit-Analysis-Cross-Whitehall-Briefing.pdf
22 Cribb J and Johnson P, ‘10 years on – have we recovered from the financial crisis?’, Institute for Fiscal Studies, 12 September 2018, retrieved 11 October 2018, www.ifs.org.uk/publications/13302
23 Cribb J, Hood A, and Joyce R, The Economic Circumstances of Different Generations: The Latest Picture Institute for Fiscal Studies, IFS Briefing Note BN187, 2016, retrieved 11 October 2018, https://www.ifs.org.uk/uploads/publications/bns/bn187.pdf
24 Office for Budget Responsibility, Fiscal Risks Report, July 2017, retrieved 11 October 2018, https://obr.uk/download/fiscal-risks-report-july-2017/
25 Costinot A and Rodriguez-Clare A, ‘Trade Theory with Numbers: Quantifying the Consequences of Globalization’, Handbook of International Economics, 2014, Elsevier, pp. 197–261
26 Minford P, ‘The latest state of modelling Brexit’, Written Evidence to DIT Select Committee, April 2018, p. 2, retrieved 9 October 2018, www.economistsforfreetrade.com/wp-content/uploads/2018/05/Minford-and-Blake-written-evidence-to-DIT-Select-Cttee-April-2018.pdf
27 Ibid.
28 Eaton J and Kortum S, ‘Technology, Geography, and Trade’, Econometrica, September 2002, vol.70, no.5, retrieved on 11 October 2018, www.princeton.edu/~erossi/courses_files/EKn.pdf; Anderson J E and van Wincoop E, ‘Gravity with Gravitas: A Solution to the Border Puzzle’, American Economic Review, vol.93, no.1, pp. 170–92, retrieved on 11 October 2018, http://web.econ.ku.dk/nguyen/teaching/anderson%20van%20wincoop%202003%20gravitas.pdf
29 Minford, P., ‘The latest state of modelling Brexit’, Written Evidence to DIT Select Committee, April 2018, retrieved 9 October 2018, www.economistsforfreetrade.com/wp-content/uploads/2018/05/Minford-and-Blake-written-evidence-to-DIT-Select-Cttee-April-2018.pdf
30 Egger P, Francois J, Manchin M and Nelson D, ‘Non-tariff barriers, integration and the transatlantic economy’, Economic Policy, 2015, vol. 30, no. 83, pp. 539–84, retrieved 9 October 2018, https://doi.org/10.1093/epolic/eiv008
31 Levell P, The Customs Union, Tariff Reductions and Consumer Prices, Institute for Fiscal Studies, IFS Briefing Note BN 225, March 2018, retrieved 11 October 2018, www.ifs.org.uk/uploads/publications/bns/BN225.pdf
32 Berlingieri G, Breinlich H and Dhingra S, ‘The Impact of Trade Agreements on Consumer Welfare—Evidence from the EU Common External Trade Policy’, Journal of the European Economic Association, 26 February 2018, retrieved 4 October 2018, https://academic.oup.com/jeea/advance-article-abstract/doi/10.1093/jeea/jvx053/4909736
33 Rhodes C, Manufacturing: Statistics and policy, House of Commons Library, Briefing Paper Number 01942, 2 January 2018, retrieved 9 October 2018, http://researchbriefings.files.parliament.uk/documents/SN01942/SN01942.pdf
34 Office for National Statistics, ‘Who does the UK trade with?’, 3 January 2018, retrieved 9 October 2018, www.ons.gov.uk/businessindustryandtrade/internationaltrade/articles/whodoestheuktradewith/2017-02-21
35 Ibid.
36 Fullfact, ‘Does most UK trade happen outside of the EU and trade agreements?’, 13 July 2018, retrieved 9 October 2018, https://fullfact.org/europe/does-most-uk-trade-happen-outside-eu-and-trade-agreements/
37 Ciuriak D, Xiao J, Ciuriak N, Dadkhah D, Lysenko D and Badri Narayanan G, The Trade-related Impact of a UK Exit from the EU Single Market, 2015, retrieved 10 October 2018, https://papers.ssrn.com/sol3/papers.cfm?abstract_id=2620718
38 See for example, Novy D, ‘Gravity redux: Measuring international trade costs with panel data’, Economic Inquiry 2014, vol. 51, no. 1, pp. 101–21, retrieved 9 October 2018, http://eprints.lse.ac.uk/59308/1/__lse.ac.uk_storage_LIBRARY_Secondary_libfile_shared_repository_Content_Novy,%20D_Gravity%20redux_Novy_Gravity%20redux_2014.pdf; Looi Kee H, Nicita A and Ollereaga M, ‘Estimating trade restrictiveness indices’, Economic Journal, 2009, vol. 119, pp. 172–99, retrieved 9 October 2018, https://openknowledge.worldbank.org/handle/10986/5903

71REFERENCES
39 See Nicita A, Briz S, Fugazza M, Shirotori M, Ognivtsev V, Penello Rial D and others, Non-Tariff Measures to Trade: Economic and policy issues for developing countries, United Nations Conference on Trade and Development, UNCTAD/DITC/TAB/2012/1, 2013, retrieved 9 October 2018 https://unctad.org/en/PublicationsLibrary/ditctab20121_en.pdf
40 Berden K, Francois J, Thelle M, Wymenga P and Tamminen S, Non-Tariff Measures in EU-US Trade and Investment – An Economic Analysis ECORYS OJ 2007/S 180-219493, December 2009, retrieved 11 October 2018, http://trade.ec.europa.eu/doclib/docs/2009/december/tradoc_145613.pdf
41 HM Government, HM Treasury Analysis: The long-term economic impact of EU membership and the alternatives, Cm 9250, 18 April 2016, p. 35, retrieved 9 October 2018, https://assets.publishing.service.gov.uk/government/uploads/system/uploads/attachment_data/file/517415/treasury_analysis_economic_impact_of_eu_membership_web.pdf
42 Head K and Mayer T, ‘Gravity equations: Workhorse, toolkit and cookbook’, CEPII Working Paper No. 2013-27, 27 September 2013, www.cepii.fr/pdf_pub/wp/2013/wp2013-27.pdf
43 Gillham, J, Sentance A, Teow J, Lambe C, Lancefield D, Hawksworth, J and others, Leaving the EU: Implications for the UK economy, PwC, March 2016, www.pwc.co.uk/economic-services/assets/leaving-the-eu-implications-for-the-uk-economy.pdf.
44 Gillham, J, Sentance A, Teow J, Lambe C, Lancefield D, Hawksworth, J and others, Leaving the EU: Implications for the UK economy, PwC, March 2016, www.pwc.co.uk/economic-services/assets/leaving-the-eu-implications-for-the-uk-economy.pdf.
45 Egger P, Francois J, Manchin M and Nelson D, ‘Non-tariff barriers, integration and the transatlantic economy’, Economic Policy, 2015, vol. 30, no. 83, pp. 539–84, retrieved 9 October 2018, https://doi.org/10.1093/epolic/eiv008
46 Berden K and Francois J, Quantifying Non-tariff Measures for TTIP, Centre for European Policy Studies Special Report No. 116, July 2015, p. 10, retrieved 9 October 2018, www.ceps.eu/system/files/SR116%20Berden%20and%20Francois%20NTMs.pdf
47 See ibid. for a discussion of the strengths and weaknesses of these two alternative top-down approaches.
48 Bradford S, ‘Paying the price: final goods protection in OECD countries’, Review of Economics and Statistics 85(1), 24-37, February 2003, retrieved 11 October 2018, www.mitpressjournals.org/doi/10.1162/003465303762687686
49 Minford P, Gupta S, Phuong Mai Le V, Mahambare V and Xu Y, Should Britain Leave the EU? An Economic Analysis of a Troubled Relationship, Second Edition, 2015, Edward Elgar, p. 70
50 Ciuriak D, Xiao J, Ciuriak N, Dadkha A, Lysenko D and Badri Narayanan G, ‘The Trade-related impact of a UK exit from the EU Single Market’, Ciuriak Consulting, 21 June 2015, p. 34, retrieved 9 October 2018, https://papers.ssrn.com/sol3/papers.cfm?abstract_id=2620718
51 House of Commons Exiting the EU Committee, EU Exit Analysis: Cross Whitehall briefing, January 2018, slide 7, retrieved 9 October 2018, www.parliament.uk/documents/commons-committees/Exiting-the-European-Union/17-19/Cross-Whitehall-briefing/EU-Exit-Analysis-Cross-Whitehall-Briefing.pdf
52 Ebell M, ‘Assessing the impact of trade agreements on trade’, National Institute Economic Review, no. 238, November 2016, retrieved 9 October 2018, www.scotecon.org/pdf/2017/2017_84_Ebell.pdf
53 Minford P, ‘Why a WTO-based exit from the EU is best for the UK’, Brexit Central, 16 June 2018, retrieved 9 October 2018, https://brexitcentral.com/wto-based-exit-eu-best-uk/
54 Lydgate E, Holmes P and Gasiorek M,‘“Mamma Mia – here we go again”: Equivalence for goods regulation in the Chequers proposal’, UK Trade Policy Observatory, 3 August 2018, retrieved 9 October 2018,https://blogs.sussex.ac.uk/uktpo/2018/08/03/mamma-mia-here-we-go-again-equivalence-for-goods-regulation-in-the-chequers-proposal/
55 For further discussion of how far the UK could utilise WTO rules to gain access to the Single Market see Lydgate E and Winters A, ‘Deep and not comprehensive? What the WTO rules permit for a UK–EU FTA’, World Trade Review, 28 May 2018, retrieved 9 October, https://doi.org/10.1017/S1474745618000186
56 European Commission, ‘Brexit preparedness notices’, retrieved 9 October 2018, https://ec.europa.eu/info/brexit/brexit-preparedness_en
57 Lydgate E and Winters A, ‘Deep and not comprehensive? What the WTO rules permit for a UK–EU FTA’, World Trade Review, 28 May 2018, p. 18, retrieved 9 October, https://doi.org/10.1017/S1474745618000186
58 Gasiorek M and Holmes P, ‘Grandfathering free trade agreements and rules of origin: What might appear bilateral is in fact trilateral!’, UK Trade Policy Observatory, 27 September 2017, retrieved 9 October 2018, https://blogs.sussex.ac.uk/uktpo/2017/09/27/grandfathering-ftas-and-roos/

72 UNDERSTANDING THE ECONOMIC IMPACT OF BREXIT
59 House of Commons Exiting the EU Committee, EU Exit Analysis: Cross Whitehall briefing, January 2018, slide 14, retrieved 9 October 2018, www.parliament.uk/documents/commons-committees/Exiting-the-European-Union/17-19/Cross-Whitehall-briefing/EU-Exit-Analysis-Cross-Whitehall-Briefing.pdf
60 Minford P, ‘The latest state of modelling Brexit’, Written Evidence to DIT Select Committee, April 2018, p. 23, retrieved 9 October 2018, www.economistsforfreetrade.com/wp-content/uploads/2018/05/Minford-and-Blake-written-evidence-to-DIT-Select-Cttee-April-2018.pdf
61 Centre for Economic Policy Research, Estimating the Economic Impact on the UK of a Transatlantic Trade and Investment Partnership (TTIP) Agreement between the European Union and the United States: Final project report, reference P2BIS120020, March 2013, retrieved 9 October 2018, https://assets.publishing.service.gov.uk/government/uploads/system/uploads/attachment_data/file/198115/bis-13-869-economic-impact-on-uk-of-tranatlantic-trade-and-investment-partnership-between-eu-and-us.pdf
62 Moser C and Rose A, ‘Why do trade negotiations take so long?,’ Vox CEPR Policy Portal, 8 June 2012, retrieved 9 October 2018, www.voxeu.org/article/why-do-trade-negotiations-take-so-long
63 House of Commons Exiting the European Union Committee, EU Exit Analysis: Cross Whitehall briefing, January 2018, slide 14, retrieved 9 October 2018, www.parliament.uk/documents/commons-committees/Exiting-the-European-Union/17-19/Cross-Whitehall-briefing/EU-Exit-Analysis-Cross-Whitehall-Briefing.pdf
64 OECD, Foreign Direct Investment Statistics: Data, analysis and forecasts, FDI statistics database, retrieved 9 October 2018, www.oecd.org/corporate/mne/statistics.htm/
65 See Dhingra S, Huang, H, Ottaviano G, Pessoa J, Sampson T and Van Reenen J, The Costs and Benefits of Leaving the EU: Trade Effects, Centre for Economic Performance, Discussion Paper No. 1478, April 2017, p. 28, retrieved 9 October 2018, http://cep.lse.ac.uk/pubs/download/dp1478.pdf
66 Bootle R, Bourne R, Congdon T, Lightfoot W, Lyons G, MacKinnon N and others, The Economy After Brexit, Economists for Free Trade, 2017, p. 17 retrieved 11 October 2018, www.economistsforfreetrade.com/wp-content/uploads/2017/08/Economists_for_Brexit_The_Economy_after_Brexit.pdf
67 Ebell M and Warren J, ‘The long-term economic impact of leaving the EU’, National Institute of Economic and Social Research, 25 May 2016, p. 122, retrieved 9 October 2018, www.niesr.ac.uk/sites/default/files/publications/National%20Institute%20Economic%20Review-2016-Ebell-121-38.pdf
68 See for example, Haskel J, Pereira S and Slaughter M, ‘Does inward foreign direct investment boost the productivity of domestic firms?’, Review of Economics and Statistics, 2007, vol. 89, no. 3, pp. 482–96, retrieved 9 October 2018, https://econpapers.repec.org/article/tprrestat/v_3a89_3ay_3a2007_3ai_3a3_3ap_3a482-496.htm
69 See Dhingra S, Huang, H, Ottaviano G, Pessoa J, Sampson T and Van Reenen J, The Costs and Benefits of Leaving the EU: Trade Effects, Centre for Economic Performance, Discussion Paper No. 1478, April 2017, p. 28, retrieved 9 October 2018, http://cep.lse.ac.uk/pubs/download/dp1478.pdf
70 Vickers J, ‘Consequences of Brexit for competition law and policy’, Oxford Review of Economic Policy, vol. 33, no. S1, pp. S70–8, retrieved 9 October 2018, https://academic.oup.com/oxrep/article/33/suppl_1/S70/3066075
71 Council of the European Union, Draft Negotiating Guidelines, 7 March 2018, retrieved 9 October 2018, https://g8fip1kplyr33r3krz5b97d1-wpengine.netdna-ssl.com/wp-content/uploads/2018/03/European-council-Art.50-23-March-2018-Draft-Guidelines-1.pdf
72 Booth S, Howarth C, Persson M, Ruparel R and Swidlicki P, What if…? The consequences, challenges and opportunities facing Britain outside the EU, Open Europe, 2015, retrieved 9 October 2018, http://2ihmoy1d3v7630ar9h2rsglp-wpengine.netdna-ssl.com/wp-content/uploads/2015/03/150507-Open-Europe-What-If-Report-Final-Digital-Copy.pdf
73 Gillham, J, Sentance A, Teow J, Lambe C, Lancefield D, Hawksworth, J and others, Leaving the EU: Implications for the UK economy, PwC, p. 70, March 2016, retrieved 9 October 2018, www.pwc.co.uk/economic-services/assets/leaving-the-eu-implications-for-the-uk-economy.pdf
74 Singham S and Tylecote R, Plan A+ Creating a prosperous post-Brexit UK, Institute of Economic Affairs, Discussion Paper 95, September 2018, retrieved on 14 October 2018, https://iea.org.uk/wp-content/uploads/2018/09/PLAN-A-FINAL.pdf
75 Swan S, ‘The IEA’s Plan A+ for ‘free trade’ is the product of fanaticism’, London School of Economics, 28 September 2018, retrieved on 14 October 2018, http://blogs.lse.ac.uk/brexit/2018/09/28/the-ieas-plan-a-for-free-trade-is-the-product-of-fanaticism/
76 The Week, ‘Brexit: what is Plan A+ and do its numbers add up?’, 25 September 2018, retrieved on 14 October 2018, www.theweek.co.uk/96676/brexit-what-is-plan-a-and-do-its-numbers-add-up
77 CBI, Smooth Operations: An A–Z of the EU rules that matter for the economy, 1 April 2018, retrieved 9 October 2018, www.cbi.org.uk/index.cfm/_api/render/file/?method=inline&fileID=7C026F7C-746E-4795-90EFCC69B2FB6756

73REFERENCES
78 Portes J and Forte G, The Economic Impact of Brexit-induced Reductions in Migration, National Institute of Economic and Social Research, 7 December 2016, retrieved 9 October 2018, http://ukandeu.ac.uk/wp-content/uploads/2016/12/The-economic-impact-of-Brexit-induced-reductions-in-migration.pdf
79 Migration Advisory Committee, EEA Migration in the UK: Final report, September 2018, Chair’s Foreword, retrieved 9 October 2018, https://assets.publishing.service.gov.uk/government/uploads/system/uploads/attachment_data/file/741926/Final_EEA_report.PDF
80 Wright R, ‘Net migration to Brexit Britain from EU drops to 5-year low’, Financial Times, 16 July 2018, retrieved 9 October 2018, www.ft.com/content/6198fe42-88d4-11e8-bf9e-8771d5404543
81 Browne J, Johnson P, and Phillips D, The budget of the European Union: a guide, Institute for Fiscal Studies, IFS Briefing Note BN181, April 2016, p.40. retrieved 11 October 2018, www.ifs.org.uk/uploads/publications/bns/BN181.pdf
82 Malnick E, ‘NHS to get £384m extra a week after Brexit “dividend” – but taxes set to rise to pay for it’, The Telegraph, 17 June 2018, retrieved 10 October 2018, www.telegraph.co.uk/politics/2018/06/16/350m-extra-week-nhs-hunt-announces-theresa-may-locks-britain/
83 Full Fact, ‘Norway’s EU payments’, 4 August 2016, retrieved 9 October 2018, https://fullfact.org/europe/norway-eu-payments/.
84 Feyrer J, ‘Trade and Income: Exploiting time series in geography’, NBER Working Paper 14910, 2009.
85 Feyrer J, ‘Distance, Trade and Income: The 1967 to 1975 closing of the Suez Canal as a natural experiment’, NBER Working Paper 15557, 2011.
86 Lileeva A and Trefler D, ‘Improved access to foreign markets raises plant-level productivity … for some plants’, Quarterly Journal of Economics, 2010, vol. 125, no. 3, pp. 1051–99.
87 Busch B, and Matthes J, The economic impacts of Brexit: Results from a meta-analysis, CEPR Policy Portal, 27 April 2016, retrieved 11 October 2018, https://voxeu.org/article/meta-analysis-economic-impact-brexit
88 Erken H, Hayat R, Heijmerikx M, Prins C and de Vreeded I, Assessing the Economic Impact of Brexit: Background report, Rabobank, 12 October 2017, p. 14, retrieved 9 October 2018, https://economics.rabobank.com/publications/2017/october/assessing-economic-impact-brexit-background-report/
4. How will the impact vary across the UK?
1 Minford P, Gupta S, Phuong Mai Le V, Mahambare V and Xu Y, Should Britain Leave the EU? An Economic Analysis of a Troubled Relationship Second Edition, 2015, Edward Elgar p. 73.
2 Minford P, Evaluating European Trading Arrangements, Cardiff Business School Working Paper No. E2015/1, November 2015, p. 9, retrieved 9 October 2018, http://patrickminford.net/wp/E2015_17.pdf
3 Smith A, Written Evidence to the International Trade Committee, 23 May 2018, retrieved 9 October 2018, http://data.parliament.uk/writtenevidence/committeeevidence.svc/evidencedocument/international-trade-committee/the-economic-effects-of-trade-policy/written/83106.html
4 Bootle R, Jessop J, Lyons G and Minford P, Alternative Brexit Economic Analysis, Economists for Free Trade, 2 March 2018, p. 126, retrieved 9 October 2018, www.economistsforfreetrade.com/publication/alternative-brexit-economic-analysis/
5 Dhingra S, Huang, H, Ottaviano G, Pessoa J, Sampson T and Van Reenen J, The Costs and Benefits of Leaving the EU: Trade effects, Centre for Economic Performance, Discussion Paper No. 1478, April 2017, p. 127, table 7, retrieved 9 October 2018, http://cep.lse.ac.uk/pubs/download/dp1478.pdf
6 Hern A, ‘Brexit hits Apple Mac customers hard as prices rise by up to £500’, The Guardian, 29 October 2016, retrieved 9 October 2018, www.theguardian.com/technology/2016/oct/28/brexit-apple-mac-customers-prices-rise-us-dollar-pound-sterling
7 Gasiorek M, Serwicka I and Smith A, ‘Which manufacturing sectors are most vulnerable to Brexit?’, UK Trade Policy Observatory, Briefing Paper 16, February 2018, p. 2, retrieved 9 October 2018, http://blogs.sussex.ac.uk/uktpo/files/2018/02/Briefing-paper-16.pdf
8 See Levell P and Norris Keiller A, ‘The exposure of workers to potential trade barriers between the UK and the EU’, IFS Green Budget, 5 October 2018, retrieved 9 October 2018, www.ifs.org.uk/publications/13463; Iyer K, Quest L, Hunt P, Gladstone J, Poulton M and Souta P, The Red-tape Cost of Brexit, Oliver Wyman and Clifford Chance, 12 March 2018, retrieved 9 October 2018, www.oliverwyman.com/content/dam/oliver-wyman/v2/publications/2018/march/Oliver-Wyman_Clifford-Chance-The-Red-Tape-Cost-of-Brexit.pdf
9 See for example, Lawless M and Morgenroth E, ‘The product and sector level impact of a hard Brexit across the EU’, ESRI Working Paper No. 550, 2016.

74 UNDERSTANDING THE ECONOMIC IMPACT OF BREXIT
10 Gasiorek M, Serwicka I and Smith A, ‘Which manufacturing sectors are most vulnerable to Brexit?’, UK Trade Policy Observatory, Briefing Paper 16, February 2018, p. 2, retrieved 9 October 2018, http://blogs.sussex.ac.uk/uktpo/publications/which-manufacturing-sectors-are-most-vulnerable-to-brexit/
11 Office for National Statistics, ‘GDP output approach - low level aggregates’, series KL4Y and KL4W, 28 September 2018, retrieved on 16 October 2018, www.ons.gov.uk/economy/grossdomesticproductgdp/datasets/ukgdpolowlevelaggregates
12 Levell P and Norris Keiller A, ‘The exposure of workers to potential trade barriers between the UK and the EU’, IFS Green Budget, 5 October 2018, retrieved 9 October 2018, www.ifs.org.uk/publications/13463
13 Downing E and Coe S, Brexit: Future UK agriculture policy, House of Commons Library No. 8218, 31 January 2018, p. 19, retrieved 9 October 2018, www.parliament.uk/documents/commons-library/Brexit-UK-agriculture-policy-CBP-8218.pdf
14 Ibid.
15 Gasiorek M and Walmsley S, ‘Fishing in deep waters’, UK Trade Policy Observatory, 21 July 2018, retrieved 9 October 2018, http://blogs.sussex.ac.uk/uktpo/files/2018/07/bp21-new.pdf
16 Office for National Statistics, ‘GDP output approach - low level aggregates’, series KL4Y and KL4W, 28 September 2018, retrieved on 16 October 2018, www.ons.gov.uk/economy/grossdomesticproductgdp/datasets/ukgdpolowlevelaggregates
17 Kennedy M, Gray A and Forrest N, ‘Brexit and the cost to Europe of fragmenting financial services’, PwC, October 2016, retrieved 9 October 2018, www.pwc.co.uk/the-eu-referendum/brexit-cost-to-europe-of-fragmenting-financial-services.html
18 Sants H, Hunt P, Austen M, Kelly D and Naylor L, The Impact of the UK’s Exit from the EU on the UK-based Financial Services Sector, Oliver Wyman, 5 October 2016, p. 2, retrieved 9 October 2018, www.oliverwyman.com/content/dam/oliver-wyman/global/en/2016/oct/Brexit_POV.PDF
19 Los B and others, An Assessment of Brexit Risks for 54 Industries: Most Services Industries are also Exposed Birmingham University, City-REDI Policy Briefing, December 2017, p. 3, retrieved 11 October 2018, https://blog.bham.ac.uk/cityredi/wp-content/uploads/sites/15/2018/01/City-REDI-Briefing-Template_Sectoral-Analysis.pdf
20 International Monetary Fund, Euro Area Policies: Selected Issues, Country Report No. 18/224, 19 July 2018, retrieved 9 October 2018, www.imf.org/en/Publications/CR/Issues/2018/07/18/Euro-Area-Policies-Selected-Issues-46097
21 Office for National Statistics, ‘GDP output approach - low level aggregates’, series KL4Y and KL4W, 28 September 2018, retrieved on 16 October 2018, www.ons.gov.uk/economy/grossdomesticproductgdp/datasets/ukgdpolowlevelaggregates
22 Office for National Statistics, Balance of Payments, UK: April to June 2018, 28 September 2018, retrieved 9 October 2018, www.ons.gov.uk/economy/nationalaccounts/balanceofpayments/bulletins/balanceofpayments/apriltojune2018.
23 Office for National Statistics, ‘GDP output approach - low level aggregates’, series KL4Y and KL4W, 28 September 2018, retrieved on 16 October 2018, www.ons.gov.uk/economy/grossdomesticproductgdp/datasets/ukgdpolowlevelaggregates
24 House of Lords, Brexit: Trade in non-financial services, European Union Committee, 18th Report of Session 2016–17, 2017, p. 23, para. 61, retrieved 9 October 2018, https://publications.parliament.uk/pa/ld201617/ldselect/ldeucom/135/135.pdf
25 Levell P and Norris Keiller A, ‘The exposure of workers to potential trade barriers between the UK and the EU’, IFS Green Budget, 5 October 2018, Figure 10.6 and Appendix Table YA.1, retrieved 9 October 2018, www.ifs.org.uk/publications/13463
26 Dhingra S, Machin S and Overman H, The Local Economic Effects of Brexit, Centre for Economic Performance, Brexit Analysis no. 10, July 2017, p. 19, retrieved 9 October 2018, http://cep.lse.ac.uk/pubs/download/brexit10.pdf
27 Ibid., Chen W., et al., The continental divide? Economic exposure to Brexit in regions and countries on both sides of The Channel, Papers in Regional Science, Volume 97, Issue 1, Special Issue: The trade, geography and regional implications of Brexit March 2018, Pages 25–54, retrieved 11 October 2018, https://onlinelibrary.wiley.com/doi/full/10.1111/pirs.12334; Levell P and Norris Keiller A, ‘The exposure of workers to potential trade barriers between the UK and the EU’, IFS Green Budget, 5 October 2018, retrieved 9 October 2018, www.ifs.org.uk/publications/13463; Cambridge Econometrics, Preparing for Brexit Commissioned by Greater London Authority, January 2018, retrieved 11 October 2018, http://www.camecon.com/wp-content/uploads/2018/01/Preparing-for-Brexit.pdf; and House of Commons Exiting the European Union Committee, EU Exit Analysis: Cross Whitehall briefing, January 2018, slide 2, retrieved 9 October 2018, www.parliament.uk/documents/commons-committees/Exiting-the-European-Union/17-19/Cross-Whitehall-briefing/EU-Exit-Analysis-Cross-Whitehall-Briefing.pdf

75REFERENCES
28 Chen W. et al., p.9. Levell and Norris Keiller A., p.9. Cambridge Econometrics, p.46., House of Commons Exiting the European Union Committee, slide 23., Dhingra S, Machin S and Overman H,. p.19.
29 HM Revenue & Customs, ‘Regional Trade in Goods Statistics disaggregated by smaller geographical areas: 2016’, 28 March 2018, retrieved 9 October 2018, www.gov.uk/government/statistics/regional-trade-in-goods-statistics-disaggregated-by-smaller-geographical-areas-2016; Borchert I and Tamberi N, Brexit and Regional Services Exports: A heat map approach, UKTPO, 2018.
30 Winters A, ‘Brexit and the regions: A lighter shade of dark’, UK in a Changing Europe, 20 October 2016, retrieved 9 October 2018, http://ukandeu.ac.uk/brexit-and-the-regions-a-lighter-shade-of-dark/
31 See Levell P and Norris Keiller A, ‘The exposure of workers to potential trade barriers between the UK and the EU’, IFS Green Budget, 5 October 2018, retrieved 9 October 2018, www.ifs.org.uk/publications/13463
32 Dhingra S, Machin S and Overman H, The Local Economic Effects of Brexit, Centre for Economic Performance, Brexit Analysis no. 10, July 2017, p. 19, retrieved 9 October 2018, http://cep.lse.ac.uk/pubs/download/brexit10.pdf
33 Cambridge Econometrics, Preparing for Brexit Commissioned by Greater London Authority, January 2018, p. 46. retrieved 11 October 2018, www.camecon.com/wp-content/uploads/2018/01/Preparing-for-Brexit.pdf
34 Levell P and Norris Keiller A, ‘The exposure of workers to potential trade barriers between the UK and the EU’, IFS Green Budget, 5 October 2018, p. 24, retrieved 9 October 2018, www.ifs.org.uk/publications/13463
35 Breinlich H, Leromain E, Novy D and Sampson T, The Brexit Vote, Inflation and UK Living Standards, Centre for Economic Performance, CEP Brexit Analysis No. 11, 2017, retrieved 9 October 2018, http://cep.lse.ac.uk/pubs/download/brexit11.pdf
36 Ibid.
37 Clarke S, Serwicka I and Winters LA, Changing Lanes: The impact of different post-Brexit trading policies on the cost of living UKTPO and Resolution Foundation, October 2017, p. 5, retrieved 11 October 2018, www.resolutionfoundation.org/app/uploads/2017/10/Changing-Lanes.pdf
38 Dhingra S, Huang, H, Ottaviano G, Pessoa J, Sampson T and Van Reenen J, The Costs and Benefits of Leaving the EU: Trade effects, Centre for Economic Performance, Discussion Paper No. 1478, April 2017, figure 6, retrieved 9 October 2018, http://cep.lse.ac.uk/pubs/download/dp1478.pdf
39 Levell P and Norris Keiller A, ‘The exposure of workers to potential trade barriers between the UK and the EU’, IFS Green Budget, 5 October 2018, retrieved 9 October 2018, www.ifs.org.uk/publications/13463
40 Breinlich H, Dhingra S, Sampson T and Van Reenen J, Who Bears the Pain? How the costs of Brexit would be distributed across income groups, Centre for Economic Performance, CEP Brexit Analysis No. 7, 2016, retrieved 9 October 2018, http://cep.lse.ac.uk/pubs/download/brexit07.pdf
5. From here to there: the economic implications of adapting to a new relationship
1 Office for Budget Responsibility, ‘Brexit and the OBR’s forecasts’, Discussion Paper no.3, October 2018, retrieved on 11 October 2018, https://obr.uk/docs/dlm_uploads/BrexitDiscussionWebVersion.pdf
2 Booth S, Howarth C, Persson M, Ruparel R and Swidlicki P, What if…? The consequences, challenges and opportunities facing Britain outside the EU, Open Europe, 2015, retrieved 9 October 2018, http://2ihmoy1d3v7630ar9h2rsglp-wpengine.netdna-ssl.com/wp-content/uploads/2015/03/150507-Open-Europe-What-If-Report-Final-Digital-Copy.pdf
3 Islam F, ’13-mile lorry park may last “many years” after Brexit, impact reports reveal’, Sky News, 3 August 2018, retrieved 10 October 2018, https://news.sky.com/story/13-mile-lorry-park-may-last-many-years-after-brexit-impact-reports-reveal-11454991
4 European Commission, ‘Brexit preparedness notices’, retrieved 9 October 2018, https://ec.europa.eu/info/brexit/brexit-preparedness_en
5 European Commission, ‘Notice to Stakeholders: Withdrawal of the United Kingdom and food law’, 1 February 2018, p. 6, retrieved 9 October 2018, https://ec.europa.eu/info/sites/info/files/file_import/eu_food_law_en.pdf
6 Wright O and Jones C, ‘Britain must make new trade deals in record time’, The Times, 3 April 2018, retrieved 9 October 2018, www.thetimes.co.uk/article/britain-must-make-new-trade-deals-in-record-time-w8dc82qdn
7 Spisak A and Stojanovic A, Trade after Brexit: Options for the UK’s relationship with the EU, Institute for Government, December 2017, p. 49, retrieved 10 October 2018, www.instituteforgovernment.org.uk/sites/default/files/publications/IFGJ5896-Brexit-Report-171214-final_0.pdf
8 Office for Budget Responsibility, ‘Brexit and the OBR’s forecasts’, Discussion Paper no.3, October 2018, retrieved on 11 October 2018, https://obr.uk/docs/dlm_uploads/BrexitDiscussionWebVersion.pdf

76 UNDERSTANDING THE ECONOMIC IMPACT OF BREXIT
9 House of Commons Exiting the European Union Committee, EU Exit Analysis: Cross Whitehall briefing, January 2018, slide 2, retrieved 9 October 2018, www.parliament.uk/documents/commons-committees/Exiting-the-European-Union/17-19/Cross-Whitehall-briefing/EU-Exit-Analysis-Cross-Whitehall-Briefing.pdf
10 Faulconbridge G and Maclellan K, ‘EU’s Barnier says ready for new Irish border solutions as Brexit deadline looms’, Reuters, 7 September 2018, retrieved 10 October 2018, www.reuters.com/article/us-britain-eu-barnier/eus-barnier-says-ready-for-new-irish-border-solutions-as-brexit-deadline-looms-idUSKCN1LN1RZ

About the authorsGemma Tetlow is Chief Economist at the Institute for Government, working across the Institute’s programme areas. She joined the organisation in April 2018 from the Financial Times, where she was Economics Correspondent. Previously, Gemma worked as an economist at the Institute for Fiscal Studies.
Gemma has a PhD in economics from University College London, and an MSc and BSc in Economics from the University of Warwick.
Alex Stojanovic is a researcher at the Institute, working in the Brexit team. He joined the organisation in March 2017 from the University of Sussex, where he completed an MA in Philosophy.

instituteforgovernment.org.uk
+44 (0) 20 7747 0400 +44 (0) 20 7766 0700
@instituteforgov
Institute for Government, 2 Carlton Gardens London SW1Y 5AA, United Kingdom
The Institute for Government is the leading think tank working to make government more effective.
We provide rigorous research and analysis, topical commentary and public events to explore the key challenges facing government.
We offer a space for discussion and fresh thinking, to help senior politicians and civil servants think differently and bring about change.
© Institute for Government 2018 The Institute for Government is a registered charity in England and Wales (No.1123926) with cross-party governance. Our main funder is the Gatsby Charitable Foundation, one of the Sainsbury Family Charitable Trusts.