Embed Size (px)
Citation preview
May 2021
Understanding the drivers of numeracy
assessment scores in Secondary 3 classes in 14 districts in Rwanda
Leaders in Teaching Research and Policy Series
1
Authors Dimitri Stoelinga (Laterite), Panchi Cheriyan (Laterite), Professor Pauline Rose (REAL Centre), Dr. Phil Leonard (Laterite), Professor Ricardo Sabates (REAL Centre) Acknowledgements This work was carried out in partnership with the Mastercard Foundation as part of the Leaders in Teaching initiative. Leaders in Teaching supports teachers throughout their careers and prepares them to deliver high-quality education through a variety of interventions, with a focus on Science, Technology, Engineering and Mathematics (STEM) subjects in secondary education in Rwanda. Laterite and the Research for Equitable Access and Learning (REAL) Centre at the University of Cambridge are learning partners for the Leaders in Teaching initiative, responsible for generating evidence on improved teacher performance and student learning in Rwandan secondary schools, particularly at schools where students are at most risk of not learning. About Laterite and the REAL Centre Laterite is a data, research and advisory firm dedicated to bringing high-quality research services to the most underserved markets. Based in East Africa, the firm strives to carry out impactful research that helps decision-makers find solutions to complex development problems. The REAL Centre at the University of Cambridge pioneers research into overcoming barriers to education, such as poverty, gender, ethnicity, language and disability, and promotes education as an engine for inclusive growth and sustainable development. Suggested citation Cheriyan, P., Leonard, P., Rose, P., Sabates, R., and Stoelinga, D. (2021) Understanding the drivers of numeracy assessment scores in Secondary 3 classes in 14 districts in Rwanda. Leaders in Teaching Research and Policy Series, May 2021. Laterite, Rwanda and REAL Centre, University of Cambridge. Approval to disseminate this work was granted from the National Institute of Statistics Rwanda (NISR) on 31 May 2021. Approval No: 0174/2021/10/NISR Study name: The Leaders in Teaching Quantitative Baseline Study
2
Contents Introduction ............................................................................................................................. 4
The context ......................................................................................................................... 4
The study ............................................................................................................................ 4
Key findings ........................................................................................................................ 5
Policy implications ............................................................................................................... 6
Methodology ........................................................................................................................... 7
Using LARS III for student numeracy assessments and implications for analysis .............. 7
Sampling strategy ............................................................................................................... 8
The LARS III instruments and item response theory .......................................................... 8
Composite indices ............................................................................................................... 9
Limitations ......................................................................................................................... 10
Discussion ............................................................................................................................. 12
Section 1: Student level factors – the distribution of numeracy assessment scores with respect to student characteristics...................................................................................... 12
Finding 1: On average, at the start of the academic year in Secondary 3, girls have slightly lower numeracy assessment scores than boys ............................................................ 15
Finding 2: Age is a strong predictor of numeracy assessment scores both within and across schools .............................................................................................................. 18
Finding 3: Numeracy assessment scores are higher in schools with a greater proportion of students from comparatively higher income households: the gap is largest between day schools and boarding schools. However, controlling for fixed school effects, we find no association between family income levels and numeracy assessment scores. ....... 20
Section 2: School-level factors - the distribution of numeracy assessment scores at the start of the school year with respect to school characteristics .................................................. 23
Finding 4: Schools with higher numeracy assessment scores at the start of the school year have more qualified and experienced STEM teachers ......................................... 27
Finding 5: Students with better numeracy learning outcomes at the start of the school year are found in schools that are better equipped ....................................................... 29
Finding 6: Average numeracy outcomes for students at the start of the academic year are not associated with whether these students are in day schools with higher pupil-to-teacher ratios or pupil-to-classroom ratios (this holds for day schools only) ................. 31
Finding 7: Differences in the characteristics of day schools only explain 10% of the variation in numeracy assessment scores .................................................................... 33
Implications and areas for future research ............................................................................ 35
References ............................................................................................................................ 38

3
Acronyms
ESSP Education Sector Strategic Plan
ICC Intra-Cluster-Correlation
ICT Information and Communications Technology
IRT Item Response Theoretical
LARS Learning Achievements in Rwandan Schools
LIT Leaders in Teaching
MINEDUC Ministry of Education
PCA Principal Component Analysis
REAL Research for Equitable Access and Learning
REB Rwandan Education Board
STEM Science, Technology, Engineering and Mathematics

4
Introduction The context Rwanda has made it a priority to strengthen Science, Technology, Engineering and Mathematics (STEM) learning at all levels of education and to accelerate investments towards improving the quality and equity of learning outcomes in the education system. Better learning outcomes, equity of education access and a focus on STEM and ICT are central to Rwanda’s Education Sector Strategic Plan (ESSP) for 2018-2024 (Rwandan Ministry of Education, 2019a). In this context, the Mastercard Foundation’s Leaders in Teaching initiative aims to support the transformation of the quality of teaching in secondary education in Rwanda through a range of programs implemented across 14 districts in Rwanda, with a focus on STEM subjects. Laterite and the Research for Equitable Access and Learning (REAL) Centre at the University of Cambridge are learning partners on this five-year initiative, responsible for generating evidence on how the initiative is influencing teaching quality. The initiative targets improvements across four key pillars in the life cycle of secondary education teachers: recruitment, motivation, training and leadership. The study The Leaders in Teaching 2020 study provides a unique opportunity to understand student numeracy scores in relation to their teachers and the schools they attended prior to school closures. It links 4,020 student numeracy assessments from Secondary 3 students in 100 schools, to a range of other data sources including: detailed information about school-level characteristics, data from surveys with up to eight STEM teachers per school, and data from school leader surveys. Numeracy assessment scores were collected using the instruments developed for the Learning Achievements in Rwandan Schools (LARS III) exercise, a nationally representative literacy and numeracy assessment designed for students in Primary 6 and Secondary 3. The numeracy assessment for the Leaders in Teachers 2020 study was conducted at the start of school year, in February/March 2020, prior to the closing of schools due to COVID-19. During the assessment, students were also asked questions about their individual characteristics (e.g., age and gender); family composition; the literacy levels of their parents; household asset ownership; time spent on chores, homework and other activities; and their academic history. This study explores how variation in numeracy assessment scores for Secondary 3 pupils at the start of the school year links to key student- and school-level characteristics:
• Student-level factors: Within schools and across schools, student level factors can influence the distribution of learning outcomes, be it in terms of differences between boys and girls, age groups, and/or the socio-economic situation of
5
students and their families. We study which groups of students have the greatest learning gaps at the start of the school year.
• The school environment: School-level factors, related to teaching resources and school infrastructure, are central to the delivery of quality education. School-level factors also play a central role in the selection process of the best students into secondary schools during the transition from primary to secondary. We study how numeracy assessment scores are distributed across schools with different human and physical resources.
Key findings
1. On average, at the start of the academic year in Secondary 3, girls have lower numeracy assessment scores than boys. The learning gap between girls and boys is relatively small, but we find that the difference in the numeracy outcomes between boys and girls holds across all age groups, wealth quintiles, and school categorisations – whether we group schools by their average wealth, size, their average numeracy assessment score, or their average age.
2. Age is a strong predictor of numeracy assessment scores both within schools and across schools – with older students at a significant disadvantage. Age in itself is not a disadvantage, but the result of accumulated delays in the educational trajectory of children, through a late start to their education, frequent repetition or periods of dropout and re-entry. Older students are also at a higher risk of drop out.
3. Numeracy assessment scores are higher in schools with more students from comparatively higher income households; the gap is largest between day schools and boarding schools. However, controlling for fixed school effects, we find no association between family income levels and numeracy assessment scores.
4. Schools with higher numeracy assessment scores at the start of the school year have more qualified and experienced STEM teachers.
5. Students with better numeracy learning outcomes at the start of the school year are found in schools that are better equipped – with a greater diversity of facilities, such as libraries, science labs or smart rooms.
6. Average numeracy outcomes for students at the start of the academic year for students enrolled in day schools are not associated with whether these students are in schools with higher pupil-to-teacher ratios or pupil-to-classroom ratios.
6
7. There is little variation in numeracy assessment scores in day schools at the start of the school year: school-level factors explain 10% of the variation in numeracy assessment scores. In boarding schools, over 30% of variation in numeracy assessment scores is explained by school-level factors.
Policy implications 1. Gender sensitive pedagogies for STEM may be needed so that girls can
maximize their potential. Girls may also lack STEM role models, in a context where few STEM teachers and school leaders are women (we estimate that 26.6% of STEM teachers in secondary schools in the Leaders in Teaching sample are female).
2. Students that are significantly older than expected for their grade are a vulnerable population and may require special policy attention. Older students, especially those with learning difficulties, are at the greatest risk of dropout.
3. We recommend a greater policy and research focus on the question of
how the student allocation mechanism to secondary schools (in the transition from primary to secondary) affects equity. This analysis is too limited to ascertain how the student allocation mechanism affect equity in overall learning outcomes, but we observe large learning gaps between students in day schools and boarding-schools.
4. It is important to keep in mind that investments to strengthen teacher
quality at secondary level may not reach their full potential in terms of learning gains, because of foundational learning gaps. Evidence from this study is consistent with existence of foundational learning gaps, that may translate into low returns to better teaching and better school infrastructure at secondary level.
5. We recommend that policy makers review the use of teacher-to-pupil and
classroom-to-pupil ratios since these do not appear to be correlated with learning outcomes. Given the high levels of variation in these factors, and the fact they are not predictive of learning outcomes, we question whether these are the most appropriate indicators to track the quality of school-level inputs.
7
Methodology Using LARS III for student numeracy assessments and implications for analysis In February/March 2020, Laterite and the REAL Centre carried out the first stage of a study to understand the determinants of and equity in numeracy learning outcomes in Secondary 3 classrooms across 14 districts in Rwanda. Since the ultimate objective of Leaders in Teaching is to improve student learning outcomes (by investing in better teacher quality) we needed a robust way to measure changes in student learning outcomes over time. Following discussions with the Examinations, Selection and Assessment Department at the Rwandan Education Board (REB), we decided to use the LARS III numeracy instruments to carry out a quantitative assessment of students for this research. The LARS numeracy assessments are a key metric to track progress towards the quality and equity of STEM-related learning outcomes in Rwanda. Since 2014, REB has administered LARS assessments – focusing on both numeracy and literacy – to a representative sample of students in selected grades of primary and secondary schools. The objective is to understand whether students are meeting learning expectations and to identify the key determinants of learning outcomes. The latest round of LARS, called LARS III, was conducted in Primary 6 and Secondary 3 classrooms in 2017 (see Burdett and James, 2018). LARS IV is scheduled to be rolled out after schools re-open in 2021. The LARS III numeracy assessments formed part of a larger data collection effort, which included school observation surveys, school leader surveys and teacher surveys. The instruments for the school observation, teacher and school-leader surveys (with up to eight STEM teachers per school) were designed specifically for the Leaders in Teaching study; only numeracy assessments were drawn from LARS III. This analysis uses data from the start of the 2020 school year (pre-COVID-19) to study some of the student, household, and school-level factors that are associated with differences in numeracy learning outcomes. It is important to note that these are data from the start of the 2020 school year. LARS is originally a cross-section, end of year assessment, linked to the curriculum through to the end of Secondary 3. Since what we are capturing here are data from the start of the Secondary 3 school year, we cannot use the assessment data to comment on whether students are meeting expectations for Secondary 3. Instead, the analysis is focused on how far various groups of students are from achieving expected Secondary 3-level outcomes at the start of the school year.
8
Sampling strategy At the start of the school year in February/March 2020, numeracy assessments using the LARS III instruments were delivered to 4,020 students in 100 different schools, all located in Districts where the Leaders in Teaching program is operational. The overall sample of schools for the Leaders in Teaching quantitative study is all 360 secondary schools in 14 Leaders in Teaching program districts of Rwanda. The student learning assessment was administered in a randomly selected sub-sample of 100 of these schools, stratified to ensure we could oversample the number of schools of excellence included in the analysis. Within each school, one Secondary 3 class was randomly selected, and all the students from this class who were present on the day of data collection were interviewed and assessed. As such, this data is representative of students that were present on the day of the assessment in all general education secondary schools in the 14 districts where Leaders in Teachers programs are underway. The LARS numeracy assessments were administered in 100 schools, out of which 76 are day schools and 24 are boarding schools or hybrid schools (boarding schools and day schools). Moving forward we refer to boarding schools as any school that includes boarding facilities and day schools as any general education secondary school that does not include any boarding facilities. Almost all of the boarding schools in this sample are also designated “schools of excellence” (only two schools of excellence in our sample are day schools). Along with student assessments at these 100 schools, we also conducted surveys with up to 8 STEM teachers in each school (including the maths teacher of the Secondary 3 class) and the school leader of the school. In this paper, we use the teacher surveys to estimate the average qualifications and salaries of STEM teachers in schools. The LARS III instruments and item response theory The learning assessment questionnaire focuses on numeracy skills and contains 30 multiple-choice questions. Areas covered by the test include:
• Numbers, including addition, subtraction, multiplication and division; • Geometry and metrics; • Order and sequences; • Statistics and graphs; • Fractions and percentages; and • Algebra.
The learning assessment was administered as a paper-based multiple-choice questionnaire with a QR code, distributed to students during class and supervised by trained enumerator teams. These paper surveys were then collected, scanned, and

9
automatically transcribed into the student assessments dataset using an in-house code with high accuracy (>98%). In order to ensure that there was little scope for cheating or the copying of answers during the assessment, the assessment was administered in two versions. Both tests had the same questions but one additional question was added at the start of version 1 and at the end of version 2, thus shifting the order of questions by one number. We determined analytically that this shift had no effect on aggregate student outcomes. We study the learning attainments of students in this assessment using a latent ability score, estimated with a two-parameter Item Response Theoretical (IRT) model. The IRT two-parameter model takes into account not only the endogenously estimated difficulty of questions, but also their ability to discriminate between students of different ability levels. We used IRT modelling in our analysis (i) to obtain a more continuous score of test performance (we cannot capture smaller variations if we work with total test scores that are more discrete); and (ii) to obtain a slightly more nuanced score that endogenously weights question difficulty. The choice of IRT for scoring does not influence the findings in this report. This estimate of the numeracy assessment score takes into account not only the number of questions the student answered correctly, but also the difficulty of the questions. The calculated numeracy assessment score varies from 0 to 1. Students that scored zero on the assessment responded incorrectly to all questions; students that scored one got all the questions right. The score can be thought of as a weighted percentage of correct responses, where questions are weighted based on the estimated difficulty of the question. Composite indices To study the link between assessment scores and student and school characteristics we create two composite scores:
• A household assets index, as a proxy for wealth. This index is derived from a Principal Component Analysis (PCA) applied to 13 different household assets, including whether the households own chairs, a table, a bed, a bench, a mobile phone, a television, a radio, a fridge, a bicycle, a motorbike, a car, has pumped water and access to electricity. The weights of this PCA are tuned using data from Rwanda’s Fifth Integrated Household Living Survey (EICV 5, from 2016/2017). We find that within the context of EICV 5, the first component of this PCA is a strong predictor of household consumption levels: it explains 38% of the variation in the log of household consumption (per adult equivalent). We transfer the PCA model to the student survey, where data was collected on
10
the very same 13 household asset variables, and use it to predict a household assets index. The score we obtain can be thought of as a weighted score of assets. We use this as an approximation of the relative wealth of students in our sample. We divide this index into wealth quintiles to facilitate the analysis and the interpretation of the results.
• A schools facilities index. During the Leaders in Teaching 2020 survey, data was collected on 15 different school-level facilities, including whether schools had a library on site, an indoor and outdoor kitchen, a cafeteria, art and music classrooms, medical facilities, a computer room, and labs. In order to study whether the types of facilities schools offer is associated with numeracy learning outcomes, we create a facilities index using the first component of a PCA applied to these 15 different variables. We find that this index correlates positively with all facilities, except having a girl’s room or an outdoor kitchen which are already ubiquitous in Rwandan secondary schools. The higher the index the more diverse the mix of facilities schools have to offer.
Limitations
There are a number of limitations that are useful to keep in mind as we make our way through this analysis. Selection bias in the student sample. This sample suffers from some level of selection bias, since only students that were present on the day of the assessment participated in the numeracy assessment. We did not conduct re-visits of schools to collect attendance data on students that were not present on the day of the assessment. From field preparation data we know that approximately 9% of students were missing on the day of the survey: 9.2% of female students and 9.9% of male students. The data in this study is representative of students that were present on the day the data was collected; not of all students enrolled in the selected classrooms. This is also the current practice in LARS assessments.
Self-reported data, with inconsistencies. All student-level data captured in the assessment paper and is self-reported. This implies that it was not possible to apply the consistency checks that we would usually implement in a survey. On average the patterns observed in the data are consistent with what we would expect, but there are some exceptions. Where possible, we have dealt with these inconsistencies on a case-by-case basis. Another related issue is that the surveys can contain missing values. While for each individual variable the share of missing values is low, the loss in the number of observations increases when we run regression models that include several student-level variables. For the purposes of this paper, which is descriptive in nature, we do not conduct multiple-imputation on missing values or use weights to rebalance the sample to correct for the potential that values are not missing at random.

11
Instead, regressions are run using categorical variables that include a category for missing values. Limited sampling power to study the association between school-level factors and numeracy assessment scores. Given that we are working with a sample of over 4,000 students, across 100 schools, we have ample statistical power to study student-level statistics. The statistical power to study the link between school-level variables and average assessment scores at the school-level is lower. Nevertheless, this paper reveals some interesting associations that can help readers put student numeracy assessment outcomes into the context of the schools they attend.
12
Discussion This discussion is structured around how student-level factors and school-level factors are associated with numeracy assessment scores in Secondary 3 at the start of the 2020 school year, prior to school-closures due to COVID-19. The first section studies student-level factors. The analysis of student-level factors is based on a regression that assumes fixed effects at the school level. The first topic of focus is differences in the numeracy assessment scores of boys and girls. We then discuss effects related to age and the socio-economic background of students. In this section, we also establish that there are significant differences in the characteristics and numeracy assessment outcomes of students attending day schools and boarding-schools. These are in large part due to the selection process of students into secondary schools at the transition point between primary and secondary. The second section focuses on the link between assessment scores and school characteristics. The analysis of school-level factors relies on a model assuming random effects at the school level. The analysis is run separately for day schools and boarding-schools, because of concerns related to endogeneity with respect to the competitive selection into boarding-schools. In the Rwandan context, there is a lot of overlap between boarding schools and designated schools of excellence: an estimated 4% of day schools in the Leaders in Teaching sample are schools of excellence, compared to 65% of boarding schools. Boarding schools are considered amongst the best in the country and the most competitive in terms of admissions. In this section we study the association between numeracy assessment scores at the start of the school year and metrics related to the qualifications and experience of STEM teachers, the availability of school facilities, as well as pupil-to-teacher and pupil-to-classroom ratios. We close this section with a brief discussion on between school variation in numeracy assessment scores across day- and boarding-schools. Section 1: Student level factors – the distribution of numeracy assessment scores with respect to student characteristics In this section we focus on how student and family characteristics explain within-school variation in numeracy assessment scores. We also explore to what extent differences in the composition of students explains variation in numeracy assessment scores across schools. We estimate the differences in the average numeracy scores of different groups of students using a regression that assumes fixed effects at the school level. Fixed effects imply that the model considers that school averages are fixed and that the school characteristics affect all students in the same way. Fixed effect models measure the effect of differences across students within the same school. It is a
13
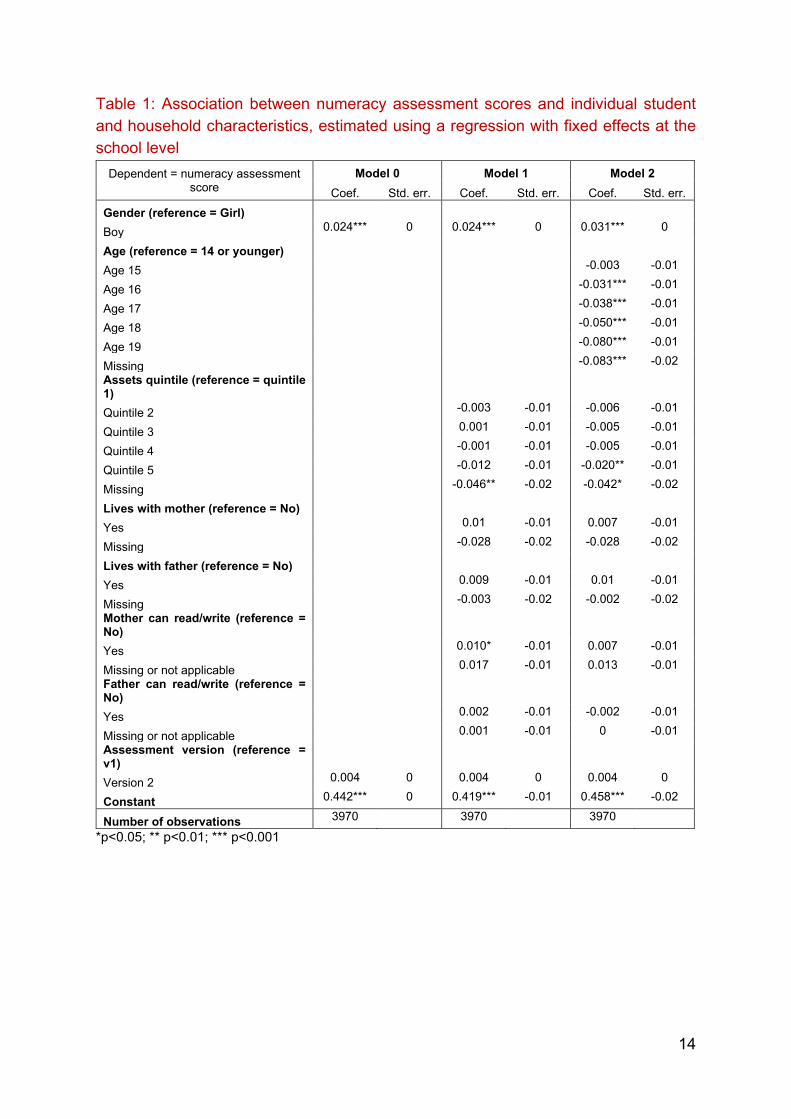
standard model in education research, that is well suited to estimating how individual and family characteristics are associated with learning, and that assumes that school characteristics (including unobserved time invariant factors) are a strong determinant of education outcomes. The key explanatory variables included in this model are: the gender of the students; their age; and household characteristics, such as the asset index in quintiles, whether the student lives with the mother and/or the father, and whether the mother or father can read or write. Data on each of these factors were self-reported by students. Since the data was collected on a paper questionnaire, we were not able to ensure that all students responded to all questions. The dataset contains a small proportion of missing values for each variable, that we have not imputed. We capture missing data by using categorical variables and including a “missing” category. The proportion of missing data is about 1% for the gender variable, 1.5% for the age variable, 2.5% for the assets quintile variable, about 3% for the variables that ask whether the child lives with their mother/father, and about 10% when it comes to whether the mother or father can read and write. In the analysis we only drop students for which the gender is not known; for all other variables, we create a “missing” category. While the proportion of missing values can bias the coefficients we obtain, we believe the risk of bias is small for the key variables of interest in this section (age and the assets quintile) since the proportion of missing values for these variables is low. The regression results are presented in Table 1 and discussed in further detail below, where we also present some context about each topic of discussion.
14
Table 1: Association between numeracy assessment scores and individual student and household characteristics, estimated using a regression with fixed effects at the school level
Dependent = numeracy assessment score
Model 0 Model 1 Model 2 Coef. Std. err. Coef. Std. err. Coef. Std. err.
Gender (reference = Girl)
Boy 0.024*** 0 0.024*** 0 0.031*** 0
Age (reference = 14 or younger)
Age 15
-0.003 -0.01
Age 16
-0.031*** -0.01
Age 17
-0.038*** -0.01
Age 18
-0.050*** -0.01
Age 19
-0.080*** -0.01
Missing
-0.083*** -0.02 Assets quintile (reference = quintile 1)
Quintile 2
-0.003 -0.01 -0.006 -0.01
Quintile 3
0.001 -0.01 -0.005 -0.01
Quintile 4
-0.001 -0.01 -0.005 -0.01
Quintile 5
-0.012 -0.01 -0.020** -0.01
Missing
-0.046** -0.02 -0.042* -0.02
Lives with mother (reference = No)
Yes
0.01 -0.01 0.007 -0.01
Missing
-0.028 -0.02 -0.028 -0.02
Lives with father (reference = No)
Yes
0.009 -0.01 0.01 -0.01
Missing
-0.003 -0.02 -0.002 -0.02 Mother can read/write (reference = No)
Yes
0.010* -0.01 0.007 -0.01
Missing or not applicable
0.017 -0.01 0.013 -0.01 Father can read/write (reference = No)
Yes
0.002 -0.01 -0.002 -0.01
Missing or not applicable
0.001 -0.01 0 -0.01 Assessment version (reference = v1)
Version 2 0.004 0 0.004 0 0.004 0
Constant 0.442*** 0 0.419*** -0.01 0.458*** -0.02
Number of observations 3970
3970
3970
*p<0.05; ** p<0.01; *** p<0.001
15
Finding 1: On average, at the start of the academic year in Secondary 3, girls have slightly lower numeracy assessment scores than boys An estimated 56.5% of the students enrolled in secondary schools in Leaders in Teaching districts are girls, 43.5% are boys. This is consistent with data from Ministry of Education’s (MINEDUC) latest education statistical yearbook, which states that an estimated 54.4% of students in Secondary 3 in 2019 were female (Rwandan Ministry of Education, 2019b). As such, there are many more female students in Secondary 3 than there are male students, a gap in enrolment that often goes unnoticed in the policy discussions around gender and secondary education in the Rwandan context. This discussion is also important in the context of the pipeline into the workforce, in particular in the secondary education sector, where the vast majority of STEM teachers and school leaders are male. On average, girls in our sample have lower numeracy assessment scores than boys at the start of the school year. The gender gap in numeracy scores between boys and girls is about 3.1 percentage points, which corresponds to a difference of about 0.20 standard deviations (see regression results in Table 1). The gender gap in numeracy assessment scores in both day schools and boarding schools is statistically significant at the 1% level. The gender-gap in numeracy assessment scores at the start of the academic year varies by school, with boys achieving higher scores in about 75% of schools. We find that the difference in the numeracy outcomes between boys and girls holds across all age groups, wealth quintiles, and school categorisations – whether we group schools by their average wealth, size, their average numeracy assessment score, or their average age. It is important to put these results into the context of the gender balance – in terms of enrolment - in lower secondary education. While on average boys have higher numeracy assessment scores than girls, we ask whether this is also true in terms of aggregate numbers: among the best students, are there more boys than girls? To answer this question, we divide the numeracy assessment scores of all students into five groups of equal size, from the lowest to the highest performing group (we refer to these groups as assessment quintiles). We find that there are more girls across assessment quintiles one to four, and as many girls as there are boys in the highest assessment quintile (see Table 2). The proportion of girls reduces as we move from the lowest assessment quintile, where 60% of students are female, to the highest assessment quintile, where 48.4% of students are female. The difference in the proportion of girls and boys in the highest assessment quintile (48.4% of girls versus
16
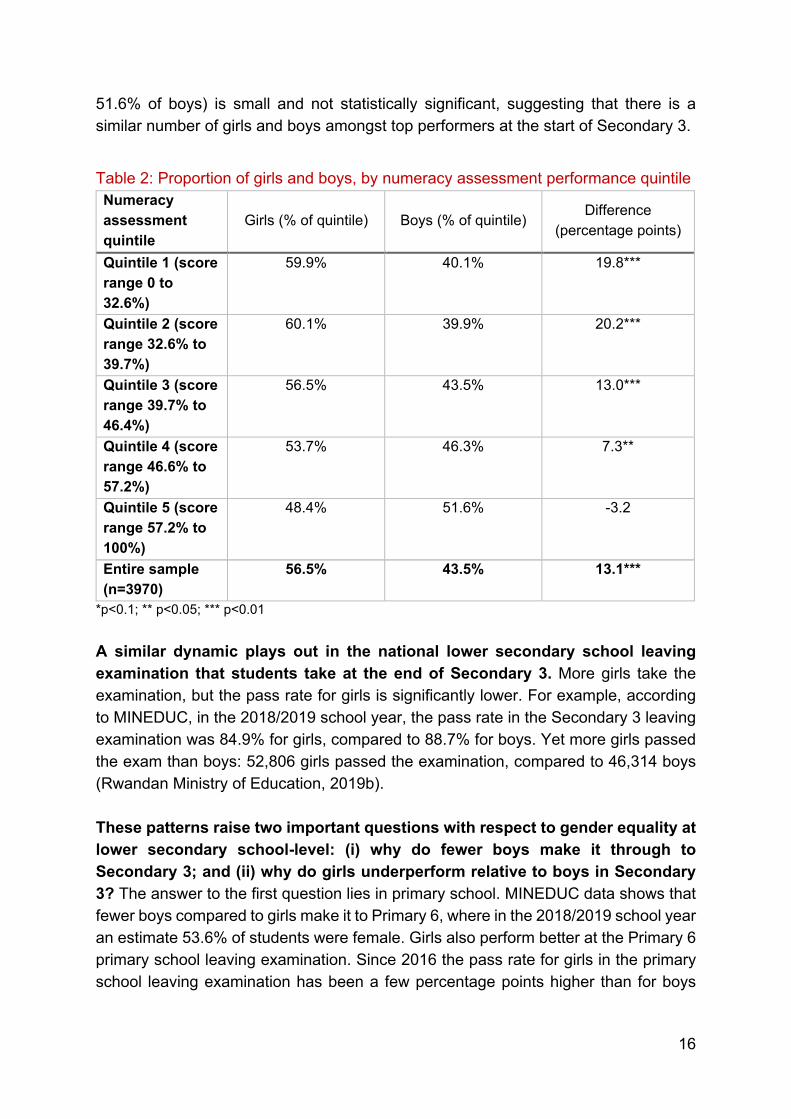
51.6% of boys) is small and not statistically significant, suggesting that there is a similar number of girls and boys amongst top performers at the start of Secondary 3.
Table 2: Proportion of girls and boys, by numeracy assessment performance quintile Numeracy assessment quintile
Girls (% of quintile) Boys (% of quintile) Difference
(percentage points)
Quintile 1 (score range 0 to 32.6%)
59.9% 40.1% 19.8***
Quintile 2 (score range 32.6% to 39.7%)
60.1% 39.9% 20.2***
Quintile 3 (score range 39.7% to 46.4%)
56.5% 43.5% 13.0***
Quintile 4 (score range 46.6% to 57.2%)
53.7% 46.3% 7.3**
Quintile 5 (score range 57.2% to 100%)
48.4% 51.6% -3.2
Entire sample (n=3970)
56.5% 43.5% 13.1***
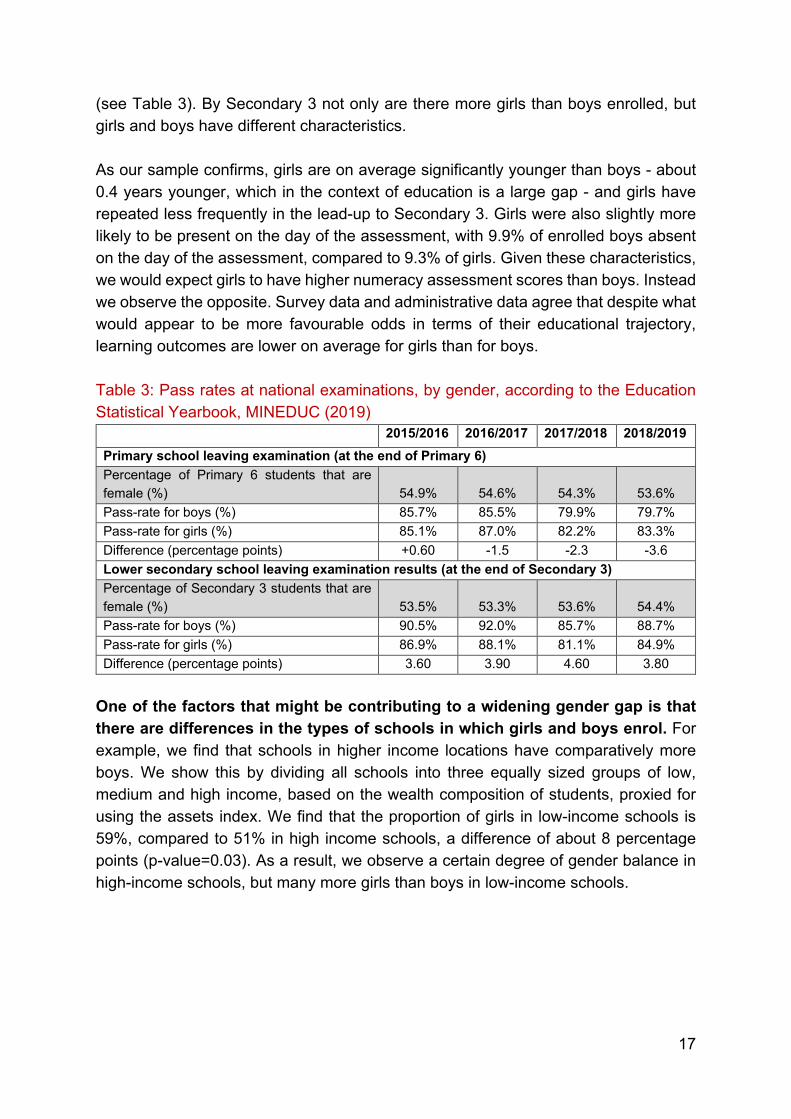
*p<0.1; ** p<0.05; *** p<0.01 A similar dynamic plays out in the national lower secondary school leaving examination that students take at the end of Secondary 3. More girls take the examination, but the pass rate for girls is significantly lower. For example, according to MINEDUC, in the 2018/2019 school year, the pass rate in the Secondary 3 leaving examination was 84.9% for girls, compared to 88.7% for boys. Yet more girls passed the exam than boys: 52,806 girls passed the examination, compared to 46,314 boys (Rwandan Ministry of Education, 2019b). These patterns raise two important questions with respect to gender equality at lower secondary school-level: (i) why do fewer boys make it through to Secondary 3; and (ii) why do girls underperform relative to boys in Secondary 3? The answer to the first question lies in primary school. MINEDUC data shows that fewer boys compared to girls make it to Primary 6, where in the 2018/2019 school year an estimate 53.6% of students were female. Girls also perform better at the Primary 6 primary school leaving examination. Since 2016 the pass rate for girls in the primary school leaving examination has been a few percentage points higher than for boys
17
(see Table 3). By Secondary 3 not only are there more girls than boys enrolled, but girls and boys have different characteristics. As our sample confirms, girls are on average significantly younger than boys - about 0.4 years younger, which in the context of education is a large gap - and girls have repeated less frequently in the lead-up to Secondary 3. Girls were also slightly more likely to be present on the day of the assessment, with 9.9% of enrolled boys absent on the day of the assessment, compared to 9.3% of girls. Given these characteristics, we would expect girls to have higher numeracy assessment scores than boys. Instead we observe the opposite. Survey data and administrative data agree that despite what would appear to be more favourable odds in terms of their educational trajectory, learning outcomes are lower on average for girls than for boys. Table 3: Pass rates at national examinations, by gender, according to the Education Statistical Yearbook, MINEDUC (2019) 2015/2016 2016/2017 2017/2018 2018/2019 Primary school leaving examination (at the end of Primary 6) Percentage of Primary 6 students that are female (%) 54.9% 54.6% 54.3% 53.6% Pass-rate for boys (%) 85.7% 85.5% 79.9% 79.7% Pass-rate for girls (%) 85.1% 87.0% 82.2% 83.3% Difference (percentage points) +0.60 -1.5 -2.3 -3.6 Lower secondary school leaving examination results (at the end of Secondary 3) Percentage of Secondary 3 students that are female (%) 53.5% 53.3% 53.6% 54.4% Pass-rate for boys (%) 90.5% 92.0% 85.7% 88.7% Pass-rate for girls (%) 86.9% 88.1% 81.1% 84.9% Difference (percentage points) 3.60 3.90 4.60 3.80
One of the factors that might be contributing to a widening gender gap is that there are differences in the types of schools in which girls and boys enrol. For example, we find that schools in higher income locations have comparatively more boys. We show this by dividing all schools into three equally sized groups of low, medium and high income, based on the wealth composition of students, proxied for using the assets index. We find that the proportion of girls in low-income schools is 59%, compared to 51% in high income schools, a difference of about 8 percentage points (p-value=0.03). As a result, we observe a certain degree of gender balance in high-income schools, but many more girls than boys in low-income schools.

18
Finding 2: Age is a strong predictor of numeracy assessment scores both within and across schools Across genders there is high variation in the age composition of students in Secondary 3 at the start of the school year. The expected age for students entering Secondary 3 is 15, assuming that students start their education at age 7. Ages in Secondary 3 at the start of the school year span from 14 or below (about 8.4% of students) to 19 or above (an estimated 8.8% of students). For the purposes of this study, we define students as being overaged – or significantly older than the expected age for their grade - if they are 17 or older at the start of Secondary 3. Around 38% of girls and 50% of boys in our sample are overaged. Over-aging affects the majority of students from low-income families. We estimate that 56% of students from the lowest assets quintile are overaged, compared to 31% of students from the highest assets quintile. Age is a very strong predictor of educational outcomes at two levels:
• Age is a strong predictor of entry into boarding schools, which have the highest academic performance;
• Age is also a strong predictor of differences in numeracy assessment outcomes between students within schools.
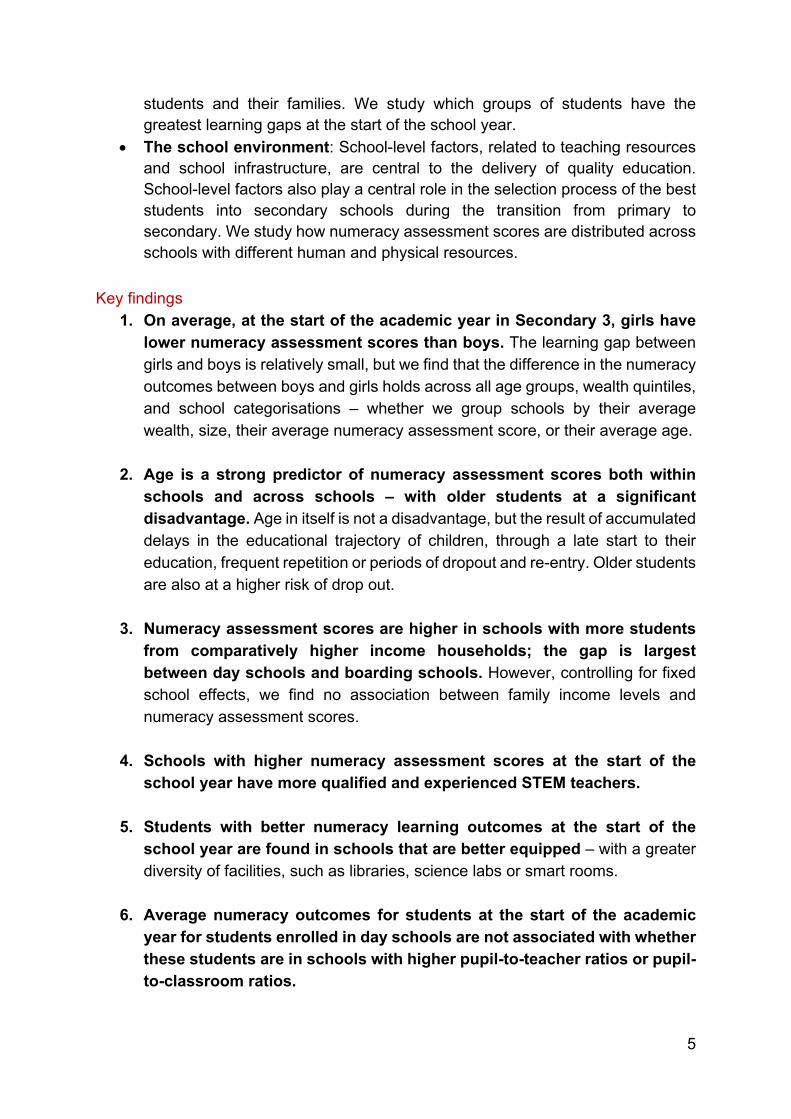
The average age of students is lower in the top performing schools, namely boarding schools. This is because the selection process into the top schools is highly competitive in the transition from primary to secondary, and because the top performing students are comparatively young: they are on track with their education and have not accumulated delays. The average age of students, by school, captures information about their educational trajectory. Students that are overaged have accumulated delays in their education, be it through frequent repetition, drop out and re-entry or a late start to their education. Most of the delays that students have accumulated will have occurred in primary school. Repetition levels are comparatively lower at secondary school level (at O-level): the average repetition rate across the three grades of lower secondary schools was 5% in 2018/2019 (Rwandan Ministry of Education, 2019b) compared to 10% on average for the six grades of primary school. The average age of students can therefore be considered an imperfect proxy for how competitive selection into secondary schools was at entry. We assume that schools with the youngest students were also the most competitive to get into after the primary school leaving examination. We find that students in the top performing schools, almost all of which are boarding schools, are younger on average than in other schools. This is consistent with a more competitive selection process at entry. In addition, we find that that the average age of students is strongly predictive of differences in numeracy assessment scores between boarding schools,
19
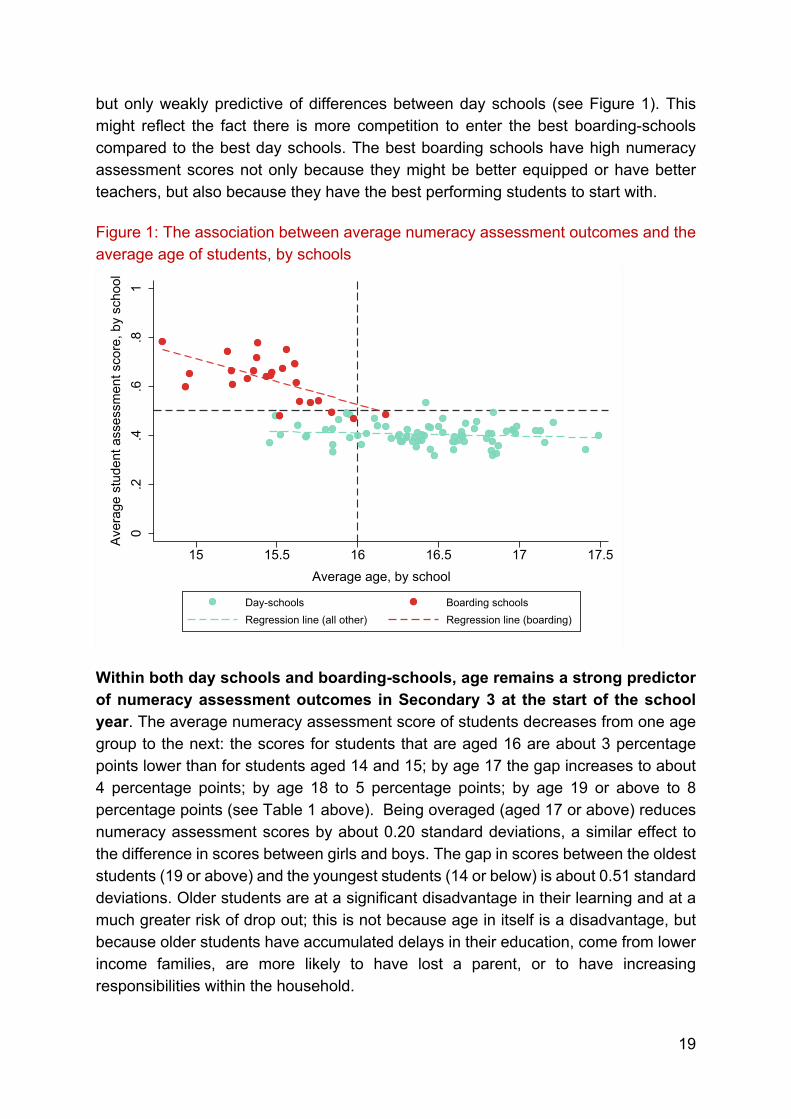
but only weakly predictive of differences between day schools (see Figure 1). This might reflect the fact there is more competition to enter the best boarding-schools compared to the best day schools. The best boarding schools have high numeracy assessment scores not only because they might be better equipped or have better teachers, but also because they have the best performing students to start with. Figure 1: The association between average numeracy assessment outcomes and the average age of students, by schools
Within both day schools and boarding-schools, age remains a strong predictor of numeracy assessment outcomes in Secondary 3 at the start of the school year. The average numeracy assessment score of students decreases from one age group to the next: the scores for students that are aged 16 are about 3 percentage points lower than for students aged 14 and 15; by age 17 the gap increases to about 4 percentage points; by age 18 to 5 percentage points; by age 19 or above to 8 percentage points (see Table 1 above). Being overaged (aged 17 or above) reduces numeracy assessment scores by about 0.20 standard deviations, a similar effect to the difference in scores between girls and boys. The gap in scores between the oldest students (19 or above) and the youngest students (14 or below) is about 0.51 standard deviations. Older students are at a significant disadvantage in their learning and at a much greater risk of drop out; this is not because age in itself is a disadvantage, but because older students have accumulated delays in their education, come from lower income families, are more likely to have lost a parent, or to have increasing responsibilities within the household.
0.2
.4.6
.81
Aver
age
stud
ent a
sses
smen
t sco
re, b
y sc
hool
15 15.5 16 16.5 17 17.5Average age, by school
Day-schools Boarding schoolsRegression line (all other) Regression line (boarding)
20
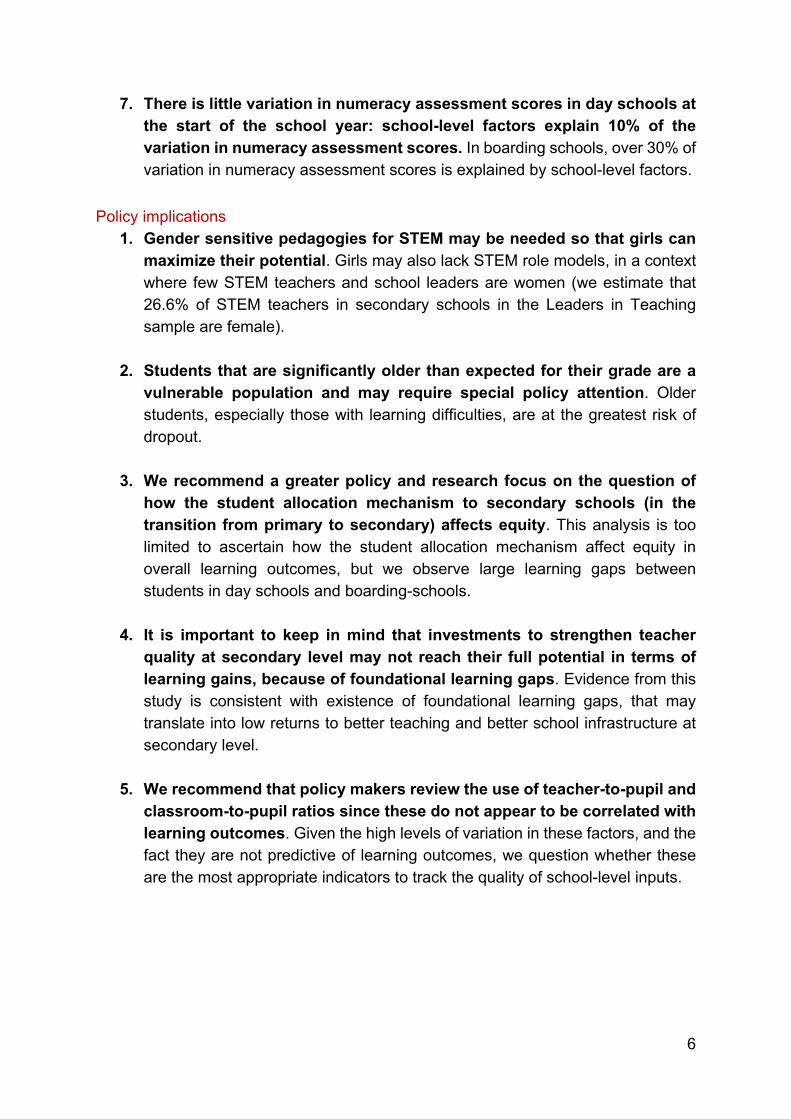
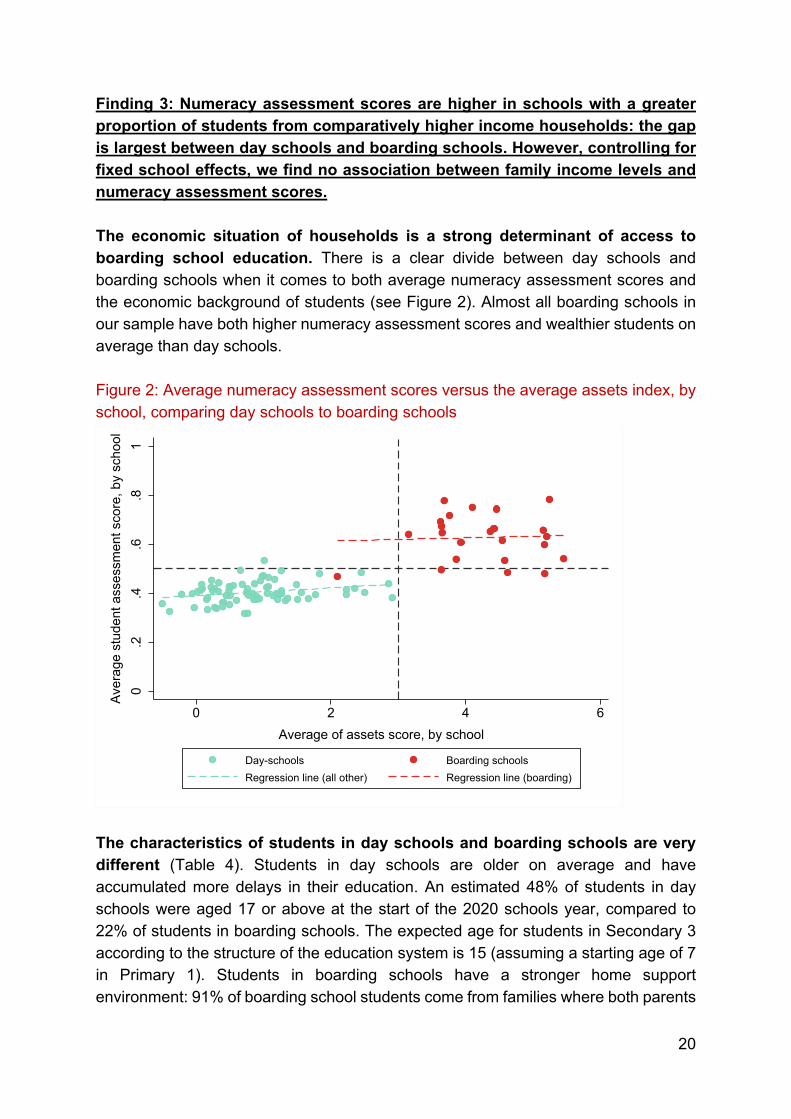
Finding 3: Numeracy assessment scores are higher in schools with a greater proportion of students from comparatively higher income households: the gap is largest between day schools and boarding schools. However, controlling for fixed school effects, we find no association between family income levels and numeracy assessment scores. The economic situation of households is a strong determinant of access to boarding school education. There is a clear divide between day schools and boarding schools when it comes to both average numeracy assessment scores and the economic background of students (see Figure 2). Almost all boarding schools in our sample have both higher numeracy assessment scores and wealthier students on average than day schools. Figure 2: Average numeracy assessment scores versus the average assets index, by school, comparing day schools to boarding schools
The characteristics of students in day schools and boarding schools are very different (Table 4). Students in day schools are older on average and have accumulated more delays in their education. An estimated 48% of students in day schools were aged 17 or above at the start of the 2020 schools year, compared to 22% of students in boarding schools. The expected age for students in Secondary 3 according to the structure of the education system is 15 (assuming a starting age of 7 in Primary 1). Students in boarding schools have a stronger home support environment: 91% of boarding school students come from families where both parents
0.2
.4.6
.81
Aver
age
stud
ent a
sses
smen
t sco
re, b
y sc
hool
0 2 4 6Average of assets score, by school
Day-schools Boarding schoolsRegression line (all other) Regression line (boarding)

21
can read and write, compared to 70% in the case of day school students. Almost half of boarding school students come from families in the wealthiest asset quintile index, compared to 11% of students in day schools. These differences are reflective of existing gaps in learning outcomes between students of different socio-economic backgrounds in primary school; and of the affordability of boarding schools, which despite subsidised costs, do require students to pay fees (there are no direct tuition fees for day schools). This creates a significant barrier for students from lower income households. The one variable where we would have expected to find a difference between day schools and boarding schools, but we do not, is the gender composition of students. We anticipated finding a higher proportion of girls in boarding schools considering the fact that since 2016/2017 girls have had higher pass rates in the primary school leaving examination compared to boys. The fact that this is not the case, and that girls and boys are equally likely to be enrolled in day schools and boarding schools, suggests that there might be other reasons – in addition to academic performance – that determine whether children apply to boarding schools. Table 4: Average student characteristics in boarding schools and day schools Indicator Boarding-schools Day schools p-value Share of boys (% sample) 44.3% 43.6% 0.87
Average age 15.56 16.48 0.000 % of overaged students (aged 17 or above)
21.8% 47.6% 0.000
Lives with both parents (% students)
81.5% 70.7% 0.002
Both parents can read and write (% students)
91.4% 69.5% 0.000
% of students from wealthiest asset quintile
49.3% 11.0% 0.000
% of students that never repeated
36.6% 21.8% 0.001
Learning outcomes in boarding schools are structurally higher than in day schools. The average numeracy assessment score in boarding schools was about 20
22
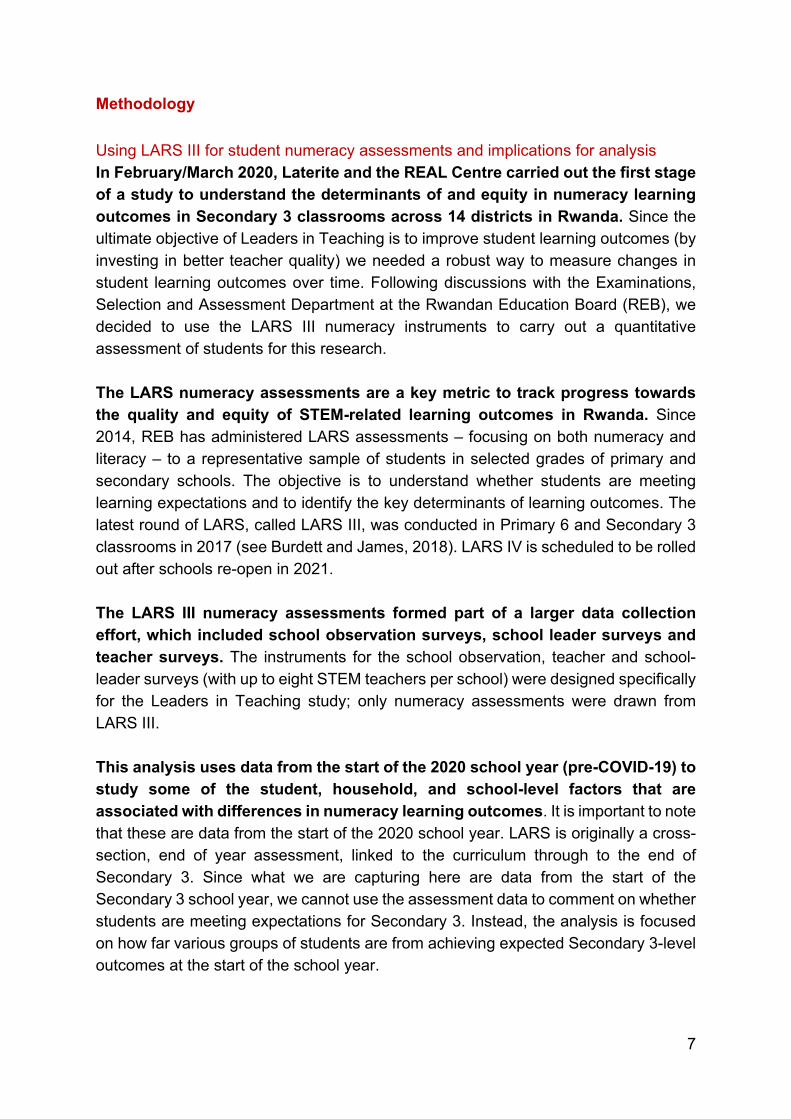
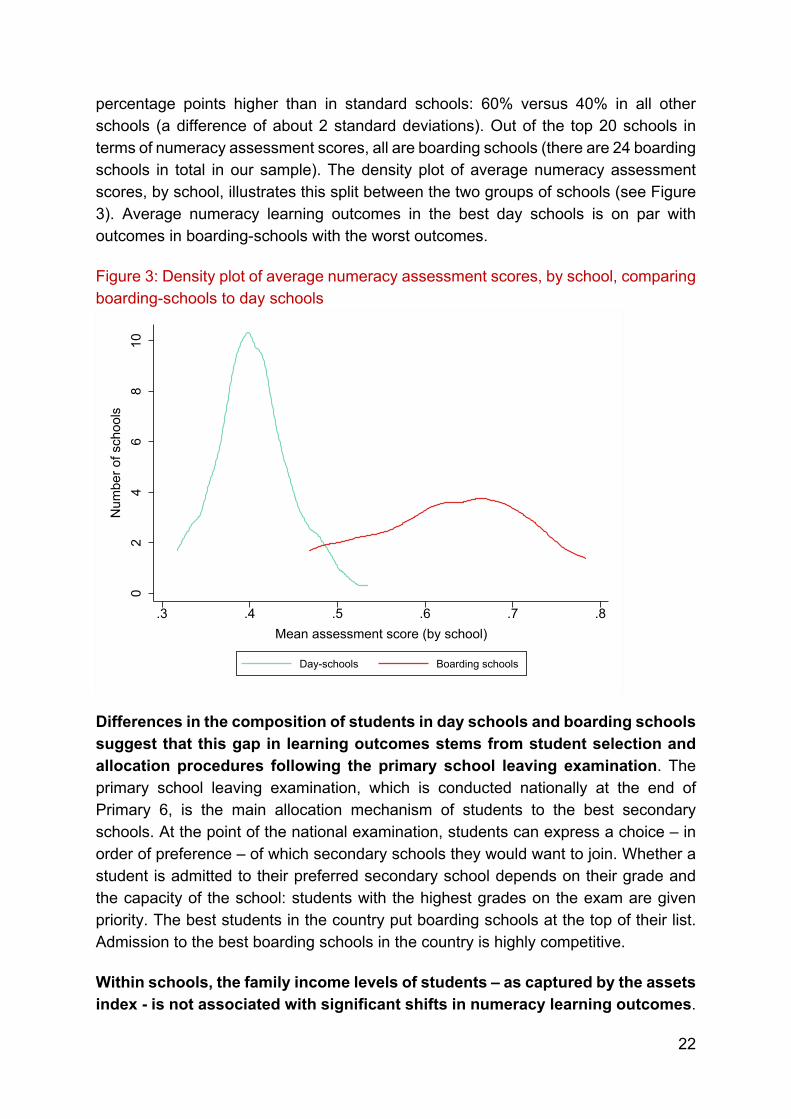
percentage points higher than in standard schools: 60% versus 40% in all other schools (a difference of about 2 standard deviations). Out of the top 20 schools in terms of numeracy assessment scores, all are boarding schools (there are 24 boarding schools in total in our sample). The density plot of average numeracy assessment scores, by school, illustrates this split between the two groups of schools (see Figure 3). Average numeracy learning outcomes in the best day schools is on par with outcomes in boarding-schools with the worst outcomes. Figure 3: Density plot of average numeracy assessment scores, by school, comparing boarding-schools to day schools
Differences in the composition of students in day schools and boarding schools suggest that this gap in learning outcomes stems from student selection and allocation procedures following the primary school leaving examination. The primary school leaving examination, which is conducted nationally at the end of Primary 6, is the main allocation mechanism of students to the best secondary schools. At the point of the national examination, students can express a choice – in order of preference – of which secondary schools they would want to join. Whether a student is admitted to their preferred secondary school depends on their grade and the capacity of the school: students with the highest grades on the exam are given priority. The best students in the country put boarding schools at the top of their list. Admission to the best boarding schools in the country is highly competitive. Within schools, the family income levels of students – as captured by the assets index - is not associated with significant shifts in numeracy learning outcomes.
02
46
810
Num
ber o
f sch
ools
.3 .4 .5 .6 .7 .8Mean assessment score (by school)
Day-schools Boarding schools

23
We have seen that the socio-economic background of students is a key determinant of intake into boarding-schools versus day schools, and that day schools with higher numeracy assessment scores also have students from comparatively wealthier families on average. However, within schools, differences in the assets index are not associated with measurable changes in numeracy assessment scores. Potential explanations include: (i) the fact that our assets index might not capture subtle differences in the socio-economic status of students within schools; (ii) the fact that there might be strong selection processes at play – students of similar levels self-select into schools, due to the student allocation process, irrespective of family income levels; or (iii) the fact that school level effects are strong, with homogeneity within classrooms across students from different family backgrounds. Section 2: School-level factors - the distribution of numeracy assessment scores at the start of the school year with respect to school characteristics To explore the association between school-level characteristics and numeracy assessment scores, we revert to studying the data through the lens of a mixed model, with random effects at the school level. So far, we have studied the association between individual student characteristics and numeracy assessment scores at the start of the school year using a fixed effects model. The model with fixed effects treats the school-level residual in the regression as a nuisance parameter to adjust for. It assumes that students are clustered within schools and that school means are fixed. As such it is not possible to use such models to gain insights into the association between school level variables and numeracy outcomes, because these are immediately averaged out of the regression. In random effects models, school characteristics are not fixed but rather considered to be randomly sampled from a population of schools. Variations in the school characteristics can therefore also play a role as explanatory variables to explore between-school differences. While more efficient from a statistical perspective, random effects models come with stronger assumptions. The random effects assumption consists of saying that the individual regression error term – which captures model errors in the individual estimation of numeracy assessment scores – is uncorrelated with the explanatory variables in the model, be they at the student, family or school level. We know that errors can be driven by unobserved variables, for example school characteristics such as teacher quality or the quality of facilities. The random effects assumption would therefore imply that these unobserved school characteristics are not correlated with pupil, family or school characteristic (see Clarke et al. 2010). We know this to be untrue in the Rwandan context, because of the competitive selection of students into secondary schools.
24
To ensure that the random effects assumption holds, we make two adjustments to the model: (i) we conduct sub-group analysis, conducting the analysis separately for day schools and boarding schools; and (ii) we add controls for school-characteristics, that capture information about the school selection process and parents’ choices. We decide to study day schools and boarding schools separately, because competition to get into day schools is significantly lower than in boarding schools. Parents will send their children across the country to attend the best boarding schools; but in the case of day schools, where variation in average numeracy assessment scores is significantly lower, parents might prioritise proximity – and the affordability of sending their children to school - over relatively small differences in school quality or performance. We justify this decision analytically using a Hausman test. A Hausman test allows us to compare regression coefficients obtained using a random effects and a fixed effects model. We know that when the random effects assumption holds, both models should converge towards similar estimates. The Hausman test revels that the random effects assumption does not hold when all schools are included in the sample; but that when we focus the analysis on day schools or boarding schools separately, there is convergence between the estimates obtained using the fixed and random effects models. Following Clarke et al. (2010), we also decide to introduce school-level variables as controls to capture information about two sets of factors: (i) factors that directly or indirectly capture information about the school-selection process; and (ii) observable school characteristics that might influence parents’ choices for their children. We capture information about the school selection process using the average age and assets score of students: we have seen how the average age of students can be used as a proxy at the school level to capture the level of competition at entry in the transition from primary to secondary school. We have also seen that the family income of students can play an important role in determining which school they go to, potentially also because the parents of students from higher income families can afford to send their children to further away, but better, schools. To capture information about school characteristics that are observable to parents and students and that might influence their choices, we add to our model data on: (i) the diversity of school facilities; (ii) a proxy for teacher qualifications and experience; (iii) resource adequacy indicators, such as pupil-to-teacher and pupil-to-classroom ratios; and (iv) whether the school includes A-level education. For the boarding school model we use a reduced number of indicators, in order not to over-fit the model, since we are working with only 24 boarding schools. With few degrees of freedom, the results for this sub-group analysis are also less reliable.

25
Regression results for day schools are summarised in Table 5; regression results for boarding schools can be found in Table 6. We discuss the results of the analysis below, while also presenting some context on each of the topics of focus, namely: teacher qualifications and experience and school facilities; pupil-to-teacher and pupil-to-classroom ratios. We also discuss one of the outputs of these regression models, which is an estimate of between and within school variation in day schools and boarding-schools. Table 5: Association between numeracy assessment scores and individual, household and school characteristics in day schools, estimated using a regression with random effects at the school level
Dependent = numeracy assessment score
Model 0 Model 1 Model 2 Coef. Std. err. Coef. Std. err. Coef. Std. err.
Gender (reference = Girl) Boy 0.025*** 0 0.025*** 0 0.025*** 0 Age (reference = 14 or younger) Age 15 0 (0.01) 0 (0.01) 0 (0.01)
Age 16 -0.027** -(0.01) -0.026* -(0.01) -0.026** -(0.01)
Age 17 -0.033*** -(0.01) -0.033** -(0.01) -0.033*** -(0.01)
Age 18 -0.050*** -(0.01) -0.049*** -(0.01) -0.050*** -(0.01)
Age 19 -0.077*** -(0.01) -0.076*** -(0.01) -0.077*** -(0.01)
Missing -0.083** -(0.03) -0.081** -(0.03) -0.082** -(0.03) Assets quintile (reference = quintile 1) Quintile 2 -0.007 (0.00) -0.006 (0.00) -0.006 (0.00) Quintile 3 -0.005 -(0.01) -0.005 -(0.01) -0.005 -(0.01) Quintile 4 -0.005 -(0.01) -0.004 -(0.01) -0.005 -(0.01) Quintile 5 -0.014 -(0.01) -0.012 -(0.01) -0.014 -(0.01) Missing 0 (.) 0 (.) 0 (.) Assessment version Version 2 0.005 (0.00) 0.005 (0.00) 0.005 (0.00) School characteristics Average age of students 0.005 -(0.01) 0.013 -(0.01) Average assets index of students 0.015** -(0.01) 0.009 -(0.01) Average salary 0.085 -(0.05) 0.096* -(0.05) School facilities index 0.027* -(0.01) 0.025* -(0.01) Pupil to STEM teacher ratio 0.00 (0.00) 0.00 (0.00) Pupil to classrooms ratio 0.00 (0.00) 0.00 (0.00) Does the school provide S4-S6 classes? 0.002 -(0.01) -0.001 -(0.01) Constant 0.331* -(0.17) 0.298*** -(0.05) 0.079 -(0.19)
Number of observations 3110 3110 3110
26
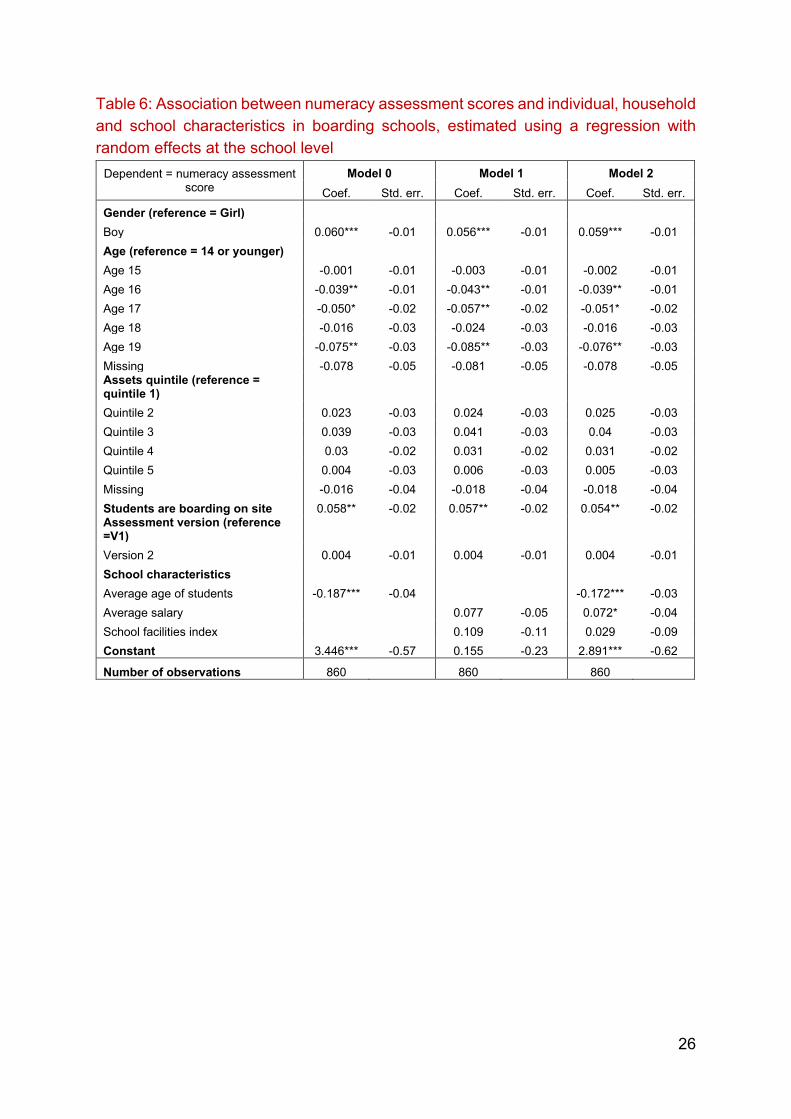
Table 6: Association between numeracy assessment scores and individual, household and school characteristics in boarding schools, estimated using a regression with random effects at the school level
Dependent = numeracy assessment score
Model 0 Model 1 Model 2 Coef. Std. err. Coef. Std. err. Coef. Std. err.
Gender (reference = Girl) Boy 0.060*** -0.01 0.056*** -0.01 0.059*** -0.01 Age (reference = 14 or younger) Age 15 -0.001 -0.01 -0.003 -0.01 -0.002 -0.01 Age 16 -0.039** -0.01 -0.043** -0.01 -0.039** -0.01 Age 17 -0.050* -0.02 -0.057** -0.02 -0.051* -0.02 Age 18 -0.016 -0.03 -0.024 -0.03 -0.016 -0.03 Age 19 -0.075** -0.03 -0.085** -0.03 -0.076** -0.03 Missing -0.078 -0.05 -0.081 -0.05 -0.078 -0.05 Assets quintile (reference = quintile 1) Quintile 2 0.023 -0.03 0.024 -0.03 0.025 -0.03 Quintile 3 0.039 -0.03 0.041 -0.03 0.04 -0.03 Quintile 4 0.03 -0.02 0.031 -0.02 0.031 -0.02 Quintile 5 0.004 -0.03 0.006 -0.03 0.005 -0.03 Missing -0.016 -0.04 -0.018 -0.04 -0.018 -0.04 Students are boarding on site 0.058** -0.02 0.057** -0.02 0.054** -0.02 Assessment version (reference =V1) Version 2 0.004 -0.01 0.004 -0.01 0.004 -0.01 School characteristics Average age of students -0.187*** -0.04 -0.172*** -0.03 Average salary 0.077 -0.05 0.072* -0.04 School facilities index 0.109 -0.11 0.029 -0.09 Constant 3.446*** -0.57 0.155 -0.23 2.891*** -0.62
Number of observations 860 860 860

27
Finding 4: Schools with higher numeracy assessment scores at the start of the school year have more qualified and experienced STEM teachers
The average qualifications of STEM teachers and their educational experience are potentially important indicators of the professional quality of teachers. There are many ways in which student numeracy assessment scores and the qualifications/experience of teachers might be associated: parents and students might seek out schools with better qualified teachers; the best schools might try to recruit and attract the best teachers; teachers might aspire to be recruited into the best performing or most prestigious schools; and more qualified and experienced teachers might create a more conducive environment for learning to take place (see for example Westbrook, 2013; Coe, 2014; Bold, 2017; Molina, 2018). To explore whether schools with comparatively higher numeracy assessment scores at the start of the school year also tend to have more qualified teachers, we proxy for the combined effects of STEM teacher qualifications and experience using their self-reported remuneration. In public and government-aided secondary schools, teacher pay is based on a matrix that takes into account the level of education and the experience of teachers. The salary of teachers can therefore be used to proxy for their combined experience and formal education training. Teacher wages might not only capture information about the qualifications and experience of teachers, but also information about, for example, teacher performance (promotions or bonuses); their gender; or about the ability of schools, especially private schools, to pay higher salaries. Regression analysis suggests that about 30% of the variation in teacher remuneration in our sample is explained by their qualifications and experience. It is an imperfect proxy, but a useful one in the context of this analysis since we do not have enough degrees of freedom at the school level to control for the average education level, experience and other characteristics of teachers. In the Leaders in Teaching teacher survey, STEM teachers that were surveyed were asked to categorise their salary into one of five groups ranging from less than RWF 25,000 (corresponding to category 1) to more than RWF 150,000 per month (category 5). We use the average of this ordered categorical variable, across all STEM teachers that were interviewed in a school, as our relative estimate of STEM teacher wages in the schools in our sample. We find that the average wage of STEM teachers is positively associated with student numeracy assessment scores in both boarding and non-boarding schools; but the association in day schools is smaller. We show this graphically in Figure 4. We find consistent results when we replace teacher salary levels in the regression with other metrics related to teacher qualifications, for example the proportion of teachers with a Bachelor’s degree or the number of years of teaching

28
experience, albeit with lower statistical significance levels (in part because of the characteristics of these variables). Figure 4: Average numeracy assessment scores and average STEM teacher salary, by schools, in day schools and boarding-schools
To put this result into context, it is important to remember that teacher qualifications are not equally distributed across schools. Using the STEM teacher survey, across all 353 Leaders in Teaching schools for which teacher data is available, we find that the proportion of teachers with A0-level education (in the Rwandan context, this corresponds to a Bachelor’s degree or above) is higher in secondary schools that include upper secondary classes (A-level) and do not stop at lower secondary school (O-level). The same holds true for teacher pay. We estimate that 50.8% of STEM teachers in schools that do not teach beyond Secondary 3 have A0-level education; compared to 66.8% of STEM teachers in schools that include upper secondary education. This is due to the fact that in order to be qualified to teach at upper-secondary school level teachers require A0-level education; this is not the case in lower-secondary education. Students enrolled in schools that also include A0-level education therefore have access to more qualified STEM teachers. We also observe that the proportion of teachers with A0-level education is higher in boarding schools and in schools that have more diverse facilities. If both better-performing students and more qualified teachers are accepted/recruited into the same
0.2
.4.6
.81
Aver
age
stud
ent a
sses
smen
t sco
re, b
y sc
hool
2 3 4 5Average teacher salary category, by school
Day-schools Boarding schoolsRegression line (all other) Regression line (boarding)
29
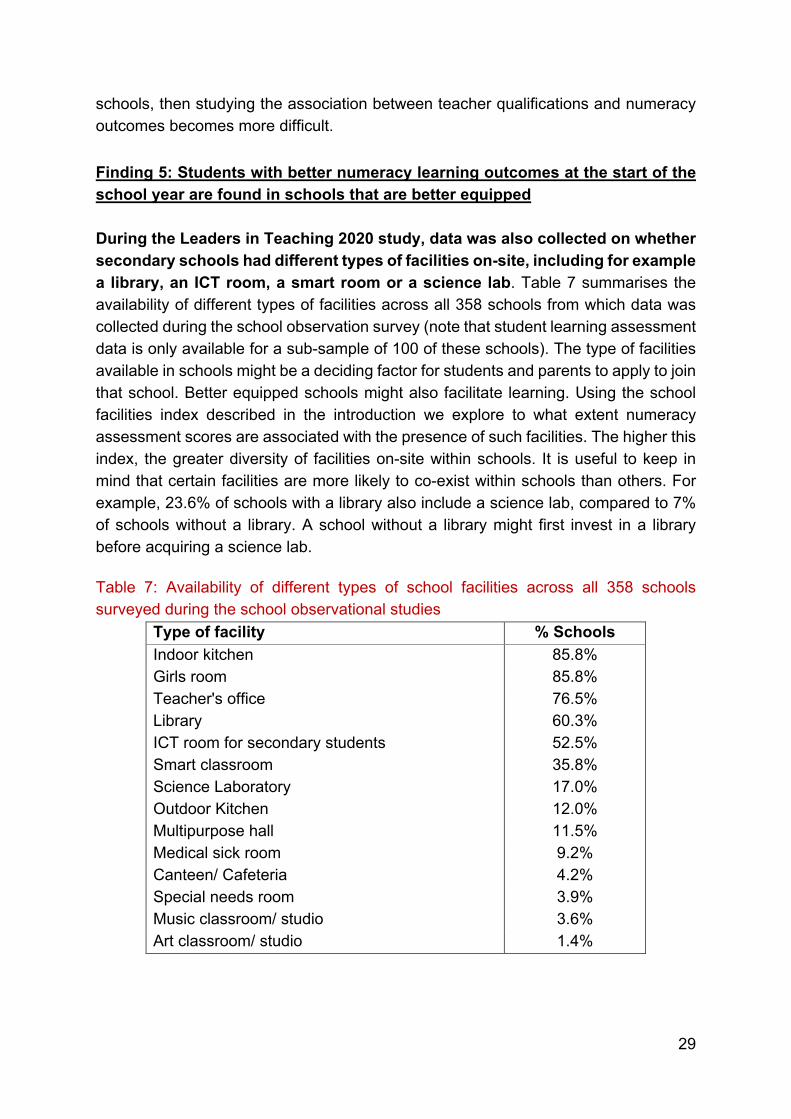
schools, then studying the association between teacher qualifications and numeracy outcomes becomes more difficult. Finding 5: Students with better numeracy learning outcomes at the start of the school year are found in schools that are better equipped During the Leaders in Teaching 2020 study, data was also collected on whether secondary schools had different types of facilities on-site, including for example a library, an ICT room, a smart room or a science lab. Table 7 summarises the availability of different types of facilities across all 358 schools from which data was collected during the school observation survey (note that student learning assessment data is only available for a sub-sample of 100 of these schools). The type of facilities available in schools might be a deciding factor for students and parents to apply to join that school. Better equipped schools might also facilitate learning. Using the school facilities index described in the introduction we explore to what extent numeracy assessment scores are associated with the presence of such facilities. The higher this index, the greater diversity of facilities on-site within schools. It is useful to keep in mind that certain facilities are more likely to co-exist within schools than others. For example, 23.6% of schools with a library also include a science lab, compared to 7% of schools without a library. A school without a library might first invest in a library before acquiring a science lab. Table 7: Availability of different types of school facilities across all 358 schools surveyed during the school observational studies
Type of facility % Schools Indoor kitchen 85.8% Girls room 85.8% Teacher's office 76.5% Library 60.3% ICT room for secondary students 52.5% Smart classroom 35.8% Science Laboratory 17.0% Outdoor Kitchen 12.0% Multipurpose hall 11.5% Medical sick room 9.2% Canteen/ Cafeteria 4.2% Special needs room 3.9% Music classroom/ studio 3.6% Art classroom/ studio 1.4%
30
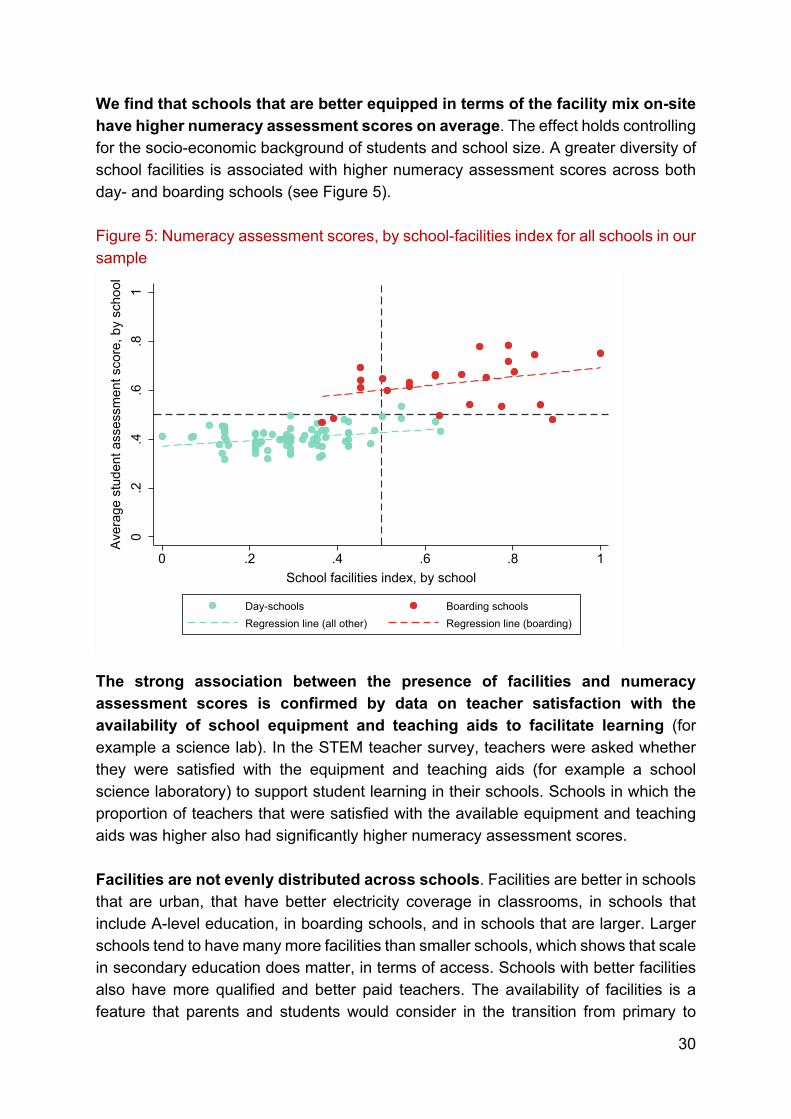
We find that schools that are better equipped in terms of the facility mix on-site have higher numeracy assessment scores on average. The effect holds controlling for the socio-economic background of students and school size. A greater diversity of school facilities is associated with higher numeracy assessment scores across both day- and boarding schools (see Figure 5). Figure 5: Numeracy assessment scores, by school-facilities index for all schools in our sample
The strong association between the presence of facilities and numeracy assessment scores is confirmed by data on teacher satisfaction with the availability of school equipment and teaching aids to facilitate learning (for example a science lab). In the STEM teacher survey, teachers were asked whether they were satisfied with the equipment and teaching aids (for example a school science laboratory) to support student learning in their schools. Schools in which the proportion of teachers that were satisfied with the available equipment and teaching aids was higher also had significantly higher numeracy assessment scores. Facilities are not evenly distributed across schools. Facilities are better in schools that are urban, that have better electricity coverage in classrooms, in schools that include A-level education, in boarding schools, and in schools that are larger. Larger schools tend to have many more facilities than smaller schools, which shows that scale in secondary education does matter, in terms of access. Schools with better facilities also have more qualified and better paid teachers. The availability of facilities is a feature that parents and students would consider in the transition from primary to
0.2
.4.6
.81
Aver
age
stud
ent a
sses
smen
t sco
re, b
y sc
hool
0 .2 .4 .6 .8 1School facilities index, by school
Day-schools Boarding schoolsRegression line (all other) Regression line (boarding)

31
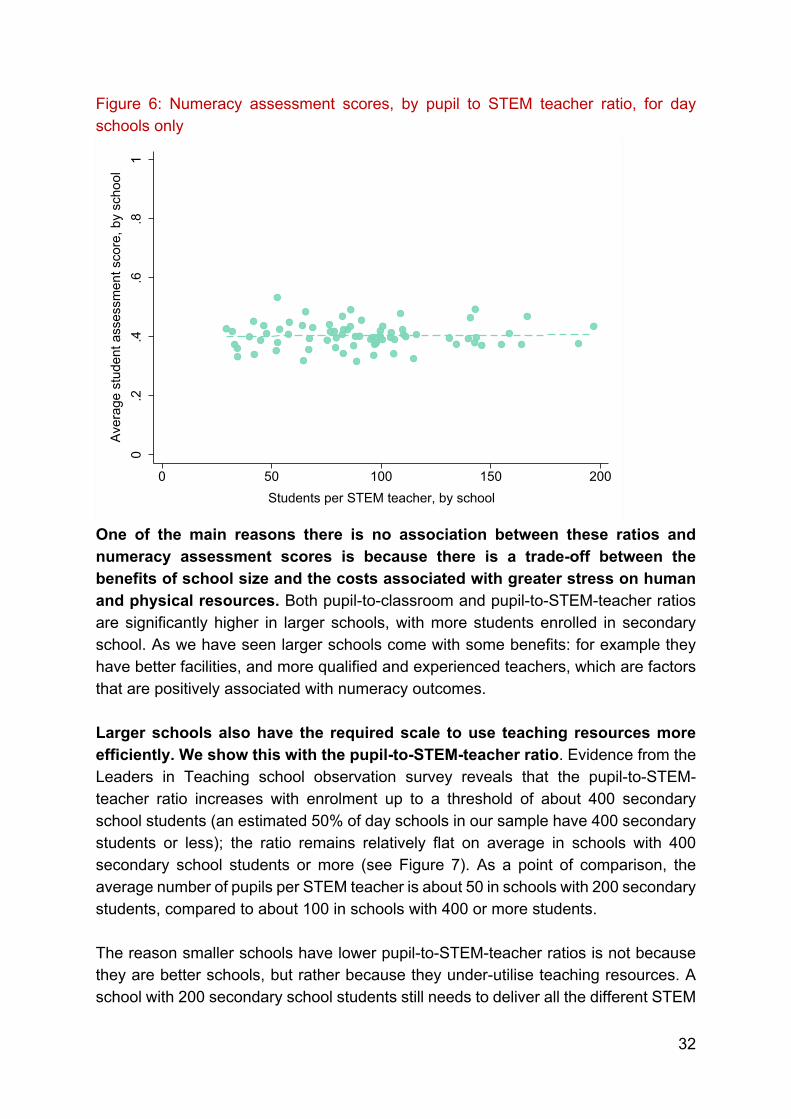
secondary school, increasing the chance that better students would apply to schools that are also better equipped. All of these factors combine to create a different school environment depending on how well schools are equipped. Finding 6: Average numeracy outcomes for students at the start of the academic year are not associated with whether these students are in day schools with higher pupil-to-teacher ratios or pupil-to-classroom ratios (this holds for day schools only) Pupil to teacher or pupil to classroom ratios are often used by policy makers to measure the adequacy of teaching and school infrastructure resources in schools. Classroom sizes and the number of teachers per student are also signals what parents and students might think about when making an informed decision about which schools to apply to. Smaller classrooms and sufficient teaching staff are considered important to creating the right conditions for learning to happen. There is a lot variation in the pupil-to-STEM-teacher ratio across schools. This ratio measures how many different students a STEM teacher teaches on average, across different classes. For example if there are 500 secondary school students in a school and 10 STEM teachers, then each STEM teacher teaches an average of 50 different students. The higher this number, the greater the teaching burden placed on each STEM teacher and the less individualised the support each teacher can provide. Secondary schools in the full Leaders in Teaching sample have between 28 to 240 students per STEM teacher, with an average of 84 students per STEM teacher. We also observe a lot of variation in classroom sizes across schools. The pupil-to-classroom indicator simply divides the number of students enrolled at secondary school level, by the number of classrooms available for secondary-level education in that school. The higher this number, the greater the pressure on physical classroom resources. In the full Leaders in Teaching sample of schools, this statistic varies from a minimum of about 11 to 95 secondary students per classroom, with an average of about 42 students per classroom. Despite high levels of variation, there is no association between these ratios and numeracy assessment scores in day schools (we do not have sufficient observations to study these dynamics between boarding schools). Pupil-to-classroom and pupil-to-STEM-teacher ratios do not explain the difference in assessment scores between day schools, where the coefficients associated with both indicators are close to zero. We show this graphically for pupil to STEM teacher ratios in Figure 6.
32
Figure 6: Numeracy assessment scores, by pupil to STEM teacher ratio, for day schools only
One of the main reasons there is no association between these ratios and numeracy assessment scores is because there is a trade-off between the benefits of school size and the costs associated with greater stress on human and physical resources. Both pupil-to-classroom and pupil-to-STEM-teacher ratios are significantly higher in larger schools, with more students enrolled in secondary school. As we have seen larger schools come with some benefits: for example they have better facilities, and more qualified and experienced teachers, which are factors that are positively associated with numeracy outcomes. Larger schools also have the required scale to use teaching resources more efficiently. We show this with the pupil-to-STEM-teacher ratio. Evidence from the Leaders in Teaching school observation survey reveals that the pupil-to-STEM-teacher ratio increases with enrolment up to a threshold of about 400 secondary school students (an estimated 50% of day schools in our sample have 400 secondary students or less); the ratio remains relatively flat on average in schools with 400 secondary school students or more (see Figure 7). As a point of comparison, the average number of pupils per STEM teacher is about 50 in schools with 200 secondary students, compared to about 100 in schools with 400 or more students. The reason smaller schools have lower pupil-to-STEM-teacher ratios is not because they are better schools, but rather because they under-utilise teaching resources. A school with 200 secondary school students still needs to deliver all the different STEM
0.2
.4.6
.81
Aver
age
stud
ent a
sses
smen
t sco
re, b
y sc
hool
0 50 100 150 200Students per STEM teacher, by school

33
subjects, for which different teacher specialisations are required. This demonstrates that low pupil-to-teacher ratios are not always desirable, are not always associated with better learning outcomes and that investments in school-scale can come with a more efficient use of teaching resources. Figure 7: Students per STEM teachers, by school enrolment, in day schools
Please note that boarding-schools have smaller classroom sizes, more teachers per student and higher numeracy assessment scores than day schools. If we were comparing day schools to boarding schools, we might reach the conclusion that these factors are in fact associated with numeracy assessment scores. Finding 7: Differences in the characteristics of day schools only explain 10% of the variation in numeracy assessment scores When conducting regression analysis with fixed or random effects at the school level, we can study the amount of variation that is due to between school variation versus within school variation. The Intra-Cluster-Correlation coefficient (ICC) is a measure of the proportion of variation that is due to between-school variation. The higher this coefficient, the greater the differences between schools and the more school-level characteristics are correlated with numeracy outcomes; the lower this coefficient, the more individual or household level characteristics within schools matter in determining learning outcomes.
050
100
150
200
250
Pupi
l to
STEM
teac
her r
atio
0 200 400 600 800 1000Secondary school enrolment (number of students)
Regression estimated using Kernel Regularized Least Squares

34
School-level factors explain about 10% of the variation in numeracy assessment scores in day schools. About 10% of the variation in assessment scores is explained by school-level factors, such as school-level facilities, teacher quality, intake criteria, the quality of school leadership, etc. As a point of comparison, the ICC in boarding schools is about 30%. This statistic implies that on average, differences in school-level factors across day schools do not translate into large differences in numeracy assessment scores at the start of the school year, but do so more in boarding schools. One possible explanation is that by secondary school, many students have already accumulated foundational learning gaps that are difficult to mediate at the secondary level. The problem of legacy learning gaps, and students finishing primary school without having acquired basic arithmetic (or other foundational skills), is widespread in low-income countries (see Bold, 2017). The existence of foundational learning gaps might explain why, as we see in this discussion on the school environment, improvements in school level inputs (for example pupil-to-teacher or pupil-to-classroom ratios) produce a modest response in terms of numeracy learning gains. In a context where students’ learning is already low by the time they start secondary school (as is the case for many of those in day secondary schools), the effects of investments in upgrading the quality of secondary education is likely to be constrained, and so will have more limited benefits for learning gains. In the case of boarding schools the opposite is true. The implications of these findings would be that with better-performing students entering the system, school-level factors are more important. Examples from the numeracy assessment confirms that students in lower secondary school may face foundational numeracy learning gaps. As discussed above, in order to prevent copying on the LARS III assessment, students were given two different versions of the assessment, each with one additional question. The additional question was included as the first question for students that received the first version of the assessment; and as last for students that received the second version of the assessment. The question asked students to subtract 100 from 250. Addition and subtraction with three-digit numbers is part of the lower primary level syllabus. An estimated 16% of Secondary 3 students answered this question incorrectly when it was the first question in the assessment; an estimated 40% of students either answered incorrectly or did not attempt the question when it was included as the last question in the assessment (scores were lower on the last question mainly because students did not make it that far in the assessment). Another question, from the LARS III assessment, asked students to multiply 15 by 14. This type of multiplication, with two-digit whole numbers, is part of the Primary 4 syllabus. An estimated 25% of students answered this question incorrectly. These examples point to foundational learning gaps that make it difficult for students to follow the secondary curriculum and can be very difficult for teachers to mediate at that level.
35
Implications and areas for future research This brief confirms that numeracy learning outcomes at Secondary 3 level are closely associated with student, family and school-level factors. The paper reviews how these factors combine to affect numeracy learning outcomes in Secondary 3 classes at the start of the school year; and how these factors are embedded within the system of secondary schools. It compares day schools to boarding schools, and schools that provide both O- and A-levels (12 years of basic education) to schools that provide only O-level education (9 years of basic education). The contributions of this brief lead to several policy considerations:
1. On average, at the start of the academic year in Secondary 3, girls are not at the same level of numeracy attainment as boys. There are differences in the type of schools girls and boys are enrolled in: the proportion of girls is comparatively lower in schools in high income locations and in schools which include A-level education (upper secondary). We also find that boys and girls are equally likely to be enrolled in boarding schools in our sample, despite the fact that girls have had higher passing grades in the primary school leaving examination since 2016/2017. Data from this study agrees with other survey and administrative data that lower secondary school is the moment when the educational outcomes of girls start to worsen compared to boys. Up until the transition into secondary school girls perform better, with more girls making it to secondary and with higher pass rates at the national primary school leaving examination. Gender sensitive pedagogies for STEM may be needed so that girls can maximise their potential. In addition, in a context of low numbers of female role models in terms of STEM teachers and school leaders (we estimate that 26.6% of STEM teachers in secondary schools in the LIT sample are female), this is likely to be another area that deserves policy attention.
2. This study confirms that older students experience poorer learning outcomes at secondary level. Older students have accumulated more delays in their education, due to a combination of repetition, a late start to their education and possibly periods of drop out and re-entry. The proportion of over age students is significantly higher in low-income households. Girls are also more likely to progress at the right age, while boys are on average older. Differences in the average age of students are predictive of differences in the average numeracy assessment scores between schools. This is due to high competition at entry: the best students at the end of primary school tend to be younger, having repeated few times. Age is also predictive of differences in educational outcomes within schools. Older students, especially those with learning difficulties, are at the greatest risk of drop out. Students that are
36
significantly older than expected for their grade are a vulnerable population.
3. It is important to assess the effect of the student allocation mechanism – in the transition from primary to secondary school – on the long-term equity of learning outcomes at lower secondary school level. The current student allocation mechanism, following the primary school leaving examination results, leads to a high concentration of the best performing students in a few schools, namely schools of excellence and/or boarding schools. 63% of the top 10% (based on their numeracy assessment score) of students in Leaders in Teaching districts are enrolled in boarding schools, while only 9% of all Secondary 3 students in these districts are enrolled in boarding schools. We know from student composition data that boarding schools are less accessible to students from low-income backgrounds. They also have better facilities and attract the most qualified teachers. While this analysis is too limited to ascertain how the student allocation mechanism affects equity in overall learning outcomes, we recommend a greater policy and research focus on this question.
4. Investments in improvements to the quality of secondary education might
not reach their full potential in terms of learning outcomes, due to legacy learning gaps. We show that which day schools students attend has little bearing on their numeracy learning outcomes at the start of the school year. Schools only explain 10% of the variation in numeracy assessment scores for students in day schools. At the same time, we observe that day schools with better school inputs (for example lower pupils per teacher ratios) only experience marginally better numeracy outcomes on average. These findings are consistent with a situation in which students face legacy learning gaps that are difficult to mediate at secondary school level. In this context, investments in improving the quality of secondary level education, for example through better teacher quality, might not reach their full potential in terms of learning gains. These results also underline the importance of using assessments at the secondary level strategically to identify specific learning gaps to be addressed (rather than focusing more narrowly on using assessments to rank student performance).
5. Pupil-to-teacher and pupil-to-classroom ratios are often used by actors in the education sector to plan future investments in resources and as a measure of education quality. But are these good metrics of school quality? The lower the ratios, the more adequate school-level resources are considered to be. We show that student-to-teacher and student-to-classroom ratios experience high levels of variation at the school-level and are not
37
predictive of school-level numeracy assessment scores in day schools. In fact, some of the day schools with the best metrics in terms of student-to-teacher ratios are also among the weakest in terms of numeracy assessment scores. Given the high levels of variation in these factors, and the fact they are not predictive of learning outcomes, we question whether these are the most appropriate indicators to track the quality of school-level inputs. We would recommend that policy makers investigate this question further, since these ratios are at the basis of many decisions in the education sector.
6. Students with higher numeracy assessment outcomes at the start of the school year are more likely to be found in schools with better facilities and more qualified and experienced teachers. Factors such as school and teacher quality play an important role in the competitive selection process into secondary schools following the primary school leaving examination. Better-performing students will express a preference for schools with the best reputation, facilities and teachers. At the same time, these factors can contribute towards creating the right conditions for learning to take place and potentially affect learning outcomes. Future rounds of the Leaders in Teaching quantitative surveys will aim to gain additional insights into this process and in particular the role of STEM teachers in making learning happen.
38
References Bold, T., Filmer, D., Martin, G., Molina, E., Rockmore; C., Stacy, B., Svensson, J. and
Wane; W. (2017). What Do Teachers Know and Do? Does it Matter? Evidence from Primary Schools in Africa. World Bank Policy Research Working Paper No. 7956, Available at: https://ssrn.com/abstract=2906568. Accessed 27/0/2021.
Burdett N., and James, Z. (2018). Learning Achievement in Rwandan schools (LARS) III: Primary 6 (P6) and Secondary 3 (S3) Results Report. High-Quality Technical Assistance for Results (HEART). Oxford Policy Management, Oxford, United Kingdom:
Clarke, P., Crawford, C., Steele, F. and Vignoles, A. (2010). The Choice Between Fixed and Random Effects Models: Some Considerations for Educational Research. IZA Discussion Paper No. 5287. Available at: https://www.iza.org/publications/dp/5287/the-choice-between-fixed-and-random-effects-models-some-considerations-for-educational-research. Accessed 27/07/2021.
Coe, R., Aloisi, C., Higgins, S. and Major, L. (2014). What makes great teaching? Review of the underpinning research. Project Report, Sutton Trust. Available at: https://www.suttontrust.com/wp-content/uploads/2014/10/What-Makes-Great-Teaching-REPORT.pdf. Accessed 27/07/2021.
Molina, E., Pushparatnam, A., Rimm-Kaufman, S. E., Wong, K. K. (2018). Evidence- Based Teaching: Effective Teaching Practices in Primary School Classrooms. Policy Research working paper: WPS 8656. World Bank Group. Available at: https://elibrary.worldbank.org/doi/abs/10.1596/1813-9450-8656. Accessed 27/07/2021.
National Institute of Statistics Rwanda. (2017). Integrated Household Living Conditions Survey (EICV5). Available at: https://www.statistics.gov.rw/publication/eicv-5-rwanda-poverty-profile-report-201617
Rwandan Ministry of Education. (2019a). The Education Sector Strategic Plan 2018/19 to 2023/24. Available at: https://planipolis.iiep.unesco.org/en/2019/education-sector-strategic-plan-201819-202324-6812. Accessed 27/07/2021.
Rwandan Ministry of Education. (2019b). Education Statistical Yearbook. Available at: https://www.statistics.gov.rw/publication/statistical-yearbook-2019. Accessed 27/07/2021.
Westbrook, J., Durrani, N., Brown, R., Orr, D., Pryor, J., Boddy, J., and Salvi, F. (2013). Pedagogy, Curriculum, Teaching Practices and Teacher Education in Developing Countries. Final Report. Education Rigorous Literature Review. Department for International Development. Available at: https://eppi.ioe.ac.uk/cms/Portals/0/PDF%20reviews%20and%20summaries/Pedagogy%202013%20Westbrook%20report.pdf?ver=2014-04-24-121331-867. Accessed 27/07/2021.

Real Centre Faculty of EducationUniversity of Cambridge184 Hills Road, Cambridge, CB2 8PQ, UK
@REAL_Centrewww.educ.cam.ac.uk/centres/real Email: [email protected]
laterite Amy’s House, Plot 1563, KG 12 Avenue, Gaculiro, Kinyinya, Kigali, Rwanda
@Laterite_Africa www.laterite.com
All details correct at the time of going to print, September 2021.