Embed Size (px)
Citation preview
Making the Case for Data Disaggregation to Advance a Culture of Health
Understanding the Culture of Health for Asian American, Native Hawaiian and Pacific Islanders (AANHPIs): What do population-based health surveys across
the nation tell us about the state of data disaggregation for AANHPIs?
A report to the Robert Wood Johnson Foundation
September 2017 By:
Ninez Ponce, PhD
University of California, Los Angeles
AJ Scheitler, EdD University of California, Los Angeles
Riti Shimkhada, PhD
University of California, Los Angeles
This is one in a series of six research reviews supported by grants from The Robert Wood Johnson Foundation to the authors’ universities or organizations. The opinions are those of the authors, not the Foundation or PolicyLink.
1
Understanding the Culture of Health for Asian American, Native Hawaiian and Pacific Islanders (AANHPIs):
What do population-based health surveys across the nation tell us about the state of data disaggregation for AANHPIs?
A report to the Robert Wood Johnson Foundation
July 2016 By:
Ninez Ponce, PhD AJ Scheitler, EdD
Riti Shimkhada, PhD
University of California, Los Angeles Fielding School of Public Health
Center for Global and Immigrant Health Center for Health Policy Research
ACKNOWLEDGMENTS We thank the National Network of State and Local Health Survey Members for their contributions to our key informant sampling frame. We are grateful to Ms. Hala Douglas for her expert logistics coordination in scheduling meetings and interviews. Finally, we thank all of the participants of our study for their valuable insights on data disaggregation for AANHPI.
2
Table of Contents
Introduction .................................................................................................................................. 3
Conceptual Approach .................................................................................................................. 4
Technical Approach...................................................................................................................... 5 Aim 1 and 2: Literature synthesis of peer-reviewed and gray literature to examine AANHPI
data collection and reporting. ............................................................................................................. 5 Aim 3: A scan of large population based surveys and key informant interviews were
performed to dive deeper into data collection and reporting practices ..................................... 7 Aim 4: Examination of published guidance on collecting and reporting data ........................... 7
Findings .......................................................................................................................................... 8 Literature Synthesis, Dataset and Media Scans ............................................................................... 8 Stakeholder Interviews ...................................................................................................................... 13 Translating Findings Into Themes: Triangulation .......................................................................... 14
Themes ........................................................................................................................................ 15 Regulations and Standardization Have Supported Disaggregation ........................................... 15 Methodological Challenges to Data Collection.............................................................................. 17
Small Sample Size .......................................................................................................................................... 17 Question Wording ......................................................................................................................................... 20 Variation in Coding, Reporting .................................................................................................................. 22
Practical Challenges to Data Collection ........................................................................................... 24 Financial Constraints .................................................................................................................................... 24 Stakeholder and user interests ................................................................................................................. 25 Need for Consistency ................................................................................................................................... 26
Recommendations on Where We Go From Here ................................................................ 28 Guidelines are Necessary, But Not Sufficient ...................................................................................... 28 Research Community Resources .............................................................................................................. 29 Need for Best Practices ............................................................................................................................... 31
Appendix A: Literature Synthesis search terms and key papers ..................................... 33 Table 1. AANHPI Methods Papers from Peer Reviewed Literature Used to Abstract
Keyword/Themes ................................................................................................................................ 33 Appendix B: Dataset Scan of AANHPI Data Collection and Reporting Practices .................... 35 Table 2. State of AANHPI data collection and reporting per National Healthcare Quality and
Disparities Report, 2014 .................................................................................................................... 35
3
INTRODUCTION As the fastest growing racial/ethnic group in the U.S., Asian American, Native Hawaiian
and Pacific Islanders (AANHPI) make up almost 6% (18 million) of the U.S. population according to the U.S. Census 2010.1 By 2050 this group is expected to account for over 11% (41 million) of the total US population.2 There are six Asian American subgroups – Asian Indian, Chinese, Filipino, Japanese, Korean, and Vietnamese – that make up a vast majority (about 97%) of the Asian American population reporting a single race.3 Between these six major groups exists a good deal of variation in socioeconomics and language abilities, with Asian Indians tending to fall in the higher socioeconomic tiers and Vietnamese in the lower tiers. There is notable growth in Asian Americans falling outside of these big six subgroup categories. The fastest-growing Asian American subgroups based on the 2000-2010 U.S. Census include the Bhutanese population with a 8,255% increase (15,290 Bhutanese reporting single race in U.S. in 2010), along with Nepalese (561% increase; 51,907 in U.S. in 2010), Burmese (500% increase; 100,200 in U.S. in 2010) subgroups.3 These emerging groups, though much smaller in size than the big six Asian American subgroups, are important as little is known about their unique socioeconomic and health needs. The Native Hawaiian and Other Pacific Islander population have also experienced increases in population. The NHPI alone or in combination population is the second fastest growing race group in the country after Asian alone or in combination, and NHPI increased more than three times faster than the total U.S. population between 2000 and 2010 (874,000 in U.S. in 2000 to 1.2 million in 2010).4 Native Hawaiian is the largest detailed NHPI group (527,077 alone or in combination in 2010) and the Chuukese population has showed the large increases over the past decade as have Guamanian or Chamorro, Marshallese populations.
While it is known AANHPI are incredibly diverse in their culture, language, and health needs, data collection efforts in the U.S. may not disaggregate AANHPI into smaller groups to better capture the diversity in the group.5 As a whole group, AANHPI represents more than 50 ethnic groups speaking 100 languages.6 Coming from different backgrounds and origins, this population faces unique and significant social, emotional and physical health burdens. Based on a limited but growing body of literature, it appears AANHPIs are less likely to utilize health care and to participate in health programs for which they are eligible compared with other racial groups,7,8 leading to significant health disparities for this population,9-11 including less access to care,12-15 less satisfaction with care,16 fewer screening and preventive services,13,17-20 poorer quality care2– which is highly correlated with racial discrimination among AANHPI,21 - and higher disease incidence of liver cancer, tuberculosis, certain cancers, and heart disease compared to non-Hispanic Whites.22-25
The dearth of population-based survey data that better elucidate the potential dramatic health disparities within the AANHPI subpopulations make it difficult to better address specific health needs of AANHPI subgroups.5,6,26,27 Similarly, the rapidly growing sub-populations of underserved AANHPIs with low socioeconomic status and poor health status is only recently beginning to be recognized or documented.28-34
4
The purpose of this study is to describe the current practice of data collection and reporting for AANHPI groups in health-related population surveys. We present a scan of the current sources of AANHPI data on health and health-related determinants, and provide insights on the challenges population-based surveys face in collecting and reporting data to inform policies and programs targeted towards AANHPI populations.
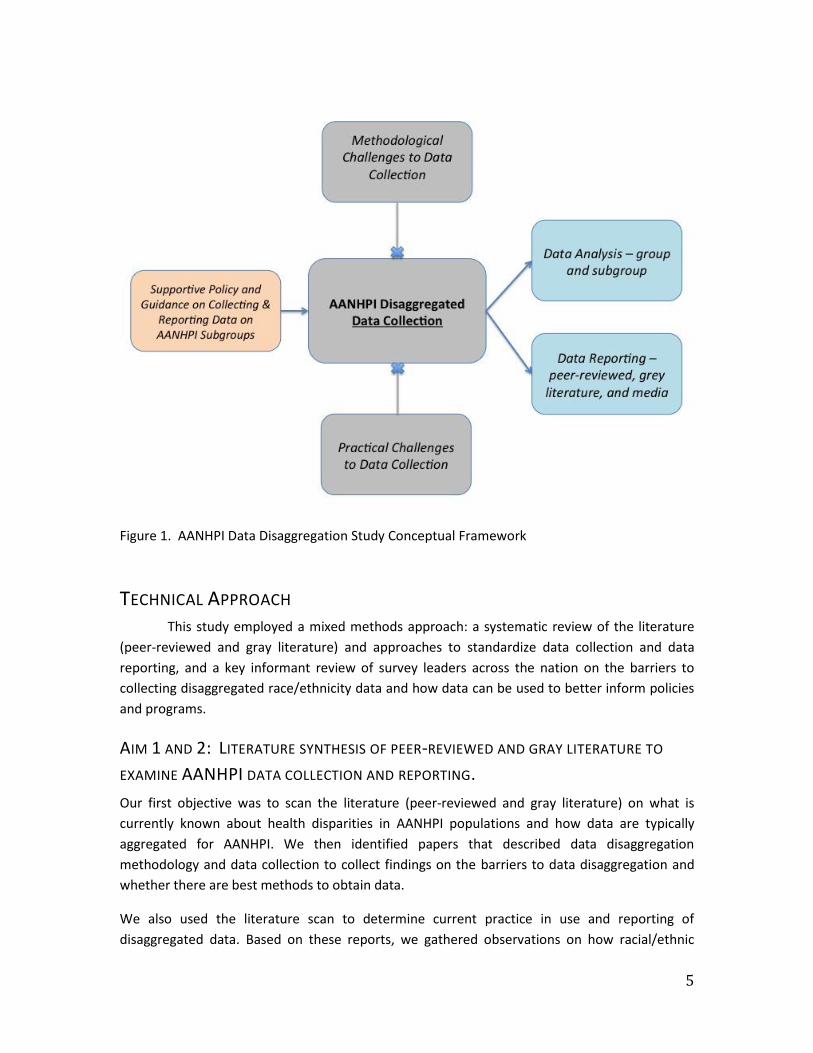
CONCEPTUAL APPROACH Our conceptual framework for this study on AANHPI data disaggregation highlights how policies and guidance may support disaggregation, which then impacts how analysis is conducted and how the information is reported. However, while support may be offered by directives and guidance from authoritative bodies, there are likely barriers to data disaggregation that make racial subgroup identification difficult for surveys. These barriers may include those that are more methodological in nature, such as having inadequate sample size, and those that are more practical in nature, such as not having available question time on a survey questionnaire to ask about ethnic subgroups or language. This conceptual framework is an important anchor to our multi-method study that gathered information from various sources to better understand how supportive guidance can help disaggregation efforts and to identify the challenges to disaggregation and thus what our future efforts should focus on. The themes identified in this study were placed into the conceptual framework to support organization of this report.
5
Figure 1. AANHPI Data Disaggregation Study Conceptual Framework
TECHNICAL APPROACH This study employed a mixed methods approach: a systematic review of the literature
(peer-reviewed and gray literature) and approaches to standardize data collection and data reporting, and a key informant review of survey leaders across the nation on the barriers to collecting disaggregated race/ethnicity data and how data can be used to better inform policies and programs.
AIM 1 AND 2: LITERATURE SYNTHESIS OF PEER-REVIEWED AND GRAY LITERATURE TO
EXAMINE AANHPI DATA COLLECTION AND REPORTING. Our first objective was to scan the literature (peer-reviewed and gray literature) on what is currently known about health disparities in AANHPI populations and how data are typically aggregated for AANHPI. We then identified papers that described data disaggregation methodology and data collection to collect findings on the barriers to data disaggregation and whether there are best methods to obtain data.
We also used the literature scan to determine current practice in use and reporting of disaggregated data. Based on these reports, we gathered observations on how racial/ethnic
6
data on AANHPI populations generally reported in current practice. We also sought to identify the implications of how data are reported on AANHPI programs and policy, and on AANHPI social media campaigns for health related issues.
Methods: We conducted a narrative synthesis review of all papers (no date boundaries were placed) appearing in PubMed on Asian Americans (AA), Native Hawaiians (NH), and Pacific Islanders (PI). As part of our review, we included both the peer-reviewed literature as well as non-peer reviewed sources. Google was used for non-peer reviewed (gray literature) searches. The publications were organized using EndNote software and exported to Excel spreadsheets. In the PubMed literature search we used search strategies that included MeSH terms, which generate specific and very targeted responses, along with keyword searches that cast a wider net and can capture the most recent papers, which MeSH searches may miss. The following terms were used on their own both as MeSH terms and then as keyword terms to capture any papers that may have been missed by MeSH: Asian Americans, Hawaiian, Pacific Islander. The lists generated from both search strategies were merged and duplicates removed. All results were filtered to include only papers in English with human subjects. The list was then filtered to remove non-U.S. based studies, such as those on AANHPI groups residing in Australia and Canada. The resulting list includes 7,896 papers dating from 1947 to 2016 (May).
A second filter was created to identify all the papers in this large list that reported on population-based surveys. For this, various keywords were used to identify studies reporting any of the following: population based survey, national survey, state survey, and all surveys listed in Table 1 were also screened in for inclusion into this smaller list of papers only using survey methodology (for example, papers reporting having used the Behavioral Risk Factor Surveillance System were included). There were a total of 620 studies in this group. From this group of papers, we then summarized the data disaggregation patterns of these population based studies by scraping data from each of the study Abstracts to identify which papers reported on: Asian Americans (AA) only (with no mention of NH or PI), AA & NHPI combined, any AA subgroups, and any NHPI subgroups. We examined these findings over time to understand how reporting has changed over the years.
We also used the Abstract scraping methodology to identify a set of papers that discuss data collection methodology and potential challenges for data collection for AANHPI. To identify these papers, we used the following keywords: data disaggregation, methodology, survey data collection. We also examined the papers citing notable papers on this topic – for example all the papers citing Srinivasan et al’s (2000) seminal work on the need for disaggregation, Islam et al’s (2010) more recent work on the methodological challenges of disaggregation, and the papers on how AANHPI data disaggregation has been commenced and supported by the California Health Interview Survey. Based on these papers, a heat map of keywords was created to determine which words were most commonly occurring. The predominant keywords that emerged in the narrative synthesis were used to cross-tabulate with the keywords form the key informant surveys and used then to identify major themes.
7
Lastly, in our examination of how racial/ethnic data on AANHPI populations are reported in current practice we gathered observations on reporting and disaggregation advocacy work on social media campaigns by searching for AANHPI disaggregation and related search terms on Twitter and Facebook. The scan of social media augmented exploration on how data reporting affects messaging in social media and how the audience uses data in social media through the number of Tweets, mentions and impressions.
AIM 3: A SCAN OF LARGE POPULATION BASED SURVEYS AND KEY INFORMANT INTERVIEWS
WERE PERFORMED TO DIVE DEEPER INTO DATA COLLECTION AND REPORTING PRACTICES Scan of population based surveys: We examined the current practices of capturing health and health related determinants for AANHPI in large survey data collection, analysis and reporting. For this, we created a matrix of current data sources available and how these surveys collect AANHPI data. We reviewed how the datasets are used to report findings on AANHPI populations in the 2014 National Healthcare Quality & Disparities Reports published by the Agency for Healthcare Research and Quality (AHRQ). The approach of the California Health Interview Survey (CHIS) on capturing ethnic diversity through its cultural and linguistic adaptation was also examined and described for this Aim. Lastly, we identified and reviewed practices from data collection from non-health sector by looking at the U.S. Census Bureau datasets and how they disaggregate for AANHPI subgroups.
We also conducted Key Informant Interviews, surveying members of the National Network of State and Local Health Surveys on survey-specific approaches and barriers to gathering race and ethnicity data. Network members include leaders of state-based or local-level surveys as well as national representatives with the Behavioral Risk Factor Surveillance System (BRFSS) and the National Health Interview Survey (NHIS).
AIM 4: EXAMINATION OF PUBLISHED GUIDANCE ON COLLECTING AND REPORTING DATA We examined how data collection on AANHPI populations can be standardized by reviewing the IOM report on Standardized Collection of Race/Ethnicity, the enhanced ethnic/racial data collection standards as prescribed by Section 4302 of the ACA, race/ethnicity data collection efforts by the federal Office of Minority Health, and how demographic surveys by the U.S. Census and other organizations such as Pew Research Center are capturing the growth of multi-racial individuals. We collected lessons and recommendations from these projects and cross-tabulated these with the information gleaned from our key informant interviews.
8
FINDINGS
LITERATURE SYNTHESIS, DATASET AND MEDIA SCANS As part of Aim 1, we sought to understand the state of data disaggregation and the impact standardized guidance on AANHPI data collection and reporting has had on disaggregation practices in place today. For this, we performed a quantitative analysis of the literature pulled from PubMed and thus examined how data collection and reporting has changed over time and whether these changes track with/follow the major events in this field, such as the Office of Management and Budget’s (OMB) revised standards for collection of race and ethnicity data by the federal government in 1997. A total of 620 studies were identified for this analysis of only population-based surveys reporting on any AA or NHPI. From this group of papers, we then summarized how data were reported in these papers and tabulated the number of papers reporting on: Asian Americans only (with no mention of NH or PI), AA& NHPI combined, any Asian American subgroups, and any NHPI subgroups.
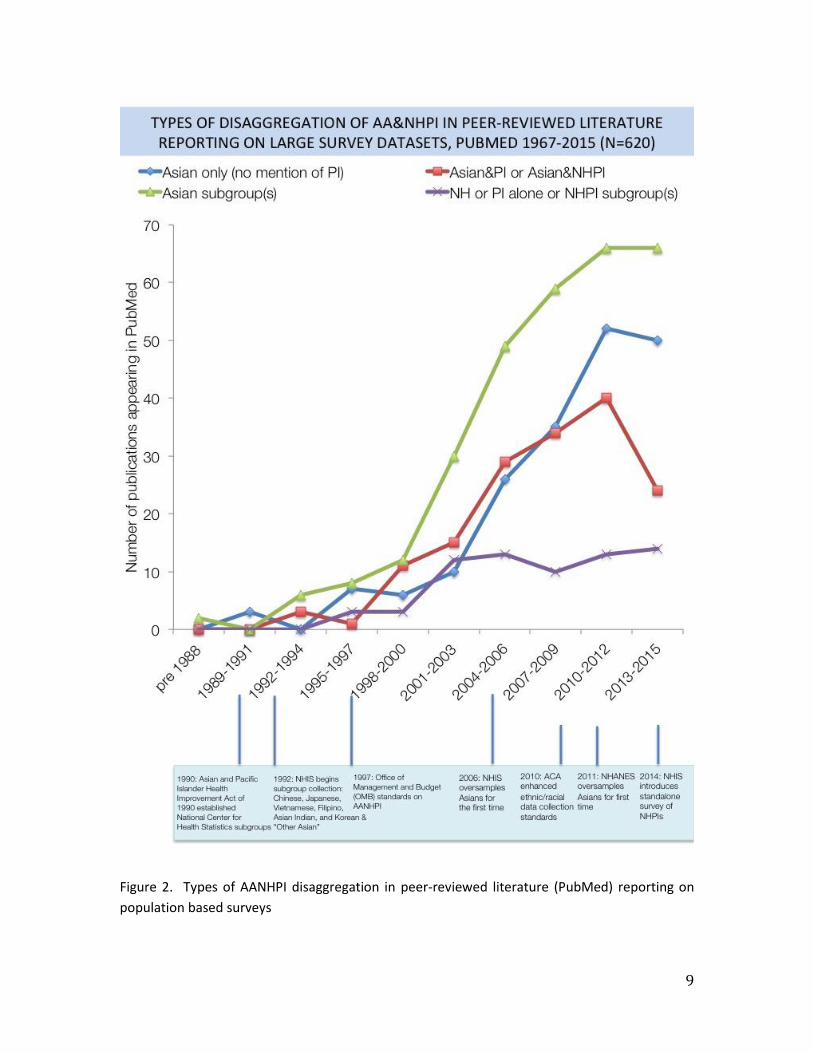
Not surprisingly, there was a marked upward trend in the number of papers reporting on Asian subgroups – whether it is reporting on one group (e.g. Chinese Americans using CHIS) or multiple Asian subgroups (e.g. 6 major Asian American subgroups using the National Health Interview Survey [NHIS]) (Figure 2). The practice of reporting on Asian as a single population and without mentioning NH or PI also increased over time, however, appears to be declining along with the practice of aggregating AANHPI into one group, which appears to have declined more dramatically. Note that this occurred post-ACA (after 2010). While reporting on NHPI subgroups has also grown, it has not seen the same type of dramatic rise as seen with the AA subgroup reporting. It is possible with the NHIS 2014 standalone survey of NHPIs, there will be an uptick in peer reviewed publications in the next couple of years and dramatically increase the number of NHPI subgroup papers. Note that the last two time periods saw the same number of AA subgroup papers (66 in 2010-2012 and 66 in 2013-2015). The impact on the trend of further disaggregation will be watched closely by survey leaders.
9
Figure 2. Types of AANHPI disaggregation in peer-reviewed literature (PubMed) reporting on population based surveys
10
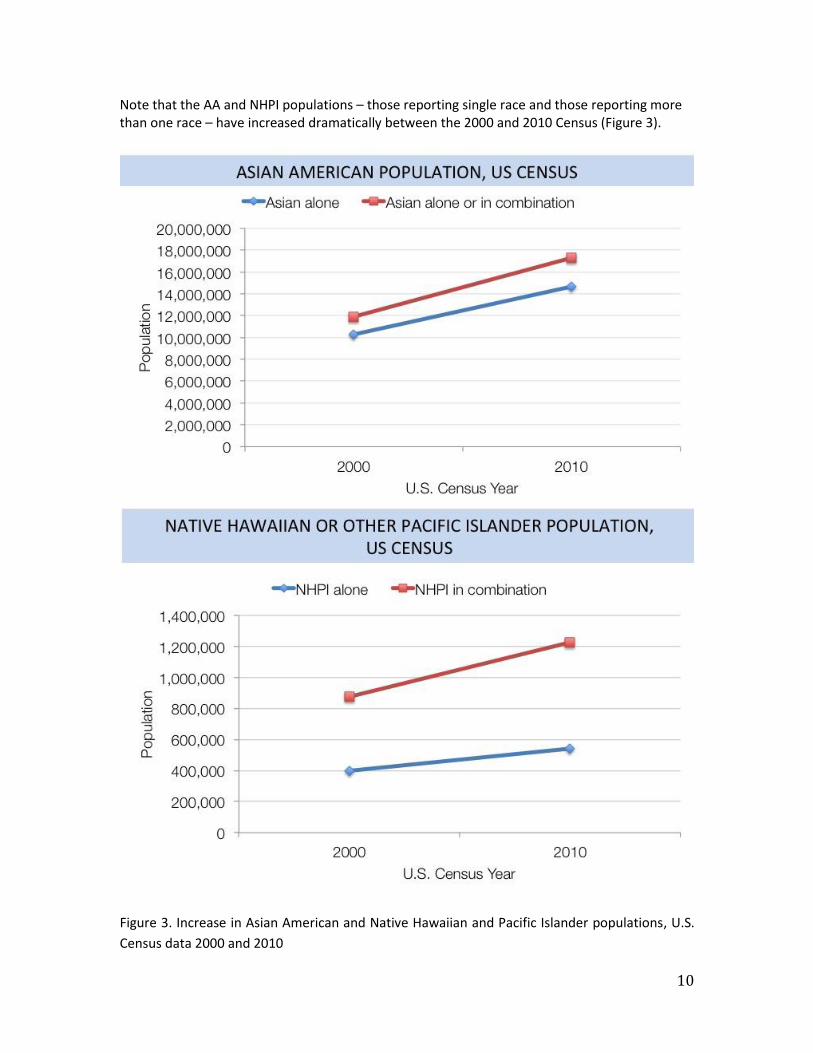
Note that the AA and NHPI populations – those reporting single race and those reporting more than one race – have increased dramatically between the 2000 and 2010 Census (Figure 3).
Figure 3. Increase in Asian American and Native Hawaiian and Pacific Islander populations, U.S. Census data 2000 and 2010
11
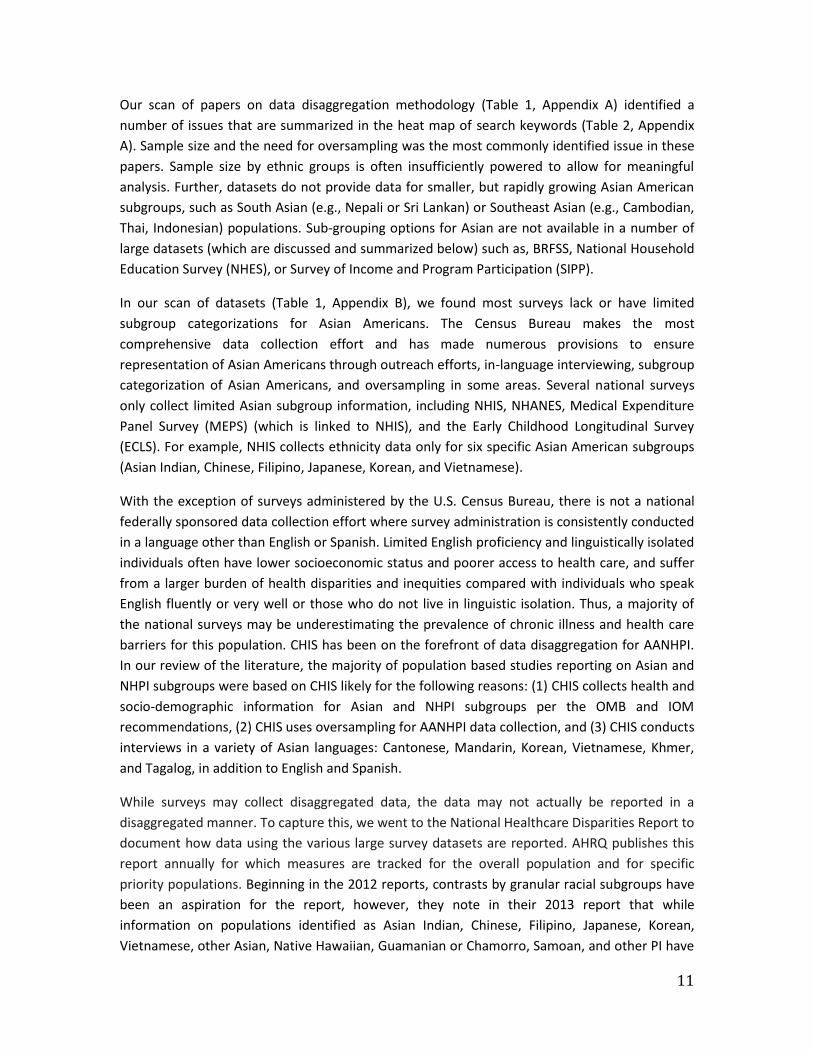
Our scan of papers on data disaggregation methodology (Table 1, Appendix A) identified a number of issues that are summarized in the heat map of search keywords (Table 2, Appendix A). Sample size and the need for oversampling was the most commonly identified issue in these papers. Sample size by ethnic groups is often insufficiently powered to allow for meaningful analysis. Further, datasets do not provide data for smaller, but rapidly growing Asian American subgroups, such as South Asian (e.g., Nepali or Sri Lankan) or Southeast Asian (e.g., Cambodian, Thai, Indonesian) populations. Sub-grouping options for Asian are not available in a number of large datasets (which are discussed and summarized below) such as, BRFSS, National Household Education Survey (NHES), or Survey of Income and Program Participation (SIPP).
In our scan of datasets (Table 1, Appendix B), we found most surveys lack or have limited subgroup categorizations for Asian Americans. The Census Bureau makes the most comprehensive data collection effort and has made numerous provisions to ensure representation of Asian Americans through outreach efforts, in-language interviewing, subgroup categorization of Asian Americans, and oversampling in some areas. Several national surveys only collect limited Asian subgroup information, including NHIS, NHANES, Medical Expenditure Panel Survey (MEPS) (which is linked to NHIS), and the Early Childhood Longitudinal Survey (ECLS). For example, NHIS collects ethnicity data only for six specific Asian American subgroups (Asian Indian, Chinese, Filipino, Japanese, Korean, and Vietnamese).
With the exception of surveys administered by the U.S. Census Bureau, there is not a national federally sponsored data collection effort where survey administration is consistently conducted in a language other than English or Spanish. Limited English proficiency and linguistically isolated individuals often have lower socioeconomic status and poorer access to health care, and suffer from a larger burden of health disparities and inequities compared with individuals who speak English fluently or very well or those who do not live in linguistic isolation. Thus, a majority of the national surveys may be underestimating the prevalence of chronic illness and health care barriers for this population. CHIS has been on the forefront of data disaggregation for AANHPI. In our review of the literature, the majority of population based studies reporting on Asian and NHPI subgroups were based on CHIS likely for the following reasons: (1) CHIS collects health and socio-demographic information for Asian and NHPI subgroups per the OMB and IOM recommendations, (2) CHIS uses oversampling for AANHPI data collection, and (3) CHIS conducts interviews in a variety of Asian languages: Cantonese, Mandarin, Korean, Vietnamese, Khmer, and Tagalog, in addition to English and Spanish.
While surveys may collect disaggregated data, the data may not actually be reported in a disaggregated manner. To capture this, we went to the National Healthcare Disparities Report to document how data using the various large survey datasets are reported. AHRQ publishes this report annually for which measures are tracked for the overall population and for specific priority populations. Beginning in the 2012 reports, contrasts by granular racial subgroups have been an aspiration for the report, however, they note in their 2013 report that while information on populations identified as Asian Indian, Chinese, Filipino, Japanese, Korean, Vietnamese, other Asian, Native Hawaiian, Guamanian or Chamorro, Samoan, and other PI have
12
been sought, there are no health care databases that identify all of these subgroups. Thus, NHRQ tends to continue reporting only the aggregated Asian category. Only in the 2013 NHRQ report was an attempt made to describe disparities for Asian subgroups. For this, data come from the 2011-2012 CHIS. Report authors noted that data on often overlooked small population subgroups need to be gathered at a national level, and the burden of measurement needs to be minimized. Also, information needs to be disseminated more quickly to partners who have the skills and commitment to change health care.
In our scan of social media on AANHPI disaggregation, in which we examined both Twitter and Facebook platforms, we found thriving AANHPI data disaggregation conversations. The hashtag #AAPI is generally used in discussions of anything related to Asian Americans and Pacific Islanders. Over the course of about 3 days from June 7-9, 2016, the #AAPI hashtag generated 400 posts by 239 users, resulting in 1,607,300 impressions and a reach of about 851,000 (where impressions are the number of times a post is displayed and reach is defined as the number of people who received impressions of a post). While there is no one hashtag that is used to tag discussions specifically about data disaggregation, a search of two words Asian and disaggregation generated approximately 60 tweets in Twitter in 2016 (from January to June). Most of the Tweets in this timeframe are related to California’s data disaggregation bill AB 1726, also known as the Accounting for Health and Education in API Demographics (AHEAD) Act, a bill authored and introduced by California Assemblyman Rob Bonta. One of the bill’s supporters, the Southeast Asia Resource Action Center (SEARAC) has been active on social media in promoting awareness of this bill and the need for data disaggregation especially to identify the unique needs of Hmong, Laotian, Cambodian, and Vietnamese populations in the U.S. in general, and California in particular. AB 1726 would amend current state code to require California state agencies, especially public institutions of higher education and public health, to expand the number of Asian American, Native Hawaiian, and Pacific Islander subgroups for which they collect and report data to also include Bangladeshi, Hmong, Indonesian, Malaysian, Pakistani, Sri Lankan, Taiwanese, Thai, Fijian, and Tongan Americans, among others. The hashtag #AB1726 is very used with 44 tweets in just one-week timeframe, with most activity occurring on June 2, 2016 when AB-1726 passed the Assembly Floor on a 44-19 vote. Both individual and organization handles have been posting on this topic – in the one-week timeframe, the 44 tweets by 27 unique users has resulted in nearly 70,000 impressions and a reach of about 50,000. Prior to this bill, AB 176 was introduced in California and would have created new statewide guidelines to collect disaggregated demographic data for AANHPI populations to address both health and education disparities. AB 176 was vetoed by Gov. Jerry Brown in October of 2015 and produced a lot of media attention on why Gov. Brown made the decision to veto. For example reporters for Which Way LA on public radio, KCRW, spent time speaking to key informants familiar with the bill and data disaggregation efforts. The program interviewed Professor Karthick Ramakrishnan of UC Riverside who leads the project AAPI Data, which generates data on civic participation and many other topics from Asian American and Pacific Islanders. AAPI Data has an active presence on Twitter and Facebook and regularly posts results from their Asian American Voter Survey as well as articles relevant to AAPI data.
13
Another notable organization active on Twitter is White House AAPI, which was created by President Barack Obama when he signed Executive Order 13515 reestablishing the White House Initiative on Asian Americans and Pacific Islanders in 2009. The Executive Order also established the President’s Advisory Commission on AAPIs and the Initiative’s Interagency Working Group. The Interagency Working Group recently established a subcommittee of key federal agencies to discuss data disaggregation and in March 2016 published a document containing an overview of best practices for providing disaggregated AAPI data. This White House AAPI publication, “Best Practices for the Disaggregation of Federal Data on Asian Americans and Pacific Islanders,” is discussed in more detail later in this report under Recommendations.
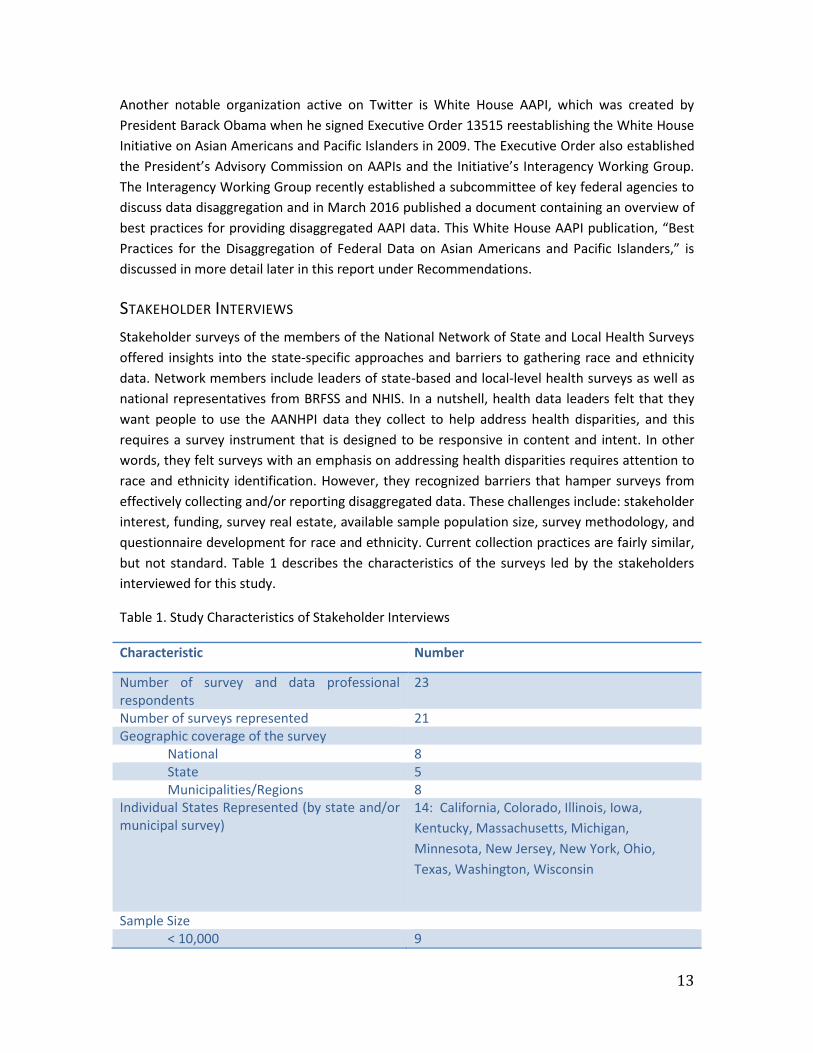
STAKEHOLDER INTERVIEWS Stakeholder surveys of the members of the National Network of State and Local Health Surveys offered insights into the state-specific approaches and barriers to gathering race and ethnicity data. Network members include leaders of state-based and local-level health surveys as well as national representatives from BRFSS and NHIS. In a nutshell, health data leaders felt that they want people to use the AANHPI data they collect to help address health disparities, and this requires a survey instrument that is designed to be responsive in content and intent. In other words, they felt surveys with an emphasis on addressing health disparities requires attention to race and ethnicity identification. However, they recognized barriers that hamper surveys from effectively collecting and/or reporting disaggregated data. These challenges include: stakeholder interest, funding, survey real estate, available sample population size, survey methodology, and questionnaire development for race and ethnicity. Current collection practices are fairly similar, but not standard. Table 1 describes the characteristics of the surveys led by the stakeholders interviewed for this study.
Table 1. Study Characteristics of Stakeholder Interviews
Characteristic Number
Number of survey and data professional respondents
23
Number of surveys represented 21 Geographic coverage of the survey
National 8 State 5 Municipalities/Regions 8
Individual States Represented (by state and/or municipal survey)
14: California, Colorado, Illinois, Iowa, Kentucky, Massachusetts, Michigan, Minnesota, New Jersey, New York, Ohio, Texas, Washington, Wisconsin
Sample Size
< 10,000 9
14
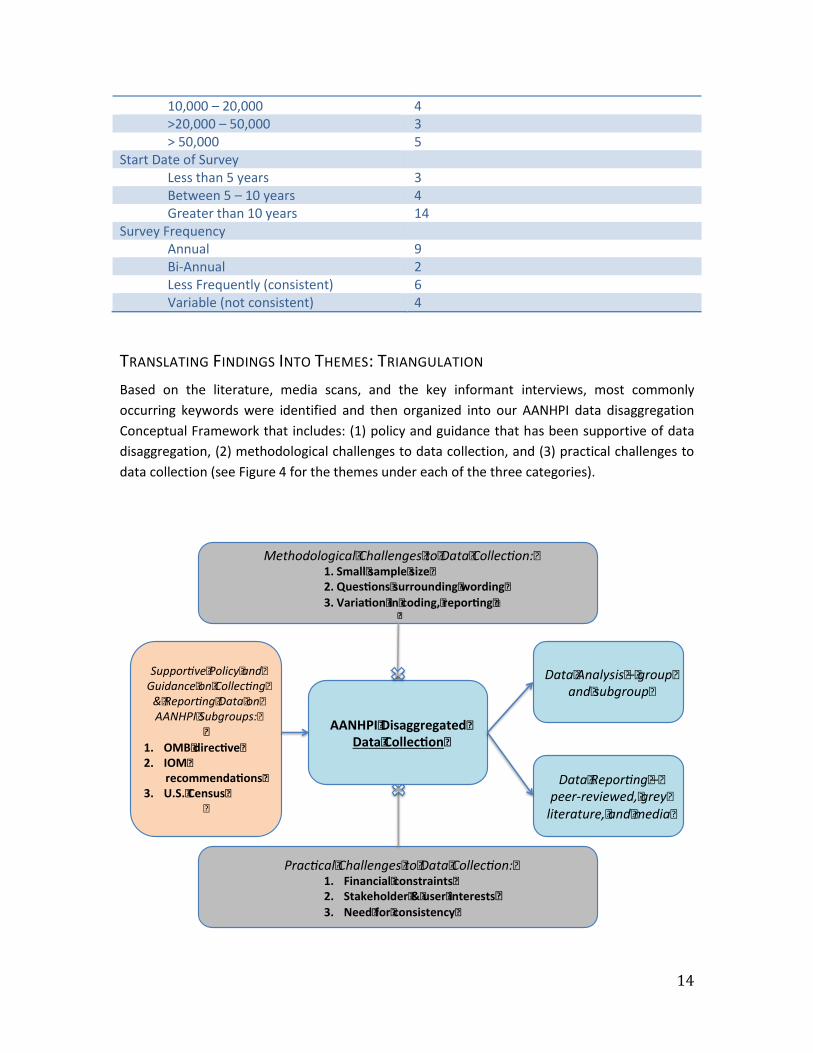
10,000 – 20,000 4 >20,000 – 50,000 3 > 50,000 5
Start Date of Survey Less than 5 years 3 Between 5 – 10 years 4 Greater than 10 years 14
Survey Frequency Annual 9 Bi-Annual 2 Less Frequently (consistent) 6 Variable (not consistent) 4
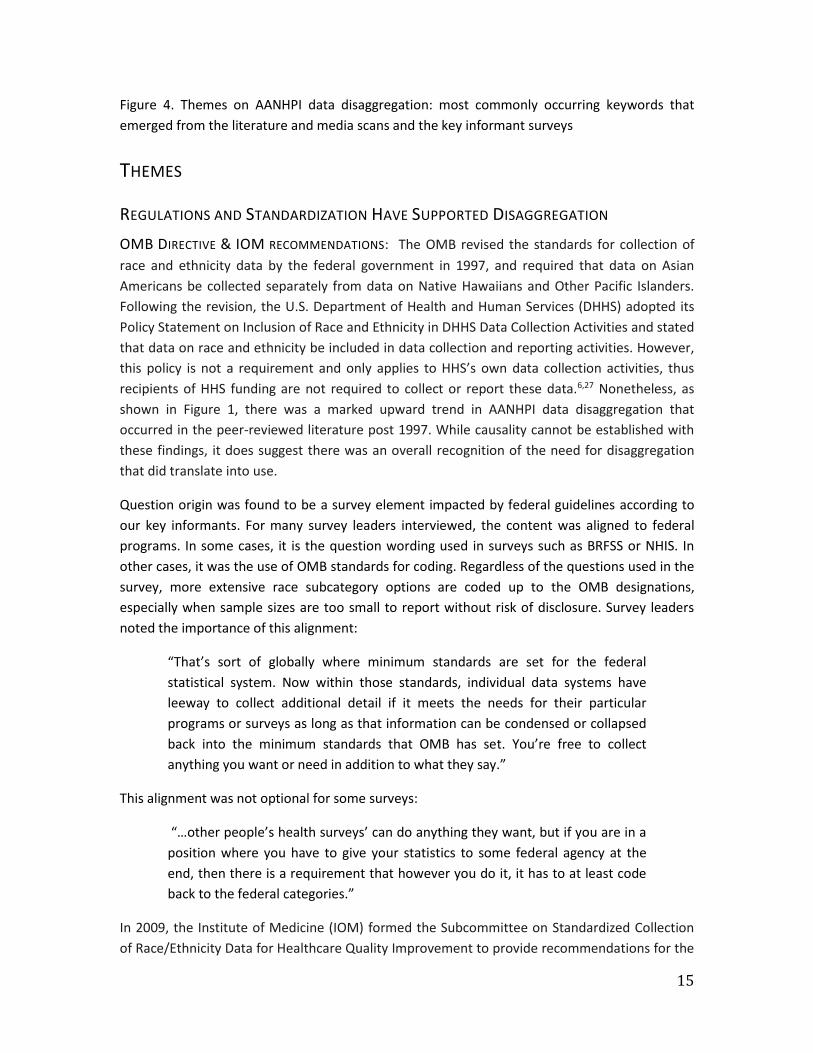
TRANSLATING FINDINGS INTO THEMES: TRIANGULATION Based on the literature, media scans, and the key informant interviews, most commonly occurring keywords were identified and then organized into our AANHPI data disaggregation Conceptual Framework that includes: (1) policy and guidance that has been supportive of data disaggregation, (2) methodological challenges to data collection, and (3) practical challenges to data collection (see Figure 4 for the themes under each of the three categories).
AANHPI�Disaggregated�Data�Collec on�
Suppor ve�Policy�and�Guidance�on�Collec ng�&�Repor ng�Data�on�AANHPI�Subgroups:�
�1. OMB�direc ve�2. IOM�
recommenda ons�3. U.S.�Census�
�
Methodological�Challenges�to�Data�Collec on:�1. Small�sample�size�2. Ques ons�surrounding�wording�3. Varia on�in�coding,�repor ng��
��
Prac cal�Challenges�to�Data�Collec on:�1. Financial�constraints�2. Stakeholder�&�user�interests�3. Need�for�consistency�
Data�Analysis�–�group�and�subgroup�
Data�Repor ng�–�peer-reviewed,�grey�literature,�and�media�
15
Figure 4. Themes on AANHPI data disaggregation: most commonly occurring keywords that emerged from the literature and media scans and the key informant surveys
THEMES
REGULATIONS AND STANDARDIZATION HAVE SUPPORTED DISAGGREGATION OMB DIRECTIVE & IOM RECOMMENDATIONS: The OMB revised the standards for collection of race and ethnicity data by the federal government in 1997, and required that data on Asian Americans be collected separately from data on Native Hawaiians and Other Pacific Islanders. Following the revision, the U.S. Department of Health and Human Services (DHHS) adopted its Policy Statement on Inclusion of Race and Ethnicity in DHHS Data Collection Activities and stated that data on race and ethnicity be included in data collection and reporting activities. However, this policy is not a requirement and only applies to HHS’s own data collection activities, thus recipients of HHS funding are not required to collect or report these data.6,27 Nonetheless, as shown in Figure 1, there was a marked upward trend in AANHPI data disaggregation that occurred in the peer-reviewed literature post 1997. While causality cannot be established with these findings, it does suggest there was an overall recognition of the need for disaggregation that did translate into use.
Question origin was found to be a survey element impacted by federal guidelines according to our key informants. For many survey leaders interviewed, the content was aligned to federal programs. In some cases, it is the question wording used in surveys such as BRFSS or NHIS. In other cases, it was the use of OMB standards for coding. Regardless of the questions used in the survey, more extensive race subcategory options are coded up to the OMB designations, especially when sample sizes are too small to report without risk of disclosure. Survey leaders noted the importance of this alignment:
“That’s sort of globally where minimum standards are set for the federal statistical system. Now within those standards, individual data systems have leeway to collect additional detail if it meets the needs for their particular programs or surveys as long as that information can be condensed or collapsed back into the minimum standards that OMB has set. You’re free to collect anything you want or need in addition to what they say.”
This alignment was not optional for some surveys:
“…other people’s health surveys’ can do anything they want, but if you are in a position where you have to give your statistics to some federal agency at the end, then there is a requirement that however you do it, it has to at least code back to the federal categories.”
In 2009, the Institute of Medicine (IOM) formed the Subcommittee on Standardized Collection of Race/Ethnicity Data for Healthcare Quality Improvement to provide recommendations for the
16
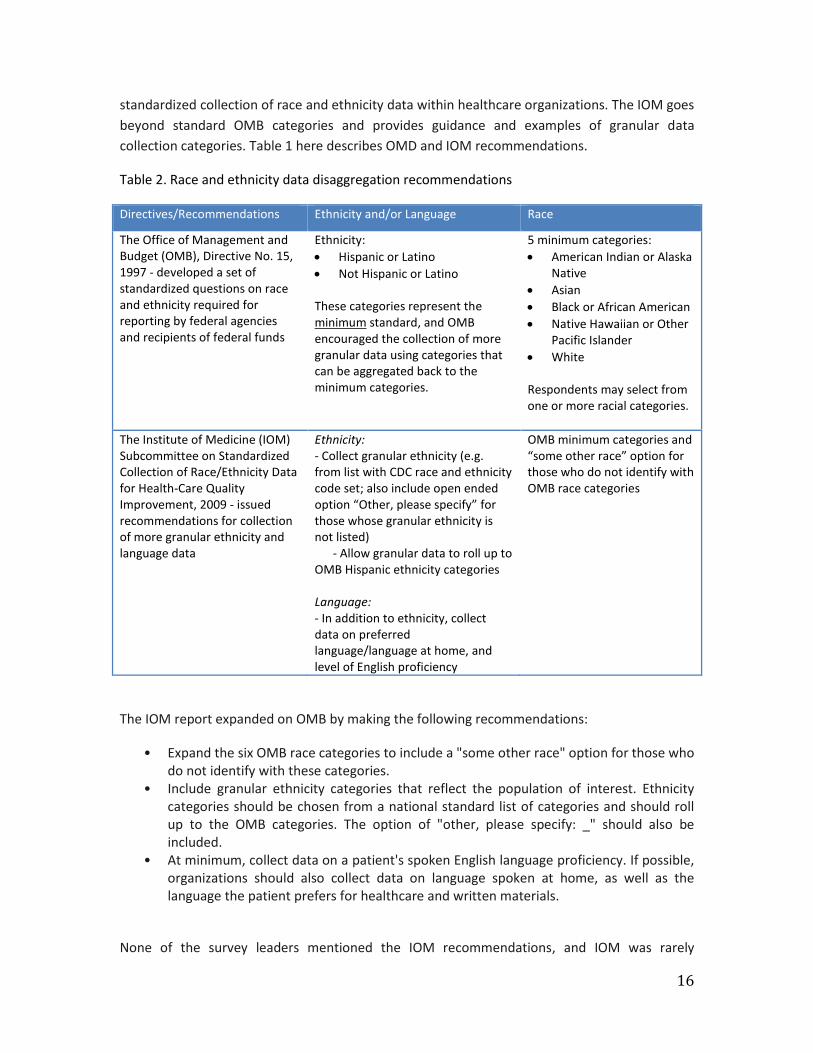
standardized collection of race and ethnicity data within healthcare organizations. The IOM goes beyond standard OMB categories and provides guidance and examples of granular data collection categories. Table 1 here describes OMD and IOM recommendations.
Table 2. Race and ethnicity data disaggregation recommendations
Directives/Recommendations Ethnicity and/or Language Race
The Office of Management and Budget (OMB), Directive No. 15, 1997 - developed a set of standardized questions on race and ethnicity required for reporting by federal agencies and recipients of federal funds
Ethnicity: • Hispanic or Latino • Not Hispanic or Latino These categories represent the minimum standard, and OMB encouraged the collection of more granular data using categories that can be aggregated back to the minimum categories.
5 minimum categories: • American Indian or Alaska
Native • Asian • Black or African American • Native Hawaiian or Other
Pacific Islander • White
Respondents may select from one or more racial categories.
The Institute of Medicine (IOM) Subcommittee on Standardized Collection of Race/Ethnicity Data for Health-Care Quality Improvement, 2009 - issued recommendations for collection of more granular ethnicity and language data
Ethnicity: - Collect granular ethnicity (e.g. from list with CDC race and ethnicity code set; also include open ended option “Other, please specify” for those whose granular ethnicity is not listed) - Allow granular data to roll up to OMB Hispanic ethnicity categories Language: - In addition to ethnicity, collect data on preferred language/language at home, and level of English proficiency
OMB minimum categories and “some other race” option for those who do not identify with OMB race categories
The IOM report expanded on OMB by making the following recommendations:
• Expand the six OMB race categories to include a "some other race" option for those who do not identify with these categories.
• Include granular ethnicity categories that reflect the population of interest. Ethnicity categories should be chosen from a national standard list of categories and should roll up to the OMB categories. The option of "other, please specify: _" should also be included.
• At minimum, collect data on a patient's spoken English language proficiency. If possible, organizations should also collect data on language spoken at home, as well as the language the patient prefers for healthcare and written materials.
None of the survey leaders mentioned the IOM recommendations, and IOM was rarely
17
mentioned in any of the articles pulled for the literature synthesis (in contrast to OMB, which was the most highly cited keyword). Several survey leaders did note, however, the use of an ancestry question rather than language as an additional question to the race/ethnicity set. Four survey leaders noted that their programs utilized an additional question regarding a respondent’s ancestry. These questions were not standard, and may have been asked as an identification of ancestry, or of the birth country of the respondent or their parents. Some used the additional information in the overall coding of a respondent’s race/ethnicity.
One survey leader noted the use of the ancestry question as an aid in understanding the racial or ethnic make-up of individuals who self-report as mixed race:
“We used two rounds of questioning. One round was the standard Census questions that allow people to respond if they are mixed race, select their racial category, and then have some what we would call ‘residual categories’ that are not classifiable into one particular racial group. But we also ask questions about ancestry. We wanted to know where their parents were born, as well as where they were born, but certainly where their parents were born. And then what they considered their ancestry as being and we provided a variety of coding options since the survey was both online and CATI telephone listed. The CATI coders would then respond to the ancestry responses but online they were able to choose one of them on, oh, seventy or eighty categories on ancestry.”
U.S. CENSUS: The U.S. Census surveys are the best sources of information on AANHPI subpopulations. The U.S. Census is limited to demographic data; however the Current Population Survey (CPS) and American Community Survey (ACS) collect information on health insurance, ACS collects information on disability, and these data can be broken down by subpopulation. The U.S. Census follows OMB guidelines, so many surveys noted alignment with their questions and/or categories. In particular, the Census use of a ‘mixed race’ category has translated into use in many of the health surveys we interviewed.
METHODOLOGICAL CHALLENGES TO DATA COLLECTION SMALL SAMPLE SIZE As described in Table 2 of Appendix B that includes a scan of large population-based datasets, national datasets such as NHIS, the National Health and Nutrition Examination Survey (NHANES), the MEPS, and the Early Childhood Longitudinal Survey, do include AANHPI subpopulation data collection. However, even in these large national surveys, sample sizes of subpopulations are often too small to permit meaningful data analysis.6,27 In 2011, NHANES oversampled Asians in larger cities and worked with the Asian community and advocacy groups for outreach to recruit respondents. Response rates for Asian subpopulations was found to be challenged by the lack of interviewers able to conduct the survey in appropriate Asian languages, as well as cultural attitudes and beliefs about participating in surveys.35
18
There is no consistency in obtaining AANHPI subpopulation data state to state in CDC’s Behavioral Risk Factor Surveillance System (BRFSS). There is also variation by state in AANHPI race/ethnicity data collection for National Vital Statistics; Chinese, Japanese, Hawaiian, and Filipino are identified in all states, but only some states include other Asian subpopulations such as Vietnamese and Korean.25
“It is small” was a regular comment from survey leaders when asked about the size of the AANHPI population represented in their data set. Two leaders cited their sample size of less than 3.5% of the full survey sample; others noted such statistics as ‘53 respondents out of 2500 interviews’ and ’15 out of 1962’ categorized themselves as AANHPI. One survey leader noted that in their entire sample of 1000, only one person had identified as Native Hawaiian or Pacific Islander. One survey leader attempted to collect racial sub-groups, but then reverted to standard OMB because the samples weren’t big enough.
In referring to the non-white population in their survey catchment area, one study respondent expressed a common frustration:
“We have a little bit of everybody, but not enough of anybody to really focus in on.”
Oversampling strategies are not as effective as survey leaders would prefer and cause issues with data quality:
“We’ve been looking for a long time for a way to expand our sample. You know, the challenge is that traditional oversampling strategies are not really feasible because the NHPI population is, you know, 0.4% of the total U.S. population, so I mean it’s, it’s relatively small and they’re geographically clustered, which means that, you know, in the parts of the country where they’re clustered it’s relatively easy to identify them, but in the parts of the – I mean easy in the sense that if you took a sample, a relatively high percentage of the households you went to would be – would have an NHPI person, but in the rest of the country, you would have to sample many, many, many households in order to find just one household with an NHPI person. And we are a national survey, we want to – our goal is to report a national statistic, so we can’t just sample in areas where the NHPI is clustered, we need to sample across the whole country. So – so we needed to find an innovative way to identify a nationally representative sample.”
This challenge is also found at the state level:
“I’m not the state demographer but I think (the population has) been pretty consistently Vietnamese and Hmong. And even though we sample and we over sample a lot… I mean to the extent that you know we have some design effect issues. Even though we oversample we’re still not getting what we would need
19
to feel comfortable reporting anything out by sub-cat…by sub-group like that. So it’s really frustrating and I feel like you know we’ve tried really hard so…but you know…so one thing is the measurement, and the other is kind of sample design, and then the other is response rates, right?”
Eight leaders said their surveys had or were in the process of using oversampling strategies in their surveys for target populations. Five surveys had specifically oversampled AA or AANHPI populations. A few surveys noted that it was not specifically AA, but a subgroup they knew to be growing in size that was the target:
“We over-sampled for Vietnamese specifically. And we did that several ways. One was by screening the postal service delivery files for Vietnamese names, which is a fairly common technique, I think, in over-sampling. And the other was locationally because we used an address-based sample. We were able to identify neighborhoods with high concentrates of Vietnamese and to over-sample addresses in those neighborhoods. And so our primary emphasis in the Asian population was on Vietnamese, although again we were intent on separating out our South Asian from our East Asian respondents in addition to over-sampling for Vietnamese.”
Disclosure Risk: While many survey leaders noted that there was no reason to collect R/E subgroups given the small population in the catchment area, other surveys noted that they did collect subgroups but were unable to do anything with the data due to disclosure risk. Often the decision to attempt to include a particular subgroup was tied to the Census or perceptions of change in population make-up. However, the sample did not always allow for appropriate thresholds for data reporting. One survey leader noted that their project used a 5% rule; any subgroup becomes its own group when it is 5% of the sample population. However, not all surveys used the same standard. One national survey leader indicated that they were considering setting some standardized thresholds for when a subgroup could be taken out of the ‘other’ category and made its own group, but had not yet reached a policy. Approximately half the surveys with publically available data had a set policy on data disclosure risk. Groups that had a specific disclosure policy reported cell limits that ranged from 5 cases to 50. Others did not have one, are in the process of creating a formal policy, or employ a panel for a case-by-case review:
“It’s not just an issue of sample size for a single race group. It’s a combination of other information available on the data file that could pose a disclosure risk. And there are lot of factors that have to be taken into account.”
Other leaders echoed a similar process:
“So there is a public use data file that they are expecting to have available in 2016. Right now, we are still going through all of the issues around disclosure risks because even looking within the Pacific Islander groups about what groups
20
we could show because we collected information for like probably about 35 different groups. But, in looking at what was releasable on a public use data file, again, we ran into the issue of combinations of pieces of information that pose a disclosure risk. So I don’t know what’s going to—the final decision is going to be. That’s being looked at right now about what variables will be released on a public use data file in terms of like population, you know, sub-population information for Native Hawaiian. So, like, there’s a Global Polynesian, Micronesian and Melanesian and within that, you know, we’re trying to break the groups out. I don’t think that’s going to happen.”
And: “It’s set, as I said, it’s set by our Data Review Board. It’s not strictly—a sample size is a major factor, but it’s not just sample size. They look at a number of characteristics across the file, whether it be a combination, for example, of a smaller race and ethnic population group and a rare type of illness or disease or a clustered location in the country, or, if any—they look at a number of factors and determine—I don’t know what the algorithm is, exactly, that they use, but they determine and rank it in terms of disclosure risk. And I can tell you that on any—in any given survey year we do not get enough persons in Pacific Islander groups to show them separately. We’ve actually tried several times to do analyses with Pacific Islander populations and it’s just not very easy.”
QUESTION WORDING
Survey respondents were asked if they knew about the origin of the question wording used for survey variables collecting R/E information. Not all leaders were involved in the original question development. Several respondents knew, or believed, that the wording was a direct replica of a federal source such as BRFSS or NHIS. Some leaders also noted that their project reviewed multiple survey instruments when developing their questions. Most resources were federal surveys, though two survey programs employed private professional groups in the instrument development – the Institute for Policy Research and GFK Knowledge Network. Overall, the process for many was not an easy one. One respondent apologized that they could not provide a specific answer as to question origin:
“The problem that I’m having right now is that I’ve seen so many versions of experimental questions that never got used.”
Of the instrument sources used as a reference in questionnaire development, survey leaders mentioned:
NHANES – 1 Internal – 1
21
Census – 5 BRFSS – 4 Private Professional Groups – 2
Most surveys tend to align with standards published by the OMB and start with a question on ethnicity, asking if the respondent identifies as a Hispanic or Latino (Yes/No). If the answer is Yes, some move into subgroups for those categories. If the response is No, the respondent is then asked what race they identify as. It is at this point where the question wording has more variety. A few surveys ask this as an open-ended question. For some surveys, this represents the only items on race/ethnicity. Those that collected subgroups usually included them in additional questions, often with pre-selected lists of categories. Self-administered surveys were more likely to have open-ended categories where a respondent could write-in their selection. Some, but not all, surveys allowed respondents to select more than one race, or included a ‘mixed-race’ or ‘multi-race’ category, as now used in the Census.
One survey is conducting an experiment in which the very first question is open-ended. The next questions follow a more standard practice, and the survey team intends to review the alignment between a respondent’s initial self-identification and the category selected once the respondent is presented with a specific list of groups.
Eight survey leaders noted that the question they used for race/ethnicity had changed over the life of the survey. Reasons for the change were a response to internal interest, aligning with the Census or OMB standard, and an expansion or collapsing of categories (both in response to changing population make-up or the limited sample being captured in certain subgroups).
Four surveys collect AANHPI as a single group. Six surveys collect AA and NHPI as separate groups, but do not include subcategories. Among the 11 surveys that collected AA subgroups, the categories included by number of surveys is:
Afghan - 1 Asian Indian - 7 Chinese – 8 East Asian - 1 Filipino - 7 Japanese - 7 Korean - 7 Pakistani - 2 Southeast Asian - 1 Vietnamese - 7
Among the six surveys that collected NHPI subgroups, the categories included by number of surveys is:
Native Hawaiian - 6 Guamanian (or Chamorro) - 6
22
Samoan - 6 Tongan - 2 Other PI – 4
VARIATION IN CODING, REPORTING There is consensus in the research community that the OMB race/ethnicity categories at the least were a major step away from the former common practice of failing to disaggregate and thus lumping Asian and Pacific Islander together.36,37 However, there is now increasing concern that AANHPI populations may not identify into OMB categories as they have been defined.38 For example, in a study of members of Kaiser Permanente Hawaii, 11% of single heritage Filipino respondents did not mark Asian on the OMB measure as they should be categorized.
One of our key informant respondents indicated that their survey engaged in significant race re-coding, noting as an example that many people self-selected as Pacific Islander in initial responses, but in an interview drill-down, it was uncovered that the person was Caribbean Islander, but considered the term ‘Islander’ to be closest to their identity.
Surveys that included an ancestry question may also have let that response impact the final coding of a respondent’s R/E.
“(We use) an open-ended question where we ask what racial or ethnic group do you consider yourself to be? And we code exactly what they say. And then we go into the more standard questions…we give a little bit of an intro that we need to compare the results to national findings and so we do need to categorize them in kind of a more standardized way as well.”
And, “So then we looked at whether or not the racial designation lined up with the ancestry indications and in some incidences could correct a coding that we thought was done in error. So, it was more of a quality assurance than it was a measurement validity issue at that point. We were anxious to get random coding errors out. And that was one way we tried to validate.”
Our key informants expressed some concern that OMB guidelines need to be revised, though the responses were not limited to AANHPI groups. Most commonly described was the problem with the ethnicity question regarding Hispanic, Latino or Spanish origin, as survey participants often could not understand how to answer the race question, which seems to be confused with origin, after having already answered ethnicity in a two-part question format. Another example discussed is the category of American Indian, which a key informant felt is an issue when they need to categorize Canadian Indians or South American Indians. Also, the respondent noted that Russians are categorized as white, which became an issue when they had a funder who was specifically interested in the Russian-immigrant community.
23
Some noted challenges in the perception of some racial/ethnic categories. One respondent felt that, culturally, Fijian Indians were more similar to South Asians than to Pacific Islanders. Another survey leader found instances of misrepresentation due to the limited number of subgroups offered. There is also some dispute over definitions, such as Filipino being Asian respondents. These categories have some variance among surveys and some difference among respondents when they are asked to self-identify with a larger group such as AA versus NHPI.
Survey leaders also acknowledged that a lack of options provided in a question with pre-selected answer options contributed to misidentification of some survey respondents. One study respondent relayed comments she heard from a survey interviewer that someone who considered themselves as a ‘Caribbean Islander’ may select ‘Pacific Islander’ as the closest term matching their identification.
One survey leader indicated that there is also challenge in a lack of understanding of race versus ethnicity. In the case of that survey, they found that many Hispanics are confused by the OMB questions, which start with asking if a respondent is Hispanic or not. The follow-up question asks about race, but they find many respondents who answered yes to the first question either leave the second question blank, or answer that they are white.
“Okay, so the first question we ask about Hispanic ethnicity. So we ask people if they consider themselves Hispanic or Latino. If they say yes, we ask them what the source of their Hispanic heritage or identity comes from. That’s a list of a number of countries. So, after the Hispanic identity question, we then ask people what their—ask them to tell us their race. And we have a special prompt for those people who have identified themselves as being Hispanic by saying that some people, in addition to considering themselves Hispanic also have a race or consider themselves to have a race. Even with that, I’d say maybe half the people that tell us they’re Hispanic have a very difficult time telling us their race. So then after then—there is multiple—people can select multiple races. At the end of their multiple races they’re asked, if they gave more than one, what race best represents them. And then we’ve actually experimented with a couple different follow-ups to that question. Actually I guess even before that, we also ask people if they’re not born in the U.S., we ask them the country of origin. And then we’ve been experimenting with two different follow-ups. First for—directed at U.S.-born respondents—so if U.S.-born respondents identify one of their racial identities as black in some years we’ve asked them if one or more of their parents were of Caribbean or West Indies descent, but we haven’t done that every year. And then in about maybe 2012, we added a question for U.S.-born respondents that identify—gave Asian as one of their racial identities—we’ve been asking the question about what they consider to be the source of their origin of their Asian race.”
24
The use of a mixed-race or multi-race category is also presenting challenges for many survey leaders:
“So in the past, we would ask these race ethnicity questions and then at the very end, if someone is of multi-race, multi-ethnic person, they had the option of picking or we sort of ask, do you want to be identified as one particular race or ethnic group. And basically, we sort of force them to picking one choice, one category. The OMB decided that or said that that’s not how we should be asking these questions. So in 2009 basically, if someone is of multi-race multi-ethnic group, we give the option of you said you’re of this race and this ethnic group basically multi-racial and ethnic group, do you identify with one group or the other? It’s basically yes/no question. And if they say yes, then we could ask the follow up question of which group -- which race do you identify more with?”
The survey leader working with the experimental open-ended question was also challenged by the multi-race question:
“Well, I think it’ll be interesting to compare whether people -- what people put for that question and then how they categorize themselves when -- the choices were much more narrow. Just you know based on what I saw from the preliminary data, there were lots of answer choices or responses to the first question that wouldn’t fall under just the typical you know and that would maybe be multiracial or just the different name for a certain race category that wasn’t included in preface or the census, so I think -- I think that’s actually really rich data and we still need to figure out exactly how to use it. But I do think you know working very closely with minority communities we’ve heard time and time again that this is a very sensitive question. So, I think that doing it in a way that’s respectful and in a way that allows them to respond however they want first is a good approach for the communities we work with.”
PRACTICAL CHALLENGES TO DATA COLLECTION
FINANCIAL CONSTRAINTS
As discussed above, small sample size is one of the most commonly cited challenges to collecting data on AANHPI and other subpopulations.39 However, survey leaders all did recognize the need for measuring AANHPI health, and financial constraint was often cited as a challenge to trying to find ways to increase sample sizes for their surveys or to try other methodologies to capture subpopulations. A discussion of these strategies, which include oversampling, pooling
25
data, and targeted surveys, is discussed in more detail in the next section of this report under Recommendations.
Four survey leaders specifically indicated that funding impacted the race/ethnicity content in the survey. One leader talked about having stakeholder groups understand the cuts:
“And so we went back to community-based organizations and just said you know…choose what’s happening. It's taking up survey real estate that we…that you know it takes time to get those answers. (Some data) we ended up never being able to use it and if you can’t justify the presence for that question then you have to get rid of it. And so we continued to do the standard OMB questions, but we could not support having to refined vary kind of geographically specific subcategories of Asian or black…”
STAKEHOLDER AND USER INTERESTS
Survey leaders were asked to discuss the process through which race/ethnicity categories and subcategories are selected for use during data collection and who (or what) influences those decisions. The responses varied among the surveys.
Only one survey leader mentioned policy outside the federal standards. The local city council took an interest in race/ethnicity categories that would have impacted all city data collection, including their survey:
“(The city) Council, you know, who obviously have some control over budgeting for city government—I think they were either developing or trying to pass legislation that would require collection of up to 22 different Asian subgroups and it wasn’t totally clear what type of information needed to have these distinctions whether it was just administrative data or whether it was survey data. Either way, it’s a very substantial change in data collection, so, but my understanding is that while that was proposed by the council, it actually hasn’t really gone anywhere.”
As a first cut at race/ethnicity content, question wording decisions were largely made by survey staff and stakeholder groups, which generally meant funders, policy makers, and data users. However, the ability to actually include questions to meet those desires was influenced by three factors: 1- availability of the population in significant numbers, 2- stakeholder and user interest (use of the data), and 3 - survey real estate. Many surveys have a limited questionnaire length, either because of an interest to limit respondent burden, or as a matter of finances. As discussed, getting at certain populations sometimes requires a lengthier question set, and additional survey time is added cost. Four survey leaders specifically indicated that funding impacted the R/E content in the survey.
26
Some survey leaders noted a specific interest in health disparities as an influence in race/ethnicity categories:
“Mostly we need to have the information to better understand health outcomes and the conditions that impact health and the delivery of our services.”
Four noted the presence of an external or internal advisory board. The boards were comprised of various stakeholders, but often included community groups.
Other survey leaders also formally and informally took account of the use – potential and realized - of the data by analysts and researchers. This category influenced the decisions to include and exclude certain populations.
One survey leader lamented the loss of the inclusion of a category specifically for Caribbean/West Indies, noting that 25% of the African-American population in the survey catchment area was of West Indies origin. However, the group was later dropped because no one appeared to be making use of the information. The same survey leader was happy to report, however, that the Asian American subgroups were being utilized, and felt confidant that the categorizations would remain. Another survey leader built on this observation. While it was important to have stakeholder demand for the data, it was then equally important to have a funding source willing to support the effort.
NEED FOR CONSISTENCY
Health research relies on examining trends and this was echoed by survey leaders in this study who mentioned the need to monitor population trends and potentially adjust surveys to reflect demographic shifts in their populations. In considering the race/ethnicity groups for potential inclusion, one survey looked at data collected by the largest school district in the county on the in-home languages spoken by their students. Another survey leader noted the opening of a manufacturing plant from a major foreign-based company was increasing the Korean population in a specific metropolitan area, and the team discussed how to adequately represent this population in their statewide survey.
Some surveys may be resistant to change due to the desire to be able to trend data over time.
“The race ethnicity questions really have not been modified in years. That’s one of the set of the questions on that survey that are relative, you know, if you think about 20 years’ worth of data, consistent just for trends and that kind of thing.”
Others agreed:
27
“if we start changing the question that – we lose that, that ability to say that, you know, there is consistency between the surveys. So, I think those two concerns would probably trump any other concerns.”
Another survey maintains the NHPI population as a single category due to its small size, but maintains it separately from the Asian American category noting:
“The argument for keeping that question the same is so that we can cross-compare (with) the other states and other people.”
Most survey leaders acknowledged that, for their projects, the AANHPI subgroups collected in a survey might not match the subgroups reported out in data files. For surveys represented in this study, dissemination activities ranged from public and restricted data files, to internal and external analysis and reports. One survey made no data publically available; the data was only available for internal researchers.
Most surveys made multiple data sets available – those that were public and those that were confidential and could only be used internally or with research project approval from an independent review board. For those, there was a difference between those data made publically available, and the confidential data files.
Some survey leaders noted they not able to make even AANHPI available as a category for any public file:
“In our region we have very, very few Asians, Native Americans, American Indians. All of those—when we analyze the data, all of those data are collapsed into one other category and even the other category is generally too small to analyze on its own. So in our region we’re about 80% White, 18% African-American, and 2% other.”
There are differences in the data collected and the data reported; many surveys that collect disaggregated data must roll up for reporting. Some data is also useable in specific categories. One leader noted that their data is used significantly to review policy issues, and they review data at the R/E level when there is a policy issue that demonstrates a disparity:
“So for example one of our briefs….looked at influenza vaccination rates and we looked at race/ethnicity…and we looked at black-white differences and we found that there was a great disparity. We put that in the brief because that’s something that can be very actionable in terms of saying here is a very specific intervention in terms of doing vaccinations and this is something that either our state health department of providers or health systems can understand that is a real disparity and they may want to look at interventions in the community to increase vaccination rates.”
28
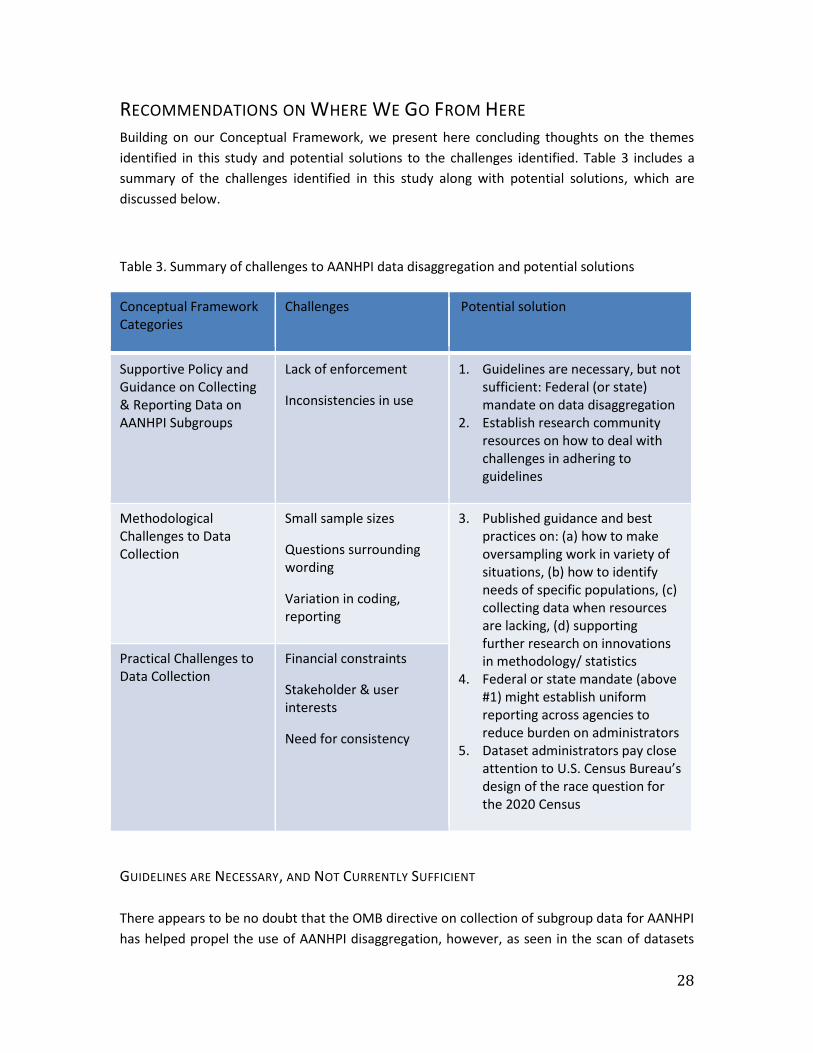
RECOMMENDATIONS ON WHERE WE GO FROM HERE Building on our Conceptual Framework, we present here concluding thoughts on the themes identified in this study and potential solutions to the challenges identified. Table 3 includes a summary of the challenges identified in this study along with potential solutions, which are discussed below.
Table 3. Summary of challenges to AANHPI data disaggregation and potential solutions
Conceptual Framework Categories
Challenges Potential solution
Supportive Policy and Guidance on Collecting & Reporting Data on AANHPI Subgroups
Lack of enforcement
Inconsistencies in use
1. Guidelines are necessary, but not sufficient: Federal (or state) mandate on data disaggregation
2. Establish research community resources on how to deal with challenges in adhering to guidelines
Methodological Challenges to Data Collection
Small sample sizes
Questions surrounding wording
Variation in coding, reporting
3. Published guidance and best practices on: (a) how to make oversampling work in variety of situations, (b) how to identify needs of specific populations, (c) collecting data when resources are lacking, (d) supporting further research on innovations in methodology/ statistics
4. Federal or state mandate (above #1) might establish uniform reporting across agencies to reduce burden on administrators
5. Dataset administrators pay close attention to U.S. Census Bureau’s design of the race question for the 2020 Census
Practical Challenges to Data Collection
Financial constraints
Stakeholder & user interests
Need for consistency
GUIDELINES ARE NECESSARY, AND NOT CURRENTLY SUFFICIENT There appears to be no doubt that the OMB directive on collection of subgroup data for AANHPI has helped propel the use of AANHPI disaggregation, however, as seen in the scan of datasets
29
and based on the key informant interviews, there remains a lack of consistency in the use of OMB categories. The OMB directive – as well as other attempts to encourage data disaggregation, such as the IOM recommendation – are necessary for the move towards standardizing data collection and reporting; however they are not sufficient. Inconsistencies in the use of OMB standards, lack of guidance for participants of the surveys who may not understand the categories, and the lack of enforcement of standards may be important keys to encouraging the use of disaggregation. A similar experience has been the National Standards for Culturally and Linguistically Appropriate Services (CLAS) in Health and Health Care, which are intended to advance health equity, improve quality, and help eliminate health care disparities standards for culturally and linguistically appropriate services. Some states have embraced the importance of cultural and linguistic competency since the introduction of the National CLAS Standards by passing legislation pertaining to cultural competency training for one or more segments of their state’s health professionals, mandating some form of cultural and linguistic competency for either all or a component of its health care workforce. Overall, we found a desire to have guidelines, and the existing resources have facilitated an interest in aligning data sets. However the guidelines also create barriers for practical implementation, particularly for surveys that lack an available population subgroup within the sample, and those with limited resources.
RESOURCES FOR DATA ADMINISTRATORS & RESEARCHERS
In this study, several survey leaders noted that they were open to new guidance and would seek outside assistance for potential changes (improvements) if available. Changes in race/ethnicity categories may be prompted by changes in demographics in a survey catchment area. Survey leaders might also consider changes if they had funding for an oversample, and/or a better strategy for collecting an oversample on targeted populations. One survey leader specifically noted that if there was an interest in a specific policy area that required data on a particular subgroup, that could prompt a change in the survey instrument.
Survey leaders would like to offer more choice to respondents:
“I think there is a lot of interest in going beyond those broad categorizations and allowing people to not have to put themselves in a bucket that doesn’t feel right.”
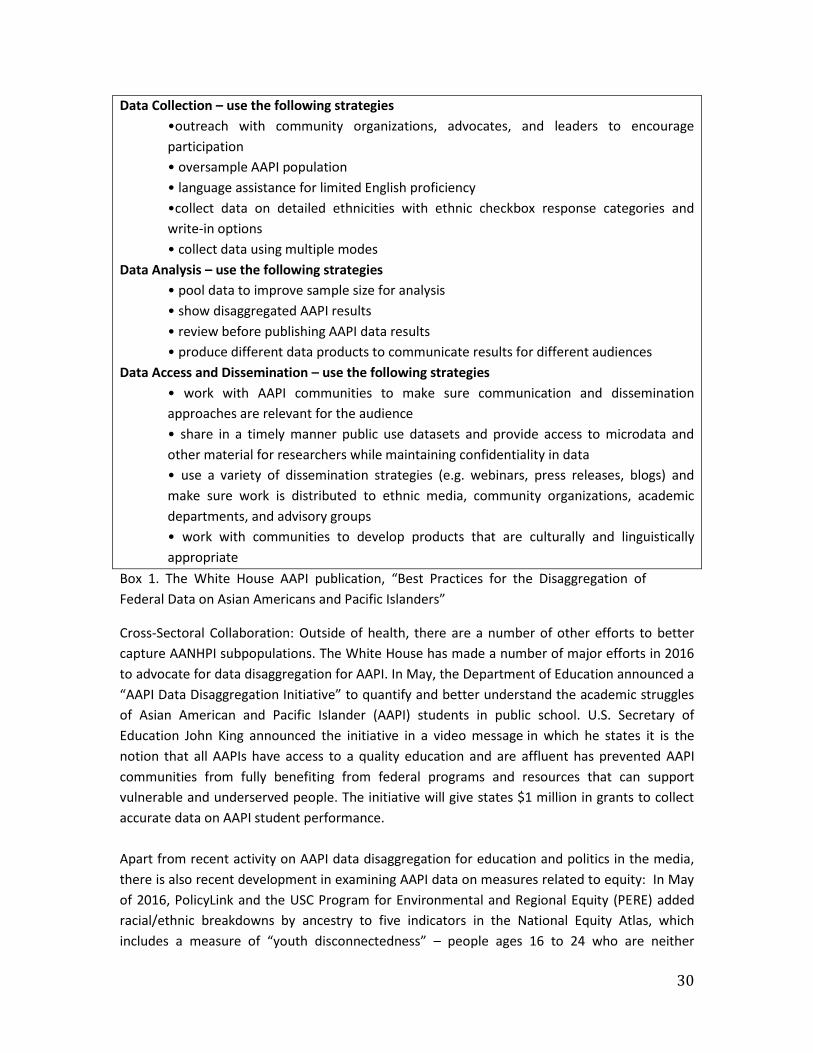
This expressed interest in understanding other strategies that can be used to better capture populations in their community is generating interest. The White House AAPI publication, “Best Practices for the Disaggregation of Federal Data on Asian Americans and Pacific Islanders” published in 2015, offers a number of strategies (see box below) and is a building point for application to real-world settings.
30
Data Collection – use the following strategies
•outreach with community organizations, advocates, and leaders to encourage participation • oversample AAPI population • language assistance for limited English proficiency •collect data on detailed ethnicities with ethnic checkbox response categories and write-in options • collect data using multiple modes
Data Analysis – use the following strategies
• pool data to improve sample size for analysis • show disaggregated AAPI results • review before publishing AAPI data results • produce different data products to communicate results for different audiences
Data Access and Dissemination – use the following strategies
• work with AAPI communities to make sure communication and dissemination approaches are relevant for the audience • share in a timely manner public use datasets and provide access to microdata and other material for researchers while maintaining confidentiality in data • use a variety of dissemination strategies (e.g. webinars, press releases, blogs) and make sure work is distributed to ethnic media, community organizations, academic departments, and advisory groups • work with communities to develop products that are culturally and linguistically appropriate
Box 1. The White House AAPI publication, “Best Practices for the Disaggregation of Federal Data on Asian Americans and Pacific Islanders”
Cross-Sectoral Collaboration: Outside of health, there are a number of other efforts to better capture AANHPI subpopulations. The White House has made a number of major efforts in 2016 to advocate for data disaggregation for AAPI. In May, the Department of Education announced a “AAPI Data Disaggregation Initiative” to quantify and better understand the academic struggles of Asian American and Pacific Islander (AAPI) students in public school. U.S. Secretary of Education John King announced the initiative in a video message in which he states it is the notion that all AAPIs have access to a quality education and are affluent has prevented AAPI communities from fully benefiting from federal programs and resources that can support vulnerable and underserved people. The initiative will give states $1 million in grants to collect accurate data on AAPI student performance. Apart from recent activity on AAPI data disaggregation for education and politics in the media, there is also recent development in examining AAPI data on measures related to equity: In May of 2016, PolicyLink and the USC Program for Environmental and Regional Equity (PERE) added racial/ethnic breakdowns by ancestry to five indicators in the National Equity Atlas, which includes a measure of “youth disconnectedness” – people ages 16 to 24 who are neither
31
working nor in school. Data on AAPI by ancestry are available for a region when the sample size has at least 100 survey responses (PolicyLink/PERE use 2015 ACS microdata from the Integrated Public Use Microdata Series).
NEED FOR BEST PRACTICES Several leaders invited improved methodologies and guidance on oversampling strategies:
“If I thought we could do any better than we are at capturing our small Asian community in our state survey I would consider it, absolutely. But that is always the group we struggle to capture. I mean it is a small portion of our population, generally.”
“Like I said our sample size is dwindling, you know as we go on, it’s impacted our unhealthy sample quite a bit. We do have to mask that category or some of the one year files that we released. And, I mean, we tried in the past to oversample that group but -- I think twice, we attempted it twice in terms of gathering work groups or attempting to gather work groups, but it just never worked, because it’s just -- there is no one method of doing it and there’s really no real good method of oversampling unhealthy.”
Best practices by large population surveys such as CHIS, which is the largest omnibus population-based state health survey in the country where or each cycle, could be used to help guide and promote disaggregation practices. CHIS collects information on 50,000 or more adults, teenagers and children, via telephone interview (landline or cellphone). Notably, CHIS is viewed as California’s critical data source on health status, health conditions, health insurance coverage, access to health care and health behaviors. CHIS is one of the first large-scale health surveys to interview in Cantonese, Mandarin, Korean, Vietnamese, Khmer, and Tagalog, in addition to English and Spanish. CHIS augments its random digit-dial approach with geographic targeting of surname list sample to oversample Koreans and Vietnamese. As a national model in facilitating population-based Asian subgroup estimates, CHIS continues to innovate and is currently considering cost-effective approaches to increasing the sample yield for NHPI population, such as address-based sampling, respondent-driven sampling, list-assisted samples and small domain estimation.
The immigrant experience for AANHPI is important to capture given close to 27% of the approximately 43.3 million foreign-born residents in the U.S. identify as Asian (single race) and 0.3% of foreign-born residents identify as Native Hawaiian Pacific Islander (U.S. Census Bureau, 2016).40 This growth of Asians as foreign-born residents is striking when you compare the 30% to 1960 when only about 5% of the foreign-born population in the U.S. identified as Asian.41 Among Asians in California, about 58% are foreign-born (2,846,000 of 4,928,000 in 2015 CHIS).42 CHIS also gathers data on mother’s and father’s (both adult and children) place of birth, language proficiency and other relevant characteristics essential to understanding immigrant
32
health. Notably, CHIS has also asked questions on citizenship and permanent resident status using consistent methodology since 2001. CHIS is the nation’s largest state health survey, conducted in the state with the nation’s largest foreign-born and unauthorized populations, both in terms of absolute size and percent of total population. Immigration status is a key determinant of access to services and to the lived experience of immigrant communities, but researchers have often worried that asking about immigration status is too sensitive and have omitted these questions. However, CHIS has found that participation in questions on immigrant status requires a number of protections put in place to protect the privacy of the individuals being surveyed. These protections include: clear and understandable agreement regarding confidentiality, restraints in releasing data, and the use of safe technologies to prevent data breaches. Thus, it is possible to include questions on citizenship and immigrant status in population health surveys that abide by protective measures and these data can be used to inform what the specific health needs of the population are and contribute to promoting health equity.
SUMMARY
We described here an overview of current practice of data collection and reporting for AANHPI groups in health-related population surveys with our scan of the of current sources of AANHPI data on health and health-related determinants, and insights on the challenges population-based surveys face in collecting and reporting data to inform policies and programs targeted towards AANHPI populations. Based on these findings we suggest published guidance and best practices on how to make oversampling work in variety of situations, how to identify needs of specific populations, how to collect data when resources are lacking, as well as potential federal or state mandates might help encourage data disaggregation and standardization of AANHPI data collection and reporting and encourage further work and methodology innovation in this area.
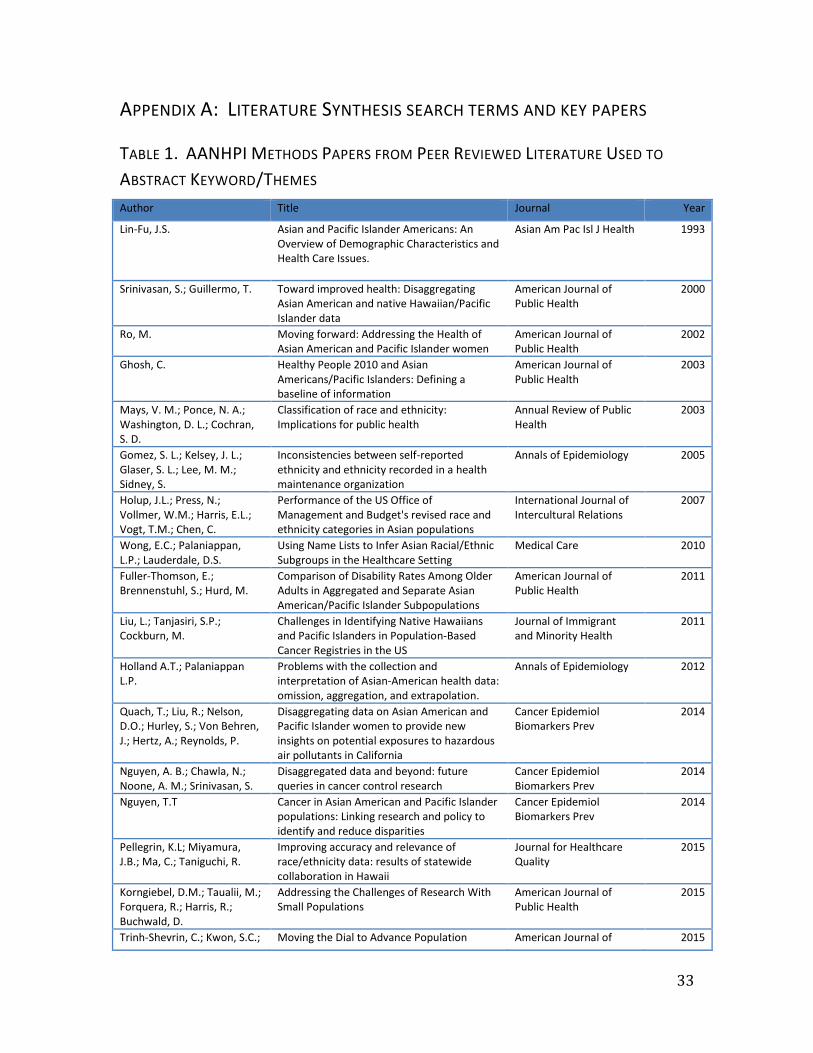
33
APPENDIX A: LITERATURE SYNTHESIS SEARCH TERMS AND KEY PAPERS
TABLE 1. AANHPI METHODS PAPERS FROM PEER REVIEWED LITERATURE USED TO
ABSTRACT KEYWORD/THEMES Author Title Journal Year
Lin-Fu, J.S. Asian and Pacific Islander Americans: An Overview of Demographic Characteristics and Health Care Issues.
Asian Am Pac Isl J Health 1993
Srinivasan, S.; Guillermo, T. Toward improved health: Disaggregating Asian American and native Hawaiian/Pacific Islander data
American Journal of Public Health
2000
Ro, M. Moving forward: Addressing the Health of Asian American and Pacific Islander women
American Journal of Public Health
2002
Ghosh, C. Healthy People 2010 and Asian Americans/Pacific Islanders: Defining a baseline of information
American Journal of Public Health
2003
Mays, V. M.; Ponce, N. A.; Washington, D. L.; Cochran, S. D.
Classification of race and ethnicity: Implications for public health
Annual Review of Public Health
2003
Gomez, S. L.; Kelsey, J. L.; Glaser, S. L.; Lee, M. M.; Sidney, S.
Inconsistencies between self-reported ethnicity and ethnicity recorded in a health maintenance organization
Annals of Epidemiology 2005
Holup, J.L.; Press, N.; Vollmer, W.M.; Harris, E.L.; Vogt, T.M.; Chen, C.
Performance of the US Office of Management and Budget's revised race and ethnicity categories in Asian populations
International Journal of Intercultural Relations
2007
Wong, E.C.; Palaniappan, L.P.; Lauderdale, D.S.
Using Name Lists to Infer Asian Racial/Ethnic Subgroups in the Healthcare Setting
Medical Care 2010
Fuller-Thomson, E.; Brennenstuhl, S.; Hurd, M.
Comparison of Disability Rates Among Older Adults in Aggregated and Separate Asian American/Pacific Islander Subpopulations
American Journal of Public Health
2011
Liu, L.; Tanjasiri, S.P.; Cockburn, M.
Challenges in Identifying Native Hawaiians and Pacific Islanders in Population-Based Cancer Registries in the US
Journal of Immigrant and Minority Health
2011
Holland A.T.; Palaniappan L.P.
Problems with the collection and interpretation of Asian-American health data: omission, aggregation, and extrapolation.
Annals of Epidemiology 2012
Quach, T.; Liu, R.; Nelson, D.O.; Hurley, S.; Von Behren, J.; Hertz, A.; Reynolds, P.
Disaggregating data on Asian American and Pacific Islander women to provide new insights on potential exposures to hazardous air pollutants in California
Cancer Epidemiol Biomarkers Prev
2014
Nguyen, A. B.; Chawla, N.; Noone, A. M.; Srinivasan, S.
Disaggregated data and beyond: future queries in cancer control research
Cancer Epidemiol Biomarkers Prev
2014
Nguyen, T.T Cancer in Asian American and Pacific Islander populations: Linking research and policy to identify and reduce disparities
Cancer Epidemiol Biomarkers Prev
2014
Pellegrin, K.L; Miyamura, J.B.; Ma, C.; Taniguchi, R.
Improving accuracy and relevance of race/ethnicity data: results of statewide collaboration in Hawaii
Journal for Healthcare Quality
2015
Korngiebel, D.M.; Taualii, M.; Forquera, R.; Harris, R.; Buchwald, D.
Addressing the Challenges of Research With Small Populations
American Journal of Public Health
2015
Trinh-Shevrin, C.; Kwon, S.C.; Moving the Dial to Advance Population American Journal of 2015
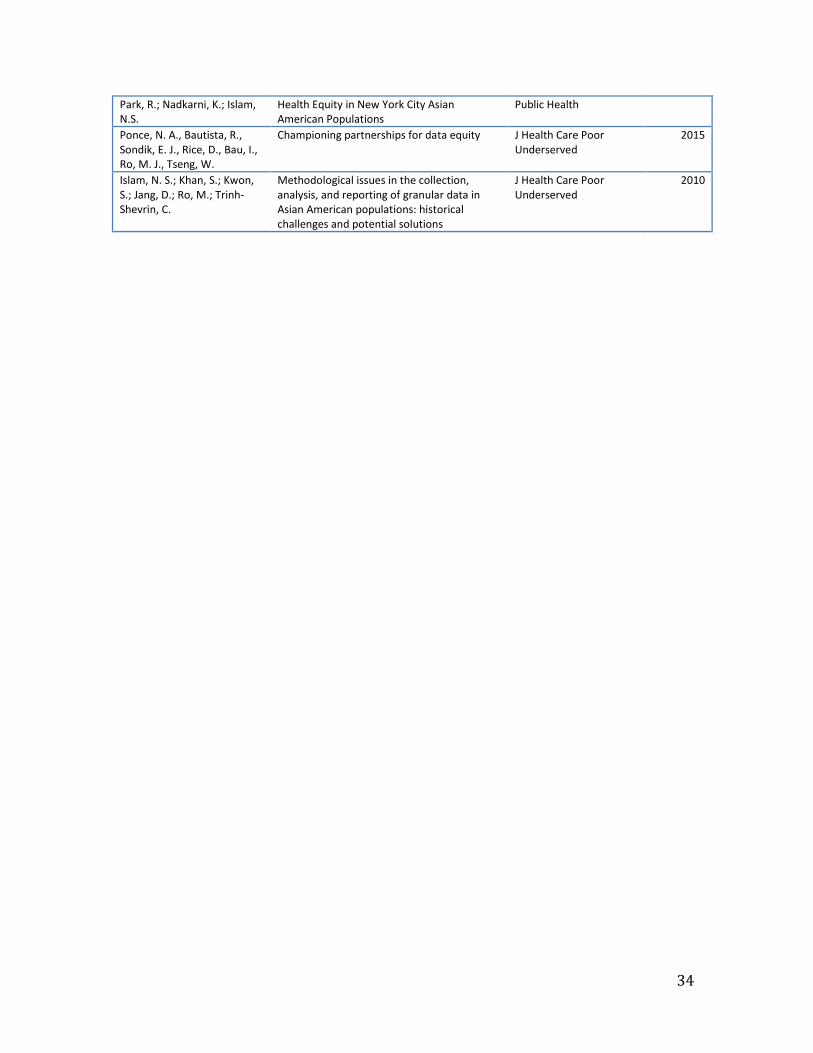
34
Park, R.; Nadkarni, K.; Islam, N.S.
Health Equity in New York City Asian American Populations
Public Health
Ponce, N. A., Bautista, R., Sondik, E. J., Rice, D., Bau, I., Ro, M. J., Tseng, W.
Championing partnerships for data equity J Health Care Poor Underserved
2015
Islam, N. S.; Khan, S.; Kwon, S.; Jang, D.; Ro, M.; Trinh-Shevrin, C.
Methodological issues in the collection, analysis, and reporting of granular data in Asian American populations: historical challenges and potential solutions
J Health Care Poor Underserved
2010
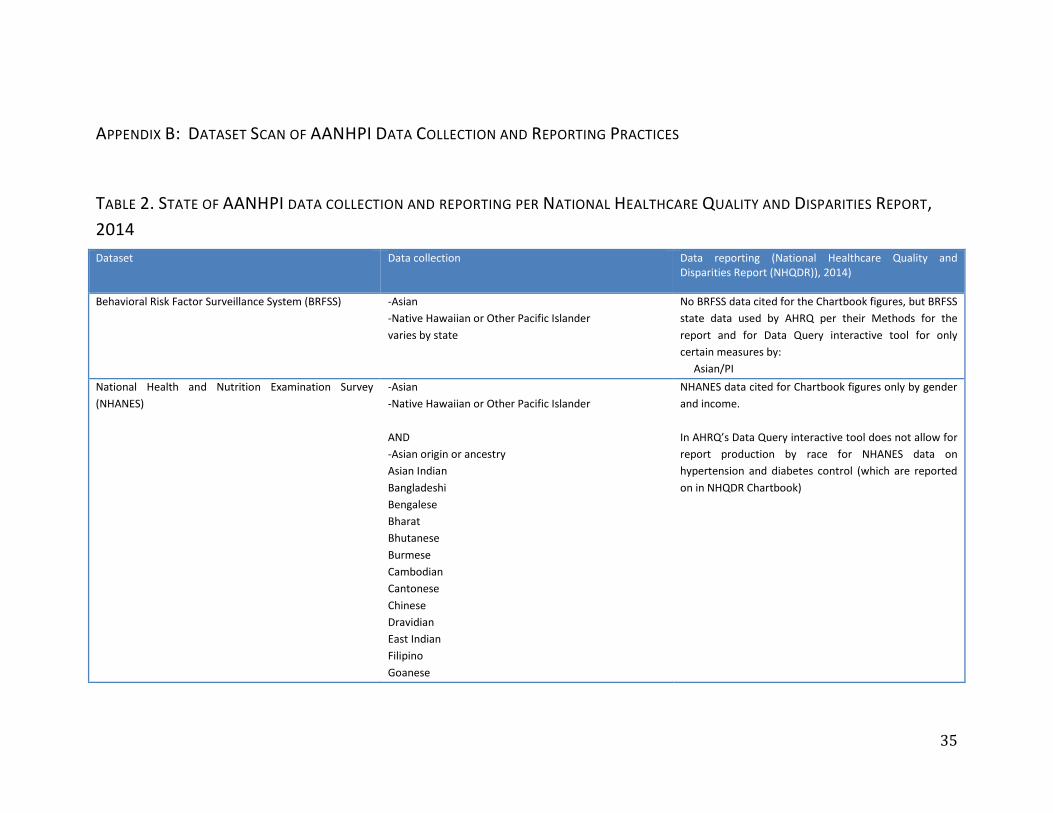
35
APPENDIX B: DATASET SCAN OF AANHPI DATA COLLECTION AND REPORTING PRACTICES
TABLE 2. STATE OF AANHPI DATA COLLECTION AND REPORTING PER NATIONAL HEALTHCARE QUALITY AND DISPARITIES REPORT, 2014 Dataset Data collection Data reporting (National Healthcare Quality and
Disparities Report (NHQDR)), 2014)
Behavioral Risk Factor Surveillance System (BRFSS) -Asian -Native Hawaiian or Other Pacific Islander varies by state
No BRFSS data cited for the Chartbook figures, but BRFSS state data used by AHRQ per their Methods for the report and for Data Query interactive tool for only certain measures by: Asian/PI
National Health and Nutrition Examination Survey (NHANES)
-Asian -Native Hawaiian or Other Pacific Islander AND -Asian origin or ancestry Asian Indian Bangladeshi Bengalese Bharat Bhutanese Burmese Cambodian Cantonese Chinese Dravidian East Indian Filipino Goanese
NHANES data cited for Chartbook figures only by gender and income. In AHRQ’s Data Query interactive tool does not allow for report production by race for NHANES data on hypertension and diabetes control (which are reported on in NHQDR Chartbook)
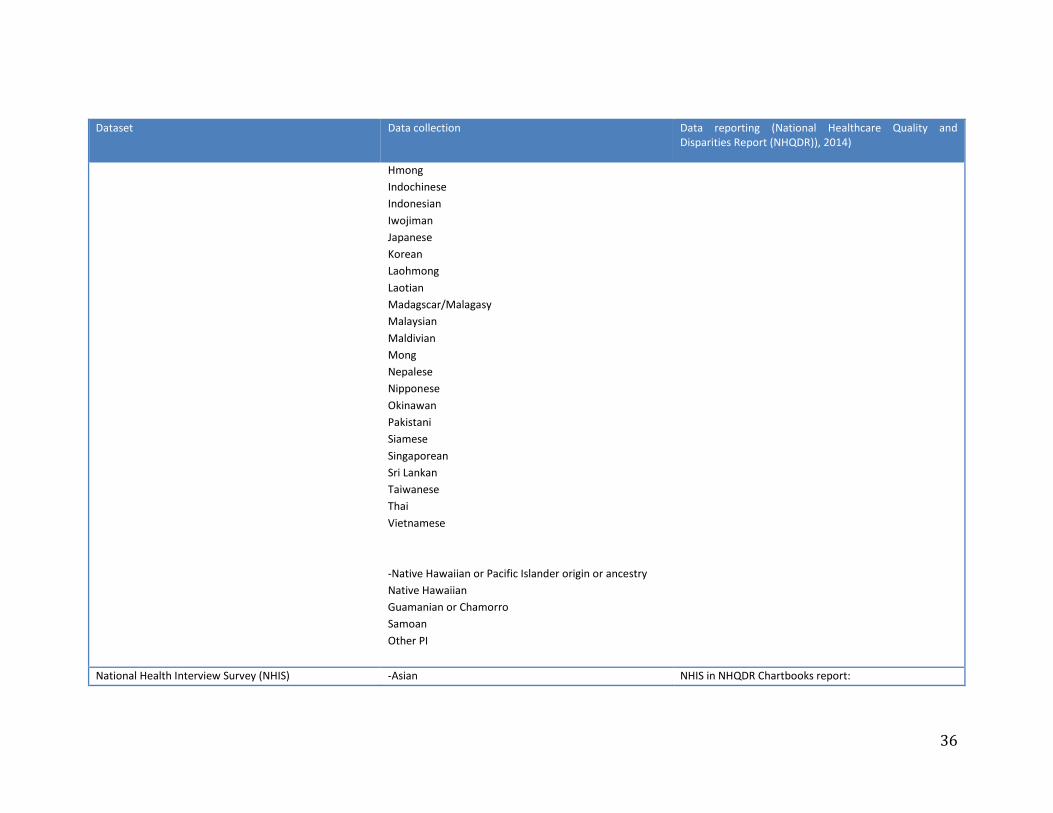
36
Dataset Data collection Data reporting (National Healthcare Quality and Disparities Report (NHQDR)), 2014)
Hmong Indochinese Indonesian Iwojiman Japanese Korean Laohmong Laotian Madagscar/Malagasy Malaysian Maldivian Mong Nepalese Nipponese Okinawan Pakistani Siamese Singaporean Sri Lankan Taiwanese Thai Vietnamese -Native Hawaiian or Pacific Islander origin or ancestry Native Hawaiian Guamanian or Chamorro Samoan Other PI
National Health Interview Survey (NHIS) -Asian NHIS in NHQDR Chartbooks report:
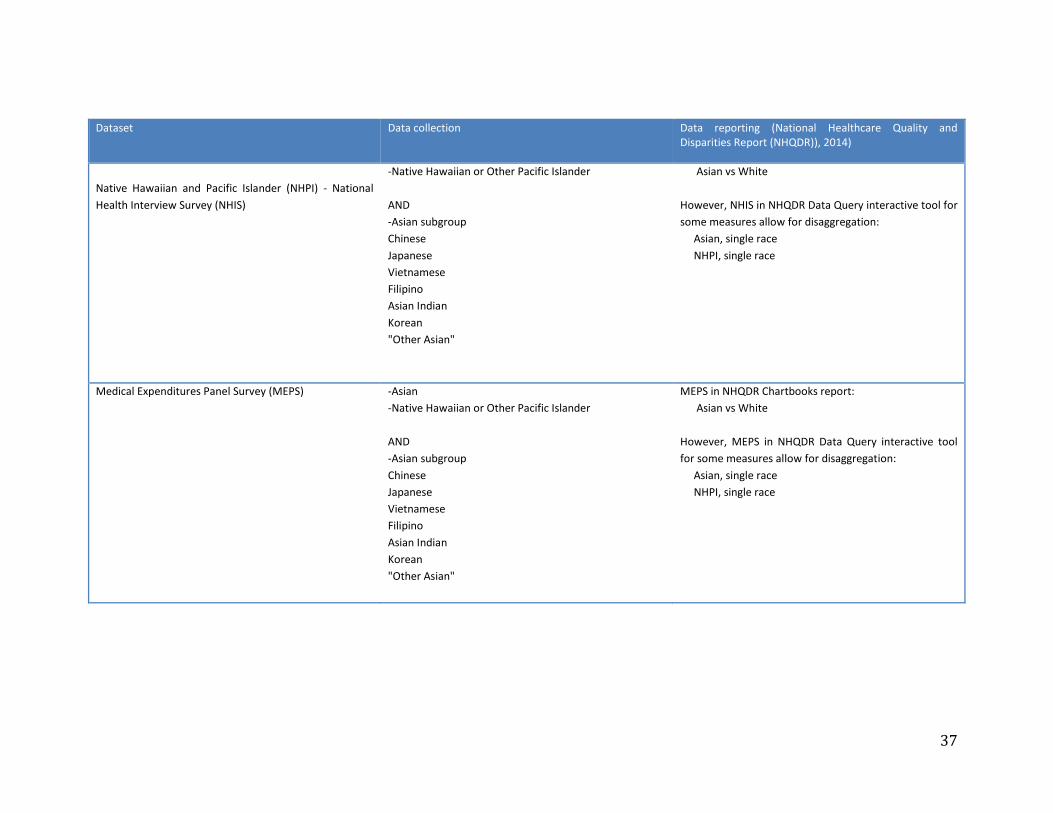
37
Dataset Data collection Data reporting (National Healthcare Quality and Disparities Report (NHQDR)), 2014)
Native Hawaiian and Pacific Islander (NHPI) - National Health Interview Survey (NHIS)
-Native Hawaiian or Other Pacific Islander AND -Asian subgroup Chinese Japanese Vietnamese Filipino Asian Indian Korean "Other Asian"
Asian vs White However, NHIS in NHQDR Data Query interactive tool for some measures allow for disaggregation: Asian, single race NHPI, single race
Medical Expenditures Panel Survey (MEPS) -Asian -Native Hawaiian or Other Pacific Islander AND -Asian subgroup Chinese Japanese Vietnamese Filipino Asian Indian Korean "Other Asian"
MEPS in NHQDR Chartbooks report: Asian vs White However, MEPS in NHQDR Data Query interactive tool for some measures allow for disaggregation: Asian, single race NHPI, single race
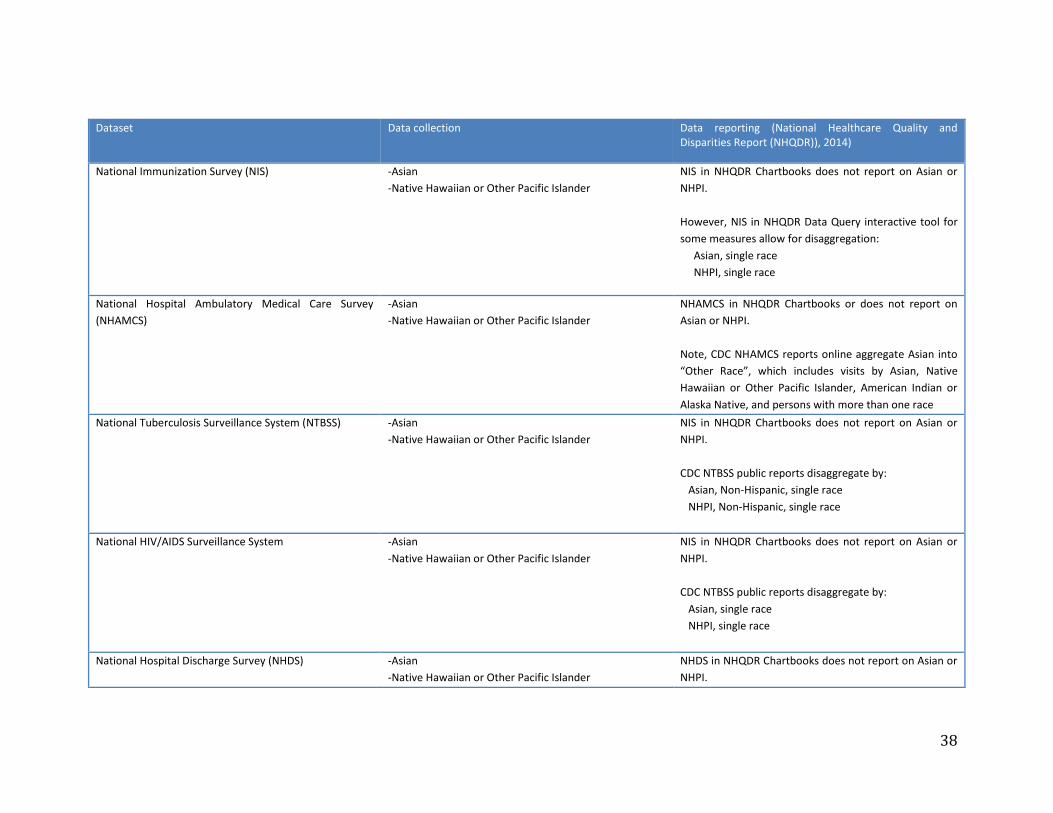
38
Dataset Data collection Data reporting (National Healthcare Quality and Disparities Report (NHQDR)), 2014)
National Immunization Survey (NIS) -Asian -Native Hawaiian or Other Pacific Islander
NIS in NHQDR Chartbooks does not report on Asian or NHPI. However, NIS in NHQDR Data Query interactive tool for some measures allow for disaggregation: Asian, single race NHPI, single race
National Hospital Ambulatory Medical Care Survey (NHAMCS)
-Asian -Native Hawaiian or Other Pacific Islander
NHAMCS in NHQDR Chartbooks or does not report on Asian or NHPI. Note, CDC NHAMCS reports online aggregate Asian into “Other Race”, which includes visits by Asian, Native Hawaiian or Other Pacific Islander, American Indian or Alaska Native, and persons with more than one race
National Tuberculosis Surveillance System (NTBSS) -Asian -Native Hawaiian or Other Pacific Islander
NIS in NHQDR Chartbooks does not report on Asian or NHPI. CDC NTBSS public reports disaggregate by: Asian, Non-Hispanic, single race NHPI, Non-Hispanic, single race
National HIV/AIDS Surveillance System -Asian -Native Hawaiian or Other Pacific Islander
NIS in NHQDR Chartbooks does not report on Asian or NHPI. CDC NTBSS public reports disaggregate by: Asian, single race NHPI, single race
National Hospital Discharge Survey (NHDS) -Asian -Native Hawaiian or Other Pacific Islander
NHDS in NHQDR Chartbooks does not report on Asian or NHPI.
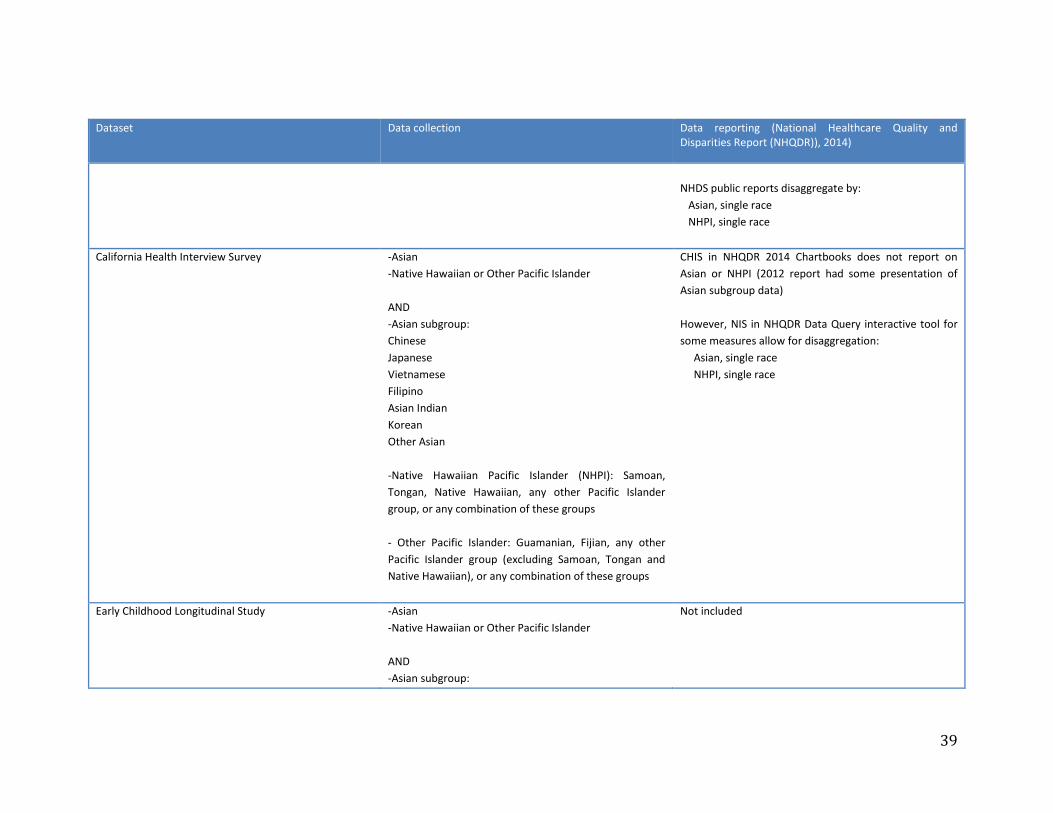
39
Dataset Data collection Data reporting (National Healthcare Quality and Disparities Report (NHQDR)), 2014)
NHDS public reports disaggregate by: Asian, single race NHPI, single race
California Health Interview Survey -Asian -Native Hawaiian or Other Pacific Islander AND -Asian subgroup: Chinese Japanese Vietnamese Filipino Asian Indian Korean Other Asian -Native Hawaiian Pacific Islander (NHPI): Samoan, Tongan, Native Hawaiian, any other Pacific Islander group, or any combination of these groups - Other Pacific Islander: Guamanian, Fijian, any other Pacific Islander group (excluding Samoan, Tongan and Native Hawaiian), or any combination of these groups
CHIS in NHQDR 2014 Chartbooks does not report on Asian or NHPI (2012 report had some presentation of Asian subgroup data) However, NIS in NHQDR Data Query interactive tool for some measures allow for disaggregation: Asian, single race NHPI, single race
Early Childhood Longitudinal Study -Asian -Native Hawaiian or Other Pacific Islander AND -Asian subgroup:
Not included
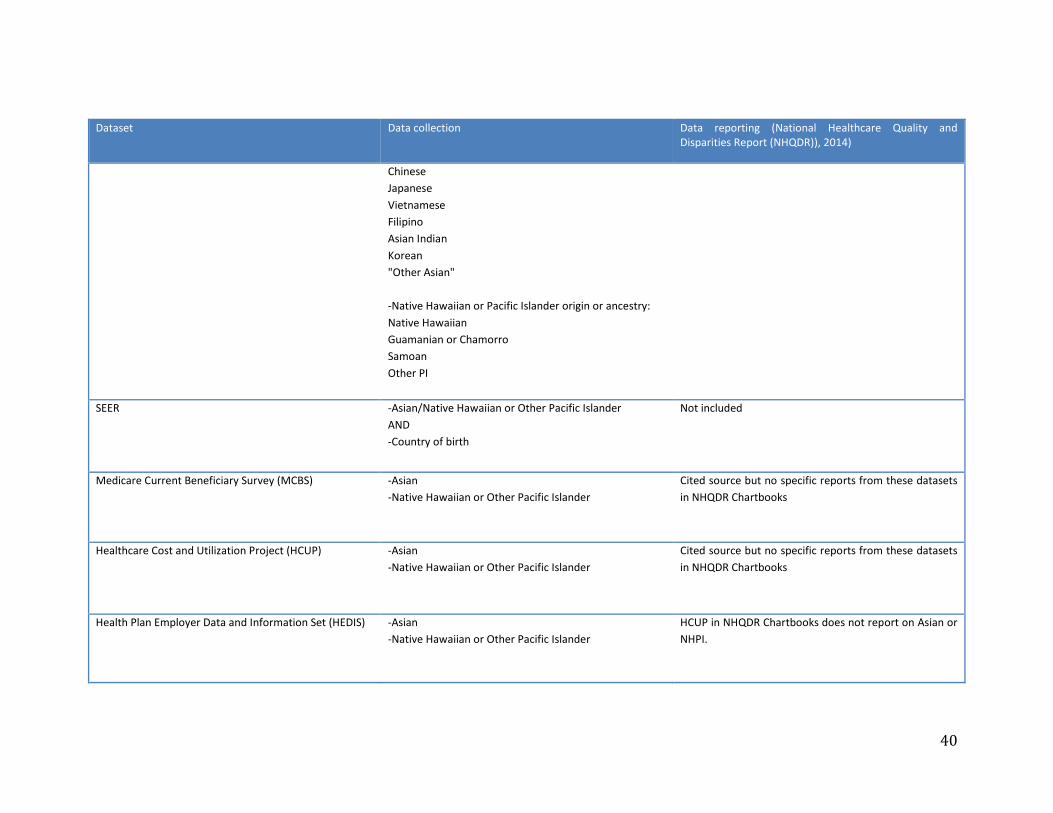
40
Dataset Data collection Data reporting (National Healthcare Quality and Disparities Report (NHQDR)), 2014)
Chinese Japanese Vietnamese Filipino Asian Indian Korean "Other Asian" -Native Hawaiian or Pacific Islander origin or ancestry: Native Hawaiian Guamanian or Chamorro Samoan Other PI
SEER -Asian/Native Hawaiian or Other Pacific Islander AND -Country of birth
Not included
Medicare Current Beneficiary Survey (MCBS) -Asian -Native Hawaiian or Other Pacific Islander
Cited source but no specific reports from these datasets in NHQDR Chartbooks
Healthcare Cost and Utilization Project (HCUP) -Asian -Native Hawaiian or Other Pacific Islander
Cited source but no specific reports from these datasets in NHQDR Chartbooks
Health Plan Employer Data and Information Set (HEDIS) -Asian -Native Hawaiian or Other Pacific Islander
HCUP in NHQDR Chartbooks does not report on Asian or NHPI.
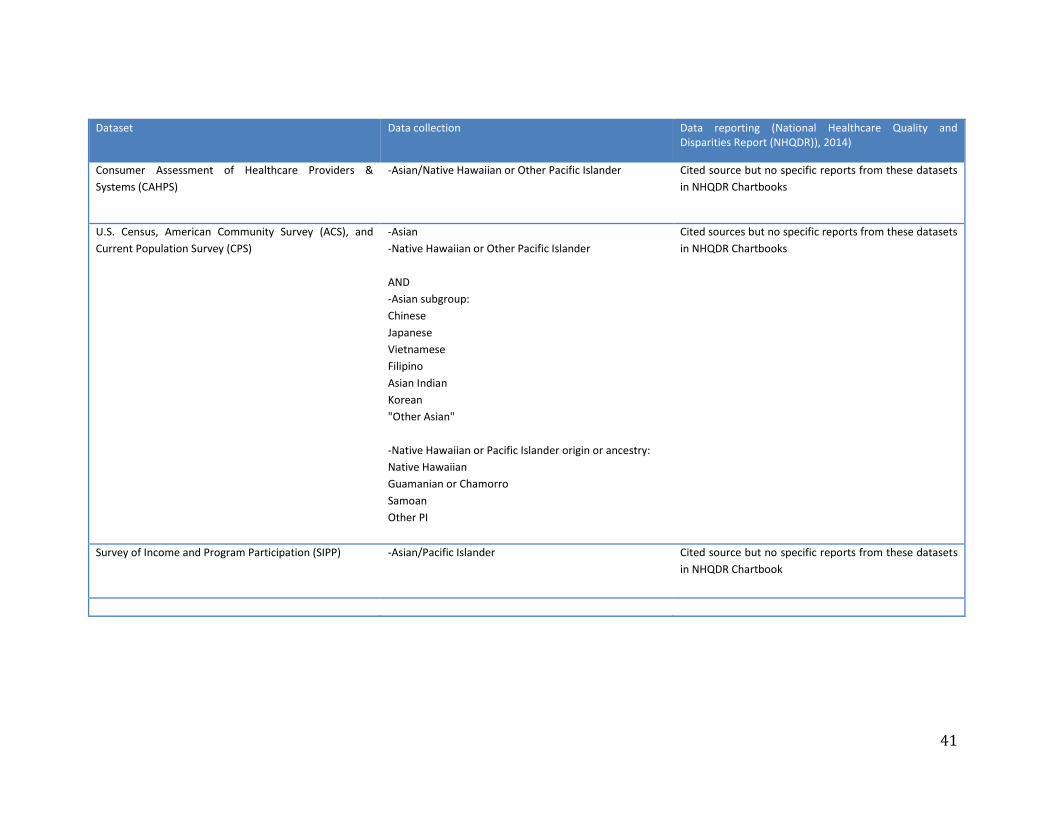
41
Dataset Data collection Data reporting (National Healthcare Quality and Disparities Report (NHQDR)), 2014)
Consumer Assessment of Healthcare Providers & Systems (CAHPS)
-Asian/Native Hawaiian or Other Pacific Islander Cited source but no specific reports from these datasets in NHQDR Chartbooks
U.S. Census, American Community Survey (ACS), and Current Population Survey (CPS)
-Asian -Native Hawaiian or Other Pacific Islander AND -Asian subgroup: Chinese Japanese Vietnamese Filipino Asian Indian Korean "Other Asian" -Native Hawaiian or Pacific Islander origin or ancestry: Native Hawaiian Guamanian or Chamorro Samoan Other PI
Cited sources but no specific reports from these datasets in NHQDR Chartbooks
Survey of Income and Program Participation (SIPP) -Asian/Pacific Islander Cited source but no specific reports from these datasets in NHQDR Chartbook
42
1. Humes KR, Jones NA, Ramirez R. Overview of Race and Hispanic Origin: 2010. Washington D.C.: United States Census Bureau; 2011. 2. U.S. Department of Health and Human Services OoMH. Asian Americans and Native Hawaiians and Pacific Islanders Profile. Available at: http://minorityhealth.hhs.gov/omh/browse.aspx?lvl=3&lvlid=652012. 3. Hoeffel E, Rastogi P, Kim MO, Shahid H. The Asian Population: 2010. Washington D.C.: United States Census Bureau; March 2012. 4. Hixon L, Hepler BB, Kim MO. The Native Hawaiian and Other Pacific Islander Population: 2010. Washington D.C.: United States Census Bureau; May 2012. 5. Ponce NA, Bautista R, Sondik EJ, et al. Championing partnerships for data equity. Journal of health care for the poor and underserved 2015;26:6-15. 6. Islam NS, Khan S, Kwon S, Jang D, Ro M, Trinh-Shevrin C. Methodological issues in the collection, analysis, and reporting of granular data in Asian American populations: historical challenges and potential solutions. Journal of health care for the poor and underserved 2010;21:1354-81. 7. Shi L. Experience of primary care by racial and ethnic groups in the United States. Medical care 1999;37:1068-77. 8. Chow TW, Ross L, Fox P, Cummings JL, Lin KM. Utilization of Alzheimer's disease community resources by Asian-Americans in California. International journal of geriatric psychiatry 2000;15:838-47. 9. Chen MS, Jr., Hawks BL. A debunking of the myth of healthy Asian Americans and Pacific Islanders. American journal of health promotion : AJHP 1995;9:261-8. 10. Esperat MC, Inouye J, Gonzalez EW, Owen DC, Feng D. Health disparities among Asian Americans and Pacific Islanders. Annual review of nursing research 2004;22:135-59. 11. Yi SS, Kwon SC, Sacks R, Trinh-Shevrin C. Commentary: Persistence and Health-Related Consequences of the Model Minority Stereotype for Asian Americans. Ethnicity & disease 2016;26:133-8. 12. Foundation. THJKF. State Health Facts: No Personal Doctor/Health Care Provider for Men, by State and Race/Ethnicity, 2006 – 2008.2012. 13. Justice. AACfA. A Community of Contrasts: Asian Americans, Native Hawaiians and Pacific Islanders in California.2013. 14. Ponce NA. Health Issues in the Asian American Community. New York University: Jossey –Bass publishers; 2009. 15. Quality. AfHRa. Medical Expenditure Panel Survey Household Component Data: Table 1. Usual Source of Health Care and Selected Population Characteristics, United States.2010. 16. Sorkin DH, Ngo-Metzger Q, De Alba I. Racial/ethnic discrimination in health care: impact on perceived quality of care. Journal of general internal medicine 2010;25:390-6. 17. Kagawa-Singer M, Pourat N, Breen N, et al. Breast and cervical cancer screening rates of subgroups of Asian American women in California. Medical care research and review : MCRR 2007;64:706-30.
43
18. Lee HY, Ju E, Vang PD, Lundquist M. Breast and cervical cancer screening disparity among Asian American women: does race/ethnicity matter [corrected]? Journal of women's health (2002) 2010;19:1877-84. 19. Lee HY, Lundquist M, Ju E, Luo X, Townsend A. Colorectal cancer screening disparities in Asian Americans and Pacific Islanders: which groups are most vulnerable? Ethnicity & health 2011;16:501-18. 20. Ponce NA, Chawla N, Babey SH, et al. Is there a language divide in pap test use? Medical care 2006;44:998-1004. 21. Gee GC, Ponce N. Associations between racial discrimination, limited English proficiency, and health-related quality of life among 6 Asian ethnic groups in California. American journal of public health 2010;100:888-95. 22. Arista P, Tepporn E, Kwon S, et al. Recommendations for implementing policy, systems, and environmental improvements to address chronic diseases in Asian Americans, Native Hawaiians, and Pacific Islanders. Preventing chronic disease 2014;11:E202. 23. Hines AL, Andrews RM, Moy E, Barrett ML, Coffey RM. Disparities in rates of inpatient mortality and adverse events: race/ethnicity and language as independent contributors. International journal of environmental research and public health 2014;11:13017-34. 24. Moy E, Mau MK, Raetzman S, et al. Ethnic differences in potentially preventable hospitalizations among Asian Americans, Native Hawaiians, and other Pacific Islanders: implications for reducing health care disparities. Ethnicity & disease 2013;23:6-11. 25. Sentell TL, Ahn HJ, Miyamura J, Juarez DT. Cost Burden of Potentially Preventable Hospitalizations for Cardiovascular Disease and Diabetes for Asian Americans, Pacific Islanders, and Whites in Hawai'i. Journal of health care for the poor and underserved 2015;26:63-82. 26. Ro M. Moving forward: addressing the health of Asian American and Pacific Islander women. American journal of public health 2002;92:516-9. 27. Holland AT, Palaniappan LP. Problems with the collection and interpretation of Asian-American health data: omission, aggregation, and extrapolation. Annals of epidemiology 2012;22:397-405. 28. Lin-Fu JS. Asian and Pacific Islander Americans: An Overview of Demographic Characteristics and Health Care Issues. Asian American and Pacific Islander journal of health 1993;1:20-36. 29. Srinivasan S, Guillermo T. Toward improved health: disaggregating Asian American and Native Hawaiian/Pacific Islander data. American journal of public health 2000;90:1731-4. 30. Ghosh C. A national health agenda for Asian Americans and Pacific Islanders. Jama 2010;304:1381-2. 31. Fuller-Thomson E, Brennenstuhl S, Hurd M. Comparison of disability rates among older adults in aggregated and separate Asian American/Pacific Islander subpopulations. American journal of public health 2011;101:94-100. 32. Quach T, Liu R, Nelson DO, et al. Disaggregating data on Asian American and Pacific Islander women to provide new insights on potential exposures to hazardous air pollutants in California. Cancer epidemiology, biomarkers & prevention : a
44
publication of the American Association for Cancer Research, cosponsored by the American Society of Preventive Oncology 2014;23:2218-28. 33. Nguyen TT. Cancer in Asian American and Pacific Islander populations: linking research and policy to identify and reduce disparities. Cancer epidemiology, biomarkers & prevention : a publication of the American Association for Cancer Research, cosponsored by the American Society of Preventive Oncology 2014;23:2206-7. 34. Kuo J, Porter K. Health status of Asian Americans: United States, 1992-94. Advance data 1998:1-16. 35. Devers K. The Feasibility of Using Electronic Health Records (EHRs) and Other Electronic Health Data for Research on Small Populations. . Urban Institute September 2013 2013. 36. Bhopal R. Is research into ethnicity and health racist, unsound, or important science? BMJ (Clinical research ed) 1997;314:1751-6. 37. Meredith LS, Siu AL. Variation and quality of self-report health data. Asians and Pacific Islanders compared with other ethnic groups. Medical care 1995;33:1120-31. 38. Holup JL, Press N, Vollmer WM, Harris EL, Vogt TM, Chen C. Performance of the U.S. Office of Management and Budget's Revised Race and Ethnicity Categories in Asian Populations*. International journal of intercultural relations : IJIR 2007;31:561-73. 39. Korngiebel DM, Taualii M, Forquera R, Harris R, Buchwald D. Addressing the Challenges of Research With Small Populations. American journal of public health 2015;105:1744-7. 40. U.S. Census Bureau PD. Annual Estimates of the Resident Population by Sex, Race Alone or in Combination, and Hispanic Origin for the United States, States, and Counties: April 1, 2010 to July 1, 2015 2016. 41. Insittute MP. Asian Immigrants in the United States. Available at: http://www.migrationpolicy.org/article/asian-immigrants-united-states. 2016. 42. California Health Interview Survey. 2015 California Health Interview Survey. Citizenship and immigration status (3 levels) by race/ethnicity. Available at: askchis.ucla.edu. 2015.