Embed Size (px)
Citation preview
Understanding the Crosstalk between Bone and
Gamma Delta T lymphocytes In Cancer Patients
By
Ms. Swati Popat Phalke
[LIFE09200904011]
Tata Memorial Centre, Navi Mumbai
A thesis submitted to the
Board of Studies in Life Sciences
In partial fulfillment of requirements
For the Degree of
DOCTOR OF PHILOSOPHY
of
HOMI BHABHA NATIONAL INSTITUTE
October, 2016


STATEMENT BY AUTHOR
This dissertation has been submitted in partial fulfillment of requirements for an
advanced degree at Homi Bhabha National Institute (HBNI) and is deposited in the Library to be
made available to borrowers under rules of the HBNI.
Brief quotations from this dissertation are allowable without special permission, provided
that accurate acknowledgement of source is made. Requests for permission for extended
quotation from or reproduction of this manuscript in whole or in part may be granted by the
Competent Authority of HBNI when in his or her judgment the proposed use of the material is in
the interests of scholarship. In all other instances, however, permission must be obtained from
the author.
Ms. Swati Popat Phalke

DECLARATION
I, hereby declare that the investigation presented in the thesis has been carried out by me. The
work is original and has not been submitted earlier as a whole or in part for a degree / diploma at
this or any other Institution / University.
Ms. Swati Popat Phalke

List of Publications arising from the thesis
Journal
1. “Activation status of γδ T cells dictates their effect on osteoclast generation and bone
resorption”, Swati P. Phalke, Shubhada V. Chiplunkar, “Bone Reports” (2015), Vol 3 (95-103)
2. “Cytokine dynamics of γδ T cells: A double edged sword in osteoclastogenesis”, Swati
Phalke and Shubhada V. Chiplunkar, “Journal of Cytokine Biology” (2016), Vol 1, issue 3 (In
Press)
Chapters in books and lectures notes: Nil
Conferences
1. “8th National Research Scholars Meet” held at ACTREC, Mumbai during 21st-22nd
December 2012, Swati P. Phalke, Shubhada V. Chiplunkar, “Understanding the crosstalk
between γδ T cells and osteoclasts in patients with breast cancer”
2. “32nd Annual Convention of Indian Association for Cancer Research”, held at New Delhi
during 13-16th February 2013, Swati Phalke, Vani Parmar, Sudeep Gupta, Rajendra Badwe,
Shubhada Chiplunkar, “Understanding the crosstalk between γδ T cells and osteoclasts in
patients with breast cancer”
3. “Tata Platinum Jubilee Conference” , held at Mumbai, Italy during -26th - 28th
February,
2016, Swati Phalke, Rajendra Badwe,Vani Parmar, Shubhada Chiplunkar, “Zoledronate
induced γδ T cells activation: A potential cell based cancer therapy”
4. “15th
International congress of Immunology”, held in Milan, Italy during 22nd
-27th
August
2013, Swati Phalke, Vani Parmar, Sudeep Gupta, Rajendra Badwe, Shubhada Chiplunkar,
“Understanding the crosstalk between γδ T cells and osteoclasts in patients with breast
cancer”, Abstract was published in “Frontiers in Immunology”
Others: Nil
Ms. Swati Popat Phalke

This thesis is my small contribution to science.......


Acknowledgement
“It is during our darkest moments that we must focus to see the light - Aristotle Onassis”
This thesis is not only a representation of my work; it is the journey where I got
introduced to the field of science. My experience at ACTREC has been nothing short of
extraordinary. It has laid a sound foundation for my future in research, a place where I
strengthened my scientific prowess. It has also molded me into a person who believes in the
value of hard-work, the power of observation, the significance of questioning everything and
most significantly into a person who understands the importance of believing in yourself. My
time here is always going to be a part of me that I will proudly carry along on my journey ahead.
My journey as a PhD student has been a series of professional and personal milestones and at the
end of it, I would like to take a moment and thank everyone who made it a memorable
experience.
I wish to thank my advisor, Professor. Shubhada V. Chiplunkar. She has been
the most wonderful guide and I am eternally grateful for her patience during my early days at the
lab, her support and encouragement throughout my thesis work. Prof. Chiplunkar’s expertise and
experience in the field has assisted me in my research work. I thank her for all the wonderful
opportunities and for the motivation and freedom in writing this thesis.
I would like to thank the members of my doctoral committee: Dr. K.B. Sainis,
Dr. Rajiv Gude, Lt. Dr. Rajiv Kalraiya, Dr. Narendra Joshi, Dr. Rukmini Govekar and Dr.
Sorab Dalal for their insightful comments and encouragement and also for the hard questions
which incented me to widen my research perspectives.
My sincere gratitude goes to Dr. Mohan Wani (NCCS, Pune) and Dr. Rukmini
Govekar (ACTREC), who provided me the opportunity, during the initial stages of my doctoral
work, to learn human osteoclast culture work and proteomics work, respectively. I am
immensely thankful to Dr. Sudeep Gupta, Deputy Director of ACTREC, for helping me in
procuring the breast cancer patient samples. I am indebted to all the breast cancer patients and
healthy volunteers, who voluntarily participated in our study.

I extend my thanks to Flow cytometry facility (Ms. Shamal Vetale, Mrs. Rekha
Gaur and Mr. Ravi Joshi), Mass spectrometry facility (Mr. Shashi Dolas, Mrs. Savita Prabhu-
Chavan and Mr. Prashant Masane) and imaging facility (Mrs. Vaishali Kailaje and Mrs. Tanuja
Dighe) for their tremendous help during my work. I am thankful to the Director’s office (Mrs.
Pritha Menon and Mrs. Lata Shelar), Programme office (Mrs. Maya Dolas), Administration
department (Chitramam, Sujatamam, Seema mam and Lisa), Accounts department (Arunamam)
and Dispatch department for their assistance over these years. I would also like to extend my
thanks to Mr. Dinesh Pawar (Hostel caretaker) and Anumavashi, who made the hostel stay
comfortable.
I acknowledge my gratitude to Department of Biotechnology- Government of
India for fellowship and to Tata Memorial Centre for “Seed In Air” grant (Project funding
awarded to Dr. S.V.Chiplunkar) for supporting this thesis work.
I am obliged to all the Chiplunkar Lab members (Dr. Kode, Meenatai,
Shamalmam, Truptimam, Sawantbhai, Dakave uncle and Ram), my fellow colleagues
(Bhairavbhai, Dimpu, Aparna, Asif, Rushikesh, Sajad, Shalini, Sachin and Neha) for their help
during the times needed. I would like to remember friends like Arpit, Ayush, Pradipbhau, Babita,
Vasanti, Amruta, Kalpesh, Minal and Nirupama for their selfless support and encouragement
throughout my stay. The memories we created together will always be special to me. Special
thanks to Dr. Amit Fulzele and Dr. Biharilal Soni who helped tremendously during proteomics
work.
Most importantly, I take this opportunity to express my profound gratitude to my
family (Aai, Pappa, Girish and Supriyavahini) and my best friend Rahul for their support through
the hard times. Without them, I would not have completed this journey. I am lucky to have them!
I also want to thank “Bhai” and his family members for their love and support. I thank them all a
thousand times for not letting me feel alone and being there for me always.
Ms. Swati Popat Phalke

Contents
CONTENTS
Page No.
Synopsis……………………………………………………………..…………….………...(1-15)
List of figures…………………………………………………….………...………….......(17-19)
List of tables……………………………………………………….……………………….......(20)
Abbreviations……………………………………………………….………………..…..…(21-23)
Chapter 1: Introduction…………………………………………….……………………...(25-31)
Chapter 2: Review of Literature…………………………………………………………...(33-60)
[2.1] Breast cancer…………………………………………………………….....….35
[2.2] Classification of breast cancer…………………………………….…………..36
[2.3] Bone is the preferential site of metastasis……………………….............……40
[2.4] Bone remodeling…………………………………………….…………….…..42
[2.5] Crosstalk between tumor cells, immune cells and bone cells……………..…..48
[2.6] Vicious cycle……………………………………………………….................51
[2.7] Aminobisphosphonates…………………………………….………………….53
[2.8] γδ T cells…………………………………………………….………...………55
Chapter 3: Materials and methods……………….………..…………….…………….…(61-108)
[3.1] Culture medium…………………………………………….…………………63
[3.2] Preparation of buffers………………………………………….……….….….63
[3.3] Maintenance of cell lines…………………………………………………..….66
[3.4] Antibodies and recombinant proteins…………………………….…………...67
[3.5] Study group………………………………………………………………...….69
[3.6] Cell separation techniques…………………….………………………….…...70
[3.7] Generation and characterization of mouse and human osteoclasts……….…..72
[3.8] Flow cytometry……………………………………………………..…………78
[3.9] Cytokine estimation in serum sample and cell free supernatants of
γδ T cells…………………………………………………….…………..……..82
[3.10] Confocal microscopy…………………………………………..…………….83
[3.11] MTT Assay…………………………………………………….………….....87
Contents
CONTENTS
Page No.
[3.12] Identification of differentially expressed protein in MCF7 cells upon
Zoledronate treatment by 2D PAGE-MALDI-TOF/TOF……….………..…..88
[3.13] Liquid chromatography-Mass spectrometry…………………......................100
[3.14] Validation of differentially expressed proteins by western blotting……......105
Chapter 4: Results-I
To investigate the effect of γδ T cells on osteoclastogenesis…………..…..(109-148)
[4.1] Analysis of activation markers on γδ T cells………………………….…..…112
[4.2] Effect of γδ T cells on human osteoclastogenesis……………………….…..124
[4.3] Cytokine profiling of cell free supernatants of antigen activated γδ T
cells……………………..…………………………………….………...….....141
[4.4] Effect of IL6 and IFNγ neutralization in cell free supernatants of
“unstimulated” γδ T cells on osteoclast function……………..……….….....145
Chapter 5: Results-II
To understand the effect of aminobisphosphonate (Zoledronate) on protein profiles
of breast tumor cells….……………………………………...……………….(149-196)
[5.1] Determination of sublethal concentration of Zoledronate for treatment of
MCF7 cells………………………………………………………………......152
[5.2] Separation of differentially expressed proteins in MCF7 cells upon
Zoledronate treatment by 2-dimensional (2D) polyacrylamide gel
electrophoresis………………………………………………….............……153
[5.3] Identification of differentially expressed proteins in MCF7 upon
Zoledronate treatment by 2D PAGE/MALDI-TOD TOF……………….…..161
[5.4] Identification of differentially expressed proteins in Zoledronate treated
MCF7 cells by liquid chromatography-mass spectrometry (LC-MS)………163
[5.5] Interactome analysis………………………………………………...…….…180
[5.6] Validation of differentially expressed proteins…………………..………….182
Contents
CONTENTS
Page No.
Chapter 6: Results-III
Immune profiling of breast cancer patients on Zoledronate treatment…....(197-216)
[6.1] Demographic analysis of breast cancer patients…………………....……..…200
[6.2] Immune profile of metastatic (Zoledronate treated) and
non-metastatic (untreated) breast cancer patients………………..……...…. 201
[6.3] Zoledronate treatment activated both αβ and γδ T cells in breast cancer
patients……………………………………………………………………….205
[6.4] Zoledronate treatment activated central memory γδ T cells…….….………..209
[6.5] Effect of Zoledronate treatment on intracellular cytokines profile of
γδ T cells……………………………………………………………………..211
[6.6] Cytokine profiling of cell free supernatants collected of γδ T cells isolated from
HI and breast cancer patients (Rx- and Rx
+)…..…..….……………………..214
Chapter 7: Discussion………………………………………….………………………..(217-240)
Chapter 8: Summary and Conclusion……………………………………………..……(241-250)
References………………………..……………………………………………………...(251-274)
Publications………………………………………………..…………………………............(275)


Synopsis
1
Homi Bhabha National Institute
SYNOPSIS OF Ph.D. THESIS
1. Name of the Student: Ms. Swati Popat Phalke
2. Name of the Constituent Institution: Advanced Centre for Treatment , Research and
Education in Cancer-Tata Memorial Centre
3. Enrolment No. : LIFE09200904011
4. Title of the Thesis: “Understanding the crosstalk between bone and gamma delta T
lymphocytes in cancer patients”
5. Board of Studies: Life Sciences
SYNOPSIS
Introduction
Breast cancer is the second most commonly occurring cancer in the world (Globocan 2012). 70%
of breast cancer patients show bone metastasis, accounting for death of these patients [1]. Bone
is a dynamic structure which undergoes continuous remodeling, which is under the tight control
of osteoblasts and osteoclasts. Osteoblasts are derived from mesenchymal cells, secrete bone
matrix proteins and promote mineralization. Osteoclasts are large multinucleated cells generated
by fusion of monocyte-macrophage precursor cells [2] and are known to decalcify and degrade
the bone by secreting the lysosomal proteases [3]. Therapeutic modalities to treat bone metastasis
are targeted to modulating the bone microenvironment or to reduce bone resorption [4,5].
Antiresorptive bisphosphonates are used as standard drug treatment for skeletal disorders and
Synopsis
2
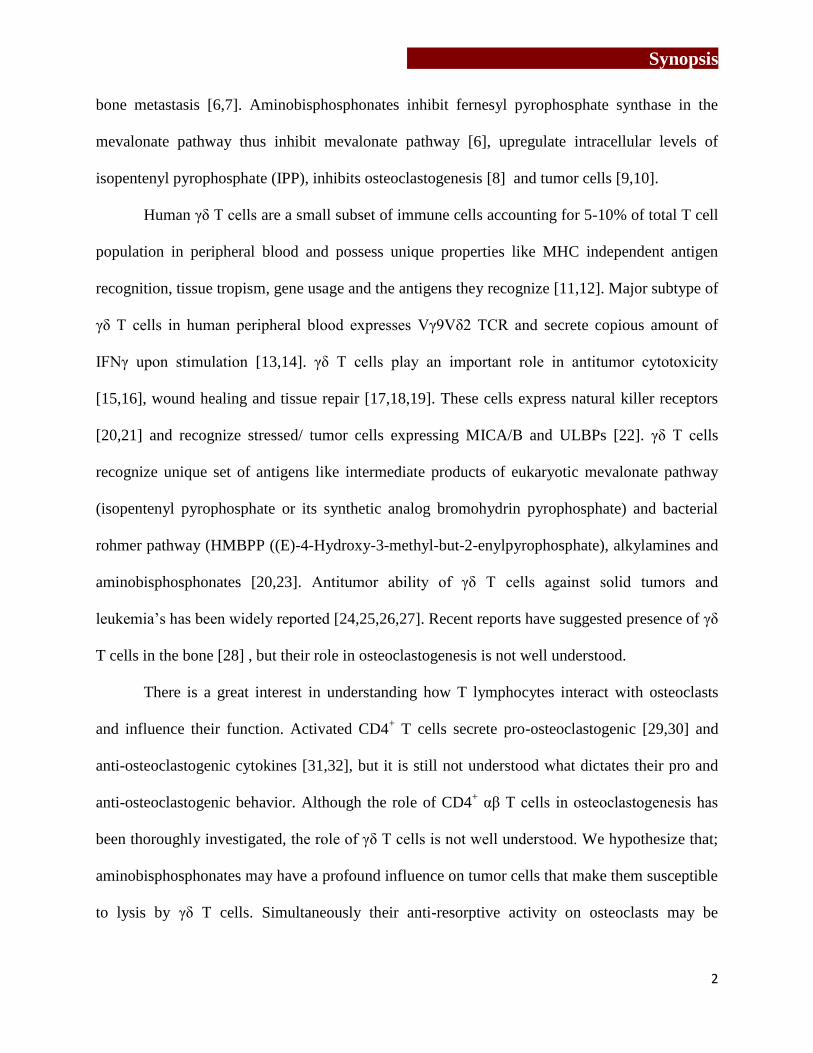
bone metastasis [6,7]. Aminobisphosphonates inhibit fernesyl pyrophosphate synthase in the
mevalonate pathway thus inhibit mevalonate pathway [6], upregulate intracellular levels of
isopentenyl pyrophosphate (IPP), inhibits osteoclastogenesis [8] and tumor cells [9,10].
Human γδ T cells are a small subset of immune cells accounting for 5-10% of total T cell
population in peripheral blood and possess unique properties like MHC independent antigen
recognition, tissue tropism, gene usage and the antigens they recognize [11,12]. Major subtype of
γδ T cells in human peripheral blood expresses Vγ9Vδ2 TCR and secrete copious amount of
IFNγ upon stimulation [13,14]. γδ T cells play an important role in antitumor cytotoxicity
[15,16], wound healing and tissue repair [17,18,19]. These cells express natural killer receptors
[20,21] and recognize stressed/ tumor cells expressing MICA/B and ULBPs [22]. γδ T cells
recognize unique set of antigens like intermediate products of eukaryotic mevalonate pathway
(isopentenyl pyrophosphate or its synthetic analog bromohydrin pyrophosphate) and bacterial
rohmer pathway (HMBPP ((E)-4-Hydroxy-3-methyl-but-2-enylpyrophosphate), alkylamines and
aminobisphosphonates [20,23]. Antitumor ability of γδ T cells against solid tumors and
leukemia’s has been widely reported [24,25,26,27]. Recent reports have suggested presence of γδ
T cells in the bone [28] , but their role in osteoclastogenesis is not well understood.
There is a great interest in understanding how T lymphocytes interact with osteoclasts
and influence their function. Activated CD4+ T cells secrete pro-osteoclastogenic [29,30] and
anti-osteoclastogenic cytokines [31,32], but it is still not understood what dictates their pro and
anti-osteoclastogenic behavior. Although the role of CD4+ αβ T cells in osteoclastogenesis has
been thoroughly investigated, the role of γδ T cells is not well understood. We hypothesize that;
aminobisphosphonates may have a profound influence on tumor cells that make them susceptible
to lysis by γδ T cells. Simultaneously their anti-resorptive activity on osteoclasts may be
Synopsis
3
explained by their ability to activate the innate immune cells like γδ T cells that accelerate the
cross talk between immune and skeletal system.
Aim and Objectives
1. To investigate the effect of T cells on osteoclastogenesis
2. To understand the effect of aminobisphosphonate (Zoledronate) on protein profiles of
breast tumor cells
3. Immune profiling of breast cancer patients on Zoledronate treatment
Methodology
Separation of “freshly isolated” and “activated” γδ T cell from peripheral blood
Peripheral blood mononuclear cells (PBMCs) were separated from heparinized peripheral blood
of healthy individuals and breast cancer patients by Ficoll Hypaque density gradient
centrifugation. These PBMCs were expanded using αCD3/CD28+ rhIL2 for 12 days and γδ T
cells were immunomagnetically purified using γδ T cell separation kit and were termed as
“activated” γδ T cells. γδ T cells separated directly from fresh PBMCs were termed as “freshly
isolated” γδ T cells. Separated γδ T cells were checked for purity and populations having >95%
purity were used for experiments.
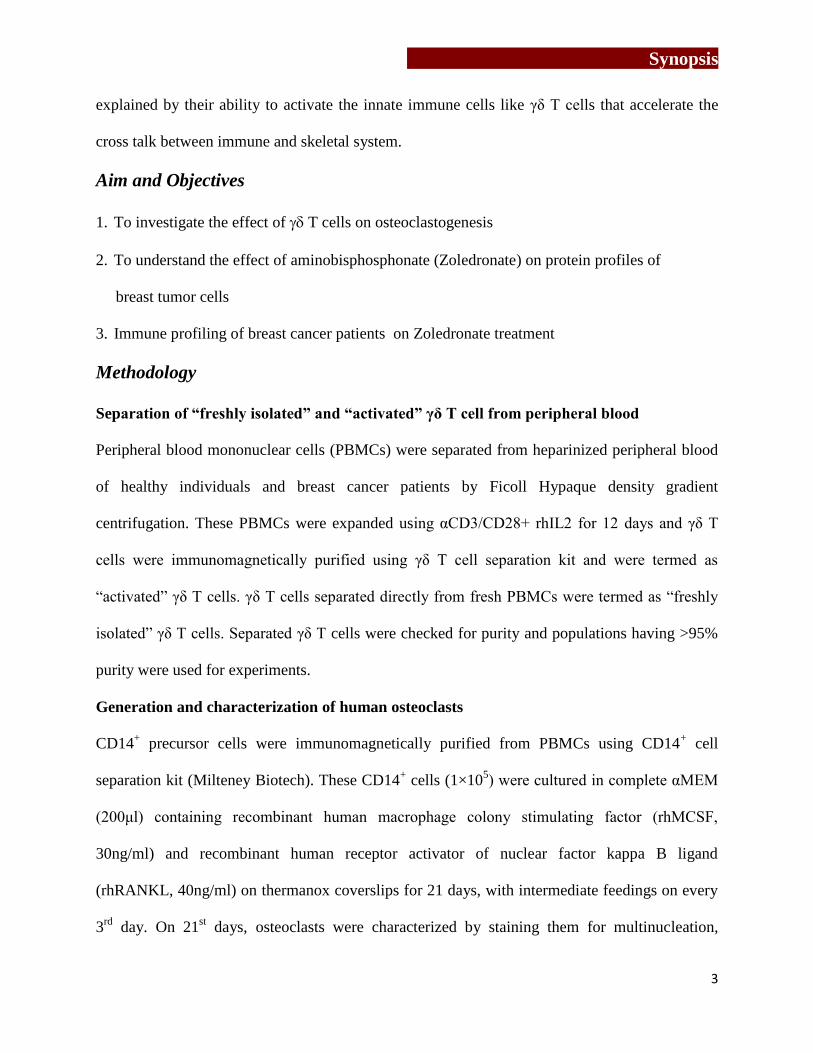
Generation and characterization of human osteoclasts
CD14+ precursor cells were immunomagnetically purified from PBMCs using CD14
+ cell
separation kit (Milteney Biotech). These CD14+ cells (1×10
5) were cultured in complete αMEM
(200μl) containing recombinant human macrophage colony stimulating factor (rhMCSF,
30ng/ml) and recombinant human receptor activator of nuclear factor kappa B ligand
(rhRANKL, 40ng/ml) on thermanox coverslips for 21 days, with intermediate feedings on every
3rd
day. On 21st days, osteoclasts were characterized by staining them for multinucleation,
Synopsis
4
tartarate resistant acid phosphatase (TRAP) or vitronectin receptor (23c6 or CD51/61). Cells
showing multinucleation (>3 nuclei) and TRAP positivity or vitronectin receptor positivity were
considered as mature osteoclasts.
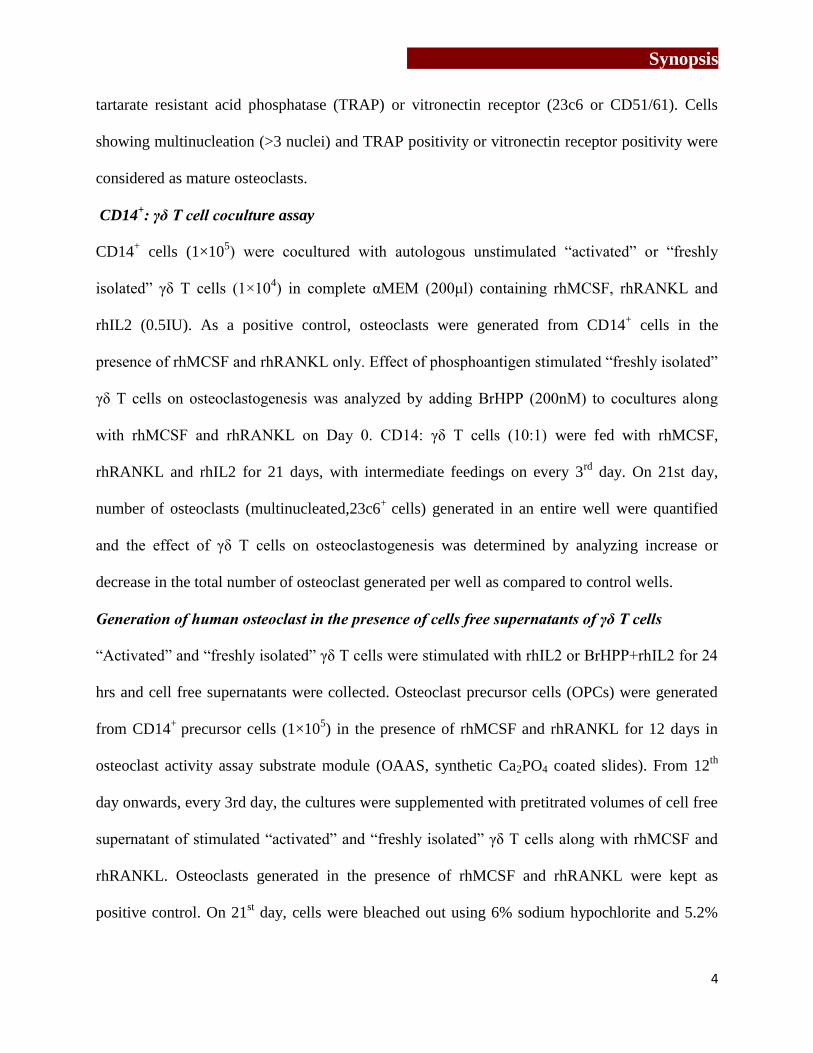
CD14+: γδ T cell coculture assay
CD14+ cells (1×10
5) were cocultured with autologous unstimulated “activated” or “freshly
isolated” γδ T cells (1×10⁴) in complete αMEM (200μl) containing rhMCSF, rhRANKL and
rhIL2 (0.5IU). As a positive control, osteoclasts were generated from CD14+ cells in the
presence of rhMCSF and rhRANKL only. Effect of phosphoantigen stimulated “freshly isolated”
γδ T cells on osteoclastogenesis was analyzed by adding BrHPP (200nM) to cocultures along
with rhMCSF and rhRANKL on Day 0. CD14: γδ T cells (10:1) were fed with rhMCSF,
rhRANKL and rhIL2 for 21 days, with intermediate feedings on every 3rd
day. On 21st day,
number of osteoclasts (multinucleated,23c6+
cells) generated in an entire well were quantified
and the effect of γδ T cells on osteoclastogenesis was determined by analyzing increase or
decrease in the total number of osteoclast generated per well as compared to control wells.
Generation of human osteoclast in the presence of cells free supernatants of γδ T cells
“Activated” and “freshly isolated” γδ T cells were stimulated with rhIL2 or BrHPP+rhIL2 for 24
hrs and cell free supernatants were collected. Osteoclast precursor cells (OPCs) were generated
from CD14+
precursor cells (1×10⁵) in the presence of rhMCSF and rhRANKL for 12 days in
osteoclast activity assay substrate module (OAAS, synthetic Ca2PO4 coated slides). From 12th
day onwards, every 3rd day, the cultures were supplemented with pretitrated volumes of cell free
supernatant of stimulated “activated” and “freshly isolated” γδ T cells along with rhMCSF and
rhRANKL. Osteoclasts generated in the presence of rhMCSF and rhRANKL were kept as
positive control. On 21st day, cells were bleached out using 6% sodium hypochlorite and 5.2%

Synopsis
5
sodium chloride. OAAS plates were air dried and resorption area/pits generated by mature
resorbing osteoclasts were imaged and quantitated using ImageJ software. Effect of γδ T cells on
resorptive ability of osteoclasts was assessed by comparing the total resorbed area generated by
osteoclasts in the presence of cell free supernatant of γδ T cells compared to positive control.
IL6-IFNγ neutralization assay
Role of IFNγ and IL6 on osteoclastogenesis were analyzed by neutralizing these cytokines in cell
free supernatants of γδ T cells used for resorption assays. Osteoclasts were generated from
CD14+ cells (1x10
5) in the presence of rhMCSF and rhRANKL for 12 days in OAAS module as
described earlier. From 12th
day onwards, every 3rd
day, the cells were supplemented with
rhMCSF, rhRANKL and cell free supernatant of unstimulated “activated” and “non-activated/
freshly isolated” γδ T cells, with or without antihuman αIFNγ or αIL6 neutralization antibody
(10μg/ml) respectively. Osteoclasts generated in the presence of rhMCSF and rhRANKL were
kept as positive control. On 21st day, the cultures were terminated and resorption area generated
by mature resorbing osteoclasts in OAAS well was calculated using ImageJ software.
2D-PAGE-MS
MCF7 cells were treated with Zoledronate (100μM) or left untreated for 24 hrs at 37˚C. Lysates
were prepared using urea based lysis buffer (8M urea, 2M thiourea, 1% CHAPS, 1% DTT) and
protein estimation was done by TCA method. Two dimensional profiles of the Zoledronate
treated and untreated MCF7 cells were generated using 3-10 nonlinear, 17cm IPG strip according
to Laemmli [33] and gels were silver stained for visualization of the proteins. Protein profiles of
untreated and Zoledronate treated MCF7 cells were compared using PDQuest software for
differential protein expression. Proteins spots showing quantitative /qualitative changes were
separated, destained and were subjected for in gel digestion with trypsin (HPLC grade). Tryptic

Synopsis
6
peptides were reconstituted in 10% acetonitrile with 0.1% TFA. Reconstituted peptides were
acquired on MALDI TOF-TOF Ultraflex-II (Brucker Daltonics) and data was analyzed using
MASCOT search engine.
LC-MS
iTRAQ labeling followed by LC-MS was used to analyze quantitative differences between
zoledronate treated and untreated MCF7 cells. Zoledronate (100μM) treated and untreated MCF7
cells lysed in NP-40 based lysis buffer and protein estimation was done by TCA method.
Proteins form untreated and Zoledronate treated MCF7 lysates were digested in solution using
trypsin at 37˚C. These trypsin digested peptides were, delipidated, purified and concentrated
using Zip-tip and were vacuum dried. iTRAQ labeling of peptides was carried out using kit as
per the kit instructions. Samples were acquired using Nano LC-ESI-Q TOF (Triple TOF 5600+,
AB SCIEX, USA). The data was analyzed using Protein PilotTM
Software.
Multicolor flow cytometry
Multicolor flow cytometry was used to analyze immune cell subsets, their activation status,
intracellular cytokines, memory status of healthy individuals and breast cancer patients. PBMCs
(1x10⁶/50μl) were stained with combination of flurochrome labeled monoclonal antibodies
(1μg/1x106
cells) for 30 min at 4˚C in dark. The cells were washed with 1X PBS, fixed in 1%
paraformaldehyde for 15 min at 4˚C in dark. Atleast 50000 events were acquired on FACS Aria
and data was analyzed using FlowJo software.
Cytokine estimation by Cytometric bead array CBA
“Freshly isolated” or “activated” γδ T cells from healthy individuals or breast cancer patients
were stimulated with rhIL2, BrHPP+rhIL2, Zoledronate+rhIL2 or were kept unstimulated
(incubated in medium only/ control) for 24 hrs. After 24 hrs, cell free supernatants were

Synopsis
7
collected and analyzed for Th1/Th2/Th17 cytokines (IL2, IL4, IL6, IL10, TNFα, IFNγ and IL17)
using CBA kit (BD Biosciences) as per the kit instructions.
Results
Objective 1: To investigate the effect of T cells in osteoclastogenesis
Analysis of activation markers on “freshly isolated” γδ T cells (directly separated from PBMCs)
and “activated” γδ T cells (separated from αCD3/CD28+rhIL2 expanded PBMCs) was carried
out. “Freshly isolated” γδ T cells showed low levels of activation markers (CD69, CD25 and
RANKL), while “activated” γδ T cells showed higher expression of activation markers on them.
Antigenic stimulation of both “freshly isolated” and “activated” γδ T cells with rhIL2,
BrHPP+rhIL2 and Zoledronate+rhIL2 showed significant increase in expression of these
activation markers. To study the direct effect of γδ T cells on osteoclastogenesis, osteoclasts
were generated from CD14+ cells in the presence of autologous “freshly isolated” and
“activated” γδ T cells. CD14+ cells cultured in the presence of “activated” γδ T cells showed
significant reduction in total number of generated osteoclasts, while “freshly isolated” γδ T cells
significantly increased total number of osteoclasts compared to positive control. Long term
stimulation of “freshly isolated” γδ T cells with BrHPP during coculture, showed reduction in
osteoclast generation. Similarly, generation of osteoclasts in the presence of cell free
supernatants of rhIL2 or BrHPP+rhIL2 stimulated “activated” γδ T cells showed reduction of
osteoclast function (resorption area generated by mature osteoclast). Contrary to that, cell free
supernatants of “freshly isolated” γδ T cells, stimulated with rhIL2 or BrHPP+rhIL2 showed
significant increase in resorption area. Cytokine profile of cell free supernatant of unstimulated
“freshly isolated” and “activated” γδ T cells showed major differences in IL6 and IFNγ levels. At

Synopsis
8
baseline level, “activated” γδ T cells produced higher levels of anti-osteoclastogenic IFNγ, while
“freshly isolated” γδ T cells were major producers of pro-osteoclastogenic cytokine IL6.
Stimulation of both “freshly isolated” and “activated” γδ T cells with rhIL2, BrHPP or
Zoledronate upregulated IFNγ levels, but levels of IL6 remained higher in case of “freshly
isolated” γδ T cells. Pro and anti –osteoclastogenic effect of γδ T cells on osteoclastogenesis
through IFNγ and IL6 was further validated by neutralizing these cytokines using blocking
antibodies. Blocking of IFNγ in cell free supernatants of “activated” γδ T cells reverted its anti-
osteoclastogenic effect, while blocking of IL6 from cell free supernatants of “freshly isolated” γδ
T cells showed reduction in resorption area. Our results suggests that the dynamics of IFNγ and
IL6 play a major role in mediating the pro and antiosteoclastogenic effects of “activated” γδ T
cells and “freshly isolated” γδ T cells respectively.
Objective 2: To understand the effect of aminobisphosphonate Zoledronate on protein
profiles of breast tumor cells
Comparative analysis of 2D profiles of Zoledronate treated and untreated MCF7 cells showed
quantitative and qualitative changes in proteins expression. Among the proteins identified by
MALDI-TOF TOF, most of the proteins were cytoskeletal elements (Keratin 7,8,18 and β
tubulin) and enzymes (α-enolase, Phsophoglycerate mutase1, Triosephosphate isomerase,
Peroxiredoxin 1). A more sensitive approach, iTRAQ labeling followed by LC-MS was used to
analyze quantitative differences between Zoledronate treated and untreated MCF7 cells. Total
2222 proteins were identified. Out of that, 148 proteins were upregulated
(Treated/untreated=1.5), and 26 proteins showed downregulation (Treated/untreated=0.5).
PANTHER analysis showed major changes in cellular and metabolic processes in MCF7 cells
upon Zoledronate treatment. A significant upregulation in “diphosphomevalonate decarboxylase/
Synopsis
9
phosphomevalonate decarboxylase” enzyme, which catalyzes last step of isopentenyl
pyrophosphate generation from mevalonate (IPP, potent γδ T cell antigen) was observed, along
with other γδ T cells recruiting (S100A8, IPP) and activating (HSP60) proteins. Zoledronate
treatment caused upregulation of tumor antigens (mellanotransferrins and melanoma antigen
D2). Proteins involved in immune synapse formation between T cells and antigen presenting
cells (dynamins, CD2AP, phocein, clusterins) were found upregulated. Zoledronate upregulated
expression of proteins involved in apoptosis, copper toxicity, EGFR degradation, glycolytic
enzymes, while proteins involved in cytoskeletal reorganization, vesicular trafficking, protein
degradation and cell adhesion were found downregulated. Zoledronate also downregulated the
proteins involved in DNA repair and chromatin remodeling, arresting breast tumor cells in S-
phase (validated by cell cycle experiment).
Objective 3: Immune profiling of breast cancer patients on Zoledronate treatment
Comparative immune profiling of breast cancer patients on Zoledronate treatment (n=21),
without Zoledronate treatment (n =28) and healthy individuals (n=32) was carried out. Total
CD3+ T cells in peripheral blood of breast cancer patients (both Zoledronate treated and
Zoledronate untreated) were reduced as compared to healthy individuals. Zoledronate treatment
in breast cancer patients showed significant increase in cytotoxic T cells (CD8+), natural killer
cells and B cells, while percentages of regulatory T cells, monocytes (osteoclast precursor cells)
were reduced compared to Zoledronate untreated breast cancer patients and healthy individuals.
γδ T cell percentages in peripheral blood of breast cancer patients on Zoledronate treatment were
reduced but these cells were in highly activated state (high CD25, RANKL and increased IFNγ
production). Analysis of memory status of γδ T cells showed significant increase in effector
memory cells with concomitant decrease in central memory cells. Zoledronate activated γδ T
Synopsis
10
cells showed increased IFNγ secretion upon antigenic stimulation. Cytokine profiling of cell free
supernatants of unstimulated γδ T cells of Zoledronate treated breast cancer patient showed
reduced IL6 (pro-osteoclastogenic and pro- tumorogenic) levels compared to Zoledronate
untreated breast cancer patient and healthy individuals. This showed correlation with our in vitro
data that, upon antigenic stimulation, secretion of IL6 by γδ T cells reduces while IFNγ levels
increases, which has a potent anti-osteoclastogenic effect.
Summary and Conclusion
The present study has shown that activation status and cytokine dynamics of γδ T cells
determines their effect on osteoclastogenesis. Non-activated γδ T cells are major producers of
pro-osteoclstogenic cytokine IL6 and enhance osteoclastogenesis. Activated γδ T cells show
higher levels of IFNγ (anti-osteoclastogenic) secretion and potentially inhibit osteoclast
generation and function. Detailed proteome analysis of untreated and Zoledronate treated breast
tumor cells (MCF7) showed elevated expression of proteins involved in recruitment of γδ T cells
and those involved in immune synapse formation between γδ T cells and breast tumor cells.
Zoledronate also affected multiple metabolic processes involved in apoptosis of breast tumor
cells. In vivo effect of Zoledronate treatment on the immune scenario was investigated in breast
cancer patients. It was observed that Zoledronate treatment activated both innate (γδ T cells, NK
cells) and adaptive (CD8) immune cells; while percentages of regulatory cells (CD4+CD25
+127
-
FOxP3+) and macrophages were reduced. γδ T cells percentages in peripheral blood were
reduced in Zoledronate treated breast cancer patients, but these cells were in highly activated
state, expressing increased levels of activation markers (CD25, RANKL) and IFNγ. γδ T cells
from Zoledronate treated breast cancer patients were of effector memory phenotype

Synopsis
11
(γδ+CD45RA
- CD27
-). Zoledronate treated breast cancer patients also showed reduced levels of
IL6 secretion, which is a potent pro-osteoclastogenic and pro-tumorigenic cytokine.
In conclusion, the present study has demonstrated that aminobisphosphonates facilitate
the crosstalk between the immune and skeletal system. The study has also highlighted the
mechanism of action of aminobisphosphonates in breast cancer patients that extends its role
beyond the well defined anti-resorptive function to the treatment of malignancies.
.References
1. Ahn SG, Lee HM, Cho SH, Lee SA, Hwang SH, et al. (2013) Prognostic factors for patients with
bone-only metastasis in breast cancer. Yonsei Med J 54: 1168-1177.
2. Soysa NS, Alles N, Aoki K, Ohya K (2012) Osteoclast formation and differentiation: an
overview. J Med Dent Sci 59: 65-74.
3. Teitelbaum SL (2007) Osteoclasts: what do they do and how do they do it? Am J Pathol 170:
427-435.
4. Zheng Y, Zhou H, Dunstan CR, Sutherland RL, Seibel MJ (2013) The role of the bone
microenvironment in skeletal metastasis. J Bone Oncol 2: 47-57.
5. Soki FN, Park SI, McCauley LK (2012) The multifaceted actions of PTHrP in skeletal metastasis.
Future Oncol 8: 803-817.
6. Fournier PG, Stresing V, Ebetino FH, Clezardin P (2010) How do bisphosphonates inhibit bone
metastasis in vivo? Neoplasia 12: 571-578.
7. Drake MT, Clarke BL, Khosla S (2008) Bisphosphonates: mechanism of action and role in
clinical practice. Mayo Clin Proc 83: 1032-1045.
8. Kimachi K, Kajiya H, Nakayama S, Ikebe T, Okabe K (2011) Zoledronic acid inhibits RANK
expression and migration of osteoclast precursors during osteoclastogenesis. Naunyn
Schmiedebergs Arch Pharmacol 383: 297-308.
9. Green JR (2003) Antitumor effects of bisphosphonates. Cancer 97: 840-847.
Synopsis
12
10. Jagdev SP, Coleman RE, Shipman CM, Rostami HA, Croucher PI (2001) The bisphosphonate,
zoledronic acid, induces apoptosis of breast cancer cells: evidence for synergy with paclitaxel.
Br J Cancer 84: 1126-1134.
11. Chiplunkar S, Dhar S, Wesch D, Kabelitz D (2009) gammadelta T cells in cancer
immunotherapy: current status and future prospects. Immunotherapy 1: 663-678.
12. Hayday AC (2000) [gamma][delta] cells: a right time and a right place for a conserved third
way of protection. Annu Rev Immunol 18: 975-1026.
13. Caccamo N, Todaro M, Sireci G, Meraviglia S, Stassi G, et al. (2013) Mechanisms underlying
lineage commitment and plasticity of human gammadelta T cells. Cell Mol Immunol 10: 30-34.
14. Beetz S, Marischen L, Kabelitz D, Wesch D (2007) Human gamma delta T cells: candidates
for the development of immunotherapeutic strategies. Immunol Res 37: 97-111.
15. Konigshofer Y, Chien YH (2006) Gammadelta T cells - innate immune lymphocytes? Curr
Opin Immunol 18: 527-533.
16. Kabelitz D, Kalyan S, Oberg HH, Wesch D (2013) Human Vdelta2 versus non-Vdelta2
gammadelta T cells in antitumor immunity. Oncoimmunology 2: e23304.
17. Sharp LL, Jameson JM, Cauvi G, Havran WL (2005) Dendritic epidermal T cells regulate skin
homeostasis through local production of insulin-like growth factor 1. Nat Immunol 6: 73-79.
18. Jameson JM, Cauvi G, Sharp LL, Witherden DA, Havran WL (2005) Gammadelta T cell-
induced hyaluronan production by epithelial cells regulates inflammation. J Exp Med 201: 1269-
1279.
19. Havran WL, Jameson JM, Witherden DA (2005) Epithelial cells and their neighbors. III.
Interactions between intraepithelial lymphocytes and neighboring epithelial cells. Am J Physiol
Gastrointest Liver Physiol 289: G627-630.
20. Born WK, Reardon CL, O'Brien RL (2006) The function of gammadelta T cells in innate
immunity. Curr Opin Immunol 18: 31-38.
21. Hayday AC (2009) Gammadelta T cells and the lymphoid stress-surveillance response.
Immunity 31: 184-196.
22. Wu YL, Ding YP, Tanaka Y, Shen LW, Wei CH, et al. (2014) gammadelta T cells and their
potential for immunotherapy. Int J Biol Sci 10: 119-135.
Synopsis
13
23. Wesch D, Marx S, Kabelitz D (1997) Comparative analysis of alpha beta and gamma delta T
cell activation by Mycobacterium tuberculosis and isopentenyl pyrophosphate. Eur J Immunol
27: 952-956.
24. Gomes AQ, Correia DV, Grosso AR, Lanca T, Ferreira C, et al. (2010) Identification of a panel
of ten cell surface protein antigens associated with immunotargeting of leukemias and
lymphomas by peripheral blood gammadelta T cells. Haematologica 95: 1397-1404.
25. Gertner-Dardenne J, Castellano R, Mamessier E, Garbit S, Kochbati E, et al. (2012) Human
Vgamma9Vdelta2 T cells specifically recognize and kill acute myeloid leukemic blasts. J Immunol
188: 4701-4708.
26. Dhar S, Chiplunkar SV (2010) Lysis of aminobisphosphonate-sensitized MCF-7 breast tumor
cells by Vgamma9Vdelta2 T cells. Cancer Immun 10: 10.
27. Thomas ML, Samant UC, Deshpande RK, Chiplunkar SV (2000) gammadelta T cells lyse
autologous and allogenic oesophageal tumours: involvement of heat-shock proteins in the
tumour cell lysis. Cancer Immunol Immunother 48: 653-659.
28. Pollinger B, Junt T, Metzler B, Walker UA, Tyndall A, et al. (2011) Th17 cells, not IL-17+
gammadelta T cells, drive arthritic bone destruction in mice and humans. J Immunol 186: 2602-
2612.
29. Kotake S, Udagawa N, Hakoda M, Mogi M, Yano K, et al. (2001) Activated human T cells
directly induce osteoclastogenesis from human monocytes: possible role of T cells in bone
destruction in rheumatoid arthritis patients. Arthritis Rheum 44: 1003-1012.
30. Lee SJ, Nam KI, Jin HM, Cho YN, Lee SE, et al. (2011) Bone destruction by receptor activator
of nuclear factor kappaB ligand-expressing T cells in chronic gouty arthritis. Arthritis Res Ther
13: R164.
31. Walsh MC, Kim N, Kadono Y, Rho J, Lee SY, et al. (2006) Osteoimmunology: interplay
between the immune system and bone metabolism. Annu Rev Immunol 24: 33-63.
32. Sato K, Takayanagi H (2006) Osteoclasts, rheumatoid arthritis, and osteoimmunology. Curr
Opin Rheumatol 18: 419-426.
33. Laemmli UK (1970) Cleavage of structural proteins during the assembly of the head of
bacteriophage T4. Nature 227: 680-685.
Synopsis
14
Publications in Refereed Journal:
a. Published
Swati P. Phalke, Shubhada V. Chiplunkar, “Activation status of γδ T cells dictates their
effect on osteoclast generation and bone resorption”, Bone Reports, Vol 3, (2015) 95-103.
b. Manuscripts under preparation:
1) Swati P. Phalke, Rukmini B. Govekar, Shubhada V. Chiplunkar, Proteomic analysis of
breast cancer cells treated with Zoledronate
2) Swati P. Phalke, Shubhada V. Chiplunkar, Immune profiling of breast cancer patients on
Zoledronate treatment
c. Other Publications/ Presentations:
1) National Conferences
“8th
National Research Scholars Meet” held at ACTREC, Mumbai during 21st-22
nd
December 2012, Swati P. Phalke, Shubhada V. Chiplunkar, “Understanding the crosstalk
between γδ T cells and osteoclasts in patients with breast cancer”
“32nd
Annual Convention of Indian Association for Cancer Research” , held at New Delhi
during 13-16th
February 2013, Swati Phalke, Vani Parmar, Sudeep Gupta, Rajendra Badwe,
Shubhada Chiplunkar, “Understanding the crosstalk between γδ T cells and osteoclasts in
patients with breast cancer”
“Tata Platinum Jubilee” Conference , held at Mumbai, Italy during -26th
- 28th
February, 2016, Swati Phalke, Rajendra Badwe,Vani Parmar, Shubhada Chiplunkar,
Synopsis
15

16

List of figures
17
List of Figures
Figure No. Title Page No.
Figure 1
Figure 2
Figure 3
Figure 4
Figure 5
Figure 6
Figure 7
Figure 8
Figure 9
Figure 10
Figure 11
Figure 12
Figure 13
Figure 14
Figure 15
Figure 16
Figure 2
Chemical structure of bisphosphonate.………………………….…..…...…28
Histological classification of breast cancer………………………….…..….38
Molecular classification of breast cancer……………………………...……39
Osteoclast structure……………………………………………………...….44
The process of bone remodeling……….………………………………..….47
Mechanism of aminobisphosphonates action………………………….…....54
Principle of MTT assay……………………………………………………..87
Principle of Folin-Lowry’s method of protein estimation…………………..90
Immunomagnetic separation of “freshly isolated” and “activated” γδ T
cells………………………………………………………………………...114
Analysis of activation markers (CD69, CD25 and RANKL) on “freshly
isolated (FI)” γδ T cells……………………………………………...…….120
Analysis of activation markers (CD69, CD25 and RANKL) on “activated
(ACT)” γδ T cells…………………………………………………….........122
Comparative analysis of activation markers on antigen activated “freshly
isolated” and “activated” γδ T cells…………………………………….….123
Generation of osteoclasts form mouse macrophage cell line –
RAW264.7………………………………………………………………..126
Generation of mouse osteoclasts from bone marrow precursor cells……..128
Generation of human osteoclasts from CD14+ precursor cells….……...…130
Characterization of human osteoclasts…………………………………….132
Differentiation of human osteoclasts form macrophages…………………133
Direct effect of “activated” and “freshly isolated” γδ T cells on generation
of human osteoclasts………………………………………...……….……136
Effect of soluble factors secreted by “activated” γδ T cells on function
of human osteoclasts…………………………………………….…….….139
Figure 17
Figure 18
Figure 19
List of figures
18
List of Figures
Figure No. Title Page No.
Effect of soluble factors secreted by “freshly isolated” γδ T cells on
function of human osteoclasts…………………………………………….......140
Estimation of Th1/Th2/Th17 cytokines in cell free supernatants of
“activated” (ACT) and “freshly isolated” (FI) γδ T cells…...………………..143
Effect of IFNγ and IL6 neutralization in cell free supernatants of “activated”
(ACT) and “freshly isolated” (FI) γδ T cells on osteoclast function…………146
Determination of sublethal concentration of Zoledronate for in vitro assays
using MTT Assay…………………………………………………….……….152
Images of silver stained 2D gels generated using pH 3-10 NL,17cm IPG
strip…………………………………………………………...........................154
Comparative analysis of 2D profiles of untreated and Zoledronate treated
MCF7 cells using PDQuest software……………………………………..…..156
Schematic presentation of in gel digestion of proteins………………….……157
Diagrammatic representation of identified proteins in untreated MCF7 cell
lysate using MALDI-TOF/ TOF………………..……………………………158
Classification of upregulated proteins by gene ontology based on their
biological processes, molecular function and protein class in MCF7 upon
Zoledronate treatment…………………………………..……………….……171
Classification of downregulated proteins by gene ontology based on their
biological processes, molecular function and protein class in MCF7 upon
Zoledronate treatment………………………………………..…………….…172
Interactome analysis of differentially expressed proteins in MCF7 upon
Zoledronate treatment ………………………………………………………..181
Effect of Zoledronate treatment on reorganization and expression of
cytoskeletal elements in MCF7 ……………………………………………....186
Effect of Zoledronate treatment on expression of heat shock proteins in
MCF7 cells……………………………………...………………………….…189
Figure 20
Figure 21
Figure 22
Figure 23
Figure 24
Figure 25
Figure 26
Figure 27
Figure 28
Figure 29
Figure 30
Figure 31
Figure 32

List of figures
19
List of Figures
Figure No. Title Page No.
Effect of Zoledronate treatment on expression of epidermal growth factor
receptor (EGFR) in MCF7 cells………………………………………………192
Effect of Zoledronate treatment on cell cycle of breast tumor cells………….195
Immune profile of breast cancer patients on Zoledronate treatment and
untreated breast cancer patients………………………………………………204
Effect of Zoledronate treatment on activation status of αβ and γδ T cells…...207
Effect of Zoledronate treatment on memory status of γδ T cells ………….…210
Intracellular cytokine profiling of Zoledronate treated breast cancer
patients………………………………………………………………….…….213
Estimation of Th1/Th2/Th17 cytokines in cell free supernatants of HI and
breast cancer patients γδ T cells…………………………………..…………..215
Crosstalk between bone and γδ T lymphocytes in breast cancer patients
mediated by Zoledronate ……………………………………….....………....248
Figure 33
Figure 34
Figure 35
Figure 36
Figure 37
Figure 38
Figure 39
Figure 40
List of tables
20
List of Tables
Figure No. Title Page No.
Table 1
Table 2
Table 3
Table 4
Table 5
Table 6
Table 7
Table 8
Table 9
Table 10
Table 11
Table 12
Table 13
Table 14
Table 15
Table 16
Table 17
Table 18
Major differences between αβ and γδ T cells………………………………...…56
Phenotypic heterogeneity and functional package organization of human
γδ T cells…………………………………..……………..……………......….....56
Percent yield of “freshly isolated” γδ T cells from healthy individuals……......115
Percent yield of “activated” γδ T cells from healthy individuals………..…..…116
Percent yield of CD14+ cells from healthy individuals (HI)……….…..………131
Cytokine profiling of cell free supernatants of antigen activated γδ T
cells………………..............................................................................................144
Identification of in gel digested proteins separated from 2D silver stained
gel by MALDI-TOF/TOF……………………………………………….….…..159
Differentially expressed proteins in 2D-PAGE identified by MS/MS…….…...162
List of upregulated proteins in MCF7 upon Zoledronate treatment…….……...165
List of downregulated proteins in MCF7 upon Zoledronate treatment…………167
List of differentially expressed proteins in MCF7 involved in immune cell
activation………………………………………………………….………....…175
List of differentially expressed proteins in MCF7 involved in important
cellular processes…………………………………..………………………..….177
List of differentially expressed proteins in MCF7 related to cytoskeletal
elements………………………………………………………….……………..184
List of differentially expressed proteins in MCF7 involved in EGFR
signaling…………………………………………………………………….….191
List of differentially expressed proteins in MCF7 involved in cell cycle...........194
Inclusion- Exclusion criteria for breast cancer patients…………………….….201
Median fluorescent intensity of activation markers (CD69, CD25 and
RANKL) on αβ and γδ T cells……………………………….……...………....208
Cytokine profiling of cell free supernatants of activated γδ T cells…………....216

Abbreviations
21
Abbreviations
ACN
ADCC
Ab
Ag
APCs
BrHPP
BC
BSA
CD
CTL
CBA
DTT
DMSO
DAPI
EDTA
EGFR
FCS
FH
FACS
FPPS
FBS
FITC
GAM
GAR
Hr
HSPs
HI
HMBPP
IDO
IEF
IFN
IPP
IL
IPG
iTRAQ
KDa
LPS
ml
Min
Acetonitrile
Antibody dependent cellular cytotoxicity
Antibody
Antigen
Antigen presenting cells
Bromohydrin pyrophosphate
Breast cancer
Bovine serum albumin
Cluster of differentiation
Cytotoxic T lymphocyte
Cytometric bead array
Dithiothretol
Dimethyl sulphoxide
4,6 diamidino 2 phenylindole
Ethylene diamine tetraacetic acid
Epidermal growth factor receptor
Fetal calf serum
Ficoll Hypaque
Fluorescence activated cell sorting
Farnesyl pyrophosphate synthase
Fetal bovine serum
Fluoresecein isothiocyanate
Goat anti mouse
Goat anti rabbit
Hour
Heat shock proteins
Healthy individual
(E)-4-hydroxy-3-methyl-but-2-enyl pyrophosphate
Indoleamine 2,3-dioxygenase
Isoelectric focusing
Interferon
Isopentenyl pyrophosphate
Interleukin
Immobilized pH gradient
Isobaric tags for relative and absolute quantification
Kilodalton
Lipopolysaccharide
Millilitre
Minute

Abbreviations
22
MEP
MHC
MICA
mAbs
MACS
MTT
MALDI
MS
NS
NK
NKT
NFκB
NBP
NKG2D
OPG
OPCs
OAAS
PAGE
PBMCs
PE
PBS
PFA
PI
Ppm
RAGE
rmMCSF
rmRANKL
rhMCSF
rhRANKL
RT
RPMI
rhIL2
RPM
RCF
SDS
TCR
Th
Tregs
TAA
TGF
TNF
2-C-methyl-D-erythritol 4-phosphate
Major histocompatibility complex
MHC class I chain related molecules
Monoclonal antibodies
Magnetic Assisted Cell Sorting
3-(4,5-dimethylthiazol-2-yl)-2,5-diphenyltetrazolium bromide
Matrix assisted laser desorption assay
Mass spectrometry
Normal saline
Natural Killer
Natural Killer T
Nuclear factor kappa B
Nitrogen containing bisphosphonates
Natural Killer Group 2D receptor
Osteoprotegerin
Osteoclast Precursor Cells
Osteoclast Activity Assay Substrate
Polyacrylamide gel electrophoresis
Peripheral blood mononuclear cells
Phycoerythrin
Phosphate Buffered saline
Parafromaldehyde
Propidium iodide
Parts per million
Receptor for advanced glycation end products
Recombinant mouse macrophage colony stimulating factor
Recombinant mouse receptor activator of nuclear factor kappa B ligand
Recombinant human macrophage colony stimulating factor
Recombinant human receptor activator of nuclear factor kappa B ligand
Room temperature
Roswell Park Memorial Institute
Recombinant human interleukin 2
Rotations per minute
Relative centrifugal force
Sodium dodecyl sulphate
T cell receptor
T helper
Regulatory T cells
Tumor associated antigen
Transforming growth factor
Tumor necrosis factor

Abbreviations
23
TLR
TALL
TRAP
TOF
ULBP
VHrs
WHO
γδ
αβ
αMEM
μg
μl
μM
Toll like receptor
T cell acute lymphoblastic leukemia/lymphoma
Tartarate resistant acid phosphatase
Time of flight
UL16 binding protein
Volt Hours
World Health Organization
Gamma delta
Alpha beta
Minimum essential medium with alpha modification
Microgram
Microlitre
Micromolar

24

Introduction
25
Chapter 1
Introduction

Introduction
26
Introduction
27
Breast cancer is the 2nd
most common cancer in the world and the most frequent
cancer among women, with an estimate of 1.67 million new cancer cases diagnosed in 2012
(25% of all cancers). Breast cancer ranks as the 5th
cause of death from cancer overall and it is
the most frequent cause of cancer death in women in less developed regions (14.3% of total). It
is now the 2nd
cause of cancer death in more developed regions (15.4%) after lung cancer
(GLOBOCAN 2012).
Breast cancer cells metastasize preferentially to the bone, while other sites include
lungs, regional lymph nodes, liver and brain [34,35,36]. 80% of patients with advanced breast
cancer show bone metastasis [37]. Bone microenvironment plays essential role in metastasis of
the tumor cells [38]. Bone undergoes continuous remodeling during entire life to attain and
preserve skeletal size, shape, and structural integrity and regulate mineral homeostasis [3,39].
Bone remodeling is essentially carried out by two cells-osteoclasts and osteoblasts in a highly
coordinated manner. Osteoclasts are large multinucleated cells generated by fusion of monocyte-
macrophage precursor cells [2] and are known to decalcify and degrade the bone by secreting
the lysosomal proteases [3]. Osteoblasts are derived from mesenchymal cells, secrete bone
matrix proteins and promote mineralization. Imbalance in bone remodeling results in
pathological conditions such as osteoporosis, rheumatoid arthritis (RA), Paget's disease and
osteoporosis [40]. Breast cancer cells show osteolytic metastasis, which causes severe and
progressive pain, hypercalcemia, fragile bone, pathological fractures, spinal cord compression,
other nerve compression syndromes, erythema over the affected bone and swelling [41]. The
mechanism responsible for tumor growth in bone involves complex events. Breast tumor cells
enhance osteoclastogenesis by stimulation of osteoclast and osteoblast [42,43]. Increased bone
resorption releases growth factors and TGFβ from bone and provides nutrition to tumor cells,

Introduction
28
[Santini et al.(2003);Ann Oncol;14:1468-76]
Figure 1: Chemical structure of bisphosphonate
creating a vicious cycle. Tumor cells also recruit immune cells in the bone microenvironment.
Immune system and skeletal system share number of common cytokines, chemokines, signaling
molecules and transcription factors [31,44]. Activated T lymphocytes have been shown to
stimulate osteoclast differentiation and bone resorption through cytokines, such as receptor
activator of nuclear factor (NF)-kB ligand (RANKL), interleukin (IL)-6, IL7, IL17 and TNFα
[45,46,47,48,49,50,51].
Bisphosphonates (BPs)
are chemically stable analogs of
inorganic pyrophosphates, which are
characterized by two pyrophosphate
groups linked to a central carbon
atom, forming a P-C-P structure. Two
side chains (referred to as R1 and R2)
are covalently bound to the carbon
atom of the common P-C-P structure
(Figure 1). The P-C-P backbone and
the R1 side chain allow the
bisphosphonates to bond avidly to hydroxyapatite on the bone surface and are preferentially
delivered to sites of increased bone formation or resorption. The first generation bisphosphonates
were non-nitrogen containing and exerted their effect by replacing terminal phosphate of
adenosine pyrophosphates (ATP). These non-hydrolysable ATP analogs likely promoted
apoptosis by inhibiting ATP dependent cellular enzymes [52]. The more potent second and third
generation nitrogen containing bisphosphonates (NBPs) inhibit the farnesyl pyrophosphate

Introduction
29
synthase (FPPS) enzyme in the mammalian mevalonate pathway [53]. This arrests the
prenylation or geranylation of crucial GTPases such as Ras, Rho, Rac that are vital for cell
survival, subsequently leading to tumor cell apoptosis. Aminobisphosphonates and anti-RANKL
antibodies (Denusumab) are commonly used to prevent bone loss in osteoporosis and for the
treatment of bone disease in solid cancer (breast and prostate cancer) and multiple myeloma
[54,55,56,57,58,59,60,61]. Inhibition of FPPS by aminobisphosphonates leads to upregulation of
intracellular isopentenyl pyrophosphate (IPP) levels in cell and these are recognized by γδ T cell
through γδ TCR, resulting in direct activation of γδ T cells [62,63].
γδ T cells are unique subset of immune cells and represent ~1-10% of total T cell
population in peripheral blood of humans [22]. Unlike αβ T cells, γδ T cells are unique with
respect to their T-cell receptor (TCR) gene usage, tissue tropism and MHC independent antigen
recognition [11,12]. Major population of γδ T cells (>90%) express Vγ9Vδ2 TCR (also called as
Vγ2Vδ2) and are present in human peripheral blood, while 10% population express Vγ9Vδ1
TCR [16]. γδ T cells are Th1 type cells and secrete copious amount of IFNγ upon stimulation
[13,14]. γδ T cells are highly plastic and can differentiate into Th2 [64,65], Th17 [66,67], Tfh
[13] and T regulatory [68] type. γδ T cells play an important role in antitumor cytotoxicity
[15,16], wound healing and tissue repair [17,18,19]. γδ T cells express natural killer receptors
[20,21] and recognize stressed/ tumor cells expressing MICA/B and ULBPs [22]. γδ T cells are
increased in bacterial, viral and parasitic infections [20]. Antitumor ability of γδ T cells against a
broad panel of solid tumors and leukemia’s has been widely reported [24,25,26,27,69,70,71].
There are three major subclasses of nonpeptide compounds that stimulate γδ T cells: prenyl
pyrophosphates, aminobisphosphonates and alkylamines [22,63,72]. Prenyl pyrophosphates and
alkylamines are natural antigens that are produced by bacteria and other human pathogens during

Introduction
30
infections [73]. A unique set of antigens recognized by γδ T cells include intermediate products
of eukaryotic mevalonate pathway (isopentenyl pyrophosphate or its synthetic analog
bromohydrin pyrophosphate) and bacterial rohmer pathway (HMBPP [E]-4-Hydroxy-3-methyl-
but-2-enylpyrophosphate) [20]. Emerging data suggests that NBPs have immunomodulatory
properties. Some NBPs can induce expansion of human γδ T cells (Vγ9Vδ2) [11,74,75]. It is
known that aminobisphosphonate recognition is γδ TCR mediated [26,76], but the exact
mechanism of activation of γδ T cells induced by aminobisphosphonates is still unclear.
Aminobisphosphonates, apart from acting as antigens for γδ T cells also bear
potent anti tumor effects [9]. In vitro studies have shown that, Zoledronate inhibits growth of
tumor cells and induces apoptosis [77,78]. They are known to induce apoptosis in myelomas,
lymphomas and in some solid tumors. Further, aminobisphosphonates have been shown to
interfere with angiogenesis and target endothelial cell adhesion and migration [79]. Earlier
studies from our lab and others have shown that aminobisphosphonate treated tumor cells are
sensitized to efficient lysis by γδ T cells [26,80,81,82]. Thus, it is important to investigate the
mechanisms by which aminobisphosphonates sensitize tumor cells to γδ T cell mediated lysis
and also directly augment their anti-tumor effector functions. It is therefore perceived that
understanding the immunomodulatory effects of aminobisphosphonates on γδ T cells would
enable inclusion of these aminobisphosphonates in designing protocols for efficient expansion of
γδ T cells for immunotherapy. Therefore, it becomes both interesting and imperative to analyze
the role of endogenous phosphate metabolites contributed by a dysregulated mevalonate pathway
in tumor cells; that could potentiate the activation of human γδ T cells. Dual effect of
aminobisphosphonates in curtailing bone loss and activating Vγ9Vδ2 T cells opens an exciting
area of research that has clinical implications.

Introduction
31
With this background, the present thesis aims at investigating the crosstalk between breast
tumor cells, γδ T cells and osteoclasts, mediated by aminobisphosphonates (Zoledronate).
The objectives of the present thesis are:
1. To investigate the effect of T cells on osteoclastogenesis
2. To understand the effect of aminobisphosphonate (Zoledronate) on protein profiles of
breast tumor cells
3. Immune profiling of breast cancer patients on Zoledronate treatment

32

Review of literature
33
Chapter 2
Review of literature

Review of literature
34

Review of literature
35
2.1) Breast cancer
Breast cancer is the most commonly occurring cancer in women and 2nd
most
frequent cancer worldwide, with more than 1.7 million cases diagnosed in 2012 (GLOBOCAN
2012). GLOBOCAN 2012 statistics suggests that compared to 2008, there is 20% increase in BC
incidence and 14% increase in mortality worldwide. Frequency of young females diagnosed with
breast cancer is higher. In total patients diagnosed with breast cancer, around 6.6% are below 40
years of age, 2.5% are below 35 and 0.65% are below 30 years of age [83,84]. In Asian
countries, the age of females at which the incidence of breast cancer peaks is 40s, whereas in
European countries and USA it peaks at the age of 60s [85]. More than 80% of Indian breast
cancer patients are less than 60 years of age.
Multiple risk factors are associated with breast cancer; those are broadly divided into two
groups- modifiable as well as nonmodifiable factors. Modifiable risk factors include late age at
first child birth, use of oral contraceptives and hormone replacement therapy, postmenopausal
obesity, cigarette smoking and alcohol consumption, whereas nonmodifiable risk factors include
sex, increasing age, family history of breast or ovarian cancer, germ line mutation in a high-risk
breast cancer susceptibility gene, benign breast disease with atypical hyperplasia, early age at
menarche, late age at menopause and dense mammary tissue [86,87,88]. Postmenopausal women
with higher level of endogenous hormones (estrogen and testosterone) show increased risk of
breast cancer compared to women with lower hormonal levels [89]. There are two important
genes which predispose the individual to breast cancer are BRCA1 (breast cancer 1) and
BRCA2. These genes code for BRCA1 and BRCA2 proteins, which acts as tumor suppressors
and play essential role in DNA repair. Individuals with these mutations have 15-20 fold
increased risk of having breast cancer as compared to normal individuals [90]. Another gene
Review of literature
36
TP53, which code for P53 proteins, has a major role in regulation of cell cycle and induction of
cell growth arrest/ apoptosis in response to injury. Mutations in gene TP53 results in reduced
levels of active P53 and thus have higher chances of many cancers including breast cancer [90].
Breast cancer usually arises as ductal hyperproliferation and evolves into ductal carcinoma in
situ (DCIS), into invasive carcinoma and finally metastatic disease [91].
Techniques such as mammography, biopsies [fine needle aspiration (FNA) biopsy, core
biopsy, vacuum assisted breast biopsy, excisional and incisional surgical biopsy], magnetic field,
sound waves or radioactive tracers are used for diagnosis of breast cancer [92].
2.2) Classification of breast cancer
Based on tumor size, invasiveness, lymph node involvement and metastatic status, the
stage of the breast cancer is determined. Breast cancer staging helps to understand the prognosis
and to determine the treatment strategies. Breast cancer classification is done on the basis of
TNM (Tumor, Node and Metastasis) staging, histology, hormone receptor status and molecular
markers.

Review of literature
37
[2.2.1] TNM classification of breast cancer:
Stage 0 Tis, N0, M0
Ductal carcinoma in situ (DCIS) :Cancer cells are still within a duct and haven’t
invaded deeper into the surrounding fatty breast tissue.
Lobular carcinoma in situ (LCIS)
Paget disease of the nipple (without an underlying tumor mass) is also stage 0. In
all cases the cancer has not spread to lymph nodes or distant sites.
Stage IA T1, N0, M0 Tumor is 2 cm or less across (T1) and has not spread to lymph nodes (N0) or
distant sites (M0).
Stage IB T0 or T1,
N1mi, M0
Tumor is 2 cm or less across (or is not found) (T0 or T1) with micrometastases in
1 to 3 axillary lymph nodes (the cancer in the underarm lymph nodes is greater
than 0.2mm across and/or more than 200 cells but is not larger than 2 mm)(N1mi).
The cancer has not spread to distant sites (M0).
Stage
IIA
T0 or T1, N1
(but not
N1mi), M0
The tumor is 2 cm or less across (or is not found) (T1 or T0) and either:
It has spread to 1 to 3 axillary (underarm) lymph nodes, with the cancer in the
lymph nodes larger than 2 mm across (N1a) OR Tiny amounts of cancer are
found in internal mammary lymph nodes (nodes near the breast bone) on sentinel
lymph node biopsy (N1b) OR It has spread to 1 to 3 axillary lymph nodes and
to internal mammary lymph nodes (found on sentinel lymph node biopsy) (N1c).
The cancer has not spread to distant sites (M0).
T2, N0, M0
The tumor is larger than 2 cm but less than 5 cm (about 2 inches) across (T2) but
hasn't spread to the lymph nodes (N0). The cancer has not spread to distant sites
(M0).
Stage
IIB T2, N1, M0
The tumor is larger than 2 cm but less than 5 cm across (T2). It has spread to 1 to
3 axillary lymph nodes and/or tiny amounts of cancer are found in internal
mammary lymph nodes on sentinel lymph node biopsy (N1). The cancer hasn't
spread to distant sites (M0).
T3, N1 or
N2, M0
The tumor is larger than 5 cm across but does not grow into the chest wall or skin
(T3). It has spread to 1 to 9 axillary nodes, or to internal mammary nodes (N1 or
N2). The cancer hasn't spread to distant sites (M0).
Stage
IIIB
T4, N0 to
N2, M0
The tumor has grown into the chest wall or skin (T4), and one of the following
applies:
It has not spread to- lymph nodes (N0) OR to 1 to 3 axillary lymph nodes
and/or tiny amounts of cancer are found in internal mammary lymph nodes on
sentinel lymph node biopsy (N1) OR 4 to 9 axillary lymph nodes, or it has
enlarged the internal mammary lymph nodes (N2).
The cancer hasn't spread to distant sites (M0).
Inflammatory breast cancer is classified as T4d and is at least stage IIIB. If it
has spread too many nearby lymph nodes (N3) it could be stage IIIC, and if it has
spread to distant lymph nodes or organs (M1) it would be stage IV.
Stage
IIIC
any T, N3,
M0
The tumor is any size (or can't be found), and one of the following applies:
Cancer has spread - 10 or more axillary lymph nodes (N3) OR to lymph
nodes under the collar bone (infraclavicular nodes) (N3) OR to lymph nodes
above the collar bone (supraclavicular nodes) (N3) OR 4 or more axillary
lymph nodes, and tiny amounts of cancer are found in internal mammary lymph
nodes on sentinel lymph node biopsy (N3) OR it involves axillary lymph
nodes and has enlarged the internal mammary lymph nodes (N3).
Cancer has spread to
The cancer hasn't spread to distant sites (M0).
Stage IV any T, any
N, M1
The cancer can be any size (any T) and may or may not have spread to nearby
lymph nodes (any N). It has spread to distant organs or to lymph nodes far from
the breast (M1). The most common sites of spread are the bones, liver, brain, or
lungs.
[93] http://www.cancer.org/cancer/breastcancer/detailedguide/breast-cancer-staging
Review of literature
38
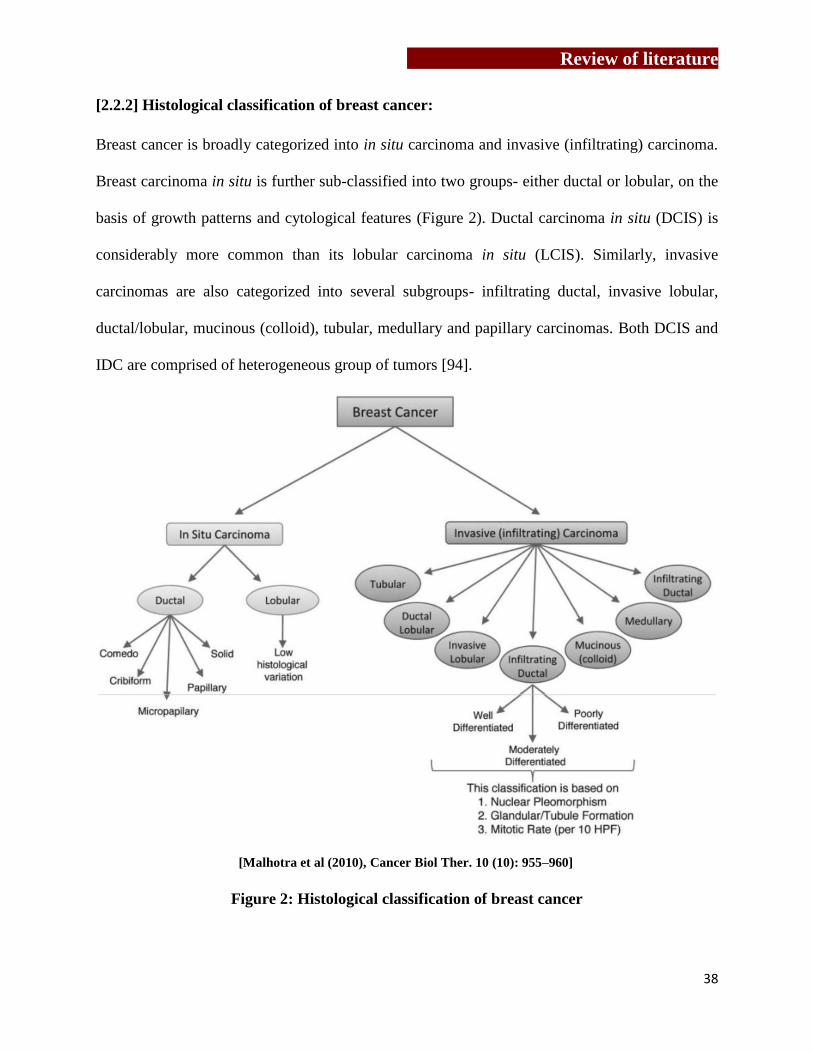
[2.2.2] Histological classification of breast cancer:
Breast cancer is broadly categorized into in situ carcinoma and invasive (infiltrating) carcinoma.
Breast carcinoma in situ is further sub-classified into two groups- either ductal or lobular, on the
basis of growth patterns and cytological features (Figure 2). Ductal carcinoma in situ (DCIS) is
considerably more common than its lobular carcinoma in situ (LCIS). Similarly, invasive
carcinomas are also categorized into several subgroups- infiltrating ductal, invasive lobular,
ductal/lobular, mucinous (colloid), tubular, medullary and papillary carcinomas. Both DCIS and
IDC are comprised of heterogeneous group of tumors [94].
Figure 2: Histological classification of breast cancer
[Malhotra et al (2010), Cancer Biol Ther. 10 (10): 955–960]
Review of literature
39
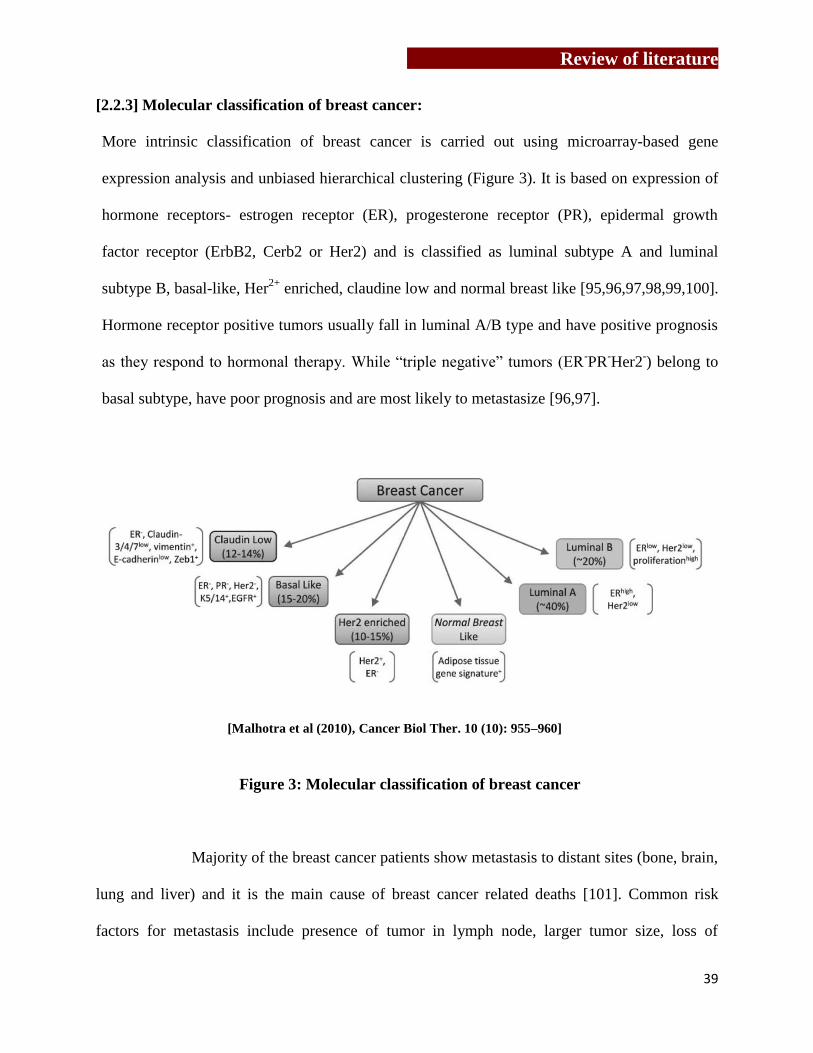
[2.2.3] Molecular classification of breast cancer:
More intrinsic classification of breast cancer is carried out using microarray-based gene
expression analysis and unbiased hierarchical clustering (Figure 3). It is based on expression of
hormone receptors- estrogen receptor (ER), progesterone receptor (PR), epidermal growth
factor receptor (ErbB2, Cerb2 or Her2) and is classified as luminal subtype A and luminal
subtype B, basal-like, Her2+
enriched, claudine low and normal breast like [95,96,97,98,99,100].
Hormone receptor positive tumors usually fall in luminal A/B type and have positive prognosis
as they respond to hormonal therapy. While “triple negative” tumors (ER-PR
-Her2
-) belong to
basal subtype, have poor prognosis and are most likely to metastasize [96,97].
Figure 3: Molecular classification of breast cancer
Majority of the breast cancer patients show metastasis to distant sites (bone, brain,
lung and liver) and it is the main cause of breast cancer related deaths [101]. Common risk
factors for metastasis include presence of tumor in lymph node, larger tumor size, loss of
[Malhotra et al (2010), Cancer Biol Ther. 10 (10): 955–960]

Review of literature
40
histopathological differentiation and vessel invasion in patients with negative tumor in axillary
lymph node [102,103,104]. Vast heterogeneity of the disease makes it difficult to predict the
prognostic markers and risk factors for development of metastasis. However, Her2 is used as a
prognostic marker [104].
Breast cancer disease treatment includes surgery (breast-conserving surgery,
mastectomy, axillary lymph node dissection), radiotherapy (whole or partial breast irradiation
with X-rays or γ-rays), and chemotherapy (use of cytotoxic drugs, such as cyclophosphamide,
methotrexate, doxorubicin, and paclitaxel), endocrine therapy (use of anti-estrogens, estrogen
inhibitors, aromatase inhibitors, ovarian ablation or ovarian suppression) or a combinatorial
approach. For the treatment of metastatic breast cancer, bisphosphonates (antiresorptive drugs)
are used as a standard treatment modality [105]. In Her2 positive metastatic breast cancer
patients, addition of trastuzumab (also known as herceptin and is monoclonal antibody against
Her2 receptor) to chemotherapy have significantly increased patients survival [106].
2.3) Bone is the preferential site of metastasis
Breast cancer cells frequently metastasize to bone and in many patients with advanced disease
the skeleton is the site of the most significant tumor burden [107]. In 1989, Stephan Paget
presented “seed and soil” hypothesis, explaining that properties of cancer cells and
complementary properties of the particular organ microenvironment provide an advantage to the
cancer cells [108]. It was stated that, chemoattractant factors and adhesion molecules that are
produced by the target organ in combination with the proper counter-receptors expressed on the
tumor cells determine homing of tumor cells to specific organs [109,110]. Bone metastasis is
aided by fenestrated structure of the bone marrow sinusoid capillaries, high blood flow in the

Review of literature
41
areas of red marrow and receptors expressed by tumor cells, which bind to the bone cells and
bone matrix [43,111]. Chemokine receptors, adhesion molecules and cell surface receptors
expressed by tumor cells allow them to adhere to bone matrix and establish themselves. Human
breast cancer cells, malignant tumor cells and metastasized tumor cells express higher levels of
CXCR4, while CXCR12/ SDF1 (CXCR4 ligand) is abundantly expressed by bone marrow cells
[112]. Apart from that, tumor cells also express α4β1/ α2β1 integrins, while VCAM1 and type 1
collagen are expressed on bone stromal cells [113]. During the process of bone formation,
osteoblast incorporate multiple growth factors like TGFβ, fibroblast growth factor, insulin
growth factor and bone morphogenic protein -2 along with Collagen type-1[113]. These factors
are released upon bone resorption and have been reported to stimulate the growth of metastasized
tumor cells and induce them to produce osteoclastogenic factors [113]. Bone metastasis could be
of osteolytic or osteoblastic or mixed type [114,115]. Most of the solid tumors (breast cancer,
prostate cancer, thyroid cancer, lung cancer, and renal cancer) cause osteolytic metastasis [113],
among which multiple myeloma (90%) and breast cancer (70 %) have highest frequency. The
most common sites of bone metastases are the spine, ribs, pelvis, proximal femur and skull.
Breast cancer cells preferentially metastasize to the bones and lungs, while prostate cancer cells
almost exclusively metastasize to the bones [116]. Metastasized tumor cells (breast cancer,
prostate cancer, thyroid cancer, lung cancer, and renal cancer) induce osteolytic bone destruction,
through which they remove bone as a physical barrier for their expansion and acquire factors
released upon resorption of bone matrix [117]. Osteolytic metastasis is associated with increased
osteoclast activity, resulting in destruction of bone. Patients often suffer with sever bone pain and
fractures [113]. Crosstalk between bone microenvironment and cancer cells play important role
in osteolytic metastasis [118]. Osteoblastic metastasis notably occurs in prostate cancer and

Review of literature
42
rarely in breast cancer (15-20%). During osteoblastic metastasis, formation of bone is succeeded
over bone resorption, generating poor quality bone.
2.4) Bone remodeling
Bone is a dynamic tissue, which undergoes continuous remodeling to maintain mineral
homeostasis and structural integrity. Almost 10% of the entire bone is replaced every year [119].
Bone remodeling (coupling) is a sequential and cyclic procedure also referred as “activation-
resorption-formation (ARF) cycle”. This process is under the tight regulation of bone cells-
osteoclasts and osteoblasts. Cortical bone provides strength and protection, while trabecular bone
is most metabolically active, which undergoes turnover in normal and diseased condition [120].
[2.4.1] Osteoblasts are bone forming cells, which regulate bone architecture by secretion of
extracellular matrix and also play an important role in regulation of osteoclastogenesis.
Osteoblasts are mononuclear cells, which originate from mesenchymal stem cells (MSCs) and
are not fully differentiated [121]. MSCs also give rise to progenitors of myoblasts, adipocytes
and chondrocytes [121]. In bone remodeling, “ossification (or osteogenesis)” is the process of
laying down new bone material by osteoblast. There are two distinct types of ossification
processes: Endochondreal and intramembranous ossification. Intramembranous ossification
mainly occurs in flat bones, mandible, maxilla and clavicle. In this type of ossification, MSCs
condense and ossification centre is created and osteoblasts directly differentiate into bone
forming cells. While endochondreal ossification occurs in bone of mesodermal origins which
forms axial skeleton, long bone, skull, ribs, vertebrae. This process involves formation of
mineralized cartilage template, which gets degraded by osteoclasts and then osteoblasts form
new bone matrix. Differentiation and function of osteoblasts is controlled by bone morphogenic
Review of literature
43
factors (BMPs) and Wnt signaling in association with Hedgehog signaling pathway [122,123].
NOTCH signaling pathway negatively regulates osteoblastogenesis [124]. Smad proteins are
recruited and activated following BMP signaling, which controls osteoblast specific
transcription factor Runt—related transcription factor 2 (Runx-2)/ core binding factor alpha 1
(cbfa1) [125]. Runx2 regulated expression of zinc finger containing transcription factor
“osterix” interacts with NFATc and collectively controls expression of osteoblast specific genes
osteocalcin, osteopontin, osteonectin, collagen type-I. Wnt signaling pathways play
indispensable role in osteoblast differentiation and maturation. Osteoblasts are the major
producers of macrophage colony stimulating factor (MCSF) and receptor activator of nuclear
factor kappa B ligand (RANKL). MSCs once committed to osteoprogenitors upregulate
expression of hormone receptors, receptors for growth factors and cytokines such as parathyroid
hormone, prostaglandin E2, IL11, insulin growth factor-1 and TGFβ. Following this
osteoprogenitors differentiate into pro-osteoblasts, which have limited proliferative capacity and
secrete extracellular matrix proteins (collagen type-I, bone sialoproteins, osteopontin) and
RANKL. Mature osteoblasts don’t proliferate but secrete collagen type-I, bone sialoproteins,
osteopontin and OPG. Osteoblasts anchor to bone surface with the help of cadherin-11 and N-
cadherins. Osteoblasts secrete collagen-proteoglycan matrix, which binds to calcium, making
pre-bone (osteoid) mineralized. Osteoblasts also form tight junctions with nearby osteoblasts.
Plasma membrane of osteoblasts is specialized for vesicular trafficking and secretion.
Osteoblasts are separate from the calcification region of osteiod layer which they have secreted.
Eventually, osteoblast gets trapped into its own secreted matrix and become osteocyte, which
doesn’t secrete osteoid further.

Review of literature
44
[Wilson et al, (2009), J Bio Chem 284: 2584-92]
Figure 4: Osteoclast structure
[2.4.2] Osteoclasts are large, multinucleated
cells, generated by fusion of monocyte-
macrophage precursor cells of
hematopoietic lineage and resorb bone
[39,126]. Osteoblasts/ stromal cells secrete
macrophage colony stimulating factor
(MCSF); which binds to c-fms receptor
expressed by osteoclast precursor cells and
induces fusion of osteoclast precursor cells (OPCs) [126]. MCSF regulates initial stages of
osteoclastogenesis such as proliferation, differentiation and fusion of osteoclast precursor cells.
MCSF has also been reported to affect osteoclast function at later stages of osteoclastogenesis
[127]. Resorptive ability of mononucleated osteoclasts is lower than multinucleated osteoclasts
[128]. Binding of MCSF to c-fms also induces expression of RANK on OPCs [129]. RANKL,
produced by osteoblasts and stromal cells in response to parathyroid hormone (PTH) and
vitamin D3 [130], binds to RANK on osteoclasts and causes differentiation of osteoclasts [39].
Co-stimulatory signals during osteoclastogenesis include (immunoreceptor tyrosine-based
activation motif)-containing adaptors DAP12 (DNAX-activating protein of 12kDa) and FcRγ
(Fc receptor γ chain). Collectively this leads to activation of the transcription factors nuclear
factor κB (NF-κB), activator protein-1 (AP-1) and nuclear factor of activated T-cells
cytoplasmic 1 (NFATc1) [131], which transcribes osteoclast specific genes (dendritic cell-
specific transmembrane protein (DC-STAMP), tartarate resistant acid phosphatase (TRAcP),
cathepsin K, matrix metalloproteinase 9 (MMP9) and αVβ3 integrin [132]. Mature osteoclasts
get polarized and have the ability to resorb bone matrix [132]. Polarized osteoclasts have

Review of literature
45
distinct membrane domains- sealing zone, ruffled border and functional secretory domains
[133]. Podosomes are attached to extracellular matrix through αVβ3 integrins / vitronectin
receptors. During polarization, a continuous dense highly dynamic podosomes containing F-
actin ring is generated by actin reorganization, which isolates area of membrane that develops
into ruffled border [134]. Ruffled borders are generated by osteoclasts only when they come in
contact with mineralized bone matrix and not on glass during in vitro culture [135]. Ruffled
borders are the highly convoluted membrane resulted from direct transport of late endosomes
and lysosomes and function to deliver proteins during resorption process. Beneath the ruffled
borders, vacuolated-type H+-ATPases channels are present, which creates acidic zones (pH 3-
4.5) required for dissolution of bone minerals. Cysteine protease cathepsin K degrades type I
collagen. The chloride-proton antiporter ClC-7 [136] function together with V-ATPase at the
ruffled border by transporting chloride ions into the resorption lacuna [137]. Through the
process of bone resorption, a very high concentration of calcium, phosphate and degraded
collagen accumulates in resorption pit/ lacunae, which is endocytosed by osteoclast, transported
through cell, released at functional secretory domain and finally in the blood stream [138,139].
During transcytosis collagen-I is further degraded by cathepsin-K and TRAP (activated by
cathepsin-K). RANKL and MCSF are essential for osteoclast survival. Osteoclasts die by
apoptosis which involves BCL-XL, Bim and MCL1 from ERK, AKT and mTOR pathway
[140,141]. Bone resorption is dependent on polarization and vesicular trafficking, which is
regulated by small GTPases like Ras, Rho, Rac, Rab [142]. Isoprenylation of these GTPases is
essential for their proper localization at membrane and function, which is targeted by
bisphosphonates [143].

Review of literature
46
[2.4.3] Osteocytes compose 90-95% of all bone cells in adult bone and plays important role in
both phosphate metabolism and calcium availability and can remodel perilacunar matrix.
Osteocyte is a source of soluble factors for bone cells as well as other distant tissues of kidney,
muscle. Osteocytes are often termed as “mechanosensor cells” due to their localization in bone
and their complex dendritic network through which they sense the load. Osteocytes originate
from mesenchymal stem cells during the process of osteoblast differentiation [144] and are the
longest lived bone cells (upto decades within the mineralized environment). Oxygen
deprivation, glucocorticoid treatment or estrogen deficiency induces osteocytes apoptosis [144].
Estrogen deficiency also induces osteocytes apoptosis by enhancing TNFα and IL11 levels
[145]. However, estrogen, estrogen receptor modulators, bisphosphonates, calcitonin, CD40
ligand, MCP1 and 3 inhibit osteocytes apoptosis [144]. Mechanical stress/ microdamages are
also among inducers of apoptosis. Both healthy and apoptosing osteocytes recruit osteoclasts at
the site of bone remodeling. In response to shear stress, osteocytes release nitric oxide (NO),
ATP and prostaglandins [146]. NO inhibits bone resorption and promotes bone formation [144].
With age, osteocytes get apoptosized and leave behind empty lacunae which get micropetrose.

Review of literature
47
[http://imueos.blogspot.in/2010/09/bone-physiology.html]
Figure 5: The process of bone remodeling
[2.4.4] Process of bone remodeling
As shown in Figure 5, the process of bone remodeling involves activation phase, reversal phase
and formation phase and is known as “ARF cycle”.
Activation Phase is a sequential process, where death/ apoptosis of osteocytes (due to
mechanical stress or microcracks in the bone) induces activation of bone resorption [147].
Apoptosis of osteocytes leads to the recruitment of osteoclasts. Osteocytes are the major
producers of TGFβ, which acts as anti-osteoclastogenic factor and levels of TGFβ deplete upon
osteocyte apoptosis [124]. Estrogen protects osteocytes from apoptosis [148], thus maintains
TGFβ levels and keeps check on osteoclasts generation and function, explaining enhanced
osteoclastogenesis in postmenopausal women [145].
This phase is followed by reversal phase. Several independent reports suggest that
resorbed surfaces contain signals that regulate recruitment of bone cells/ osteoblasts. After
resorption, pre-conditioning of the resorbed area is an essential step which is carried out by cells
of mononuclear cells (47). Though these cells belong to osteoblastic lineage, these cells have

Review of literature
48
been confirmed as bone lining cells and are not osteoblasts [149]. These cells move to the
resorption pits and degrade the remaining demineralized collagen matrix. New bone formation
occurs in resorption pits and requires complete clearance of resorption pits [149]. Studies
indicate that, pre-osteoblasts / bone lining cells mediate cleaning of resorption pits before getting
differentiated into mature osteoblasts, which restore resorbed bone matrix (47,70,73,74).
Bone formation phase is influenced by osteoclasts, as reports suggest that mature
osteoclasts secrete factors which activate nodule formation by osteoblasts (122). Cardiothrophin-
1 produced by osteoclasts activates bone formation by osteoblasts (123). Osteoblasts secrete
bone matrix proteins and deposit minerals. Collagen type Iα1 (COL1) is expressed in all stages
of osteoblast differentiation and is main structural component of bone matrix. Osteopontin
(OPN) is a non-collagenous matrix protein, while alkaline phosphatase is important in stabilizing
the matrix. Osteocalcin is another non-collagenous protein, which is almost exclusively
expressed in bone and is up-regulated in the late differentiation stage. It is expressed at the same
time of mineralization stage indicating its role in the regulation of matrix mineralization [150].
After formation of new bone the process is terminated.
2.5) Crosstalk between tumor cells, immune cells and bone cells
The process of bone remodeling is affected by multiple factors contributed by tumor cells and
lymphocytes. Role of T cells in bone remodeling is very well reported [28,50,51,151,152]. T
cells originate from hematopoietic stem cells in bone marrow and get activated in thymus. Bone
marrow serves as a central organ in mature T cells-traffic, acts as preferential homing site to
memory T cells and contribute to their long term cytotoxic memory [153]. T cells regulate bone
resorption in inflammation and osteoporosis [154]. T cells have been shown to localize near
Review of literature
49
osteoclasts [28]. Cancer cells produce multiple factors that recruit T cells to bone
microenvironment. PTHrP is one of the important factor abundantly secreted by breast cancer
cells under the influence of TGFβ (released from resorbed bone) [117]. PTHrP activates
secretion of RANKL by osteoblasts [155] and has possibly been predicted to activate T cells.
PTH and PTHrP both can bind to PTHR1. T cells express PTHR1 and are activated by PTH
[156,157]. Number of surface molecules and membrane proteins on T cells assist them to interact
with bone cells, such as LFA1, TCR and CD6+ T cells interact with ICAM1, MHC-II and CD166
respectively on osteoblasts [158]. Osteoclasts and osteoblasts behave like antigen presenting
cells and activate T cells [159]. Peripheral blood T cells from cancer patients have been shown to
secrete potent pro-osteoclastogenic factors like TNFα and sRANKL, which spontaneously
induce osteoclastogenesis [160,161,162]. Activated CD8+ T cells express higher levels of
RANKL as compared to activated CD4+ T cells in vitro [162]. T cells secrete TNF-related
apoptosis-inducing ligand (TRAIL), which blocks OPG action (decoy receptor of RANKL and
thus antiosteoclastogenic) and also protects breast cancer cells from TRAIL induced apoptosis
[163]. Bone marrow of breast cancer patients [164] and multiple myeloma [162] patients have
been reported to show increased IL7 levels as compared to normal tissues. IL7, a key player in
lymphocyte generation and T cell homeostasis, induces RANKL and TNF-α secretion in T cells
[162,165]. Higher level of IL7 increases T cell proliferation, activation and has been associated
with upregulated antigen presentation [166]. Elevated levels of circulating IL7 levels increased T
cells migration from thymus in mice [166]. Another cytokine secreted by tumor cells is IL8
(CXCL-8), which activates osteoclastogenesis in RANK-RANKL independent manner [167].
Cytotoxic CD8+ T cells express IL8 receptors (CXCR1 and CXCR2), which upon binding to IL8
activates T cells to induce potent cytotoxic reaction (production and release of perforin,

Review of literature
50
granzyme B and IFNγ) [168]. Inhibition of IL8 receptors showed reduced migration of thymic T
cells in mice [168]. Though IL7 has an immunostimulatory effect, bone microenvironment
contains elevated levels of TGF-β. TGF-β is a potent immunosuppressive cytokine, which
inhibits T cell proliferation, NK-cells and antigen presentation by T cells [169]. TGF-β inhibits
expression of IFN-γ induced transcription factors, IFN regulatory factor -1 and T-bet, factors
involved in differentiation of naive T cells to Th1 subtype [169] and also downregulates IFN-γ
signaling by preventing phosphorylation of JAK1 and STAT1 by increasing Shp-1 phosphatase
[170], which ultimately inhibits development of Th1 cell types. TGFβ is essential for induction
of expansion and function of regulatory T-cells in vivo [171]. TGF- β induces expression of
transcription factor FoxP3 in CD4+CD25
- T cells [172]. TGF-β has been shown to suppress
cytotoxicity of CD8+ T lymphocytes (CTLs) by specifically inhibiting the expression of five
cytolytic genes- perforin, granzyme A, granzyme B, FasL, and IFNγ, through binding of TGF-β
induced smad and ATF1 to promoters of these genes [173]. Cytokines secreted by T cells
influence the process of osteoclastgenesis. Immune cells secrete an array of cytokines like IL6,
IL17, TGFβ, TNFα and RANKL, which are known to induce osteoclast formation and function,
while cytokines like IL4, IL10, IL12, IL13, IL18 and IFNγ inhibit the process of
osteoclastogenesis [126]. Conventional CD4+
T cells upon activation increase expression of
RANKL and are known to be pro-osteoclastogenic [174]. IL17 producing CD4+T cells cause
bone destruction by inducing RANKL expression on synovial fibroblasts and osteoblasts. IL6,
TNFα and IL1β work in a synergistic manner to stimulate osteoclast differentiation [175]. IL6
together with IL11 supports osteoclast formation and resorption [176]. TNFα is a
proinflammatory cytokine, which directly and indirectly enhances osteoclast generation and its
resorptive activity [177,178]. TNF along with RANKL increases expression of RANK on

Review of literature
51
osteoclast precursor cells [179]. TNFα and TGFβ synergistically induce osteoclastgenesis in the
absence of TRAF6 or RANK, which explains potential role of TNFα in bone pathologies [177].
TNF and IL1β synergistically promote expression of osteoprotegerin ligand (osteoprotegerin is a
decoy receptor for RANKL) in osteoblasts [180], upregulate expression of RANKL on
osteoblasts and stromal cells, stimulate differentiation of osteoclast precursor cells and increase
activity and survival of osteoclasts by preventing apoptosis [145]. TNFα stimulates production of
IL6 in osteoblasts and osteoblast-like osteosarcoma cells [181]. IL4 inhibits TNFα mediated
osteoclast formation by inhibition of RANKL expression in TNFα activated stromal cells and
direct inhibition of TNFα-activated osteoclast precursors via a T-cell-independent mechanism in
vivo [182]. IL10 exerts a reciprocal action on the differentiation of osteoclasts and macrophages
from their shared precursor by substantial reduction in the ratio of calcitonin receptor-positive
cells to macrophages [183]. IFNγ is a potent inhibitor of osteoclastogenesis as it degrades TRAF
adaptor protein involved in RANK-RANKL signaling [51].
2.6) Vicious Cycle
Primary tumor cells release factors before dissemination and create a pre-metastatic niche, which
is supported by bone marrow. Bone remodeling is controlled by osteoblasts through changes in
expression of RANKL and OPG [184]. Cancer cells mimic the physiological pathways that
maintain bone remodeling and secrete factors which enhance osteoclastogenesis [117]. Breast
cancer cells share number of phenotypes with bone cells, such as, expression of calcitonin
receptors, bone sialoproteins, cathepsin-K and osteopontin which might be contributing in their
establishment and growth in bone [185,186]. Breast cancer produce IL1, IL6, LIF, prostaglandin
E2, TNFα and these factors are known to increase RANKL expression on osteoblasts and

Review of literature
52
activate them [187]. Most importantly, breast cancer cells produce PTHrP, which plays pivotal
role in bone metastasis and increase in osteoclastogenesis [188]. PTHrP positive breast cancer
patients are more likely to develop bone metastases [113] and is considered as a good prognostic
factor [189]. PTHrP has even been proposed as a potent antigen for cancer immunotherapy in
many cancers [190,191]. PTHrP is secreted by breast and prostate cancer cells and functions like
Ca+ regulating hormone PTH [192]. PTHrP plays crucial role in metastasis of breast cancer cells,
as reports suggest that PTHrP produced by breast cancer cells can induce generation of
osteoclasts in bone marrow cultures with osteoblast in the absence of vitamin D3, PGE2 or IL11
[193,194]. PTHrP secreted by breast cancer cells act in autocrine and paracrine manner on
osteoblasts [195], induce RANKL expression in osteoblasts (with reduction in OPG expression)
[195,196] and stromal cells [113]. RANKL is essential for survival and differentiation of
osteoclasts [197]. RANKL induces expression of factors involved in migration, invasion and
angiogenesis like matrix metalloproteinases 1 and 9, matrix metalloproteinase inducer
EMMPRIN/CD147, intercellular adhesion molecule-1 (ICAM-1), interleukin 6 and 8 and
vascular endothelial growth factor. RANKL also enhances breast cancer-induced osteolytic
lesions through upregulation of extracellular matrix metalloproteinase inducer/CD147, while
suppresses expression of metastasis suppressor serpin 5b/maspin [198]. TGF-β is a potent
stimulator of PTHrP production. It stabilizes PTHrP mRNA during and post transcription
[199,200]. Also, breast cancer cells express higher levels of PTHrP at bone metastatic site (92%)
compared to primary tumor site (50%) / non-bone metastasis (17%) [113]. Metastatic tumor cells
interact with both osteoclast and osteoblasts and alter the process of bone remodeling. Metastatic
breast tumor cells induce osteoblasts to release osteoclastogenesis enhancing factors such as
RANKL, monocyte chemoattractant protein-1, IL6 and cyclooxygenase 2 [201,202,203]. IL6, a
Review of literature
53
proinflammatory cytokine, works synergistically with PTHrP to enhance bone resorption [204].
In turn, tumor cells get nourishment through factors like IGFI and II, TGFβ and bone
morphogenic proteins, which are embedded in bone otherwise and are released upon bone
resorption by osteoclasts [205,206]. These cancer cells further support and enhance
osteoclastogenesis, creating a vicious cycle. Thus osteoclastogenesis-directed therapy has proven
to be a potential therapy to reduce osteolysis and inhibit tumor growth at metastatic sites [207].
Drugs inhibiting MCSF receptor signaling through cFms in osteoclasts have been found to
suppress bone metastasis in breast cancer [208]. Denusumab (anti RANKL mAb) therapy was
found effective in bone metastatic breast cancer patients [209,210,211]. Aminobisphosphonates
are also potent antiresorptive drugs which are used for the treatment of patients with skeletal
disorders and metastasis associated skeletal disorders.
2.7) Aminobisphosphonates
Bisphosphonates (BPs) are synthetic analogues of the naturally occurring pyrophosphate
molecule (PPi) but have a greater stability than PPi and are resistant to enzymatic hydrolysis.
Two side chains (R1 and R2) are covalently bound to the carbon atom of the common P–C–P
structure [52]. This common backbone and R1 chain allow BPs to bind to bone minerals such as
calcium, whereas the R2 chain determines the potency of the drug. Depending on R2 group,
bisphosphonates are categorized into two groups- non-nitrogen containing and nitrogen
containing bisphosphonates. 1st generation bisphosphonate (etidronate, clodronate or tiludronate)
are non-nitrogen containing bisphosphonates and inhibit essential ATP-dependent intracellular
enzymes which leads to an intracellular accumulation of cytotoxic ATP-analogues. 2nd
and 3rd
generation bisphosphonates contain nitrogen containing group at R2 side chain and are known as

Review of literature
54
Figure 6: Mechanism of aminobisphosphonates action
aminobisphosphonates
(pamidronate, risedronate,
alendronate, minodronate,
ibandronate and Zoledronate). As
shown in Figure 6,
aminobisphosphonates inhibit a
key enzyme in the mevalonate
pathway known as farnesyl
pyrophosphate synthase (FPPS)
and thus inhibits generation of
farnesyl pyrophosphates and
geranylgeranyl pyrophosphate.
Several intermediates in this
pathway including farnesyl
pyrophosphate and
geranylgeranylpyrophosphate are
required for the post translational modification (i.e. prenylation) of guanosine triphosphate
binding proteins such as Ras, Rho, and Rac. These signaling molecules are involved in the
regulation of cell proliferation, cell survival and cytoskeletal organization [212,213].
Zoledronate, the most potent 3rd
generation aminobisphosphonate, is the only bisphosphonate
currently approved for the prevention and treatment of skeletal complications in patients with
bone metastases due to all solid tumor [214]. Zoledronate have attraction for elemental calcium,
thus get targeted to bone surface and are actively resorbed by osteoclasts [53,215], resulting in
Review of literature
55
their apoptosis [216]. Zoledronate does not affect the differentiation of osteoblasts [217]. Apart
from inhibiting mevalonate pathway, Zoledronate have been shown to inhibit angiogenesis
(endothelial cell proliferation, adhesion and capillary formation), decrease tumor cell adhesion to
bone, inhibit tumor cells proliferation, induce apoptosis and also acts as an immunomodulator
[218]. Inhibition of FPPS enzyme by aminobisphosphonates (Zoledronate) causes accumulation
of IPP, which acts as an antigen for γδ T cells. Proteomic approaches are being used to decipher
the effect of bisphosphonates on functional subunits (proteins) of tumor cells [219,220]. In
hepatocellular carcinoma cell line, Alendronate treatment upregulated HSP90 expression [219].
In an another study, expression of Fas and Fas associated protein death domain (FADD) was
found to be upregulated upon Alendronate treatment on hepatocellular carcinoma cells line
[221]. Target cells receive extrinsic apoptosis signals through Fas and FADD [222].
2.8) γδ T cells
γδ T cells represent the minor subset of peripheral blood representing ~1-10% of
total T cell population in human, but can rise upto 50% in some mucosal sites [223]. They have
different properties compared to conventional αβ T cells (Table 1). Major population of γδ T
cells are present in peripheral blood and express Vγ9Vδ2 TCR (also known as Vγ2Vδ2, 90-
95%), while the subset that resides in mucosal tissues express Vγ9Vδ1 TCR (~10%). γδ T cells
harbor properties of both innate and adaptive immune cells. γδ T cells are typical Th1 type cells
but like αβ T cells, are highly plastic and can differentiate into different subsets like Th2, Th17,
T-follicular helper and T-regulatory cells under different conditions [13]. This explains their
capacity to influence the nature of immune responses in different challenges (Table 2).

Review of literature
56
[Kalyan et al (2013), Cellular and molecular immunology, 10:21-29]
[Caccamo et al (2013), Cellular and molecular immunology, 10: 30-34]
Table 1: Major differences between αβ and γδ T cells
Feature αβ T cells γδ T cells
Frequency in blood 65%–75% of PBMC <10% of PBMC (25%–60% gut)
MHC restriction CD4
+: MHC class II
CD8+: MHC class I
No MHC restriction
Possible roles of CD1 and MICA/B
CD4/CD8 expression
• ∼60% CD4+; ∼30% CD8
+
<1% double positive;
<1% double negative;
Majority (>70) double negative; <1%
CD4+; ∼30% CD8
+αα (as
intraepithelial lymphocytes in gut)
Antigen recognition Processed peptide/MHC Unprocessed, not peptides
TCR V gene germ
line repertoire Large Small
TCR diversity Very diverse
Relatively restricted expression
despite high potential for junctional
diversity; expression variance
dictated by tissue localization
Function Adaptive immunity Immune regulation, surveillance and
homeostasis
Table 2: Phenotypical heterogeneity and functional package organization of human γδ T
cells
Subset γδ1 γδ2 γδ17 γδ22 γδFH γδreg
Polarizing
cytokine IL-12 IL-4
IL-1-β, IL-6,
IL-23, TGF-β ? IL-21
IL-15, TGF-
β
Transcription
factor T-bet, Eomes GATA-3 RORC, AHR ? Bcl-6 Foxp3?
Homing
receptors CXCR3, CCR5 ? CCR6 ? CXCR5 ?
Effector
molecules TNF-α, IFN-γ IL-4 IL-17 IL-22 IL-4, IL-10 ?
Target cells Macrophages,
Dendritic cells ?
Neutrophils,
Epithelial cells ? B cells T cells
Function Intracellular
bacteria ?
Extracellular
bacteria ?
Antibody
production Regulation

Review of literature
57
γδ T cells possess unique properties with respect to antigen recognition, tissue
tropism, MHC-independent antigen recognition and antitumor response. Unlike αβ T cells, γδ T
cells do not require major histocompatibility complex (MHC) class I and II for antigen
recognition [12]. γδ T cells do not require antigen to be processed and recognize whole antigen
[224]. γδ T cells directly recognize the antigens through TCR. The unique antigens recognized
by γδ T cells include small phosphoantigens such as isopentenyl pyrophosphate (IPP) and (E)-4-
Hydroxy-3-methyl-but-2-enyl pyrophosphate (HMBPP), phospholipids, heat shock proteins,
alkylamines and aminobisphosphonates [11,74]. IPP is a non-proteinatious molecule and an
intermediate molecule in eukaryotic mevalonate/ cholesterol pathway. HMBPP is an
intermediate molecule in bacterial non- mevalonate/ rohmer pathway. Synthetic analog of IPP
[bromohydrin pyrophosphate (BrHPP)] and HMBPP (picostim) also stimulates γδ T cells.
Alkylamines are naturally occurring plant and bacterial products and function in a similar
manner to aminobisphosphonates [225]. Activation of γδ T cells through aminobisphosphonates
need antigen presenting cells. Aminobisphosphonate treated tumor cells upregulate IPP levels,
which recruits γδ T cells by chemotaxis and activates γδ T cells. γδ T cells also recognize
transformed tumor cells by upregulation of self heat shock proteins. γδ T cells recognize stressed
cells/ tumor cells / virus infected cells through NKG2D, which binds to non-classical MHC
molecule of MHC class I chain related molecule (MICA) and UL16 binding proteins (ULBPs)
on affected cells [226,227,228]. ULBPs are expressed on leukemia, lymphoma, ovarian and
colon carcinomas [229,230]. γδ T cells also get activated by mitochondrial protein ATP
synthase/ F1ATPase , which shows structural similarity to IPP. Binding of MICA to NKG2D
activates γδ T cells, which upregulates expression of CD25 and release of cytolytic granules
(granzyme and perforin), TNFα and IFNγ [227]. γδ T cells can kill stressed or transformed cells

Review of literature
58
through engagement of death inducing receptors, such as CD95 (Fas) and TNF-related apoptosis
inducing ligand receptor (TRAILR) and release of cytolytic granules granzyme and perforin
[231,232]. Crosstalk between γδ T cells and dendritic cells (DCs) induced maturation of DCs,
which further induce proliferation and polarization of αβ T cells and promote B cell responses
and antibody switching [233].
γδ T cells mediate immune responses against bacteria, viruses and tumor cells [14]. γδ T
cells recognize pathogen associated molecular patters (PAMPS) and elicit a strong immune
responses in salmonellosis, brucellosis, legionellosis, tularemia and listeriolisis [234,235]. In
Mycobacterium tuberculosis infections, a rapid expansion and activation of γδ T cells is noted
[236]. γδ T cells initiate effective adaptive immune responses through processing and presenting
influenza virus derived peptides to CD4+ and CD8
+ T cells [237]. γδ T cells have been reported
to kill different types of tumor cells in vivo and in vitro, which include breast cancer, bladder
cancer, glioblastoma multiforme, neuroblastoma, carcinoma, hematological malignancies and
multiple myeloma [70,238,239,240]. Apart from its direct cytotoxic activity, γδ T cells secrete
proinflammatory cytokines (TNFα, IFNγ and IL17), which clear the bacterial infections [235].
Potent antitumor activity and broad reactivity of γδ towards different types of cancer cells
has generated great interest for their use as immunotherapy [241]. γδ T cell-based
immunotherapy are currently focusing on two main approaches: (a) adoptive transfer of ex
vivo activated and expanded γδ T cells, and (b) in vivo activation of γδ T cells using therapeutic
agents, such as IL-2, bisphosphonates or tumor-directed monoclonal antibodies (e.g. rituximab
and trastuzumab) specifically aimed at the recruitment and expansion of γδ T cells [242].
Clinical trials involving the adoptive transfer of autologous, ex vivo–expanded γδ T cells into
cancer patients has found to be effective [243]. Activated γδ T cells in cancer patients had given

Review of literature
59
positive outcome [244,245,246]. Use of γδ T cell as a vaccine for cancer immunotherapy is
considered as a new approach, where tumor antigen loaded γδ T cells will interact with
endogenous, tumor-specific αβ T cells in secondary lymphoid tissues [247].

Review of literature
60

Materials and methods
61
Chapter 3
Materials and methods

Materials and methods
62

Materials and methods
63
3.1) Culture medium
Powdered RPMI-1640 medium (Invitrogen Life-Technologies, Grand Island, N.Y), Dulbecco’s
Minimum essential medium (Invitrogen Life-Technologies, Grand Island, N.Y) or minimum
essential medium with alpha modification (Sigma Aldrich, USA) was dissolved in deionized
water and as per manufacturer’s instructions, was supplemented with 2.8gram sodium
bicarbonate (Sarabhai Chemicals, India). The medium was sterilized by membrane filtration
(0.45mM, Millipore Co, USA). To prepare complete medium, plain RPMI/ IMDM/ αMEM was
supplemented with 10% heat inactivated human AB serum or fetal calf serum (FCS, Invitrogen
Life Technologies, USA), penicillin (100 IU/ml; Alembic Chemicals India), streptomycin (100
mg/ml; Alembic chemicals India), mycostatin (5 mg/ml, Sigma, USA), gentamycin (40mg/ml;
Schering Corporation, India), L-Glutamine (2mM, Hi Media, India) and β-mercaptoethanol (105;
Sigma USA).
3.2 Preparation of buffers
3.2.1) Normal Saline (NS)
0.85 gram sodium chloride (NaCl) was dissolved in 100 ml of deionized water and sterilized by
autoclaving and was stored at 4ºC.
3.2.2) L-Glutamine
3 grams of L-glutamine was dissolved in 100ml NS. It was autoclaved and was stored at 0oC.
3.2.3) PSGM
106 units of penicillin (against gram positive bacteria), 1gram of streptomycin (against gram
negative bacteria), 5ml of gentamycin (against gram positive and gram negative bacteria) and

Materials and methods
64
1ml of prepared stock of mycostatin (antifungal) were added in 400 ml of sterile NS, were
aliquoted in sterile 100 ml glass bottles and were stored at -20o C in deep freezer.
3.2.4) Thioglycolate broth (Sterility medium)
14.9 grams of thioglycolate powder was dissolved in 500ml of deionized water completely. The
solution was boiled till color turned yellow and was then poured (8ml/tube) in sterile glass tube
containing a pinch of calcium carbonate. It was autoclaved at 121oC for 18 min at 15psi.
3.2.5) Ficoll-Hypaque
24 parts of 9% Ficoll 400 (Sigma Aldrich, USA) + 10 parts 33.3% sodium diatrizoate (Sigma
Aldrich, USA) were mixed together and specific gravity was adjusted to 1.077 ± 0.001.
3.2.6) Trypan blue
0.4 gram Trypan Blue powder (Fluke AG, Buchs SG, Switzerland) was dissolved in 100ml NS
and was mixed thoroughly. To this, 0.01gram thiomersal was added, mixed well and was filtered
by whatmann filter paper no.1. It was aliquoted and stored at 4oC.
3.2.7) 10X Phosphate Buffered Saline (PBS, pH 7.5)
Solution A: 0.2M NaH2PO4.2H2O: 5.616 gram NaH2PO4.2H2O was dissolved in 180ml
deionized water.
Solution B: 0.2M Na2HPO4.2H20: 32.03 gram Na2HPO4.2H2O was dissolved in 900ml
deionized water.
160 ml Solution A and 840ml Solution B was mixed properly and pH was adjusted to 7.5. To
this, 170 grams NaCl was added, dissolved properly and volume was made up to 2000 ml. The
solution was stored at 4oC.

Materials and methods
65
3.2.8) MACS Buffer
5 gram BSA was added to 2mM EDTA containing 1000 ml 1X PBS (pH 7.5). It was
deoxygenated; filter sterilized and was stored at -20 till use.
3.2.9) Trypsin – EDTA
3 grams trypsin (Sigma Aldrich, USA) was dissolved in 100ml 1X PBS and it was filter
sterilized. 0.02 gram EDTA (MP Biomedical) was dissolved in 100 ml 1X PBS and sterilized by
autoclaving. The working solution was prepared by mixing Trypsin: EDTA (1:9, V/V).
3.2.10) FACS Buffer
2 ml fetal calf serum and 0.02 gram sodium azide (NaN3, Sigma Aldrich, USA) was added to
98ml 1X PBS (pH 7.5).
3.2.11) 1% Paraformaldehyde
1 gram paraformaldehyde (Sigma, USA) was dissolved in 70 ml 1X PBS by heating the solution
in a microwave till it was dissolved completely. Final volume was made up to 100 ml and after
cooling, solution was stored at 4oC.
3.2.12) Saponin Buffer
2ml FCS, 0.02 gram sodium azide (NaN3, Sigma Aldrich, USA) and 0.1% saponin (Reagent
grade, Amersham Life science) was added to 98 ml 1X PBS (pH 7.5).

Materials and methods
66
3.3) Maintenance of cell lines
The following cell lines were used-
S.No. Cell line Origin, (Cell type) Characteristic
features Type Medium
1 MCF 7 Breast Cancer, (epithelial) ER+PR
+/-HER2
- Adherent RPMI
2 MDAMB 231 Breast Cancer, (epithelial) ER-PR
-HER2
- Adherent DMEM
3 PC3 Prostate Cancer, (epithelial) - Adherent RPMI
4 HeLa Cervical Cancer, (epithelial) - Adherent DMEM
5 Jurkat Acute T cell Leukemia,
(T-lymphocyte) - Suspension RPMI
6 THP 1 Acute monocytic Leukemia
(Monocyte) - Suspension RPMI
7 Raw 264.7 Mouse macrophage,(Monocyte) - Adherent αMEM
(Note: All the complete culture medium were supplemented with 10% FCS)
3.3.1) Revival of the cell lines
The frozen cells, stored in liquid nitrogen (-196˚C) were received on ice and were thawed
immediately vial by gentle agitation in a water bath at 37°C. Thawed cells were collected and
thoroughly washed twice with plain medium to remove DMSO (toxic to cells).
3.3.2) Maintenance and subculturing of cell lines
Upon revival, the cells were washed twice with plain medium and were suspended in complete
medium (1x10⁶ cells/ 5 ml). These cells were cultured in sterile 25mm
2 culture flasks (Nunc,
Denmark) at 37˚C in 5% CO2 incubator. Adherent cells, upon attaining 70-80% confluency,
were trypsinized using 0.3% trypsin prepared in 0.02% EDTA. The cells were collected,
washed twice with plain medium and then sub cultured (0.3.-0.5x10⁶ cell/ 5ml) in 25mm
2 tissue
culture flask. In case of suspension cultures, upon confluency, single cell suspension was
prepared by mixing the cells properly using pasture pipette and cells were sub cultured.

Materials and methods
67
3.3.3) Freezing of cell lines
Adherent cells (collected by trypsinization) or non-adherent cells (suspension cultures) were
washed twice with plain medium and pelleted by centrifugation at 400g (1200rpm) for 10 min
at room temperature. Chilled freezing solution (FCS: DMSO =9:1)) was added (2x10⁶ cells/ml)
drop by drop with constant mixing to the pellet. 2-3 x10⁶ cells/ml of freezing mixture were
transferred to cryovials (Nunc, Denmark) and were frozen in liquid nitrogen (-196˚C).
(DMSO: Dimethyl Sulphoxide, MP Biomedicals, India)
3.4) Antibodies and recombinant proteins
3.4.1) Conjugated/ Labeled Antibodies
S.No. Name of the Antibody Company
1 Mouse- Anti Human CD3-FITC B.D.Pharmingen, USA
2 Mouse- Anti Human CD3-Phycoerithin B.D.Pharmingen, USA
3 Mouse- Anti Human CD3-PECF 594 B.D.Pharmingen, USA
4 Mouse- Anti Human CD3-Pascific Blue B.D.Pharmingen, USA
5 Mouse- Anti Human CD3-PeCy7 B.D.Pharmingen, USA
6 Mouse- Anti Human CD3-PerCP B.D.Pharmingen, USA
7 Mouse- Anti Human CD3-APC Cy7 B.D.Pharmingen, USA
8 Mouse- Anti Human CD4-APC B.D.Pharmingen, USA
9 Mouse- Anti Human CD4-PECF 594 B.D.Pharmingen, USA
10 Mouse- Anti Human CD4-Alexafluor700 B.D.Pharmingen, USA
11 Mouse- Anti Human CD8-Pascific Blue B.D.Pharmingen, USA
12 Mouse- Anti Human CD11b-AF488 B.D.Pharmingen, USA
13 Mouse- Anti Human CD14-FITC B.D.Pharmingen, USA
14 Mouse- Anti Human IL17-AF488 B.D.Pharmingen, USA
15 Mouse- Anti Human CD19-PE B.D.Pharmingen, USA
16 Mouse- Anti Human CD25-PE B.D.Pharmingen, USA
17 Mouse- Anti Human CD25-PeCy5 B.D.Pharmingen, USA
18 Mouse- Anti Human CD25-PeCy7 B.D.Pharmingen, USA
19 Mouse- Anti Human CD27-APC B.D.Pharmingen, USA
20 Mouse- Anti Human CD27-AF700 B.D.Pharmingen, USA
21 Mouse- Anti Human CD45RA-PeCy5 B.D.Pharmingen, USA
22 Mouse- Anti Human CD45RO-PeCy7 B.D.Pharmingen, USA
23 Mouse- Anti Human CD51/61-AF488 Biolegend, USA
24 Mouse- Anti Human CD54-PB (ICAM1) Biolegend, USA
25 Mouse- Anti Human CD56-PE B.D.Pharmingen, USA

Materials and methods
68
26 Mouse- Anti Human CD62L-APC (LECAM-1) B.D.Pharmingen, USA
27 Mouse- Anti Human CD69-FITC B.D.Pharmingen, USA
28 Mouse- Anti Human CD127-AF647 (IL-7R) B.D.Pharmingen, USA
29 Mouse- Anti Human CD178-PE (FasL) Biolegend, USA
30 Mouse- Anti Human CD254-PE (RANKL) B.D.Pharmingen, USA
31 Mouse- Anti Human CD314-PE (NKG2D) Biolegend, USA
32 Mouse- Anti Human CD314-APC (NKG2D) Milteney Biotech, Germany
33 Mouse- Anti Human αβ-PE B.D.Pharmingen, USA
34 Mouse- Anti Human γδ-FITC B.D.Pharmingen, USA
35 Mouse- Anti Human γδ-PE B.D.Pharmingen, USA
36 Mouse- Anti Human γδ-APC B.D.Pharmingen, USA
37 Mouse- Anti Human Vδ1-FITC Thermo Scientific USA
38 Mouse- Anti Human Vδ2-PE B.D.Pharmingen, USA
39 Mouse- Anti Human Vγ9-PE B.D.Pharmingen, USA
40 Mouse- Anti Human MICA-APC R & D Systems, USA
41 Mouse- Anti Human FOXP3-AF488 B.D.Pharmingen, USA
42 Mouse- Anti Human IFNγ-PECy7 B.D.Pharmingen, USA
43 Mouse- Anti Human HSP 60-AF647 B.D.Pharmingen, USA
44 Mouse- Anti Human HSP 70-PE Santacruz biotechnologies,
USA
45 Mouse- Anti Human HLADR-PE B.D.Pharmingen, USA
46 Mouse- Anti Human Annexin-FITC B.D.Pharmingen, USA
47 Goat anti mouse-FITC Sigma Aldrich, USA
48 Goat anti mouse-PE Sigma Aldrich, USA
49 Phalloidin-TRITC (Phalloidin-Tetramethyl
rhodamine B isothiocyanate) Sigma Aldrich, USA
3.4.2) Purified Antibodies
S.No. Name of the Antibody Company
1 Mouse- Anti Human HSP60 Santa Cruz Biotechnology, USA
2 Mouse- Anti Human HSP70 B.D.Pharmingen, USA
3 Mouse- Anti Human HSP90 B.D.Pharmingen, USA
4 Goat- Anti Human α Tubulin Abcam, USA
5 Mouse- Anti Human Keratin 8 Sigma, USA
6 Rabbit- Anti Human EGFR Cell Signaling, USA
7 Mouse- Anti Human β-Actin Sigma Aldrich, USA
8 Goat anti mouse-HRPO Sigma Aldrich, USA
9 Goat anti rabbit-HRPO Cell Signaling, USA
10 Mouse- Anti human CD3 BD Biosciences USA
11 Mouse- Anti human CD28 BD Biosciences, USA
12 Mouse- Anti Human IFNγ B.D.Pharmingen, USA
13 Mouse- Anti human IL6 R & D Systems, USA
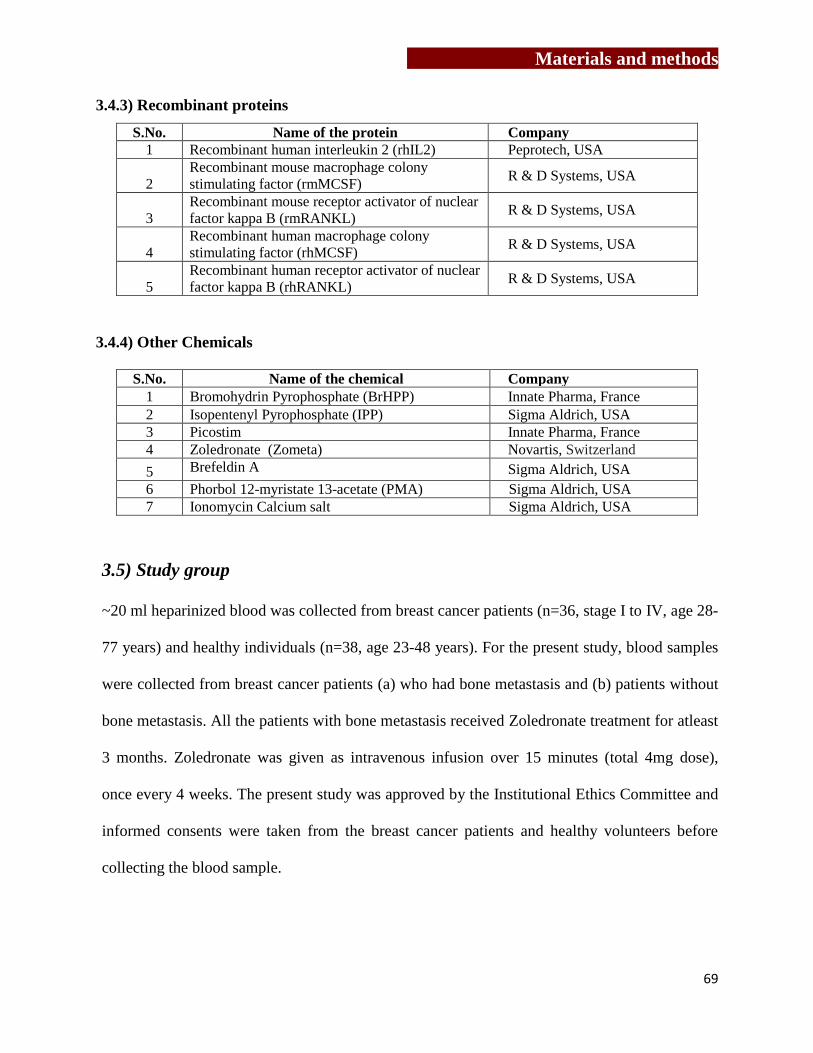
Materials and methods
69
3.4.3) Recombinant proteins
S.No. Name of the protein Company
1 Recombinant human interleukin 2 (rhIL2) Peprotech, USA
2
Recombinant mouse macrophage colony
stimulating factor (rmMCSF) R & D Systems, USA
3
Recombinant mouse receptor activator of nuclear
factor kappa B (rmRANKL) R & D Systems, USA
4
Recombinant human macrophage colony
stimulating factor (rhMCSF) R & D Systems, USA
5
Recombinant human receptor activator of nuclear
factor kappa B (rhRANKL) R & D Systems, USA
3.4.4) Other Chemicals
S.No. Name of the chemical Company
1 Bromohydrin Pyrophosphate (BrHPP) Innate Pharma, France
2 Isopentenyl Pyrophosphate (IPP) Sigma Aldrich, USA
3 Picostim Innate Pharma, France
4 Zoledronate (Zometa) Novartis, Switzerland
5 Brefeldin A Sigma Aldrich, USA
6 Phorbol 12-myristate 13-acetate (PMA) Sigma Aldrich, USA
7 Ionomycin Calcium salt Sigma Aldrich, USA
3.5) Study group
~20 ml heparinized blood was collected from breast cancer patients (n=36, stage I to IV, age 28-
77 years) and healthy individuals (n=38, age 23-48 years). For the present study, blood samples
were collected from breast cancer patients (a) who had bone metastasis and (b) patients without
bone metastasis. All the patients with bone metastasis received Zoledronate treatment for atleast
3 months. Zoledronate was given as intravenous infusion over 15 minutes (total 4mg dose),
once every 4 weeks. The present study was approved by the Institutional Ethics Committee and
informed consents were taken from the breast cancer patients and healthy volunteers before
collecting the blood sample.

Materials and methods
70
3.6) Cell separation techniques
3.6.1) Separation of peripheral blood mononuclear cell
Peripheral blood mononuclear cells (PBMCs) were separated from heparinized peripheral blood
of healthy individuals or breast cancer patients by ficoll-hypaque density gradient centrifugation.
In brief, peripheral blood from healthy individuals or breast cancer patients was collected in
heparin (Sigma, USA; 100IU/ml) or EDTA containing vacutainers. The blood was diluted with
equal quantity of normal saline. 7-8 ml of diluted blood was loaded on 2.5ml Ficoll-Hypaque and
centrifuged at 500g (1500 rpm) for 20 min at RT using a swing-out rotor in Beckman centrifuge.
Buffy coat (PBMCs) was collected from interface between ficoll-hypaque and blood plasma.
PBMCs were washed twice with normal saline at 400g (1200rpm) 10 min at RT. Viability of the
cells was checked by trypan blue dye exclusion method.
3.6.2) Enrichment and purification of γδ T cells from PBMCs of healthy individuals and
breast cancer patient
3.6.2.1) Enrichment of γδ T cells using αCD3/CD28/rhIL2
PBMCs were separated from heparinized peripheral blood of healthy individuals and breast
cancer patients as described above. 25mm2 tissue culture flasks were precoated with solid phase
αCD3mAb (1μg/ml) for 2 hrs at 37˚C or overnight at 4˚C, thoroughly washed with normal
saline. PBMCs (10x106
cells) were suspended in 10ml cRPMI (10% heat inactivated human AB
serum and antibiotics) supplemented with rhIL2 (100 IU/ml) and αCD28 (1μg/ml) and 5x10⁶
cells were seeded in pre-coated flask. For 4 days, the cells were fed with 1ml fresh cRPMI
supplemented with rhIL2 (500 IU/ml), after replacement of 1 ml used medium. On 5th
day, the
cells were transferred to 75mm2
culture flask, making final volume 10ml. The cells were
expanded using rhIL2 (100 IU/ml) for 12 days with intermediate subculture after every 2-3 days.
Materials and methods
71
3.6.2.2) Immunomagnetic separation of γδ T cells from PBMCs
γδ T cells were positively separated from freshly isolated PBMCs or αCD3-CD28/rhIL2
expanded PBMCs using TCR-γδ Microbead Kit (Milteney Biotech, Germany, Cat No.130-050-
701). For which, expanded PBMCs (10x106
cells) were washed twice with normal saline and
were suspended in 40μl MACS buffer [degassed PBS containing 0.5 % BSA (Sigma A7030) and
2mM EDTA]. The cells were incubated with 10μl TCR-γδ hapten mAb for 10 min at 4˚C,
followed by addition of 30μl MACS buffer. The cells were subsequently incubated with 20μl
anti hapten–FITC microbeads for 15 min at 4˚C. Labeled cells were then washed with 5-8 ml
MACS buffer at 400g for 10 min to remove excess/unbound antibody. Pelleted cells were
resuspended in 500μl MACS buffer. MACS column [capacity of columns-MS: 10x106 cells
(Milteney Biotech,Germany), LS (Milteney Biotech, Germany)] was placed in magnetic field of
MACS separator and was pre-wet thrice with 1500μl MACS buffer (500µl each time). The
labeled cells were then loaded on to pre-wet column (placed in magnetic field) and the column
was repeatedly washed with MACS buffer to remove unlabeled cells (negative population).
Further, the column was removed from the MACS separator (magnetic field) and labeled cells
(γδ-TCR positive population) were collected in separate tube by flushing them out of the column
using MACS buffer. The purity of the sorted cells (γδ TCR-FITC) was analyzed by flow
cytometry and cells having >95% purity were used for experiments. Sorted cells were rested
overnight before using them for any experiment.
3.6.2.4) Collection of cell free supernatant of γδ T cells
Cytokine profile of γδ T cells stimulated with rhIL2, BrHPP+rhIL2, αCD3/CD28+rhIL2 and
Zoledronate+rhIL2 were analyzed by cytometric bead array (CBA). γδ T cells (1x10⁶) were
stimulated with rhIL2 (2.5 IU), BrHPP (200nM) +rhIL2, αCD3/CD28 (1μg/ml) +rhIL2 (2.5 IU)
Materials and methods
72
for 24 hrs at 37˚C in 5% CO2 incubator in 24 well plate. To stimulate γδ T cells with
Zoledronate, monocytes (antigen presenting cells) were separated from PBMCs by allowing
them to adhere for to plate bottom 2 hrs. Adhered monocytes were treated with Zoledronate
(100μM) for 16-18 hrs. After 16-18 hrs, monocytes were washed with pRPMI and γδ T cells
were incubated with Zoledronate treated monocytes for 24 hrs. As control, γδ T cells were
incubated with medium alone (unstimulated) for 24 hrs. After 24 hrs, cell free supernatants of
unstimulated (control) and antigen stimulated γδ T cells were collated and stored at -80˚C till
use.
3.6.2.5) Immunomagnetic separation of CD14+ cells from PBMCs
CD14+ cells were separated from PBMCs by positive selection method using CD14
+ cell
separation kit (Milteney Biotech, Germany). PBMCs (~100-200x106) were suspended in 80μl
MACS buffer and were labeled with bead conjugated anti-CD14+ antibody (20μl/test) for 15 min
at 4˚C. The cells were subsequently washed with MACS buffer and passed though magnetic
column (as described above). CD14+
cells were later separated from column by plunging MACS
buffer through the column. Purity of separated cells was analyzed using flow cytometry.
Separated cells having >95% purity were further used for experiments.
3.7) Generation and characterization of mouse and human osteoclasts
3.7.1) Chemicals preparation
i) Reconstitution of rmMCSF, rmRANKL:
Recombinant mouse macrophage colony stimulating factor (10μg) and recombinant mouse
receptor activator of nuclear factor kappa B (10μg) were stored at -20˚C. rmMCSF and
rmRANKL were reconstituted in sterile 1X PBS (pH 7.5) containing 0.1% BSA (bovine serum
Materials and methods
73
albumin) at concentration of 10ng/μl. Similarly, reconstituted rmMCSF and rmRANKL
(500ng/50μl) were stored at -80˚C. As per the required concentration, the recombinant proteins
were diluted with 1X PBS/ complete medium.
ii) Reconstitution of rhMCSF and rhRANKL/rhTRANCE:
RhMCSF (5μg) and rhRANKL/ rhTRANCE (TNF-related activation-induced cytokines, 10μg),
stored at -20˚C, were reconstituted in sterile 1X PBS (pH 7.5) containing 0.1% BSA at
concentration of 10ng/μl. Similarly, reconstituted rhMCSF and rhRANKL (500ng/50μl) were
stored at -80˚C. As per the required concentration, the recombinant proteins were diluted in 1X
PBS.
iii) Preparation of complete Modified Essential Medium with alpha modification medium
(cαMEM):
100ml cαMEM was prepared by supplementing pαMEM (Sigma, USA) with 10% inactivated
fetal calf serum, antibiotics (penicillin, streptomycin, mycostatin, gentamycin), L-Glutamine and
β-mercaptoethanol.
3.7.2) Neutral red pinocytosis assay using RAW 264.7 cell line:
RAW264.7, mouse macrophage cell line, is characterized by neutral red pinocytosis assay.
RAW264.7 cells at different cell densities (3x10³, 5x10
3, 1x10
4, 5x10
4 per 200μl) were allowed
to adhere in 96 well flat bottom plate for 2 hrs, followed by stimulation with (1μg/ml) bacterial
lipopolysaccharide (Sigma, USA) for 48 hrs. Bacterial lipopolysaccharide induces transcription
of several genes encoding proinflammatory mediators of immune responses. Further, these
stimulated cells were incubated with 100μl neutral red (0.075% prepared in 1X PBS) for 2 hrs.
After 2 hrs, supernatant was discarded, cells were washed with 1X PBS and were further
incubated with 100μl cell lysis solution (ethanol: 0.01% acetic acid=1:1) for 2 hrs. Optical

Materials and methods
74
density (OD) of neutral red upon cell lysis was analyzed at 570nm. ODs of medium alone, cells
alone and medium+ neutral red were used as experimental control. The data is expressed as
optical density observed at 570nm.
3.7.3) Generation of mouse osteoclasts from RAW264.7 cells
RAW264.7 cells (mouse macrophage cell line) were used to generate mouse osteoclasts [248].
RAW264.7 cells (3x10³) were cultured in cαMEM supplemented with rmRANKL (100ng/ml)
for 7 days with intermediate feeding on every 3rd
day. On 8th
day, cultures were terminated and
cells were stained for TRAP (tartarate resistant acid phosphatase) using Leukocyte Acid
Phosphatase kit (Sigma-Aldrich, USA) as per the kit instructions. Multinucleated (>3 nuclei),
TRAP positive cells were considered as mature osteoclasts.
3.7.4) Characterization of osteoclasts by tartarate resistant acid phosphatase (TRAP)
staining
Mature osteoclasts were characterized by staining them for TRAP as per the kit instructions
(Acid phosphatase, Leukocyte kit, Sigma). Osteoclasts were fixed in fixative solution (2.5ml
citrate+6.5ml acetone+0.8ml 37% formaldehyde) for 30 sec. Fixed cells were repeatedly washed
with pre-warmed deionized water (37˚C) and were subsequently stained for acid phosphatase
using sodium tartarate, fast Garnet GBC and napthol AS-BI phosphate as a substrate for 1 hr in
dark. After 1hr, cells were repeatedly washed with deionized water (37˚C) to remove excess
stain. Coverslips were air dried, mounted on glass slide and cells were imaged using upright
microscope (Axioimager Z1.1, Zeiss). Images were analyzed using Axiovision software (version
4.6, Zeiss). Multinucleated (>3 nuclei) TRAP-positive cells were considered as mature
osteoclasts.
Materials and methods
75
3.7.5) Generation of mouse osteoclasts from bone marrow osteoclast precursor cells
(BMOCPs)
6-8 week old Swiss CRL or C57BL6 mice were anesthetized using chloroform (Merck) and were
sacrificed by cervical dislocation. Bone marrow cells were collected by flushing the femurs with
pαMEM using 26 gauze needle. Collected bone marrow cells were washed (400g, 10 min, RT)
and were cultured in cαMEM (30x106 cells/5ml) supplemented with rmMCSF (10ng/ml) for 24
hrs [to induce osteoclast precursor cells (OCPs) and to remove adherent stromal cells]. After 24
hrs, nonadherent OCPs were collected, washed and cultured for 7 days in cαMEM (1x10⁵
/200μl)
supplemented with rmMCSF (30ng/ml) and rmRANKL (30ng/ml) on sterile thermanox coverslip
(Nunc), which were placed in 96 well flat bottom plate). The cells were fed every 3rd
day with
rmMCSF and rmRANKL. On 8th
day, presence of osteoclasts was confirmed by staining them
for TRAP.
3.7.6) Generation and characterization of human Osteoclasts
Human osteoclasts were generated from CD14+
cells (monocytes). CD14+ cells (1X10
5) were
cultured in complete αMEM medium supplemented with 30ng/ml rhMCSF and 40ng/ml
rhRANKL on thermanox coverslips (Nunc, Denmark) in 96 well flat bottom plate. For 21 days,
CD14+ cells were fed every 3
rd day with rhMCSF and rhRANKL [249]. On day 21, mature
multinucleated osteoclasts were characterized by staining them for expression of vitronectin
receptor (αVβ3 integrin) using CD51/61-Alexafluor 488 mAb (IgG1, Biolegend) also known as
23c6 antibody along with nuclear stain DAPI (Sigma, D9542). Multinucleated cells (>3 nuclei)
showing vitronectin receptor (23C6+) or TRAP positivity were considered as mature osteoclasts.
Mature osteoclasts form a characteristic F-actin ring, which was analyzed by staining the

Materials and methods
76
osteoclasts with Phalloidin-TRITC for 30 min at RT in dark. Images were acquired using Zeiss
LCM 510 microscope and were analyzed using LSM Image analyzer software.
3.7.7) CD14+: γδ T cell (1:10) coculture assay
CD14+ cells (1x10
5) were cocultured with unstimulated “activated γδ T cells” (separated from
αCD3/CD28+rhIL2 expanded PBMCs) or “non-activated/ freshly isolated γδ T cells” (separated
directly from PBMCs) were cocultured with γδ T cells (1x10⁴) in cαMEM (200μl) containing
rhMCSF (30ng/ml), rhRANKL (30ng/ml) and rhIL2 (0.5IU), in 96 well plate on day 1. The cells
were incubated in 5% CO2 incubator at 37˚C. As a positive control, osteoclasts were generated
from CD14+ cells in the presence of rhMCSF and rhRANKL only. To analyze the effect of
phosphoantigen stimulated “non-activated γδ T cells/ freshly isolated” on osteoclastogenesis;
BrHPP (200nM) was added to cultures along with rhMCSF and rhRANKL on day 1. As
experimental control, osteoclasts were also generated in the presence of rhIL2 or BrHPP+ rhIL2
along with rhMCSF and rhRANKL. For 21 days, CD14+: γδ T cells (10:1) were fed every 3
rd day
with rhMCSF, rhRANKL and rhIL2. On 21st day, cultures were terminated and total number of
osteoclasts generated per well were quantified by staining them for vitronectin receptor
(CD51/61) using 23c6 mAb or TRAP.
3.7.8) Bone resorption assay
Cell free supernatants from “activated” or “non-activated/ freshly isolated” γδ T cells stimulated
with rhIL2 alone or BrHPP+rhIL2 were collected as described earlier. In brief, “activated” or
“non-activated” γδ T cells (5x10⁴), suspended in cRPMI (200μl) were stimulated with rhIL2
(0.5IU) alone or BrHPP (200nM) + rhIL2 (0.5IU) in round bottom 96 well plate (Nunc) for 24
hrs at 37˚C in 5% CO2 incubator. After 24 hrs, cells free supernatants were collected and were
stored at -80˚C till use. Osteoclasts were generated from CD14+ cells (1x10
5) in the presence of

Materials and methods
77
rhMCSF and rhRANKL for 12 days on Osteoclast Activity Assay Substrate (OAAS, BD
Biosciences, USA). OAAS is a 16 well plate, with thin calcium-phosphate coated wells,
resembling human bone and is used to evaluate functional activity of osteoclasts in vitro. 12th
day onwards, every 3rd
day, the cultures were fed with rhMCSF, rhRANKL and different
volumes of cell free supernatant (50μl and 25μl) of rhIL2 or BrHPP+rhIL2 stimulated
“activated” or “non-activated/freshly isolated” γδ T cells. Osteoclasts generated in the presence
of rhMCSF and rhRANKL only were kept as positive control. Baseline resorption observed on
OAAS plates by macrophages (negative control, cultured in the presence of rhMCSF only) was
also measured. On day 21, the cells were bleached out using bleaching solution (6% sodium
hypochlorite and 5.2% sodium chloride). OAAS plates were air dried and resorption area/ pits
generated by mature osteoclasts were imaged using light microscopy. The resorption area
generated by mature osteoclast was calculated using ImageJ software.
3.7.9) IFNγ/ IL6 neutralization Assay
Effect of IFNγ and IL6 on osteoclastogenesis was analyzed by neutralizing these cytokines in the
cell free supernatants of γδ T cells used for resorption assays. Osteoclasts were generated from
CD14+ cells (1x10
5) in the presence of rhMCSF and rhRANKL for 12 days in OAAS module as
described earlier. From 12th
day onwards, every 3rd
day, the cells were supplemented with
rhMCSF, rhRANKL and cell free supernatant of unstimulated “activated” and “non-activated/
freshly isolated” γδ T cells (50μl), with or without monoclonal mouse antihuman αIFNγ or αIL6
neutralization antibody (10μg/ml) respectively. Osteoclasts generated in the presence of rhMCSF
and rhRANKL were used as positive control. On day 21, the cultures were terminated and
resorption area generated per OAAS well was calculated using ImageJ software.
Materials and methods
78
3.8) Flow cytometry
3.8.1) Single color flow cytometry
3.8.1.1) Purity of immunomagnetically purified γδ T cells
Single color flow cytometry was used to analyze the purity of MACS separated γδ T cells using
FACS Caliber flow cytometer (Becton Dickinson). Cells stained with IgG1-FITC conjugated
antibody was kept as isotype control. Cells were selectively gated for lymphocyte population on
the basis of forward scatter (FSC) and side scatter (SSC) plot. Atleast 10,000 events were
acquired and data was analyzed using FlowJo software (Tree Star, USA).
3.8.1.2) Purity of immunomagnetically purified CD14+ cells
MACS purified CD14+ cells were analyzed for their purity using single color flow cytometry.
CD14+ cells were stained with mouse anti human CD14-FITC mAb and acquired on a FACS
Caliber flow cytometer (Becton Dickinson). CD14+ cells stained with IgG1-FITC conjugated
antibody were used as isotype control. Cells were gated for monocyte population on the basis of
forward scatter (FSC) and side scatter (SSC) plot and data was analyzed using FlowJo software
(Tree Star, USA).
3.8.1.3) Analysis of cell cycle
To study the effect of Zoledronate on cell cycle, MCF7 cells were first arrested in G0 phase by
serum starvation method. In brief, MCF7 cells were allowed to attain 60-70% confluency and
then were serum starved for 72 hrs at 37˚C in 5% CO2 incubator. 50% used culture medium was
replaced every 24 hr with fresh medium to remove dead cells and toxicity due to secreted
metabolites. After 72 hrs, cells were incubated for next 4 hrs with 10% FCS containing cRPMI to
drive the cells to log phase. These cells were then treated with Zoledronate (100μM) or left
untreated for 16-18 hrs. After incubation, cells were washed thoroughly, trypsinized and fixed in

Materials and methods
79
chilled 70% ethanol (1x10⁶cells/ml). Fixed cells were stored at 4˚C for atleast 24 hrs. Effect on
cell cycle of tumor cells was analyzed by staining them with propidium iodide (PI, Sigma
Aldrich,). Briefly, cells were washed twice with 1X PBS for complete removal of ethanol and
were suspended in 500μl 1X PBS. Cells were incubated with RNase A (100μg/ml) and PI
(40μM/ml) for 30 min in dark. Data was analyzed using ModfitLT software (version 2.0).
3.8.2) Multicolor flow cytometry
3.8.2.1. Detection of activation markers on stimulated γδ T cells
Expression of early (CD69) and late activation markers (CD25 and RANKL) on γδ T cells was
analyzed by using multicolor flow. PBMCs were stimulated with rhIL2 (30IU) alone or in
combination with BrHPP (200nM) or Zoledronate (100μM) for 12 days, with intermediate
feedings on every 3rd
day. For baseline expression (control) of activation markers on γδ T cells
was analyzed in untreated PBMCs (day 0). On day 12, the cultures were terminated; cells were
collected, washed with cold 1X PBS and were suspended in FACS buffer [0.01M PBS (pH-7.5),
2% FCS, 0.01% sodium azide]. These cells (1x10⁶ cells) were then stained for markers like anti-
human γδ-APC, anti-human CD69-FITC, anti-human CD25-PECy7 and anti-human RANKL-PE
for 30 min at 4˚C in dark. Anti-human CD3-FITC, anti-human CD3-PE, anti-human CD3-
PECy7 and anti-human CD3-APC monoclonal antibodies were used for compensation. After 30
min, cells were washed with FACS buffer (to remove excess antibody) and were fixed in 1%
cold paraformaldehyde at 4˚C for 15 min in dark. Atleast 50000 events were acquired on FACS
Aria (BD Biosciences, USA) and data was analyzed using FlowJo Software. Lymphocytes were
gated on the basis of their FSC and SSC. Depending on the fluorescence intensity of γδ-APC, γδ
T cells were gated. Further percentages of γδ T cells expressing CD69, CD25 and RANKL
(CD254) were analyzed on gated γδ T cells. The gates were set according to only cell controls
Materials and methods
80
for respective stimulation. Expression of activation markers (CD25, CD69 and CD254) were also
analyzed on purified γδ T cells (non-activated/ freshly isolated), for which γδ T cells were
directly purified from PBMCs (~100 x106) on day 0 by MACS. These purified γδ T cells (1x10
6
cells/ml) were left untreated or were stimulated with rhIL2 (2.5IU), αCD3/CD28 (1μg/ml),
BrHPP (200nM), IPP (40μM), Picostim (20nM) or Zoledronate (100μM) for 24 hrs and then
were stained for markers like γδ-APC, CD69-FITC, CD25-PECy7 and CD254-PE). Expression
of activation markers on them was then analyzed as describe above.
3.8.2.2. Immune profiling of healthy individuals and breast cancer patients
Immune profiles of healthy individuals and breast cancer patients (undergoing Zoledronate
treatment and Zoledronate untreated) were generated by analyzing different immune cell subsets
and their activation markers, memory markers and intracellular cytokines. PBMCs from healthy
individuals and breast cancer patients were separated by ficoll-hypaque density gradient
centrifugation as described earlier. Separated PBMCs were washed twice with cold 1X PBS
(4°C) and were suspended in FACS buffer (1x10⁶cells/50μl). PBMCs (1x10
6/50μl) were stained
with fluorochrome labeled monoclonal antibodies for immune cell subset specific markers [CD3,
CD4, CD8, NK (CD3-CD56
+), NK-T (CD3
+CD56
+), B cells (CD19), regulatory T cells
(CD4+CD25
+CD127
-FOXP3
+), monocytes (CD14), γδ T cells), activation markers [CD69,
CD25, CD254], memory markers (CD45RA, CD27), intracellular cytokine [IFNγ, IL17] as per
the recommended concentration, for 30 min at 4˚C in dark. Cells were washed with 1X PBS and
were then fixed in 1% paraformaldehyde for 15 min at 4˚C in dark, followed by washing with
FACS buffer. Cells were resuspended in 300μl FACS buffer and acquired on FACS Aria (BD
Bioscience, San Jose, CA, USA). Atleast 50000 events were acquired and data was analyzed
using FlowJo software (Version 7.5, Tree star, Germany). For intracellular staining (IL17, IFNγ,

Materials and methods
81
and FOXP3), PBMCs were permeabilized using 0.1% saponin buffer kept at 37˚C for 5 min with
gentle vortexing. The cells were then stained for intracellular makers, for 30 min at 4˚C in dark.
For intracellular staining the cells were washed with saponin buffer and were resuspended in
FACS buffer for acquisition. Antibodies used: anti-human CD3-FITC (IgG1,B.D.Pharmingen),
anti-human CD3-PE (IgG1, B.D.Pharmingen), anti-human CD3-PERCP (IgG1,
B.D.Pharmingen), anti-human CD3-PECF594 (IgG1, B.D.Pharmingen), anti-human CD4-
PECF594 (IgG1, B.D.Pharmingen), anti-human CD4-APC (IgG1, B.D.Pharmingen), anti-human
CD8-PB (IgG1, B.D.Pharmingen), anti-human CD11b-AF488 (IgG1, B.D.Pharmingen), anti-
human CD14-FITC (IgG1, B.D.Pharmingen), anti-human CD19-PE (IgG1, B.D.Pharmingen),
anti-human CD25-PE (IgG1, B.D.Pharmingen), anti-human CD25-PECy5 (IgG1,
B.D.Pharmingen), anti-human CD25-PECy7 (IgG1, B.D.Pharmingen), anti-human CD27-APC
(IgG1, B.D.Pharmingen), anti-human CD45RA-PECy5 (IgG1, B.D.Pharmingen), anti-human
CD69-FITC (IgG1, B.D.Pharmingen), anti-human CD127-APC(IL7R) (IgG1, B.D.Pharmingen),
anti-human CD254-PE (IgG1, B.D.Pharmingen), anti-human FOXP3-AF488 (IgG1,
B.D.Pharmingen), anti-human IL17-AF488 (IgG1, B.D.Pharmingen), anti-human IFNγ-PECy7
(IgG1, B.D.Pharmingen), anti-human HLADR-PE (IgG1,B.D.Pharmingen). Antibodies used for
compensation: anti-human CD3-FITC (IgG1, B.D.Pharmingen), anti-human CD3-PE (IgG1,
B.D.Pharmingen), anti-human CD3-PERCP (IgG1, B.D.Pharmingen), anti-human CD3-
PECF594 (IgG1, B.D.Pharmingen), anti-human CD4-APC (IgG1, B.D.Pharmingen), anti-human
CD3-PB (IgG1, B.D.Pharmingen), anti-human CD45RA-PECy5 (IgG1, B.D.Pharmingen), anti-
human CD3-PECy7 (IgG1, B.D.Pharmingen).
Materials and methods
82
3.8.2.3. Expression of HSP60 and HSP70 on MCF7 cells upon Zoledronate treatment
MCF7 (4x10⁶) cells were treated with Zoledronate (100μM) or left untreated for 24 hrs. After 24
hrs, cells were trypsinized, washed in 1X PBS and were suspended in saponin containing FACS
buffer (1x10⁶ cells/ 50μl) for permeabilization. Untreated and Zoledronate treated MCF7 cells
were stained with anti-human HSP60-AF647 or anti-human HSP70-PE for 30 min at 4˚C in
dark. Cells were further washed with FACS buffer and were acquired on FACS Aria. The data
was analyzed using FlowJo software.
3.9) Cytokine estimation in cell free supernatants of γδ T cells
Detection of cytokine levels in cell free supernatants of γδ T cells (healthy individuals and breast
cancer patients) was carried out using cytometric bead array (CBA).
3.9.1) Collection of cell free supernatants for cytokine estimation
Cell free supernatants were obtained by stimulating immunomagnetically purified γδ T cells
(1x10⁶) from healthy individuals and breast cancer patients with rhIL2 (2.5IU), BrHPP
(200nM)+rhIl2, αCD3/CD28 mAb (1μg/ml)+rhIL2 or Zoledronate (100μM)+rhIL2 for 24 hrs at
37ºC in round bottomed 96 well plate. γδ T cells cultured in medium only for 24 hrs was kept as
control. After 24 hrs, supernatants were collected, centrifuged and were stored at
-80ºC. These supernatants were analyzed for their cytokine profiles.
3.9.2) Cytometric Bead Array (CBA)
Th1/Th2/Th17 cytokine profile of serum samples or cell free supernatants of γδ T cells
(unstimulated / stimulated) were analyzed by Cytometric Bead Array kit (BD Biosciences, USA)

Materials and methods
83
Standard graph for CBA
as per the kit instructions. In brief, 50μl test samples
and PE detection antibody were incubated with
capture bead reagent for 3 hrs at RT in dark. Serum
samples were treated with serum enhancing buffer
before using them to estimate the cytokines. The
beads were washed with 1 ml wash buffer and were
suspended in 300μl wash buffer. Set-up beads were
prepared (50μl of setup bead antibody + 450μl of wash
buffer). Samples were acquired on FACS Aria cytometer (BD Bioscience, San Jose, CA, USA),
with gentle vortexing before acquisition. The data was analyzed using FCAP Array software
(version 1.0, BD Biosciences, USA). Standard graph Th1/Th2/Th17 cytokines (IL2, IL4, IL6,
IL10, TNFα, IFNγ and IL17A) was plotted and cytokines in test samples were quantified
accordingly.
3.10) Confocal microscopy
3.10.1) Expression of HSPs on tumor cells
Breast tumor cells (MCF7 and MDAMB231, 500-1000 cells/500μl medium), were seeded on
22x22mm2 sterile glass coverslip. The cells were allowed to adhere on glass coverslip for 5-6 hrs
by incubating them at 37˚C in 5% CO2 incubator. Further, culture medium was removed and
cells were fixed in 4% paraformaldehyde for 15 min at RT. Cells were washed thrice with 1X
PBS and were permeabilized using chilled 90% methanol (-20˚C) for 10 min at RT. Cells were
washed with 1X PBS and blocking was done by incubating the cells in 1X PBS containing 3%
FCS for 30 min at RT. Subsequently, cells were stained with anti-human HSP60-AF647 (IgG1,

Materials and methods
84
B.D.Pharmingen) or anti-human HSP70-PE (IgG1, Biolegend) as per the recommended
concentration, for 1 hr at RT in dark. The antibodies were diluted in 3% FCS containing 1X PBS.
After 1 hr, excess antibody was removed by washing the cells with 1X PBS followed by staining
with nuclear dye 4’, 6-diamino-2-phenylindole (10ng/ml DAPI, Sigma Aldrich, USA) for 5 min
at RT in dark. The images were acquired on Zeiss Laser-Scanning Microscope 510 (LSM510)
META (Carl Zeiss, Jena, Germany) or Super resolution –Leica SP8/Sted 3X microscope and
data was analyzed using LASAF software.
3.10.2) Effect of Zoledronate on reorganization of cytoskeletal elements in MCF-7
3.10.2.1) Actin microfilament reorganization
Effect of Zoledronate treatment on actin microfilament reorganization in MCF7 was analyzed by
staining Zoledronate treated and untreated MCF7 cells with Phalloidin-TRITC. Phalloidin is a
rigid bicyclic heptapeptide found in the death cap mushroom Amanita phalloides, binds tightly to
filamentous actin (F-actin), stabilizing it and preventing it from depolymerization. Briefly,
MCF7 cells were cultured on 22x22mm2 glass coverslips (as described earlier) and were treated
with Zoledronate or left untreated for 16-18 hrs. Further, cells were washed with 1X PBS and
fixed in 4% paraformaldehyde for 15 min at 4˚C. Further, cells were washed and stained with
Phalloidin-TRITC for 30 min at RT in dark. Following incubation, the cells were washed and
stained for nuclear dye DAPI (10ng/ml). Phalloidin stained cells were imaged by using LSM 510
microscope and images were analyzed using LSM Image analyzer.
3.10.2.2) Keratin 8 reorganization
Zoledronate treated or untreated MCF7 cells, cultured on coverslips and were washed twice with
1X PBS and were fixed in chilled methanol (-20˚C)1-1.5 ml chilled methanol was added

Materials and methods
85
dropwise on the cells and kept at -20˚C for 10 min. Further, cells were permeabilized using 1X
PBS containing 0.3% Triton-X 100 for 10 min at RT and then were washed twice with 1X PBS.
Cells were incubated with purified mouse anti human keratin 8 antibody (diluted as 1:150 in 1X
PBS containing 3% BSA and 0.1% NP40) for 1hr at RT. Further, cells were alternatively washed
6 times with 1X PBS only or 1X PBS containing 0.1% NP40. Secondary antibody–GAM-AF488
was diluted (1:100) in same diluents and cells were incubated in dark for 30 min at RT.
Subsequently cells were alternatively washed 10 times with 1X PBS only or 1X PBS containing
0.1% NP40. Nuclear dye DAPI was used to stain nuclei. Images were acquired on LSM 510
microscope and were analyzed using LSM Image analyzer software.
3.10.2.3) Tubulin reorganization
Zoledronate and untreated MCF7 cells were fixed in 4% paraformaldehyde for 20 min at RT and
were then washed twice with 1X PBS. Cells were incubated in 1-1.5 ml 1X PBS containing
0.3% Triton-X 100 and 0.1% NP40 for 15 min at RT. Purified mouse anti human α-tubulin
antibody was diluted as 1:400 in 1X PBS containing 3% BSA and 0.1% NP40 and cells were
incubated for 2hr at RT or overnight at 4˚C. Cells were alternatively washed 6 times with 1X
PBS only or 1X PBS containing 0.1% NP40. Secondary antibody–GAM-AF488 was diluted
(1:100) in same diluents and cells were incubated in dark for 1 hr at RT. Subsequently cells were
alternatively washed 10 times with 1X PBS only or 1X PBS containing 0.1% NP40. DAPI
(10ng/ml) was used to stain nuclei. Images were acquired on LSM 510 microscope and were
analyzed using LSM Image analyzer software.
3.10.2.4) Characterization of mature human osteoclasts
Human osteoclasts were generated from CD14+ cells (monocytes) in the presence of rhMCSF
and rhRANKL over the period of 21 days and were characterized by staining them for tartarate

Materials and methods
86
resistant acid phosphatase (TRAP) or vitronectin receptor (CD51/61 or 23c6) as follows.
Multinucleated (>3 nuclei) TRAP positive or 23c6+ cells were considered as mature osteoclasts.
3.10.2.5) Tartarate resistant acid phosphatase (TRAP) staining:
Osteoclasts were stained for tartarate resistant acid phosphatase (TRAP) using a leukocyte acid
phosphatase kit (Sigma) as per the kit instructions. In brief, osteoclast culture were terminated on
day 21 and cells were treated with fixative solution (2.5ml citrate + 6.5ml acetone + 0.8ml 37%
formaldehyde) for 30 seconds, followed by washing with de-ionized water (37˚C). The cells
were then stained for acid phosphatase using sodium tartarate, fast garnet GBC and napthol AS-
BI phosphate as substrate for 1 hr in dark. Cells were repeatedly washed with de-ionized water
(37˚C) to remove excess stain. Slides were air dried and multinucleated TRAP-positive
osteoclasts were imaged by light microscopy.
3.10.2.6) Staining human osteoclasts for vitronectin receptor (CD51/61 or 23c6)
The osteoclasts were generated as described above. Osteoclast cultures were terminated on day
21 and cells were fixed in 4% paraformaldehyde for 15 min at RT. Cells were then washed with
1X PBS and blocking was done in 0.5% BSA containing 1X PBS for 10 min at RT. Further, cells
were incubated with recommended concentration (5μl/ 1x10⁶ cells/ test) of mouse anti-human
CD51/61-AF488 monoclonal antibody (IgG1, Biolegend) for 1 hr at RT in dark. Excess antibody
was removed by washing cell with 0.5% BSA containing 1X PBS. Cells were further stained for
5 min at RT in dark with nuclear dye DAPI (10ng/ml). Images were taken on Zeiss Laser-
Scanning Microscope 510 (LSM510) META (Carl Zeiss, Jena, Germany) and were analyzed
using LSM Image analyzer software.

Materials and methods
87
3.11) MTT Assay
Effect of Zoledronate on survival of MCF7 cells was analyzed by conventional MTT (3-(4,5-
Dimethylthiazol-2-Yl)-2,5-Diphenyltetrazolium Bromide) assay. MTT assay is a colorimetric
assay (Figure 7), which is based on the principle that yellow colored MTT is reduced by
mitochondrial NAD (P)H-dependent cellular oxidoreductase enzymes of metabolically active
cells to insoluble purple colored formazan (which can be dissolved in DMSO). Optical density of
formazan is measured at 590nm.
Figure 7: Principle of MTT assay
In brief, MCF7 cells (1x10⁵ / well) were allowed to adhere in 96 well flat bottom plate and were
then treated with different concentrations of Zoledronate [0μM (control), 50μM, 100μM,
200μM] for 16-18 hrs. After 18 hrs, used medium (180μl) was replaced with 100μl fresh cRPMI.
MTT (5mg/ml) was freshly prepared in 1X PBS and stored in dark (light sensitive). The cells
were incubated with 20μl MTT (5mg/ml) for 4 hrs at 37°C in CO2 incubator. Plate was
centrifuged at 1000g for 15 min at RT and supernatant was removed. Cells were incubated with
dimethyl sulphoxide (100μl) for 15-30 min at 37°C on shaker to dissolve the formazan crystals.
The optical density was measured at 540nm using reference wavelength 690nm. Test viability
was calculated as [Test viability (%) = (Test O.D / Control O.D.) x 100].
Materials and methods
88
3.12) Identification of differentially expressed protein in MCF7 cells upon
Zoledronate treatment by 2D PAGE-MALDI-TOF/TOF
3.12.1) Sodium Dodecyl Sulphate–Polyacrylamide gel electrophoresis (SDS-PAGE)
2D electrophoresis is a technique, which combines isoelectric focusing (IEF) with SDS-
polyacrylamide gel electrophoresis (SDS-PAGE). Independently, IEF resolves proteins on its
chemical property (isoelectric point, where charge on the proteins becomes neutral), while SDS-
PAGE resolves proteins on the basis of their physical property (molecular weight). 2D-PAGE
thus can resolve complex biological samples with a high degree of specificity and accuracy.
These resolved proteins are then identified using MALDI-TOF.
3.12.1.1) Preparation of cell lysate
Urea based lysis buffer was used to prepare lysates for 2D-PAGE. The composition of the lysis
buffer is described below. Lysis buffer (100μl) was added to cells (10x106) and cells were
incubated overnight at 4˚C. Further, cells were sonicated at 20hrzt for 30 duty cycles with
intermittent cold shock on ice (5 seconds). The crude lysate was ultracentrifuged at 400000 g
(55000rpm), 4˚C for 1 hr and supernatant was collected. Protein estimation of the lysate was
carried out by Lowry’s method. Before protein estimation, proteins were acetone precipitated (as
urea interferes with Lowry’s reagent) using chilled acetone (-20˚C) for 1 hr. After 1 hr,
precipitated proteins were pelleted by centrifugation at 25900 g (14000 rpm), for 15 min at 4˚C.
Proteins were washed with chilled acetone by repeating the same procedure twice (for complete
removal of detergents and other components).

Materials and methods
89
Chemicals used:
a) Urea (Sigma Aldrich,U6504)
b) Thiourea (Sigma Aldrich, T7875)
c) CHAPS (Sigma Aldrich, C3023)
d) DTT (Sigma, D9779)
e) 100X Biolyte 3/10 Ampholyte (1ml, Bio-Rad, Cat No. 1632094)
f) 100X ReadyStrip 7-10 Buffer (1 ml, Bio-Rad, Cat No.163-2093)
Composition of the lysis buffer
Sr. No. Component Quantity/Volume
1 8M Urea 480 mg
2 2M Thiourea 152 mg
3 2% CHAPS 200ul from 10% stock
4 1% DTT 100ul from 10% stock
Total Volume (with milliQ) 1000μl
3.12.1.2) Protein estimation by Folin- Lowry’s method
Lowry’s method is a colorimetric method developed by Oliver Lowry in 1951 (Figure 8). Under
alkaline conditions the divalent copper ion forms a complex with peptide bonds in which it is
reduced to a monovalent ion. Monovalent copper ion and the radical groups of tyrosine,
tryptophan, and cysteine react with Folin reagent to produce an unstable product that becomes
reduced to molybdenum/tungsten blue (Mo6+
Mo2+
). Lowry’s method is pH sensitive method
hence; pH has to be maintained at 10-10.5. Ammonium ions, zwitter ionic buffers, nonionic
buffers, thiol compounds and detergents interfere with the Lowry reaction. It determines the
proteins at low concentration (0.005 - 0.10 mg/ml). It also depends on with the composition of
aromatic components of the proteins, especially cysteine.

Materials and methods
90
BSA (1mg/ml) was dissolved in milliQ and was used as standard to determine protein
concentration. BSA solution was further distributed as 20-100µg/ml. Test samples (untreated and
Zoledronate treated MCF7 lysates) were also diluted as 1:5 or 1:10 or left undiluted (neat).
Additions were carried out as described below. Folin-Lowry reagent was added to tubes and
incubated for 30min in dark. Optical density (OD) was measured at 660nm and standard graph
was drawn. Protein concentration of test samples was determined accordingly.
Chemical requirements:
1) CTC (Copper Tartarate Carbonate) solution:
Solution I - 20% Sodium carbonate (Na2CO3)
Solution II - 0.2% Copper sulphate (CuSO4)
Solution III - 0.4% Sodium potassium tartarate (NaK-tartarate)
For 100ml of CTC, 0.05gram of Copper sulphate was dissolved in 20ml milliQ and 0.1gram
Sodium potassium tartarate was dissolved in 20ml milliQ. Copper sulphate and sodium
potassium tartarate were mixed and volume was adjusted to 50ml. To this equal volume (50ml)
of 20% sodium carbonate was added by stirring continuously.
2) 10% Sodium dodecyl sulphate (SDS)
Figure 8: Principle of Folin-Lowry’s method of protein estimation
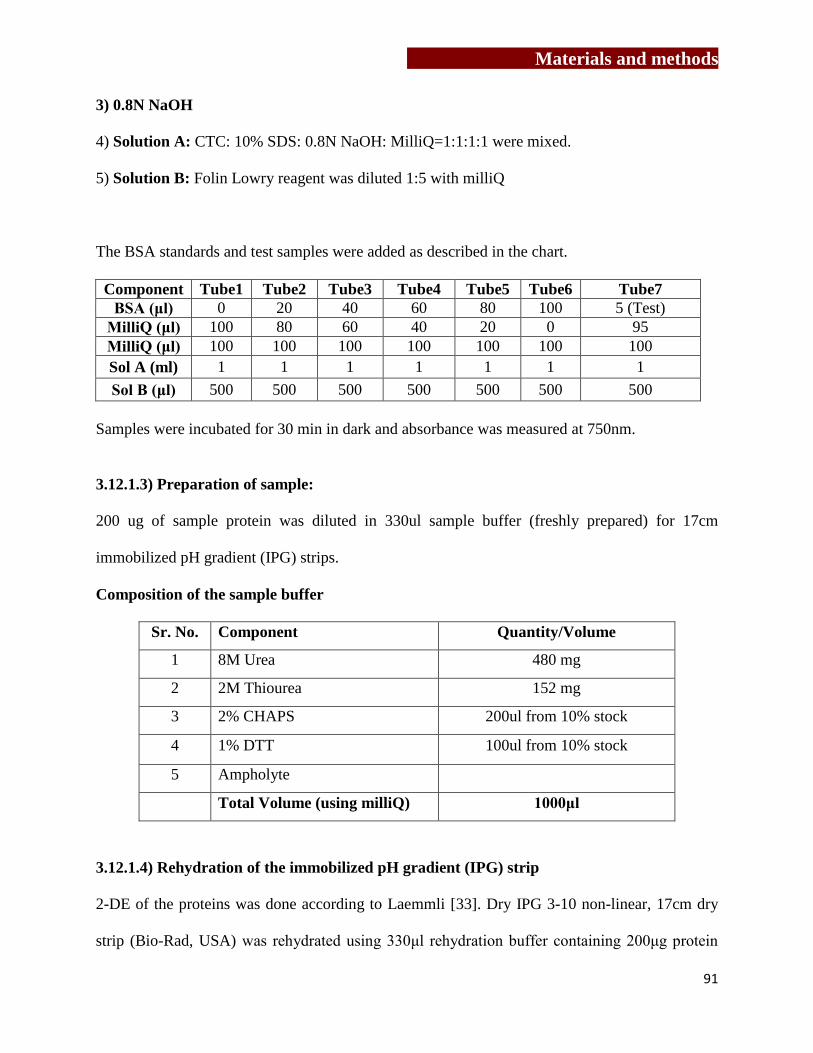
Materials and methods
91
3) 0.8N NaOH
4) Solution A: CTC: 10% SDS: 0.8N NaOH: MilliQ=1:1:1:1 were mixed.
5) Solution B: Folin Lowry reagent was diluted 1:5 with milliQ
The BSA standards and test samples were added as described in the chart.
Component Tube1 Tube2 Tube3 Tube4 Tube5 Tube6 Tube7
BSA (μl) 0 20 40 60 80 100 5 (Test)
MilliQ (μl) 100 80 60 40 20 0 95
MilliQ (μl) 100 100 100 100 100 100 100
Sol A (ml) 1 1 1 1 1 1 1
Sol B (μl) 500 500 500 500 500 500 500
Samples were incubated for 30 min in dark and absorbance was measured at 750nm.
3.12.1.3) Preparation of sample:
200 ug of sample protein was diluted in 330ul sample buffer (freshly prepared) for 17cm
immobilized pH gradient (IPG) strips.
Composition of the sample buffer
Sr. No. Component Quantity/Volume
1 8M Urea 480 mg
2 2M Thiourea 152 mg
3 2% CHAPS 200ul from 10% stock
4 1% DTT 100ul from 10% stock
5 Ampholyte
Total Volume (using milliQ) 1000μl
3.12.1.4) Rehydration of the immobilized pH gradient (IPG) strip
2-DE of the proteins was done according to Laemmli [33]. Dry IPG 3-10 non-linear, 17cm dry
strip (Bio-Rad, USA) was rehydrated using 330μl rehydration buffer containing 200μg protein
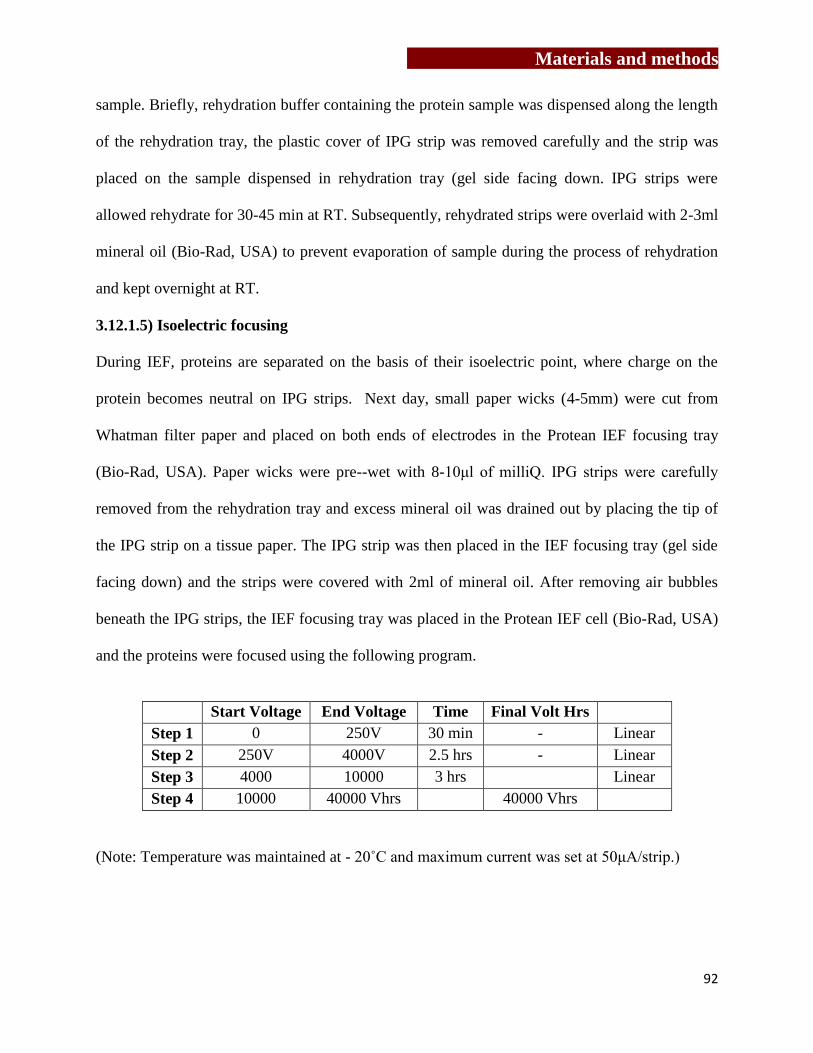
Materials and methods
92
sample. Briefly, rehydration buffer containing the protein sample was dispensed along the length
of the rehydration tray, the plastic cover of IPG strip was removed carefully and the strip was
placed on the sample dispensed in rehydration tray (gel side facing down. IPG strips were
allowed rehydrate for 30-45 min at RT. Subsequently, rehydrated strips were overlaid with 2-3ml
mineral oil (Bio-Rad, USA) to prevent evaporation of sample during the process of rehydration
and kept overnight at RT.
3.12.1.5) Isoelectric focusing
During IEF, proteins are separated on the basis of their isoelectric point, where charge on the
protein becomes neutral on IPG strips. Next day, small paper wicks (4-5mm) were cut from
Whatman filter paper and placed on both ends of electrodes in the Protean IEF focusing tray
(Bio-Rad, USA). Paper wicks were pre--wet with 8-10μl of milliQ. IPG strips were carefully
removed from the rehydration tray and excess mineral oil was drained out by placing the tip of
the IPG strip on a tissue paper. The IPG strip was then placed in the IEF focusing tray (gel side
facing down) and the strips were covered with 2ml of mineral oil. After removing air bubbles
beneath the IPG strips, the IEF focusing tray was placed in the Protean IEF cell (Bio-Rad, USA)
and the proteins were focused using the following program.
Start Voltage End Voltage Time Final Volt Hrs
Step 1 0 250V 30 min - Linear
Step 2 250V 4000V 2.5 hrs - Linear
Step 3 4000 10000 3 hrs Linear
Step 4 10000 40000 Vhrs 40000 Vhrs
(Note: Temperature was maintained at - 20˚C and maximum current was set at 50μA/strip.)

Materials and methods
93
3.12.1.6) Equilibration of IPG strips
Once the proteins were separated on the basis of their isoelectric point, these proteins were
further separated on the basis of their molecular weight. In order to neutralize the charges,
proteins were treated with iodoacetamide (IAA, Sigma) and dithiothretol (DTT, Sigma). After
IEF, excess mineral oil was wiped out of the strips and strips were kept in equilibration buffer I
for 20min at RT, followed by treatment with equilibration buffer –II for 20 min at RT.
Composition of Equilibration buffer I and II
S.No Component Equilibration Buffer I Equilibration Buffer II
1 1MTris(pH8.8) 7.5 ml 7.5 ml
2 Urea 7.2 gram 7.2 gram
3 SDS 0.4 gram 0.4 gram
4 Glycerol 4 ml 4 ml
5 DTT 0.4 gram -
6 IAA - 0.5 gram
Total Volume 20 ml 20 ml
3.12.1.7) Sodium dodecyl sulfate polyacrylamide gel electrophoresis (SDS-PAGE)
SDS-PAGE was carried out in PROTEAN® II xi Cell (BIO-RAD).
Chemicals required for SDS-PAGE:
a. Acrylamide:bisacyrlamide (29:1) solution
29 grams of Acrylamide (Sigma USA) and 1gram of bisacrylamide (N,N
Methylenbisacrylamide, Sigma USA) were dissolved in 70ml milliQ and volume was adjusted to
100ml. Solution was filtered using Whatmann filter paper and was stored in amber colored bottle
at 4oC.
b. 1M Tris buffer (pH 6.8)
12.11grams of Tris base [Tris(hydroxymethyl)amino methane, Sigma USA] was dissolved in
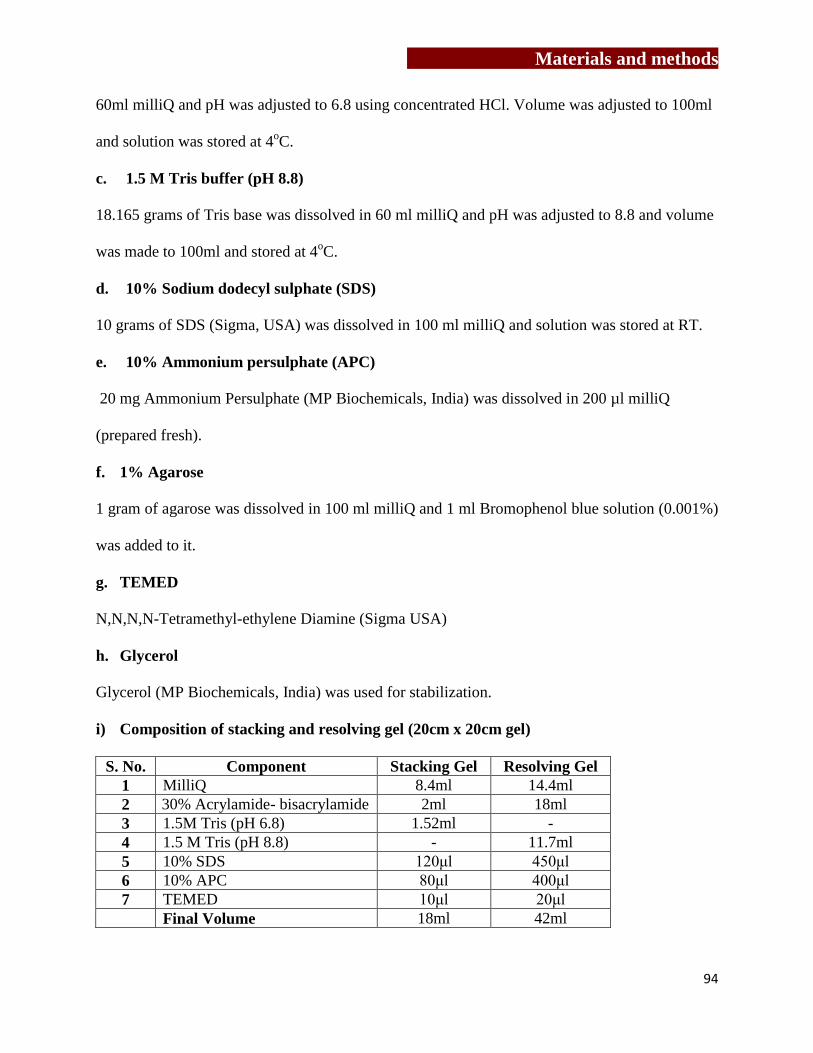
Materials and methods
94
60ml milliQ and pH was adjusted to 6.8 using concentrated HCl. Volume was adjusted to 100ml
and solution was stored at 4oC.
c. 1.5 M Tris buffer (pH 8.8)
18.165 grams of Tris base was dissolved in 60 ml milliQ and pH was adjusted to 8.8 and volume
was made to 100ml and stored at 4oC.
d. 10% Sodium dodecyl sulphate (SDS)
10 grams of SDS (Sigma, USA) was dissolved in 100 ml milliQ and solution was stored at RT.
e. 10% Ammonium persulphate (APC)
20 mg Ammonium Persulphate (MP Biochemicals, India) was dissolved in 200 µl milliQ
(prepared fresh).
f. 1% Agarose
1 gram of agarose was dissolved in 100 ml milliQ and 1 ml Bromophenol blue solution (0.001%)
was added to it.
g. TEMED
N,N,N,N-Tetramethyl-ethylene Diamine (Sigma USA)
h. Glycerol
Glycerol (MP Biochemicals, India) was used for stabilization.
i) Composition of stacking and resolving gel (20cm x 20cm gel)
S. No. Component Stacking Gel Resolving Gel
1 MilliQ 8.4ml 14.4ml
2 30% Acrylamide- bisacrylamide 2ml 18ml
3 1.5M Tris (pH 6.8) 1.52ml -
4 1.5 M Tris (pH 8.8) - 11.7ml
5 10% SDS 120μl 450μl
6 10% APC 80μl 400μl
7 TEMED 10μl 20μl
Final Volume 18ml 42ml

Materials and methods
95
Preparation of 12% SDS-PAGE
To separate the proteins on the basis of molecular weight, 12% SDS-PAGE was prepared.
Resolving and stacking gels (composition as described above) were casted in glass plates and
glass plates were placed in electrophoresis apparatus. Upon equilibration, IPG strips were dipped
in electrode buffer (to remove excess equilibration buffers) and placed on the 12% SDS-PAGE
for the second-dimension separation in PROTEAN® II xi Cell. Strips were fixed in position
using 1% agarose solution. For second dimension separation, 75V was kept constant. The
reference dye, bromophenol phenol blue, was allowed to run till it touches the end of gel and
then the instrument was switched off, gels were removed and protein profiles were detected by
silver staining.
3.12.1.8) Detection of the proteins using silver staining:
Chemicals required for silver staining:
a) Fixing solution
Fixing solution was prepared by mixing 45 ml of methanol (Merck), 10 ml of acetic acid
(Qiagen) and 45 ml of milliQ.
b) 0.02% Sodium thiosulphate
0.02 gram of Sodium thiosuphate (SDFCL) was dissolved in 100 ml of milliQ.
c) 0.2% Silver nitrate Solution
0.2 gram of Silver Nitrate (Merck) was dissolved in 100 ml milliQ and 75 μl of formaldehyde
was added at the time of staining.
d) Developer
6 grams of Sodium Carbonate (Merck) was dissolved in 98 ml of milliQ and 2 ml of 0.02%
Sodium Thiosulphate solution and 50 μl of formaldehyde was added at the time of staining.
Materials and methods
96
e) Destainer
Destainer was prepared by mixing 40 ml of methanol, 10 ml of acetic acid and 50 ml of milliQ.
Procedure: Upon electrophoresis, gels were removed and kept in fixing solution for 2 hrs,
followed by wash twice using milliQ (20 sec each). Gels were then kept in 50% ethanol
(prepared in milliQ) for 20 min and repeat wash with milliQ thrice (It was repeated thrice).
Subsequently, gels were pre-incubated in 0.02% Sodium Thiosulphate for 1 min, washed with
milliQ and stained in 0.2% silver nitrate for 30 min in dark. Excess Silver Nitrate was removed
by washing with milliQ. Gels were developed using developer solution till the proteins get
visible and reaction was stopped using destainer solution. Stained gels were stored in 10% acetic
acid.
3.12.1.9) Analysis of differential protein expression in MCF7 cells upon Zoledronate
treatment
Silver stained gel was scanned on the BIO-RAD GS-800 densitometer. Protein profiles of
untreated and Zoledronate treated MCF7 cells were analyzed using PD Quest software (Version
7.2). Quantitative and qualitative differences in proteins between untreated and Zoledronate
treated MCF7 gels were determined and proteins (silver stained gel plugs) were separated for
identification by matrix assisted laser desorption/ionization-timer of flight (MALDI-TOF).
3.12.1.10) Identification of differentially expressed proteins using PD Quest software
PDQuest software (BioRad, Version 2.0) was used to analyze qualitative (position on the gel)
and quantitative (intensity of the spot) differences in protein profiles of untreated and
Zoledronate treated MCF7 cells. Spot detection wizard from PDQuest software was used to
determine the spots in the raw gel image. Once the spots were detected, original “raw” image
was filtered and smoothed to clarify the spots, which was called as “filtered” image. From
Materials and methods
97
“filtered” image, a synthetic image (Gaussian image) containing Gaussian spots were created.
Gaussian spot is a 3D representation of an original scanned spot. “Gaussian image” helps to
distinguish and quantify fuzzy, streaked or overlapping spots from dense clusters in a 2D gel.
Different sets of gels (untreated and Zoledronate treated MCF7 cells) were matched, normalized
and MasterSets were created from them (Untreated MasterSet and Zoledronate treated
MasterSet). Normalization is necessary for accurate comparison between gels, where factors like
inconsistency during sample preparation (due to changes in cell numbers or variations in
reagents, protocols), handling errors, sample loss during preparation, inconsistent staining times
between gels may be interfering. MasterSet is composed of the Raw2D, filtered and Gaussian
image of the gels in an experiment. From both MatchSets, a synthetic “MatchSet Master” image
was created, which included all the information from both untreated and Zoledronate treated
MasterSets. Using, Spot review tool, Gaussian images of untreated MasterSets and Zoledronate
treated MasterSets were compared for their quantitative and quantitative differences.
3.12.1.11) MALDI-TOF
Chemicals required for Mass-spectrometry:
a) 50 mM Ammonium bicarbonate (NH4HCO3, Sigma Aldrich)
40 mg of NH4HCO3 was dissolved in 10 ml milliQ in T15 tube.
b) Potassium ferricyanide (K3[Fe (CN)6], Merck)
100 mg of K3[Fe(CN)6] was dissolved in 10 ml milliQ in a T15 tube.
c) Sodium thiosulphate (Na2S2O3, Merck)
0.24 gram of Na2S2O3 dissolved in 10 ml milliQ in a T15 tube.

Materials and methods
98
d) Trypsin for in-gel digestion
20μg trypsin (proteomics grade, Sigma,USA) powder was dissolved in 2ml of 25mM ammonium
bicarbonate to make a 10 ng/μl solution of trypsin. 100 μl aliquots were stored at -20 °C for
further use.
e) Extraction buffer for extraction of peptides
500µl of acetonitrile (Sigma, USA) and 50µl of trifluoroacetic acid (TFA, Applied Biosystems)
were added in 450µl of milliQ.
f) Reconstitution buffer
500μl of acetonitrile and 1μl of TFA were mixed in 499µl of milliQ.
g) Matrix for loading of peptides on to the MALDI plate
Saturated solution of α-Cyano Hydroxy Cinnamic acid (CHCA, Brucker, prepared in 50 %
acetonitrile and 0.1 % TFA as 20 mg/ml.
Procedure:
Protein in the silver stained gel plugs were identified by mass spectrometry upon trypsin
digestion of these proteins according to Shevchenko et al [250]. Silver stained gel plugs were
repeatedly washed with milliQ and then destained using 100μl destaining solution (100mM
Sodium thiosuphlate: 30mM, Potassium Ferricyanide mixed 1:1 v/v) for 30 min at RT. Destained
gel plugs were washed thrice with milliQ for 5 min each. These gel plugs were incubated in
100μl of 50mM of Ammonium bicarbonate: acetonitrile (1:1, v/v) for 15 min with vortexing. Gel
plugs were then dried in 100% of acetonitrile for 5 min, followed by drying in speed-vac. Silver
stained gel plugs obtained from 1D gel were reduced using 10mM DTT (prepared in 50mM
ammonium bicarbonate) for 45 min at 56˚C, chilled at RT and further alkylated using 55mM of
iodoacetamide (prepared in 50mM ammonium bicarbonate) for 30 min in dark. For 2D gel
Materials and methods
99
proteins, reduction and alkylation is done during equilibration of the gels. To the dried protein
plugs, 10ng/μl Trypsin in 25mM ammonium bicarbonate (10μl/plug) was added and
trypsinization was carried out overnight at 37˚C. Peptides were recovered using 35-50μl of 50%
acetonitrile and 5% trifluoroacetic acid (TFA) and dried in speed-vac. Tryptic peptides were
reconstituted in 10% acetonitrile with 0.1% TFA before using them for mass spectrometric
analysis. The MS data was acquired in an automated manner using a solid state NdYAG laser at
337nM on MALDI-TOF TOF, Ultraflex model (Bruker Daltonics, Germany). Reconstituted
samples were mixed with suitable matrix (sinapinic acid, alpha-cyano/CHCA, 2,5
dihydroxybenzoic acid, mostly acidic in nature, therefore act as a proton source to encourage
ionization of the analyte), loaded onto metal plate an MALDI-TOF and allowed to air dry. The
sample was irradiated with a pulsed laser ( UV lasers e.g. nitrogen lasers (337 nm) and
frequency-tripled and quadrupled Nd:YAG lasers (355 nm and 266 nm respectively) which
triggered ablation and desorption of the sample and matrix material. Finally, the analyte
molecules were ionized by being protonated or deprotonated in the hot plume of ablated gases
and time of flight is calculated. MALDI TOF/TOF mass spectrometers were used to reveal
amino acid sequence of peptides using post-source decay or high energy collision-induced
dissociation. The MS data was acquired in an automated manner using Biotools software (Bruker
Daltonics, Germany) and was analyzed using Flex analysis 3.0 (Bruker Daltonics, Germany)
software. Intense peaks of peptides were subjected to MS/MS. The MS peaklist and MS/MS ions
of the chosen peptides were searched against SwissProt database version 2012_08 onwards using
MASCOT search engine for protein ID with precursor tolerance of 100 ppm for MS and
fragment tolerance of 0.7 to 1Da for MS/MS analysis. Selected proteins were validated by
western blotting or flow cytometry.

Materials and methods
100
3.13) Liquid chromatography-Mass spectrometry
Change in expression of proteins in MCF7 upon Zoledronate treatment in MCF7 was analyzed
by more advanced, sensitive and robust method, iTRAQ (isobaric tags for relative and absolute
quantification) followed by liquid chromatography-mass spectrometry (LC-MS).
Principle: The iTRAQ tags are isobaric labels that react with primary amines of peptides
including the N-terminus and ε-amino group of the lysine side-chain. Each label has a unique
charged reporter group, a peptide reactive group, and a neutral balance group to maintain an
overall mass of 145 for each reagent and the same peptide reactive group. When a peptide is
fragmented by MS/MS fragmentation, the iTRAQ reporter groups break off and produce distinct
ions at m/z 114, 115, 116, 117, 118, 119, 121 and 122. The relative intensities of the reporter
ions are directly proportional to the relative abundances of each peptide in the samples that being
compared. In addition to producing strong reporter ion signals for quantification, MS/MS
fragmentation of iTRAQ tagged peptides also produces strong y- and b-ion signals for more
confident identification. Thus, it is a much more sensitive method.
3.13.1) Chemical requirements:
a) 1M (4-(2-hydroxyethyl)-1-piperazineethanesulfonic acid (HEPES)
23.83 grams of HEPES sodium salt (Sigma) was dissolved in milliQ, pH was adjusted to 7.6 and
volume was finalized to 100 ml. It is a zwitterionic organic chemical buffering agent
b) 1M Sodium Chloride (NaCl)
5.844 grams of NaCl (Qualigens) was dissolved in milliQ and volume was adjusted to 100 ml. It
is added to maintain ionic strength of medium.

Materials and methods
101
c) 1% Triton X
1ml of Triton-X 100 (Qualigen) was dissolved in 100 ml of milliQ. Detergents were used to
solublize of poorly soluble proteins.
d) 1M Magnesium Chloride
20.33 grams of MgCl2 (SRL) was dissolved in milliQ and volume was adjusted to 100ml. It is
used as a stabilizing agent for proteins.
e) 1M [Ethylene glycol-bis(β-aminoethyl ether)-N,N,N′,N′-tetraacetic acid tetrasodium salt]
37.22 grams of EGTA (Sigma Aldrich, USA) was dissolved in milliQ, pH was adjusted to 8 and
volume was finalized to 100 ml. It is used to reduce oxidation damage, chelate metal ions. It is
also a metalloproteases inhibitor. Metalloproteases (protease family members) contain a metal
ion at their active site which acts as a catalyst in the hydrolysis peptide binds.
f) 1M Ethylene diamine tetraacetic acid (EDTA, pH=8)
37.22 grams of EDTA (Sigma, USA) was dissolved in 50ml milliQ, pH was adjusted to 8 and
volume was finalized to 100 ml. It acts as a metalloproteases inhibitor.
g) 1M Sodium fluoride (NaF)
41.9 mg of NaF (Sigma, USA) was dissolved in 400 µl milliQ and volume was adjusted to 1 ml.
NaF is used to inactivate endogenous phosphatases and protect protein phosphorylation.
h) 1M sodium orthovanadate (Na3VO4)
1.839 gram of Na3VO4 (Sigma, USA) was dissolved in milliQ and volume was adjusted to 1 ml.
It is a phosphatase inhibitor for protein phosphoseryl and phosphothreonyl phosphatases (PSPs).
i) 2mg/ml Leupeptin
2mg Leupeptin (Sigma, USA) was dissolved in 1 ml milliQ. It is a cysteine and serine protease
inhibitor.
Materials and methods
102
j) 2mg/ml phenylmethylsulfonyl fluoride (PMSF)
2mg of PMSF (Sigma, USA) was dissolved in 1ml DMSO. PMSF is a serine protease inhibitor.
k) 1mg/ml Pepstatin-A
1mg of pepstatin-A (Sigma, USA) was dissolved in 1ml DMSO. Pepstatin-A is an aspartic
protease inhibitor.
l) 1mg/ml Aprotinin
1mg aprotinin (Sigma, USA) was dissolved in 1ml milliQ. Aprotinin is a basic pancreatic serine
protease.
m) 50mM Tris (pH 8)
6.055 gram tris base was dissolved in milliQ, pH was adjusted to 8 and volume was finalized to
100 ml.
n) 50mM Tris (pH 7.5)
6.055 grams of tris base was dissolved in milliQ, pH was adjusted to 7.5 and volume was
finalized to 100 ml.
o) 6M urea
3.603 grams of urea was dissolved in 50mM tris buffer (pH=8) and volume was adjusted to
10ml.
p) 200mM Dithiothretol
0.3085 gram DTT was dissolved in 50mM tris buffer (pH 8) and volume was adjusted to 10 ml.
It reduces oxidation damage and also assists protein denaturant
q) 200mM Iodoacetamide (IAA)
0.3699 gram IAA was dissolved in 50mM tris buffer (pH 8) and volume was adjusted to 10 ml.

Materials and methods
103
r) 1mM Calcium chloride
1.1098 mg CaCl2 (HiMedia, India) was dissolved in 50mM tris buffer (pH 7.5) and volume was
adjusted to 10 ml.
s) Trypsin
20μg trypsin (Proteomics grade, Sigma Aldrich promega, USA) was dissolved in 1ml of 25mM
ammonium bicarbonate, mixed properly and aliquots were stored at -20˚C.
t) Composition of lysis Buffer:
S. No. Component Stock Volume added
1 50mM HEPES pH 7.6 1M 50 μl
2 150mM NaCl 1M 150 μl
3 1% Triton X100 - 10 μl
4 5mMgCl2 1M 1.5 μl
5 5Mm EGTA 0.5 M 10 μl
6 5Mm EDTA 0.5M 10 μl
7 1.5mM NaF 1M 1.5 μl
8 1mM Leupeptin 2mg/ml 10 μl
9 2mM PMSF 2mg/ml 175 μl
10 10ug/ml Pepstatin 1mg/ml 10 μl
11 10ug/ml Aprotinin 1ng/ml 10 μl
12 1mM Na3VO4 1M 1 μl
13 MilliQ - 461 μl
Total Volume 1000 μl
3.13.2) Preparation of cell lysate
1ml lysis buffer was added to 1x10⁶ MCF7 cells (untreated or Zoledronate treated) and cells
were kept on ice for 20 minutes. Subsequently, lysate was centrifuged at 400000g for 20 min at
4ºC; supernatant was collected and stored at -20ºC.
Materials and methods
104
3.13.3) Delipidation
1ml lysate was passed through delipidation column (capacity 250µl, where lipids will bind) and
filtrate was collected. The filtrate (~200µl at a time) was further passed through buffer exchange
columns to remove salts and other contaminants. 100µl TEAB buffer was aspirated in the
column without damaging the membrane and content was spinned down to remove the
contaminants. It was repeated thrice. 50µl TEAB buffer was again added to the column, mixed
properly and content was aspirated. Concentrated protein lysate/sample was stored at -20ºC.
Protein estimation was carried out by Lowry’s method.
3.13.4) In-solution trypsin digestion and labeling of samples
0.1-1mg of protein sample was reconstituted in 100µl of 6M urea. To this 5µl of 200mM DTT
was added and incubated at RT for 1 hr. To this mixture, 20µl of 200mM IAA (prepared in
50mM Tris-HCl, pH-8) was added, gently vortexed and incubated at RT for 1 hr in dark. Further,
855µl 1mM CaCl2 was added to reduce the urea concentration to ~0.6M. Trypsin solution was
added to a final ratio of 1:50 (w/w, trypsin:protein), gently vortexed and incubated at 37ºC for
16-18 hrs. The reaction (trypsinization) was stopped by adding 1µl formic acid (which decreases
the pH to 3-4). Samples were dried using speed vac and stored at -20C. Samples were
reconstituted in 0.1% formic acid prepared in milliQ. Salt and detergent contaminants from
samples were further removed using Zip-Tip (Millipore, 0.6µL, c-18 RESIN, with 5µg analyte
binding capacity). In brief, Zip-tip was pre-wet by carefully aspirating 20µl of 100% acetonitrile
(ACN) 8-10 times. Equilibration of the tip was carried out by slowly passing 20µl of 0.1%
formic acid (prepared in milliQ) through the tip. 20µl of sample, reconstituted in 0.1% formic
acid, was aspirated in tip 8-10 times, allowing binding of the proteins/peptides in the zip-tip
column. Further, 0.1% formic acid was used to wash the column of zip-tip. Proteins/peptides
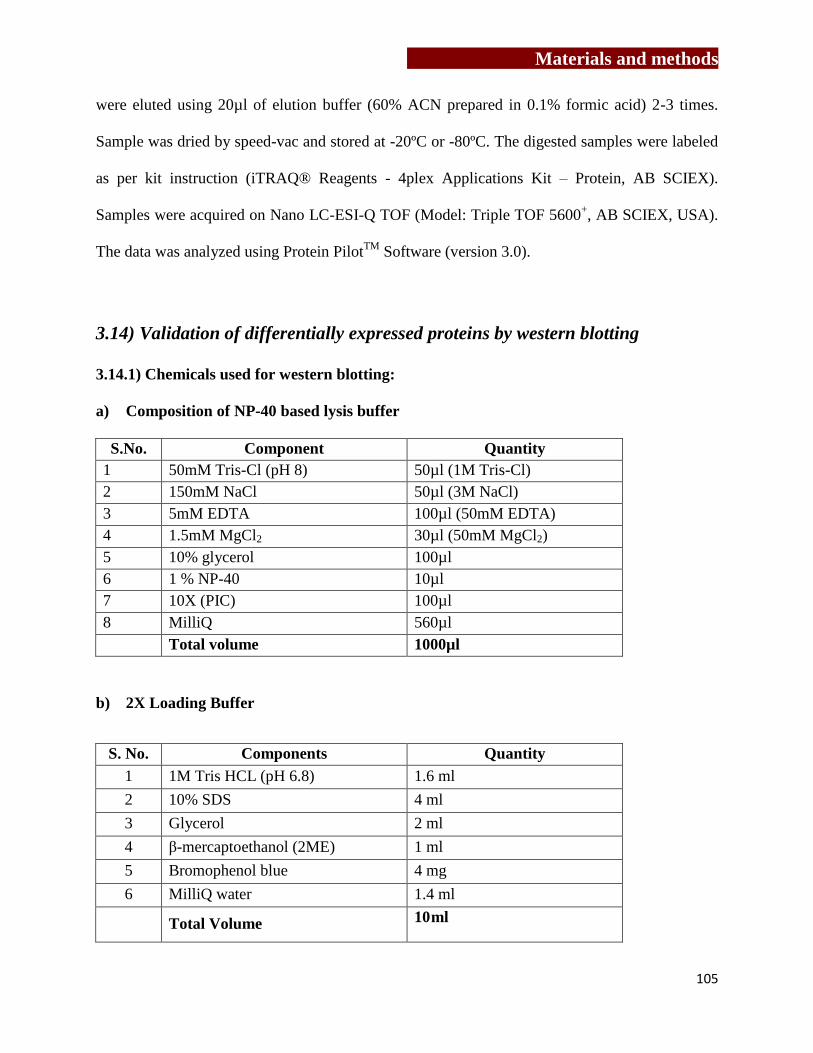
Materials and methods
105
were eluted using 20µl of elution buffer (60% ACN prepared in 0.1% formic acid) 2-3 times.
Sample was dried by speed-vac and stored at -20ºC or -80ºC. The digested samples were labeled
as per kit instruction (iTRAQ® Reagents - 4plex Applications Kit – Protein, AB SCIEX).
Samples were acquired on Nano LC-ESI-Q TOF (Model: Triple TOF 5600+, AB SCIEX, USA).
The data was analyzed using Protein PilotTM
Software (version 3.0).
3.14) Validation of differentially expressed proteins by western blotting
3.14.1) Chemicals used for western blotting:
a) Composition of NP-40 based lysis buffer
S.No. Component Quantity
1 50mM Tris-Cl (pH 8) 50µl (1M Tris-Cl)
2 150mM NaCl 50µl (3M NaCl)
3 5mM EDTA 100µl (50mM EDTA)
4 1.5mM MgCl2 30µl (50mM MgCl2)
5 10% glycerol 100µl
6 1 % NP-40 10µl
7 10X (PIC) 100µl
8 MilliQ 560µl
Total volume 1000µl
b) 2X Loading Buffer
S. No. Components Quantity
1 1M Tris HCL (pH 6.8) 1.6 ml
2 10% SDS 4 ml
3 Glycerol 2 ml
4 β-mercaptoethanol (2ME) 1 ml
5 Bromophenol blue 4 mg
6 MilliQ water 1.4 ml
Total Volume 10 ml
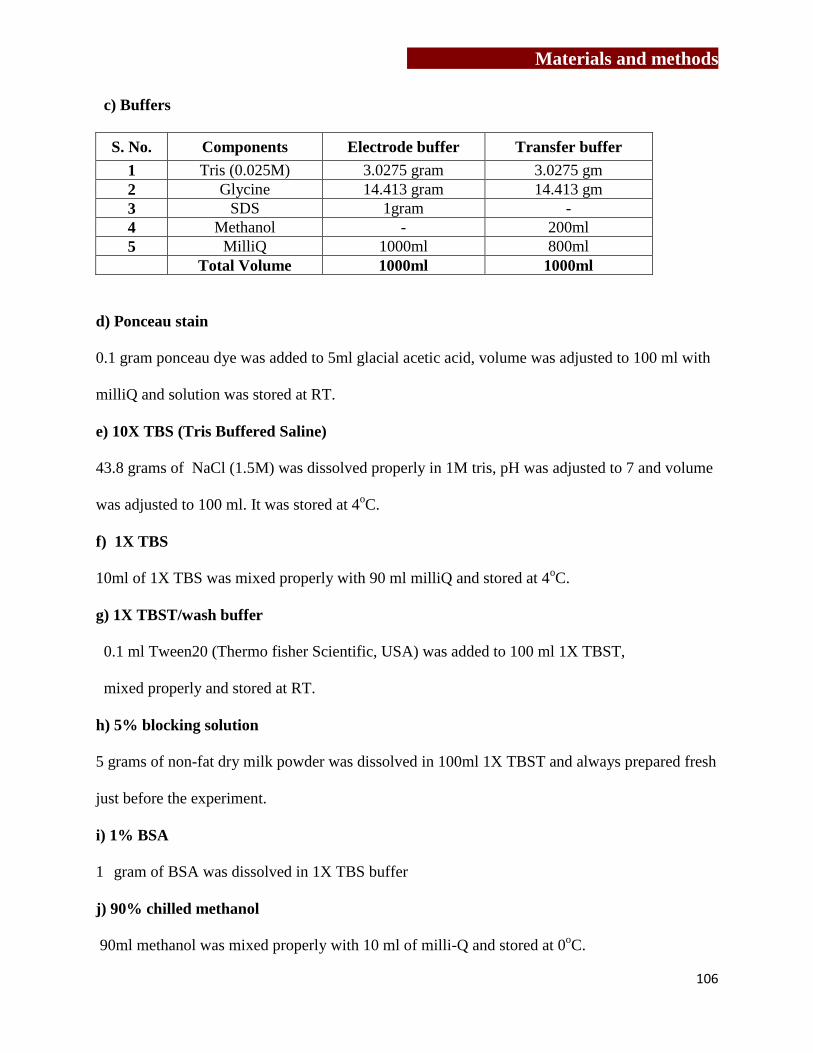
Materials and methods
106
c) Buffers
S. No. Components Electrode buffer Transfer buffer
1 Tris (0.025M) 3.0275 gram 3.0275 gm
2 Glycine 14.413 gram 14.413 gm
3 SDS 1gram -
4 Methanol - 200ml
5 MilliQ 1000ml 800ml
Total Volume 1000ml 1000ml
d) Ponceau stain
0.1 gram ponceau dye was added to 5ml glacial acetic acid, volume was adjusted to 100 ml with
milliQ and solution was stored at RT.
e) 10X TBS (Tris Buffered Saline)
43.8 grams of NaCl (1.5M) was dissolved properly in 1M tris, pH was adjusted to 7 and volume
was adjusted to 100 ml. It was stored at 4oC.
f) 1X TBS
10ml of 1X TBS was mixed properly with 90 ml milliQ and stored at 4oC.
g) 1X TBST/wash buffer
0.1 ml Tween20 (Thermo fisher Scientific, USA) was added to 100 ml 1X TBST,
mixed properly and stored at RT.
h) 5% blocking solution
5 grams of non-fat dry milk powder was dissolved in 100ml 1X TBST and always prepared fresh
just before the experiment.
i) 1% BSA
1 gram of BSA was dissolved in 1X TBS buffer
j) 90% chilled methanol
90ml methanol was mixed properly with 10 ml of milli-Q and stored at 0oC.
Materials and methods
107
3.14.2) Preparation of cell lysate
100μl of NP-40 based lysis buffer was added to untreated or Zoledronate treated MCF7 cells
(10x106) and samples were boiled for 10 min. Samples were stored at 4˚C (long term -20ºC) and
were boiled for 5 min before loading. These lysates were used to analyze effect of Zoledronate
on expression of cytoskeletal elements (β-actin, α-tubulin and keratin 8), HSPs (HSP60 and
HSP70) and expression of epidermal growth factor receptor (EGFR).
3.14.3) Electroblotting and Immunoblotting
Protein estimation was carried out by Lowry’s method. 20ug protein was loaded onto SDS-
PAGE and electrophoresis was carried out at 100 volts. After electrophoresis under reducing
conditions, separated proteins were electrophoretically transferred onto mdi nitrocellulose
membrane (Advanced microdevices Pvt. Ltd., India) in transfer buffer at RT for 1hr at a voltage
of 100V using the vertical transfer apparatus (Biorad). The membrane containing standard
molecular weight marker along with protein lysates was stained with Ponceau S. The membranes
containing the lysates were completely destained in wash buffer and blocked with 5% skimmed
milk or 1% BSA, prepared in wash buffer for 1 hr-2 hr respectively at RT. The membranes were
then incubated with the appropriate concentration of the primary antibody (diluted in 5%
skimmed milk/ 1% BSA) overnight at 4ºC. After washings (3 washings with TBS buffer
containing 0.1% Tween-20 for 15 min each), the membranes were incubated with the appropriate
secondary antibody conjugated to horseradish peroxidase (HRPO) diluted in 5% skimmed milk/
1% BSA for 1 hr at RT. After washing off the excess of the secondary antibody, the protein
bands were detected by enhanced chemiluminescence (ECL; Amersham, U.K.) detection kit.
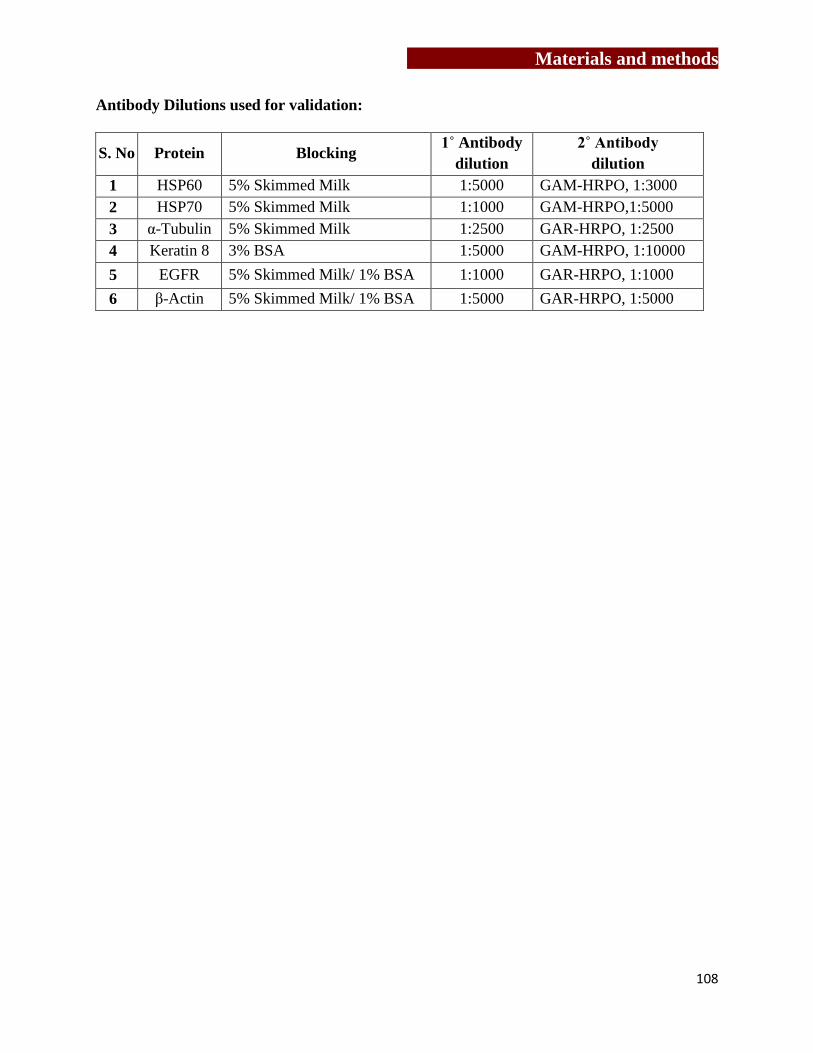
Materials and methods
108
Antibody Dilutions used for validation:
S. No Protein Blocking 1˚ Antibody
dilution
2˚ Antibody
dilution
1 HSP60 5% Skimmed Milk 1:5000 GAM-HRPO, 1:3000
2 HSP70 5% Skimmed Milk 1:1000 GAM-HRPO,1:5000
3 α-Tubulin 5% Skimmed Milk 1:2500 GAR-HRPO, 1:2500
4 Keratin 8 3% BSA 1:5000 GAM-HRPO, 1:10000
5 EGFR 5% Skimmed Milk/ 1% BSA 1:1000 GAR-HRPO, 1:1000
6 β-Actin 5% Skimmed Milk/ 1% BSA 1:5000 GAR-HRPO, 1:5000

Results-I
109
Chapter 4
To investigate the effect of γδ T cells on
osteoclastogenesis

Results-I
110
Results-I
111
Bone appears to be static in nature, but it is a dynamic structure which undergoes
continuous remodeling and is under the tight control of osteoblasts and osteoclasts. Under
normal conditions, osteoclasts and osteoblasts work in coordinated manner to maintain normal
bone physiology, while their imbalance results in pathological conditions, such as osteoporosis,
rheumatoid arthritis (RA), Paget’s disease and osteopetrosis. Skeletal system shares a number of
cytokines, chemokines, signaling molecules and transcription factors with immune cells and
tumor cells [44,251,252] . Metastasized tumor cells also interrupt the normal bone metabolism
by releasing factors which induce differentiation and activation of osteoclasts [43]. It has also
been reported that cytokines secreted by lymphocytes present in the bone microenvironment
affect bone metabolism [253]. Investigations are focused on understanding how conventional T
lymphocytes interact with osteoclasts and influence their function.
Aminobisphosphonates and anti-RANKL therapies are used to treat patients with
bone metastasis to reduce the skeletal complications and tumor burden [54,55,56,57].
Aminobisphosphonates (Zoledronate) inhibit fernesyl pyrophosphate synthase (FPPS), a key
enzyme in mevalonate pathway, which results in upregulation of isopentenyl pyrophosphate
(IPP). IPP is consecutively condensed to dimethylallyl diphosphate (DMAPP) for synthesis of
isoprenoids. In eukaryotes, these precursors are generated by mevalonate pathway, while in
eubacteria they are generated by nonmevalonate/ rohmer pathway [254,255]. IPP acts as a potent
activator of γδ T cells and also behaves like a chemoattractant for γδ T cells [256]. Bromohydrin
pyrophosphate (BrHPP) or phosphostim (synthetic analogs of IPP) and picostim (synthetic
analog of (E)-4-Hydroxy-3-methyl-but-2-enyl pyrophosphate, an intermediate molecule in
bacterial non-mevalonate or rohmar pathway) acts as potent activators of γδ T cells.
Results-I
112
The objective of the present study was to have a comparative analysis of
“activated” and “freshly isolated” γδ T cells with respect to their phenotype, activation markers
and effect on generation and function of osteoclasts.
4.1) Analysis of activation markers on γδ T cells
4.1.1) γδ T cell separation
Peripheral blood mononuclear cells (PBMCs) were separated from 20ml
heparinized blood by ficoll hypaque density gradient centrifugation method. γδ T cells were
immunomagnetically separated from PBMCs using TCRγ/δ+ T Cell isolation kit (Milteney
Biotech) as per the kit instructions (Materials and method, section 3.6.2.2). Figure 9 gives a
schematic representation of isolation of γδ T cells directly from freshly isolated PBMCs and
from αCD3/CD28+rhIL2 expanded PBMCs. Hereafter, γδ T cells, directly separated from
PBMCs would be termed as “freshly isolated” γδ T cells, while those separated from
αCD3/CD28+rhIL2 expanded PBMCs (materials and methods section 3.6.2.1) would be termed
as “activated” γδ T cells.
As shown in Table 3, recovery of “freshly isolated” γδ T cells ranged from
0.3x10⁶ to 8.9x10
6 cells (mean+SEM, 3.5±1.5 x10
6) with starting population of PBMCs ranging
from 40.1x10⁶ to 180.6x10
6 cells (mean+SEM, 100.8±27.6x10
6). The mean percent recovery of
“freshly isolated” γδ T cells was 3.2+0.4%. Similarly, expansion of “activated” γδ T cells ranged
from 2.1x10⁶ to 13.2x10
6 (mean+SEM, 5.7±2.9 x10
6) from starting population of 10x10
6
PBMCs (Table 4). Over the period of 12 days, expansion of PBMCs ranged from 79.2x10⁶ to
217.5x10⁶ cells with mean+SEM of 131.5± 39.4 x10
6 cells. The percent yield of “activated” γδ T
cells was 4.1 ± 0.4%. The purity of the separated γδ T cells (freshly isolated and activated γδ T

Results-I
113
cells) was evaluated by flow cytometry and populations showing more than 95% purity were
used for further experiments (Figure 9).

Results-I
114
Figure 9: Immunomagnetic separation of “freshly isolated” and “activated” γδ T cells
A prototype experiment of isolation if γδ T cells from peripheral blood is described. PBMCs
were separated on Ficoll Hypaque density gradient [A] or were expanded using αCD3/CD28
(1µg) +rhIL2 (30IU) for 12 days [D]. γδ T cells were immunomagnetically purified from
PBMCs directly using anti γδ TCR hapten tagged antibody were termed as “freshly isolated” γδ
T cells [B] and those which were purified from expanded PBMCs were termed as “activated γδ
T cells” [E]. Purity of freshly isolated γδ T cells (98.2%) [C] and “activated γδ T cells” (96.4%)
[F] was assessed by flow cytometry.
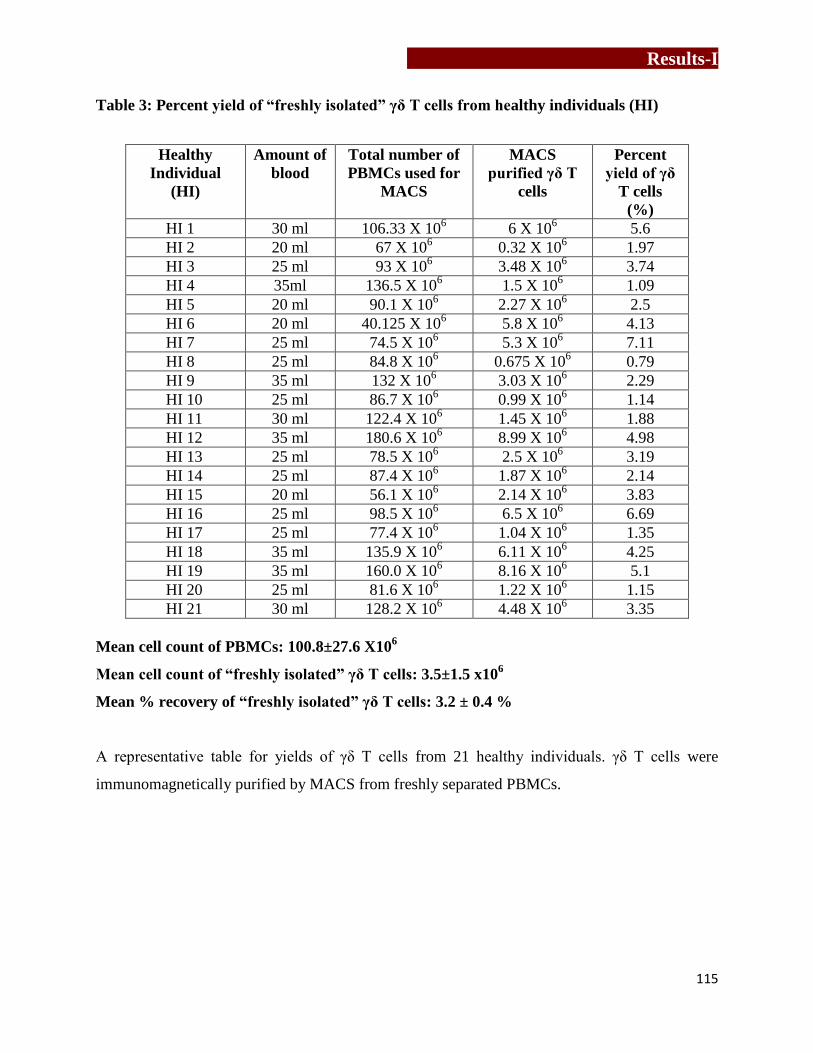
Results-I
115
Table 3: Percent yield of “freshly isolated” γδ T cells from healthy individuals (HI)
Healthy
Individual
(HI)
Amount of
blood
Total number of
PBMCs used for
MACS
MACS
purified γδ T
cells
Percent
yield of γδ
T cells
(%)
HI 1 30 ml 106.33 X 10⁶ 6 X 10
6 5.6
HI 2 20 ml 67 X 106 0.32 X 10
6 1.97
HI 3 25 ml 93 X 106 3.48 X 10
6 3.74
HI 4 35ml 136.5 X 10⁶ 1.5 X 10
6 1.09
HI 5 20 ml 90.1 X 10⁶ 2.27 X 10
6 2.5
HI 6 20 ml 40.125 X 10⁶ 5.8 X 10
6 4.13
HI 7 25 ml 74.5 X 10⁶ 5.3 X 10
6 7.11
HI 8 25 ml 84.8 X 10⁶ 0.675 X 10
6 0.79
HI 9 35 ml 132 X 106 3.03 X 10
6 2.29
HI 10 25 ml 86.7 X 10⁶ 0.99 X 10
6 1.14
HI 11 30 ml 122.4 X 10⁶ 1.45 X 10
6 1.88
HI 12 35 ml 180.6 X 10⁶ 8.99 X 10
6 4.98
HI 13 25 ml 78.5 X 10⁶ 2.5 X 10
6 3.19
HI 14 25 ml 87.4 X 10⁶ 1.87 X 10
6 2.14
HI 15 20 ml 56.1 X 10⁶ 2.14 X 10
6 3.83
HI 16 25 ml 98.5 X 10⁶ 6.5 X 10
6 6.69
HI 17 25 ml 77.4 X 10⁶ 1.04 X 10
6 1.35
HI 18 35 ml 135.9 X 10⁶ 6.11 X 10
6 4.25
HI 19 35 ml 160.0 X 10⁶ 8.16 X 10
6 5.1
HI 20 25 ml 81.6 X 10⁶ 1.22 X 10
6 1.15
HI 21 30 ml 128.2 X 10⁶ 4.48 X 10
6 3.35
Mean cell count of PBMCs: 100.8±27.6 X10⁶
Mean cell count of “freshly isolated” γδ T cells: 3.5±1.5 x10⁶
Mean % recovery of “freshly isolated” γδ T cells: 3.2 ± 0.4 %
A representative table for yields of γδ T cells from 21 healthy individuals. γδ T cells were
immunomagnetically purified by MACS from freshly separated PBMCs.

Results-I
116
Table 4: Percent yield of “activated” γδ T cells from healthy individuals (HI)
Healthy
Individual
(HI)
PBMCs
seeded on
Day 1
Total ex vivo
expanded PBMCs
on Day 12
MACS
purified γδ T
cells
Percent yield
of γδ T cells
(%)
HI 22 10 X 106 122.1 X 10
6 4.2 X 10
6 3.5
HI 23 10 X 106 217.5 X 10
6 13.2 X 10
6 6.1
HI 24 10 X 106 101.5 X 10
6 3.104 X 10
6 3.06
HI 25 10 X 106 130.3 X 10
6 5.5 X 10
6 4.28
HI 26 10 X 106 165 X 10
6 8.5 X 10
6 5.16
HI 27 10 X 106 99.5 X 10
6 2.25 X 10
6 2.28
HI 28 10 X 106 132.0 X 10
6 4.7 X 10
6 3.32
HI 29 10 X 106 125 X 10
6 5.4 X 10
6 4.32
HI 30 10 X 106 175 X 10
6 6.3 X 10
6 3.6
HI 31 10 X 106 79.2 X 10
6 3.2 X 10
6 4.16
HI 32 10 X 106 115.1 X 10
6 2.4 X 10
6 2.12
HI 33 10 X 106 147.3 X 10
6 7.79 X 10
6 5.3
HI 34 10 X 106 123.0X 10
6 4.4 X 10
6 3.58
HI 35 10 X 106 157.3 X 10
6 13 X 10
6 8.32
HI 36 10 X 106 83.1 X 10
6 2.1 X 10
6 2.5
Mean cell count of PBMCs: 131.5 ± 39.4 x10
6
Mean cell count of “activated” γδ T cells: 5.7±2.9 x10⁶
Mean % recovery of “activated” γδ T cells: 4.1 ± 0.4%
A representative table for yields of “activated” γδ T cells of healthy individuals from 15 γδ T cell
lines established as shown. PBMCs were stimulated with solid phase αCD3/CD28 for 12 days
and γδ T cells were immunomagnetically purified by MACS after 12 days of coculture.

Results-I
117
4.1.2) Expression of activation markers (CD69, CD25 and RANKL) on γδ T cells
Expression of activation markers [CD69, CD25 and RANKL/CD254] on γδ T
cells were analyzed by stimulating these cells with αCD3/CD28, phosphoantigens [IPP, BrHPP
and Picostim] or aminobisphosphonate (Zoledronate) in the presence of rhIL2. IPP (synthetic
analog is BrHPP) is an intermediate molecule in eukaryotic mevalonate pathway, while HMBPP
(synthetic analog is picostim) is an intermediate molecule in bacterial rohmer pathway/non-
mevalonate pathway.
Purified (“freshly isolated”) γδ T cells were either left unstimulated (control) or
were stimulated with rhIL2 alone or a combination of αCD3/CD28+rhIL2, IPP+rhIL2,
BrHPP+rhIL2, Picostim+rhIL2 and Zoledronate+rhIL2 for 24 hrs. As shown in Figure 10, in an
unstimulated state “freshly isolated” γδ T cells showed lower levels of CD69 (5.04%, MFI=126),
CD25 (2.48%, MFI=103) and RANKL (1.72%, MFI=41.4). Upon stimulation with rhIL2 for 24
hrs, increase in the expression of CD69 (29.2%, MFI=295), CD25 (9.10% MFI=354) and
RANKL (3.79%, MFI=81.3) was observed. “Freshly isolated” γδ T cells stimulated with
αCD3/CD28+rhIL2 showed markedly higher levels of CD69 (39.8%, MFI = 344), CD25
(13.2%, MFI = 512) and RANKL (7.38%, MFI=106) as compared to unstimulated and rhIL2
stimulated γδ T cells. Stimulation of “freshly isolated” γδ T cells with IPP+rhIL2 or
BrHPP+rhIL2 showed markedly higher levels of CD69 (44.1%, MFI=392 and 52.4%, MFI=335
respectively), CD25 (20.9%, MFI=834 and 18.3%, MFI=677 respectively) and RANKL (7.79%,
MFI=114 and 9.49%, MFI=77.6 respectively) as compared to unstimulated and rhIL2 stimulated
γδ T cells. Further stimulation of “freshly isolated” γδ T cells with picostim+rhIL2 showed
significant increase in expression of early activation marker CD69 (86.2%, MFI=624) along with
late activation marker CD25 (52.7%, MFI=1916) and RANKL (22.7%, MFI=300). Zoledronate

Results-I
118
+rhIL2 stimulation of “freshly isolated” γδ T cells showed remarkable increase in expression of
CD69 (92.7%, MFI=1092), CD25 (19.5%, MFI=736) and RANKL (23%, MFI=260).
Expression of these markers was also analyzed on “γδ T cells” in PBMCSs which
were stimulated with αCD3/CD28 + rhIL2, BrHPP + rhIL2 and Zoledronate+rhIL2 for 12 days.
As shown in Figure 11, unstimulated PBMCs (Day 0) showed lower expression levels of CD69
(3.62% [percent positive], MFI=72.5[mean fluorescent intensity]), CD25 (16.2%, MFI=405) and
RANKL (4.06%, MFI=115) on gated γδ T cells. However, a marked increase in expression of
CD25 and RANKL was observed on γδ T cells upon stimulation of PBMCs with
αCD3/CD28+rhIL2 (100%, MFI=134,379 and 53.5%, MFI=641 respectively) or BrHPP+rhIL2
(99.1%, MFI=17,740 and 36.4%, MFI = 654 respectively) for 12 days. Almost all γδ T cells
were positive for CD25 expression after stimulation, indicating that these cells were in highly
activated state. Expression of CD69 (early activation marker) on γδ T cells was found marginal
changed upon stimulation of PBMCs with αCD3/CD28 + rhIL2 (0.9%, MFI=−714) and BrHPP
+ rhIL2 (2.82%, MFI=211) for 12 days compared to unstimulated PBMCs (3.62%, MFI=72.5).
Upon stimulation of PBMCS with Zoledronate+rhIL2, a remarkable increase in expression of
CD25 (99.6%, MFI=43425) and RANKL (15.7%, MFI=273) was observed along with reduced
expression of CD69 (0.36%, MFI=51.4) expression.
Figure 12 shows comparative analysis of percentage of “freshly isolated” and
“activated” γδ T cells expressing CD69, CD25 and RANKL, among PBMCs stimulated with
rhIL2 alone or in combination of rhIL2 with αCD3/CD28, BrHPP and Zoledronate. It was
observed that, “freshly isolated” γδ T cells showed upregulation of early activation marker CD69
upon stimulation with rhIL2 alone or in combination with αCD3/CD28, BrHPP and Zoledronate.
Similarly, “activated” γδ T cells upon stimulation with rhIL2 alone or in combination with

Results-I
119
αCD3/CD28 and BrHPP showed increased expression of CD25 and RANKL compared to
“freshly isolated” γδ T cells.
Thus on the basis of expression of activation markers (CD69, CD25 and RANKL)
γδ T cells were considered as “non-activated” (freshly isolated) and “activated” (isolated from
αCD3/CD28 + rhIL2 stimulated PBMCs) γδ T cells.
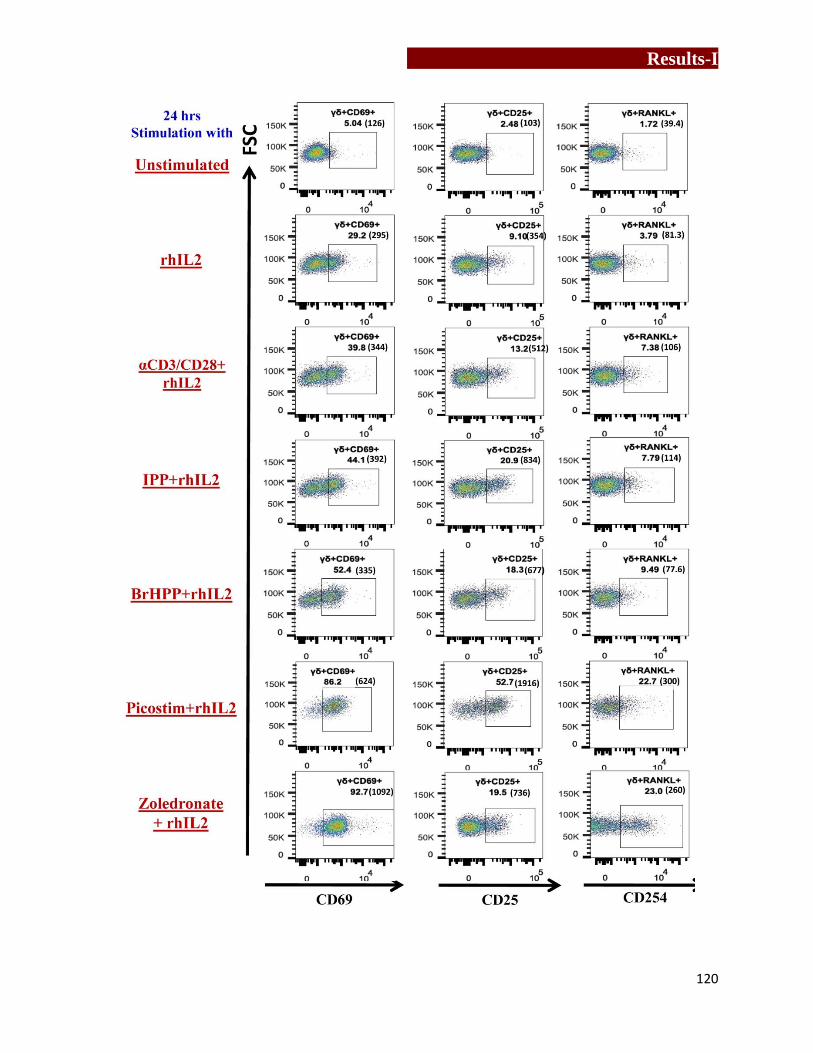
Results-I
120
Results-I
121
Figure 10: Analysis of activation markers (CD69, CD25, and RANKL) on “freshly isolated
(FI)” γδ T cells
Expression of activation markers (CD69, CD25, and RANKL) was analyzed on “freshly isolated/
purified” γδ T cells, which were stimulated with rhIL2 alone, αCD3/CD28+rhIL2, IPP+rhIL2,
BrHPP+rhIL2, picostim+rhIL2, Zoledronate+rhIL2 or left unstimulated (medium alone) for
24hrs. After 24hrs, “freshly isolated” γδ T cells were stained using γδ-APC, CD69-FITC, CD25-
PeCy7, and RANKL-PE. The gating strategy used was as follows: Lymphocytes were gated
based on their forward and side scatter. Depending on the fluorescence intensity of γδ-APC, γδ T
cells were gated. Further percentages of γδ T cells expressing CD69, CD25 and RANKL were
analyzed on gated γδ T cells. The gates have been set according to only cell controls for
respective stimulation. (Representative figure of three independent experiments.)
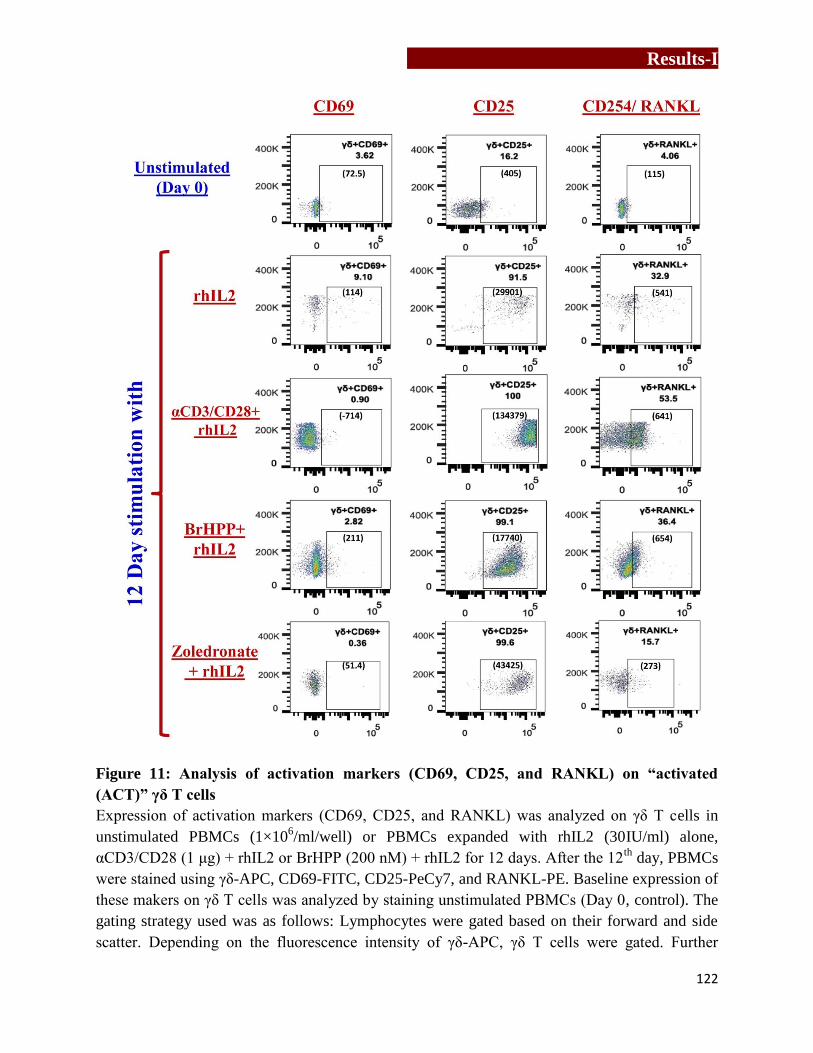
Results-I
122
Figure 11: Analysis of activation markers (CD69, CD25, and RANKL) on “activated
(ACT)” γδ T cells
Expression of activation markers (CD69, CD25, and RANKL) was analyzed on γδ T cells in
unstimulated PBMCs (1×10⁶/ml/well) or PBMCs expanded with rhIL2 (30IU/ml) alone,
αCD3/CD28 (1 μg) + rhIL2 or BrHPP (200 nM) + rhIL2 for 12 days. After the 12th
day, PBMCs
were stained using γδ-APC, CD69-FITC, CD25-PeCy7, and RANKL-PE. Baseline expression of
these makers on γδ T cells was analyzed by staining unstimulated PBMCs (Day 0, control). The
gating strategy used was as follows: Lymphocytes were gated based on their forward and side
scatter. Depending on the fluorescence intensity of γδ-APC, γδ T cells were gated. Further
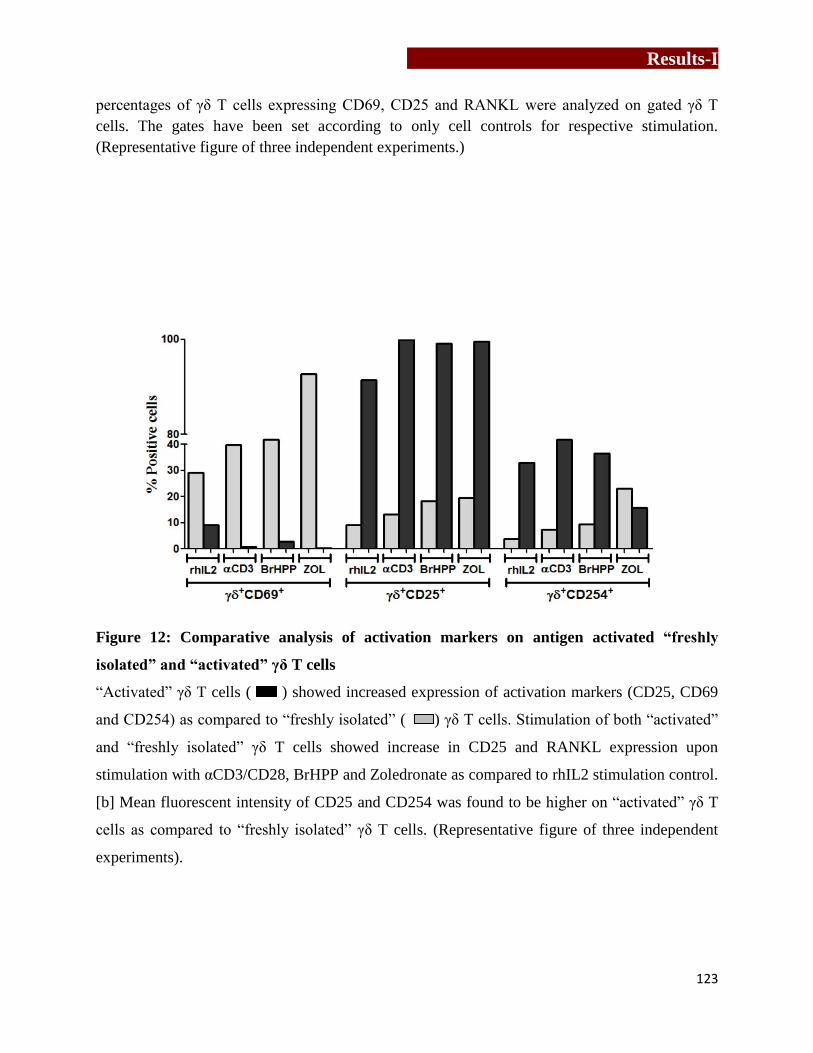
Results-I
123
percentages of γδ T cells expressing CD69, CD25 and RANKL were analyzed on gated γδ T
cells. The gates have been set according to only cell controls for respective stimulation.
(Representative figure of three independent experiments.)
Figure 12: Comparative analysis of activation markers on antigen activated “freshly
isolated” and “activated” γδ T cells
“Activated” γδ T cells ( ) showed increased expression of activation markers (CD25, CD69
and CD254) as compared to “freshly isolated” ( ) γδ T cells. Stimulation of both “activated”
and “freshly isolated” γδ T cells showed increase in CD25 and RANKL expression upon
stimulation with αCD3/CD28, BrHPP and Zoledronate as compared to rhIL2 stimulation control.
[b] Mean fluorescent intensity of CD25 and CD254 was found to be higher on “activated” γδ T
cells as compared to “freshly isolated” γδ T cells. (Representative figure of three independent
experiments).

Results-I
124
4.2) Effect of γδ T cells on human osteoclastogenesis
4.2.1) Generation and characterization of mouse osteoclasts
For standardization of osteoclast generation and functional assays, mouse osteoclasts were
generated from [a] mouse macrophage cell line (RAW 264.7) and [b] osteoclast precursor cells
isolated from bone marrow of Swiss CRL or C57BL6 mice. Osteoclasts are multinucleated cells,
formed by fusion of monocyte/ macrophage cells. Osteoclast precursor cells (monocytes/
macrophages) are cultured in the presence of macrophage colony stimulating factor (MCSF) and
receptor activator of nuclear factor kappa B ligand (RANKL). MCSF is essential for survival and
fusion of the precursor cells and RANKL plays a pivotal role in osteoclast differentiation. MCSF
binds to cFms or MCSF receptor on osteoclast precursor cell and activates Akt signaling
pathway [257]. RANKL upon binding to RANK activates NFκB [258], which further transcribes
osteoclast specific genes like cathepsin K, tartarate resistant acid phosphatase (TRAP),
vitronectin receptor (αVβ3) and mature osteoclast are generated.
4.2.2.1) From mouse macrophage cell line RAW 264.7
RAW 264.7 is a mouse macrophage cell line that was established from a tumor induced
by albeson murine leukemia virus in adult BALB/c mice and is adherent in nature. RAW 264.7
cells are characterized by neutral red pinocytosis assay, where lipopolysaccharide (LPS)
stimulated cells pinocytose neutral red. As shown in Figure 13, LPS stimulated RAW 264.7 cells
showed active uptake of neutral red dye. This was quantitated by lysing the cells in ethanol:
acetic acid (1:1, v/v). The optical density (OD) of the lysate was measured at 570nm. Increase in
OD indicated the uptake of neutral red by RAW 264.7 cells, which is the characteristic of
macrophage cell line.

Results-I
125
RAW 264.7 cells were then used to generate mouse osteoclasts. RAW 264.7 cells (3x10⁵)
were cultured in αMEM containing rmRANKL (100ng/ml) for 7 days with intermediate feeding
after every 3rd
day. After 7 days, mature osteoclasts were characterized by staining them for
TRAP (tartarate resistant acid phosphatase) using Leukocyte Acid Phosphatase kit (material and
method section 3.7.4). In brief, TRAP catalyses conversion of napthol AS-BI phosphoric acid to
napthol AS-BI in presence of tartarate. This napthol AS-BI forms complex with fast garnet-GBC
generating maroon colored deposits. Thus, osteoclasts can be visualized due to generation of
stained with characteristic maroon color. Multinucleated (>3 nuclei), TRAP-positive cells were
considered as mature osteoclasts (Figure 13).
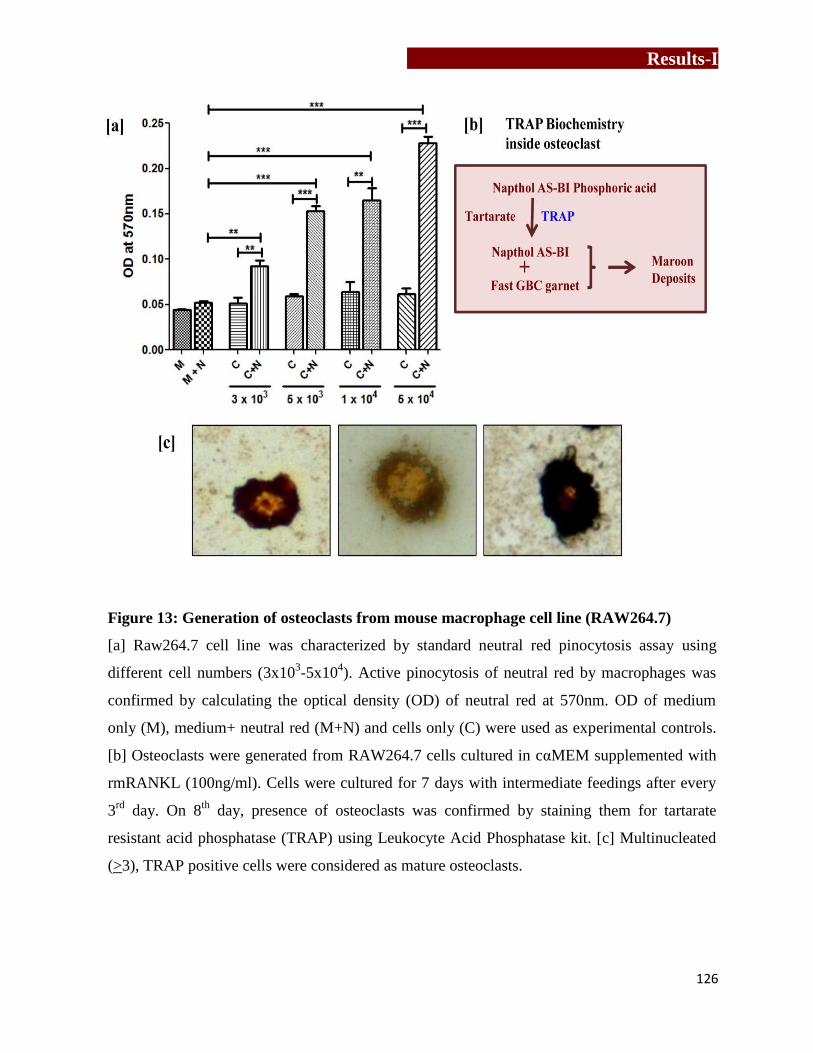
Results-I
126
Figure 13: Generation of osteoclasts from mouse macrophage cell line (RAW264.7)
[a] Raw264.7 cell line was characterized by standard neutral red pinocytosis assay using
different cell numbers (3x10³-5x10
4). Active pinocytosis of neutral red by macrophages was
confirmed by calculating the optical density (OD) of neutral red at 570nm. OD of medium
only (M), medium+ neutral red (M+N) and cells only (C) were used as experimental controls.
[b] Osteoclasts were generated from RAW264.7 cells cultured in cαMEM supplemented with
rmRANKL (100ng/ml). Cells were cultured for 7 days with intermediate feedings after every
3rd
day. On 8th
day, presence of osteoclasts was confirmed by staining them for tartarate
resistant acid phosphatase (TRAP) using Leukocyte Acid Phosphatase kit. [c] Multinucleated
(>3), TRAP positive cells were considered as mature osteoclasts.

Results-I
127
4.2.2.2) From bone marrow osteoclast precursor cells
Generation of mouse osteoclast culture was standardized using bone marrow cells from two
mice models: Swiss CRL and C57BL6. 6-8 week old Swiss CRL or C57BL6 mouse was
sacrificed and femurs were collected. Bone marrow cells (BMCs) were aspirated from femurs
and were cultured in cαMEM (30x106 cells/5ml) supplemented with rmMCSF (10ng/ml) for 24
hrs. This aided separation of adherent stromal cells from non-adherent osteoclast precursor cells
(OPCs) and induction of OPCs from monocytes/macrophages. After 24 hrs, OPCs were
collected and cultured in cαMEM (1x10⁵
cells/200μl) containing rmMCSF (30ng/ml) and
rmRANKL (30ng/ml) for 7 days on sterile thermanox coverslips in 96 well flat bottom plate.
Every 3rd
day, the cells were fed with rmMCSF and rmRANKL. On 8th
day, the cultures were
terminated and osteoclasts were characterized by staining them for TRAP. As shown in Figure
14, multinucleated (>3 nuclei) TRAP-positive osteoclasts were considered as mature
osteoclasts. It was observed that osteoclasts generated from C57BL6 mice showed more
multinucleation as compared to osteoclasts generated from Swiss CRL mice. These experiments
helped us to standardize protocols for generation and characterization of human osteoclasts.

Results-I
128
Figure 14: Generation of mouse osteoclasts from bone marrow precursor cells
6-8 week old Swiss CRL or C57BL6 mouse [a] was sacrificed and bone marrow cells (BMCs)
were aspirated from femurs [b]. BMCs were cultured in cαMEM (30x106 cells/5ml)
supplemented with 10ng/ml rmMCSF for 24 hrs [c]. After 24 hrs, nonadherent osteoclast
precursor cells (OCPs) were collected, washed and cultured in rmRANKL (30ng/ml) and
rmMCSF (30ng/ml) containing cαMEM (1x10⁵
cells/200μl) on sterile thermanox coverslips
placed in 96 well flat bottom plate. The cells were cultured for 7 days with intermediate feeding
after every 3rd
day [d]. On 8th
day, generation of osteoclasts was confirmed by staining them for
TRAP. Multinucleated (>3) TRAP positive cells were considered as mature osteoclasts.
Osteoclasts were generated form BMCs of Swiss CRL mice [e] and C57BL6 mice [f].
Henceforth, all the experiments were carried out using human osteoclasts generated form CD14+
precursor cells
Results-I
129
4.2.3) Generation and characterization of human osteoclasts
CD14+ cells were immunomagnetically separated from PBMCs using CD14
+ cell separation kit
(Milteney Biotech, Germany) as per the kit instructions and separated population showing >95%
purity were used for experiments (Figure 15). As discussed in Table 5, average yield of CD14+
cells from PBMCs ranged from 1.31x10⁶ to 11.3x10
6 (mean+SEM, 5.8+0.6x10
6) with starting
population of PBMCs ranging from 35.6x10⁶ to 168.1x10
6 (mean+SEM, 97.5+8.4x10
6). Human
osteoclasts were generated from CD14+
cells (monocytes) in the presence of rhMCSF (30ng/ml)
and rhRANKL (40ng/ml) on thermanox coverslips in 96 well plate over the period of 21 days,
with intermediate feedings on every 3rd
day. On 21st day, mature osteoclasts were characterized
by staining them for expression of vitronectin receptor (αVβ3 integrin) using monoclonal
antibody for CD51/61(23c6) and TRAP staining. Multinucleated (>3 nuclei) TRAP positive cells
were considered as mature osteoclasts (Figure 16a). Human osteoclasts form characteristic F-
actin ring, which was analyzed by staining the osteoclasts with Phalloidin-TRITC (Figure 16b).
Mature human osteoclasts were also characterized for their function i.e. bones resorption on
Osteoclast Activity Assay Substrate (OAAS), which is a synthetic calcium phosphate coated
substrate (Figure 16c). Like human osteoclasts, activated macrophages also express TRAP [259].
As macrophages differentiate into osteoclasts, αVβ5 integrins expressed by macrophages gets
replaced with αVβ3. Hence αVβ3 (vitronectin receptor) positivity was used to differentiate
osteoclasts from multinucleated macrophages (Figure 17a and 17b).
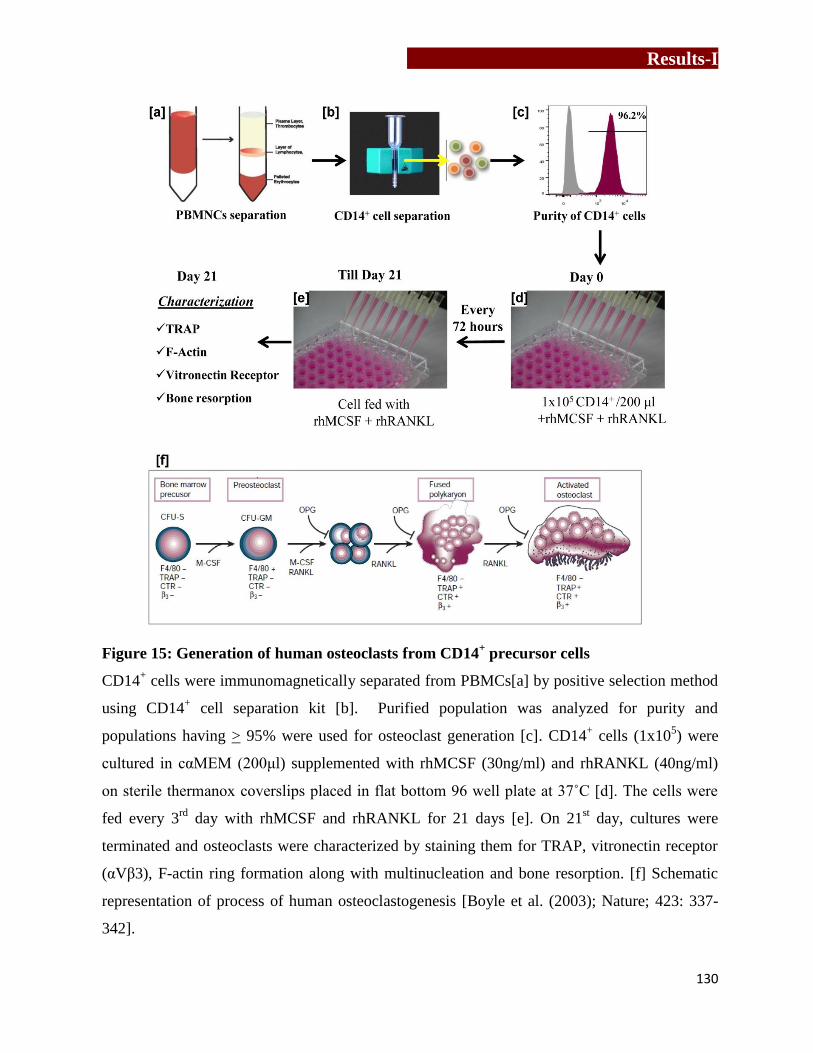
Results-I
130
Figure 15: Generation of human osteoclasts from CD14+ precursor cells
CD14+ cells were immunomagnetically separated from PBMCs[a] by positive selection method
using CD14+ cell separation kit [b]. Purified population was analyzed for purity and
populations having > 95% were used for osteoclast generation [c]. CD14+ cells (1x10
5) were
cultured in cαMEM (200μl) supplemented with rhMCSF (30ng/ml) and rhRANKL (40ng/ml)
on sterile thermanox coverslips placed in flat bottom 96 well plate at 37˚C [d]. The cells were
fed every 3rd
day with rhMCSF and rhRANKL for 21 days [e]. On 21st day, cultures were
terminated and osteoclasts were characterized by staining them for TRAP, vitronectin receptor
(αVβ3), F-actin ring formation along with multinucleation and bone resorption. [f] Schematic
representation of process of human osteoclastogenesis [Boyle et al. (2003); Nature; 423: 337-
342].
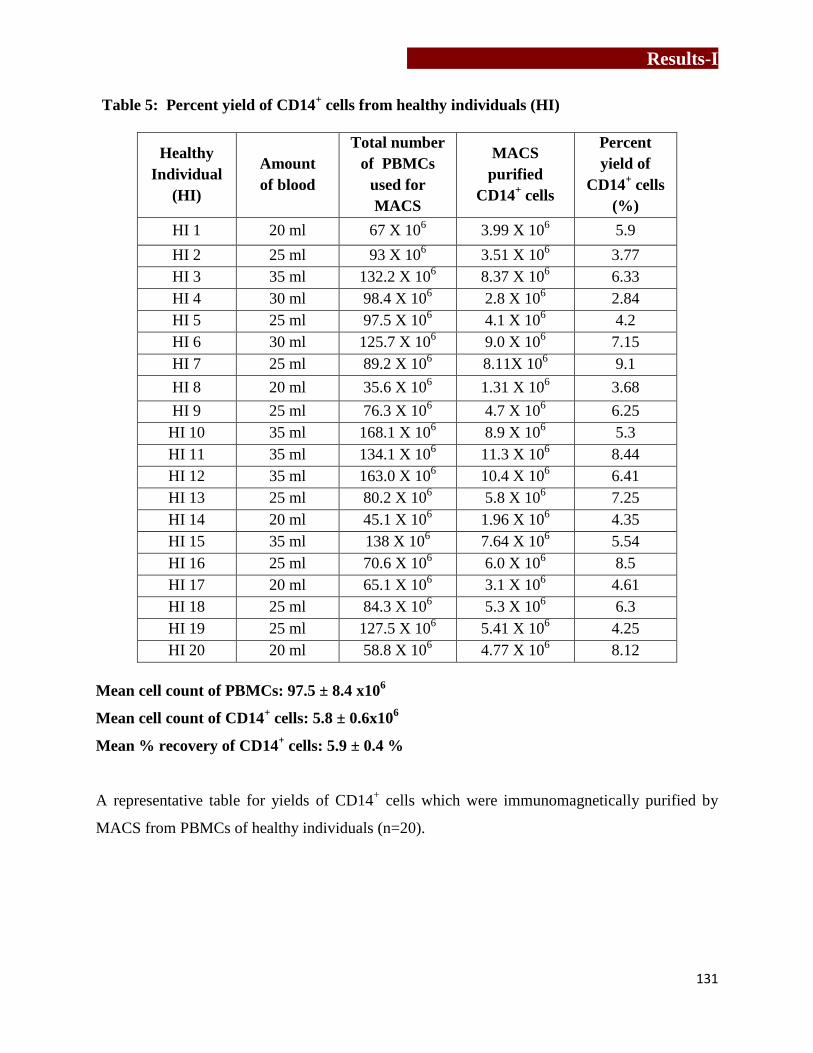
Results-I
131
Table 5: Percent yield of CD14+ cells from healthy individuals (HI)
Healthy
Individual
(HI)
Amount
of blood
Total number
of PBMCs
used for
MACS
MACS
purified
CD14+ cells
Percent
yield of
CD14+ cells
(%)
HI 1 20 ml 67 X 106 3.99 X 10
6 5.9
HI 2 25 ml 93 X 106 3.51 X 10
6 3.77
HI 3 35 ml 132.2 X 10⁶ 8.37 X 10
6 6.33
HI 4 30 ml 98.4 X 10⁶ 2.8 X 10
6 2.84
HI 5 25 ml 97.5 X 10⁶ 4.1 X 10
6 4.2
HI 6 30 ml 125.7 X 10⁶ 9.0 X 10
6 7.15
HI 7 25 ml 89.2 X 10⁶ 8.11X 10
6 9.1
HI 8 20 ml 35.6 X 10⁶ 1.31 X 10
6 3.68
HI 9 25 ml 76.3 X 10⁶ 4.7 X 10
6 6.25
HI 10 35 ml 168.1 X 10⁶ 8.9 X 10
6 5.3
HI 11 35 ml 134.1 X 10⁶ 11.3 X 10
6 8.44
HI 12 35 ml 163.0 X 10⁶ 10.4 X 10
6 6.41
HI 13 25 ml 80.2 X 10⁶ 5.8 X 10
6 7.25
HI 14 20 ml 45.1 X 10⁶ 1.96 X 10
6 4.35
HI 15 35 ml 138 X 106 7.64 X 10
6 5.54
HI 16 25 ml 70.6 X 10⁶ 6.0 X 10
6 8.5
HI 17 20 ml 65.1 X 10⁶ 3.1 X 10
6 4.61
HI 18 25 ml 84.3 X 10⁶ 5.3 X 10
6 6.3
HI 19 25 ml 127.5 X 10⁶ 5.41 X 10
6 4.25
HI 20 20 ml 58.8 X 10⁶ 4.77 X 10
6 8.12
Mean cell count of PBMCs: 97.5 ± 8.4 x10⁶
Mean cell count of CD14+ cells: 5.8 ± 0.6x10
6
Mean % recovery of CD14+ cells: 5.9 ± 0.4 %
A representative table for yields of CD14+ cells which were immunomagnetically purified by
MACS from PBMCs of healthy individuals (n=20).
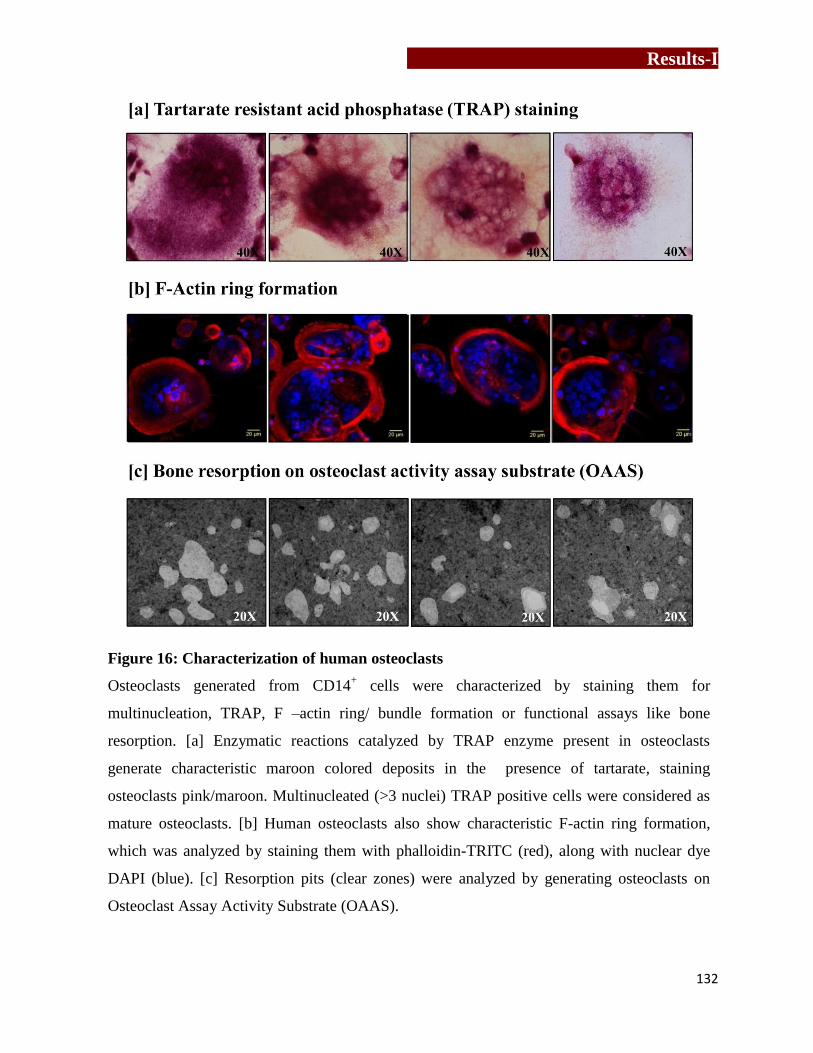
Results-I
132
Figure 16: Characterization of human osteoclasts
Osteoclasts generated from CD14+ cells were characterized by staining them for
multinucleation, TRAP, F –actin ring/ bundle formation or functional assays like bone
resorption. [a] Enzymatic reactions catalyzed by TRAP enzyme present in osteoclasts
generate characteristic maroon colored deposits in the presence of tartarate, staining
osteoclasts pink/maroon. Multinucleated (>3 nuclei) TRAP positive cells were considered as
mature osteoclasts. [b] Human osteoclasts also show characteristic F-actin ring formation,
which was analyzed by staining them with phalloidin-TRITC (red), along with nuclear dye
DAPI (blue). [c] Resorption pits (clear zones) were analyzed by generating osteoclasts on
Osteoclast Assay Activity Substrate (OAAS).

Results-I
133
Figure 17: Differentiation of human osteoclasts from macrophages
CD14+ cells (monocyte/macrophage precursor cells) fuse under the influence of rhMCSF to
form a multinucleated cell, which differentiate in the presence of rhRANKL to mature
osteoclast. Vitronectin receptor positivity was used as a criterion to differentiate human
osteoclasts from human macrophages. [a1] Human macrophages show multinucleation
(DAPI, blue) but no vitronectin receptor (αVβ3 or CD51/61 or 23c6) expression. [a.2] Human
osteoclasts express high levels of vitronectin receptors (CD51/61-AF647, green) along with
multinucleation (DAPI, blue). [b] Representative images of multinucleated osteoclasts
showing vitronectin receptor positivity.
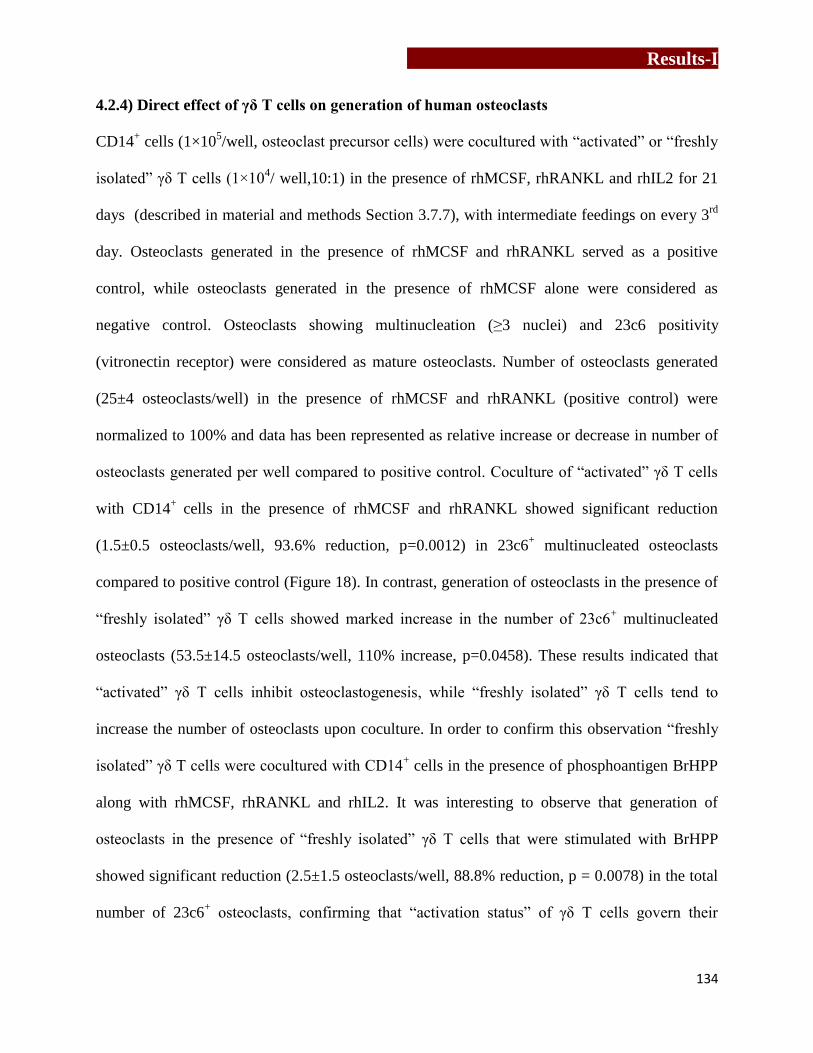
Results-I
134
4.2.4) Direct effect of γδ T cells on generation of human osteoclasts
CD14+ cells (1×10
5/well, osteoclast precursor cells) were cocultured with “activated” or “freshly
isolated” γδ T cells (1×10⁴/ well,10:1) in the presence of rhMCSF, rhRANKL and rhIL2 for 21
days (described in material and methods Section 3.7.7), with intermediate feedings on every 3rd
day. Osteoclasts generated in the presence of rhMCSF and rhRANKL served as a positive
control, while osteoclasts generated in the presence of rhMCSF alone were considered as
negative control. Osteoclasts showing multinucleation (≥3 nuclei) and 23c6 positivity
(vitronectin receptor) were considered as mature osteoclasts. Number of osteoclasts generated
(25±4 osteoclasts/well) in the presence of rhMCSF and rhRANKL (positive control) were
normalized to 100% and data has been represented as relative increase or decrease in number of
osteoclasts generated per well compared to positive control. Coculture of “activated” γδ T cells
with CD14+
cells in the presence of rhMCSF and rhRANKL showed significant reduction
(1.5±0.5 osteoclasts/well, 93.6% reduction, p=0.0012) in 23c6+ multinucleated osteoclasts
compared to positive control (Figure 18). In contrast, generation of osteoclasts in the presence of
“freshly isolated” γδ T cells showed marked increase in the number of 23c6+ multinucleated
osteoclasts (53.5±14.5 osteoclasts/well, 110% increase, p=0.0458). These results indicated that
“activated” γδ T cells inhibit osteoclastogenesis, while “freshly isolated” γδ T cells tend to
increase the number of osteoclasts upon coculture. In order to confirm this observation “freshly
isolated” γδ T cells were cocultured with CD14+ cells in the presence of phosphoantigen BrHPP
along with rhMCSF, rhRANKL and rhIL2. It was interesting to observe that generation of
osteoclasts in the presence of “freshly isolated” γδ T cells that were stimulated with BrHPP
showed significant reduction (2.5±1.5 osteoclasts/well, 88.8% reduction, p = 0.0078) in the total
number of 23c6+ osteoclasts, confirming that “activation status” of γδ T cells govern their

Results-I
135
function to regulate osteoclastogenesis. CD14+ cells cultured in the presence of rhMCSF and
rhRANKL in the presence of rhIL2 (26.5±3.5 osteoclasts/well) or BrHPP+ rhIL2 (28±3
osteoclasts/well) showed osteoclast numbers that were comparable to that observed in positive
control (25±4 osteoclasts/well), indicating that rhIL2 or BrHPP + rhIL2 had no effect on
osteoclast generation.
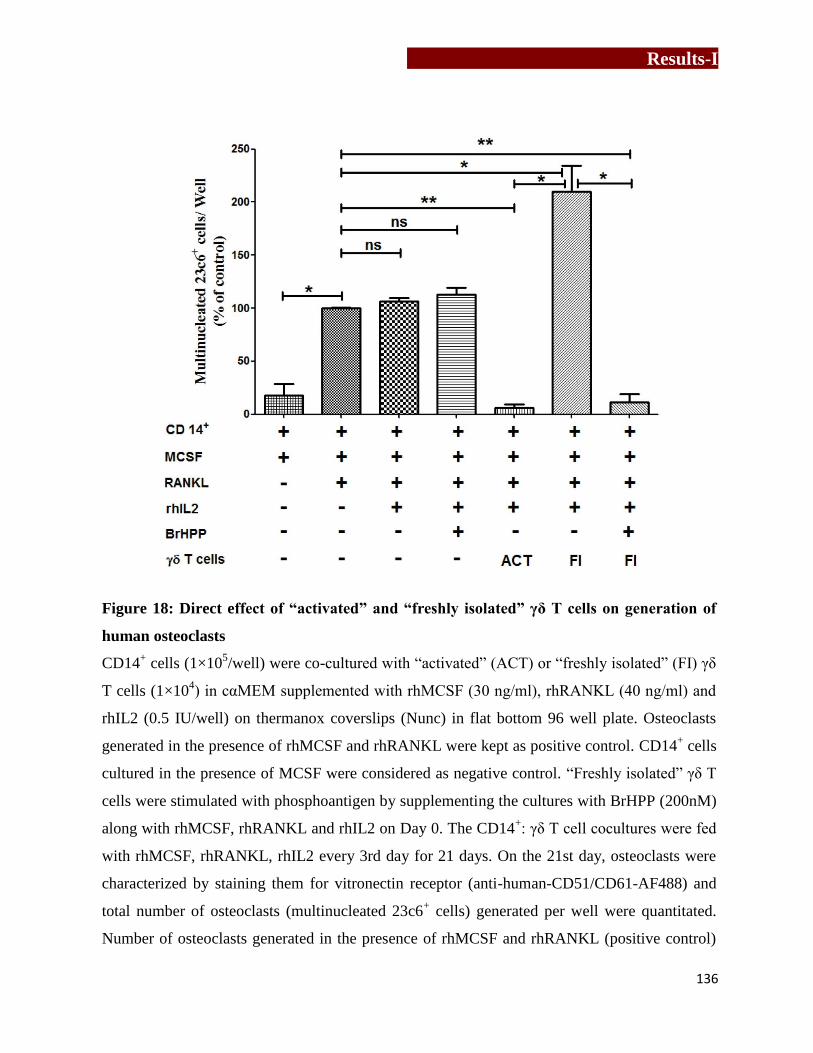
Results-I
136
Figure 18: Direct effect of “activated” and “freshly isolated” γδ T cells on generation of
human osteoclasts
CD14+ cells (1×10
5/well) were co-cultured with “activated” (ACT) or “freshly isolated” (FI) γδ
T cells (1×10⁴) in cαMEM supplemented with rhMCSF (30 ng/ml), rhRANKL (40 ng/ml) and
rhIL2 (0.5 IU/well) on thermanox coverslips (Nunc) in flat bottom 96 well plate. Osteoclasts
generated in the presence of rhMCSF and rhRANKL were kept as positive control. CD14+ cells
cultured in the presence of MCSF were considered as negative control. “Freshly isolated” γδ T
cells were stimulated with phosphoantigen by supplementing the cultures with BrHPP (200nM)
along with rhMCSF, rhRANKL and rhIL2 on Day 0. The CD14+: γδ T cell cocultures were fed
with rhMCSF, rhRANKL, rhIL2 every 3rd day for 21 days. On the 21st day, osteoclasts were
characterized by staining them for vitronectin receptor (anti-human-CD51/CD61-AF488) and
total number of osteoclasts (multinucleated 23c6+ cells) generated per well were quantitated.
Number of osteoclasts generated in the presence of rhMCSF and rhRANKL (positive control)

Results-I
137
were normalized to 100% and data has been represented as relative increase or decrease in
number of osteoclasts generated per well compared to positive control. Three independent
experiments were carried out and the data is represented as mean ± SEM. [p<0.05 (*), p< 0.005
(**), p< 0.0005 (***)].
4.2.5) In vitro bone resorption assay using Osteoclast Activity Assay Substrate (OAAS)
To analyze the effect of soluble factors secreted by γδ T cells on function of osteoclasts (bone
resorption), osteoclasts were cultured in the presence of cell free supernatant of antigen
stimulated γδ T cells. Cell free supernatants were acquired by stimulating “activated” or
“freshly isolated” γδ T cells (5x10⁴) with rhIL2 (0.5IU) alone or in combination with BrHPP
(200nM) for 24 hrs (described below).
OPCs were generated from CD14+ cells (1x10
5) in the presence of rhMCSF and rhRANKL for
12 days on OAAS. From 12th
day onwards, every 3rd
day, the cultures were fed with cell free
supernatants of “activated” or “freshly isolated” γδ T cells, along with rhMCSF and rhRANKL.
Cell free supernatants of rhIL2 or BrHPP+rhIL2 stimulated “activated” (Group 1, 2
respectively) or “freshly isolated” (Group 3, 4 respectively) γδ T cells were added in different
volumes (50μl and 25μl). Baseline resorption observed on OAAS plates by osteoclasts
generated in the presence of rhMCSF and rhRANKL (positive control) and activated
macrophages (negative control, cultured in the presence of rhMCSF only) was also analyzed.
On 21st day, cultures were terminated and functional ability of these osteoclasts was tested on

Results-I
138
OAAS by calculating the total resorbed area (um2) generated in a well. Resorption areas
generated by osteoclasts cultured in the presence of rhMCSF and rhRANKL was normalized to
100% and data has been represented as relative increase or decrease in resorption area compared
to positive control (100%). As shown in Figure 19, addition of cell free supernatants from rhIL2
stimulated “activated” γδ T cells (50μl and 25μl) showed significant reduction in total
resorption area (68%, p=<0.0001 and 55.1%, p=0.01 respectively) compared to positive control
(100%). The baseline resorption by monocytes / macrophages (negative control) was also
calculated and was found negligible. Osteoclasts generated in the presence of cell free
supernatants of BrHPP+rhIL2 stimulated “activated” γδ T cells (50μl and 25μl) also showed
significant reduction in resorption area (67.5%, p=<0.0001 and 32.5%, p=<0.0001 respectively)
as compared to positive control. Simultaneously, the effect of soluble factors secreted by
phosphoantigen stimulated “freshly isolated” γδ T cells were also analyzed on osteoclast
function. As shown in Figure 20, osteoclasts generated in the presence of cell free supernatants
of rhIL2 stimulated “freshly isolated” γδ T cells (50μl and 25μl) showed increase in total
resorption area (307.6%, p=0.02 and 204.7%, p=0.01 respectively) compared to positive
control, indicating their pro-osteoclastogenic effect. Cell free supernatants of BrHPP+rhIL2
stimulated “freshly isolated” γδ T cells also showed increase in resorption area compared to
positive control, although the increase was not statistically significant but it was lesser when
compared to rhIL2 stimulated “freshly isolated” γδ T cells. This clearly indicated that, short
term stimulation of γδ T cells has pro-osteoclastogenic effect, while “activated” γδ T cells have
a better potential to suppress osteoclast generation and function.

Results-I
139
Figure 19: Effect of soluble factors secreted by “activated” γδ T cells on function of human
osteoclasts
Osteoclasts were generated from CD14+ cells (1X10
5/ well) in the presence of rhMCSF
(30ng/ml) and rhRANKL (40ng/ml) for 12 days on osteoclast activity assay substrate (OAAS).
From 12th
day onwards, along with rhMCSF and rhRANKL, the cultures were fed on every 3rd
day with different volumes (50μl and 25μl) of cell free supernatants of “activated” γδ T cells,
which were stimulated with of rhIL2 or BrHPP+rhIL2 for 24 hrs. Osteoclasts generated in the
presence of rhMCSF and rhRANKL were kept as positive control. The cultures were terminated
on 21st day and the area resorbed by mature osteoclasts was calculated using ImageJ software.
Total resorption area generated per well by osteoclasts cultured in the presence of rhMCSF and
rhRANKL (positive control) was normalised to 100% and data has been represented as relative
increase or decrease in resorption area compared to positive control. The data shown is mean +
SEM of three independent experiments. [p<0.05(*), p<0.005(**), p<0.0005(***)].
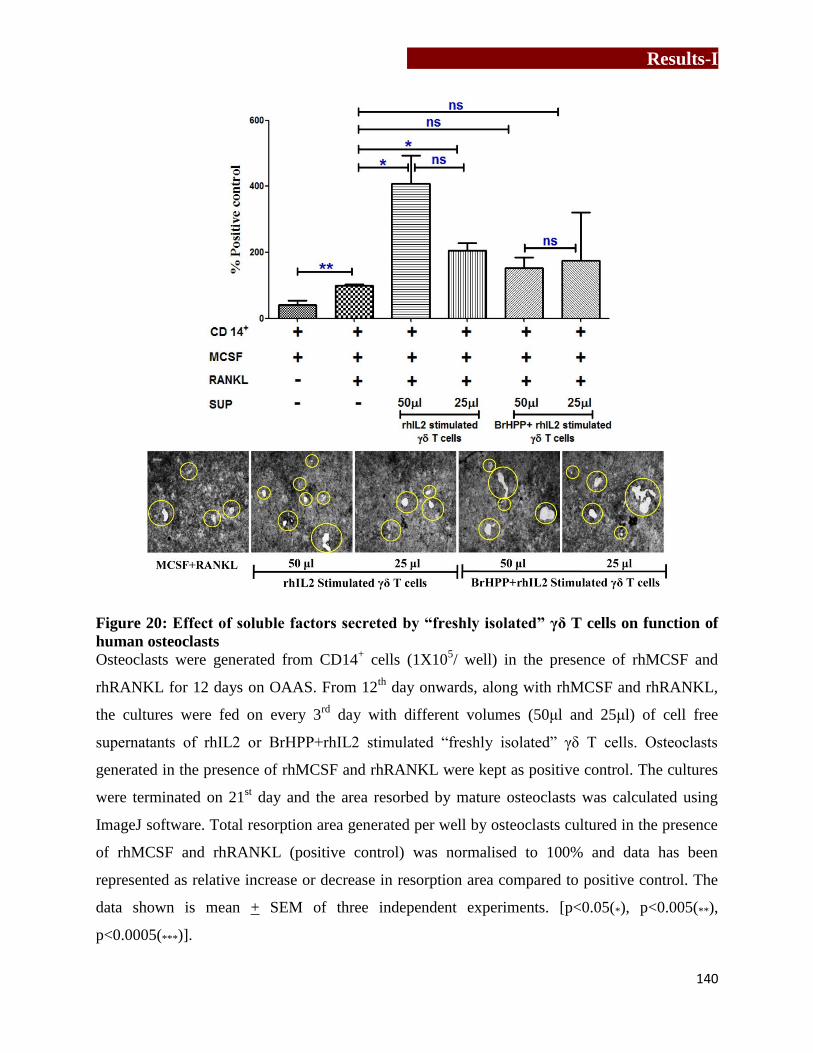
Results-I
140
Figure 20: Effect of soluble factors secreted by “freshly isolated” γδ T cells on function of
human osteoclasts
Osteoclasts were generated from CD14+ cells (1X10
5/ well) in the presence of rhMCSF and
rhRANKL for 12 days on OAAS. From 12th
day onwards, along with rhMCSF and rhRANKL,
the cultures were fed on every 3rd
day with different volumes (50μl and 25μl) of cell free
supernatants of rhIL2 or BrHPP+rhIL2 stimulated “freshly isolated” γδ T cells. Osteoclasts
generated in the presence of rhMCSF and rhRANKL were kept as positive control. The cultures
were terminated on 21st day and the area resorbed by mature osteoclasts was calculated using
ImageJ software. Total resorption area generated per well by osteoclasts cultured in the presence
of rhMCSF and rhRANKL (positive control) was normalised to 100% and data has been
represented as relative increase or decrease in resorption area compared to positive control. The
data shown is mean + SEM of three independent experiments. [p<0.05(*), p<0.005(**),
p<0.0005(***)].

Results-I
141
4.3) Cytokine profiling of cell free supernatants of antigen activated γδ T cells
Cell free supernatants were collected from “activated” (ACT) and “freshly
isolated” (FI) γδ T cells. The various groups are described below. “Activated” and “freshly
isolated” γδ T cells were either left unstimulated (medium only, control 1 and control 2
respectively) or were stimulated with rhIL2 alone (Group 1 and Group 4 respectively), BrHPP +
rhIL2 (Group 2 and Group 5 respectively) and Zoledronate (Group 3 and Group 6 respectively).
Cell free supernatants of these cells were collected and analyzed for Th1/Th2/Th17 cytokines by
CBA, as described in Materials and methods section 3.9.
Analysis of cell free supernatants of “activated” and “freshly isolated” γδ T cells
in the unstimulated control group interestingly showed significant differences in levels of two
cytokines- IL6 (pro-osteoclastogenic) and IFNγ (anti-osteoclastogenic) compared to other
cytokines (Table 6). As shown in Figure 21, in an unstimulated state, “freshly isolated” γδ T
cells showed higher levels of IL6 (Mean ± SEM 2318 ± 471 pg/ml), while “activated” γδ T cells
showed significantly (P=0.005) lower levels of IL6 (1.9±0.3 pg/ml). Comparison of IFNγ levels
showed that, “freshly isolated” γδ T cells secreted very low (3.2±0.27 pg/ml) levels of IFNγ,
while “activated” γδ T cells showed significantly (p=0.008) higher levels of IFNγ (274.1±111.2
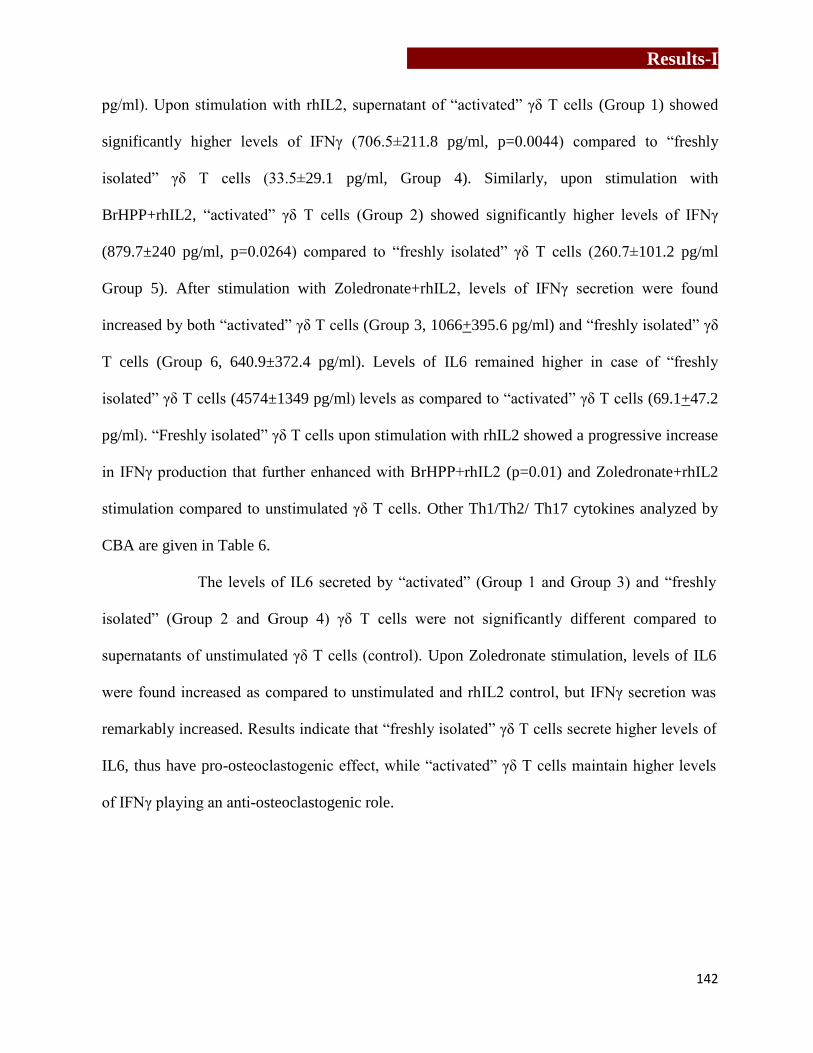
Results-I
142
pg/ml). Upon stimulation with rhIL2, supernatant of “activated” γδ T cells (Group 1) showed
significantly higher levels of IFNγ (706.5±211.8 pg/ml, p=0.0044) compared to “freshly
isolated” γδ T cells (33.5±29.1 pg/ml, Group 4). Similarly, upon stimulation with
BrHPP+rhIL2, “activated” γδ T cells (Group 2) showed significantly higher levels of IFNγ
(879.7±240 pg/ml, p=0.0264) compared to “freshly isolated” γδ T cells (260.7±101.2 pg/ml
Group 5). After stimulation with Zoledronate+rhIL2, levels of IFNγ secretion were found
increased by both “activated” γδ T cells (Group 3, 1066+395.6 pg/ml) and “freshly isolated” γδ
T cells (Group 6, 640.9±372.4 pg/ml). Levels of IL6 remained higher in case of “freshly
isolated” γδ T cells (4574±1349 pg/ml) levels as compared to “activated” γδ T cells (69.1+47.2
pg/ml). “Freshly isolated” γδ T cells upon stimulation with rhIL2 showed a progressive increase
in IFNγ production that further enhanced with BrHPP+rhIL2 (p=0.01) and Zoledronate+rhIL2
stimulation compared to unstimulated γδ T cells. Other Th1/Th2/ Th17 cytokines analyzed by
CBA are given in Table 6.
The levels of IL6 secreted by “activated” (Group 1 and Group 3) and “freshly
isolated” (Group 2 and Group 4) γδ T cells were not significantly different compared to
supernatants of unstimulated γδ T cells (control). Upon Zoledronate stimulation, levels of IL6
were found increased as compared to unstimulated and rhIL2 control, but IFNγ secretion was
remarkably increased. Results indicate that “freshly isolated” γδ T cells secrete higher levels of
IL6, thus have pro-osteoclastogenic effect, while “activated” γδ T cells maintain higher levels
of IFNγ playing an anti-osteoclastogenic role.

Results-I
143
Figure 21: Estimation of Th1/Th2/Th17 cytokines in cell free supernatants of “activated”
(ACT) and “freshly isolated” (FI) γδ T cells
“Activated” (purified fromαCD3/CD28+rhIL2 expanded PBMCs) or “freshly isolated” (directly
purified from PBMCs on Day 0) γδ T cells (5×10⁴/well) were stimulated with rhIL2 (0.5
IU/well), BrHPP (200nM)+rhIL2 or Zoledronate+rhIL2 for 24 hrs at 37°C in CO2 incubator.
Both “activated” and “freshly isolated” γδ T cells, which were unstimulated (incubated in culture
medium alone), were kept as control. After 24 hrs, the cell free supernatants were collected.
Th1/Th2/Th17 cytokines of these cell free supernatants were quantified by cytometric bead array

Results-I
144
(CBA). Based on their effect on osteoclastogenesis, cytokines are distributed as pro-
osteoclastogenic [a] and anti-osteoclastogenic cytokines [b]. “Freshly isolated” γδ T cells T cells
showed significantly higher levels of pro-osteoclastogenic cytokines (IL6, TNFα), while [b]
“activated γδ T cells” showed increased levels of anti-osteoclastogenic cytokines (IFNγ and IL4).
(“Activated” γδ T cells (n=5), “freshly isolated” γδ T cells (n= 7)). [p < 0.05 (*), p <0.005 (**),
p< 0.0005 (***)].
Table 6: Cytokine profiling of cell free supernatants of antigen activated γδ T cells
TH1/Th2/Th17 cytokines in cell free supernatants obtained from “activated” and “freshly
isolated” γδ T cell were analysed using cytometric bead array. “Freshly isolated” γδ T cells
showed higher baseline levels (control) of IL6, while higher level of IFNγ was detected in
supernatants of “activated” γδ T cells. Stimulation of “activated” and “freshly isolated” γδ with
rhIL2 (0.5IU), BrHPP (200nM), Zoledronate (100μM) enhanced IFNγ secretion. Levels of IL4
and TNFα were also found increased upon stimulation of “freshly isolated” γδ T cells.
Unstimulated
γδ T cells
IL2 stimulated
γδ T cells
BrHPP stimulated
γδ T cells
Cytokine
Concentration
(pg/ml)
Cytokine
Concentration
(pg/ml)
Cytokine
Concentration
(pg/ml)
ACT
(n=5)
FI
(n=7)
P
value
ACT
(n=5)
FI
(n=7)
P
value
ACT
(n=5)
FI
(n=7)
P
value
ACT
(n=5)
FI
(n=7)
P
value
IL2 2.7
± 0.9
17.2
± 9.4 ns
13.7
± 3.4
680.2
±412 ns
14.1
± 5.0
366.9
±330.4 ns
15.9
± 7.5
30.6 ±
12.8 ns
IL4 5.4 ±
0.8
2.6
± 0.6 *
18.3
± 5.4
3.1
± 0.6 **
20.2
± 4.6
2.3
± 0.7 ***
15.74
± 5.4
3.7
± 0.6 *
IL6 1.9
± 0.3
2318
±471 **
2.4
± 0.09
2375
±537.8 **
2.24
± 0.07
2563
±498.7 **
69.1 ±
47.2
4574
±
1349
ns
IL10 3.8
± 0.6
10.6
± 3.2 ns
3.3
± 0.6
12.2
± 4.5 ns
3.9
± 0.5
12.3
± 3.8 ns
3.9
± 0.6
41.7 ±
16.5 *
TNFα 67.5
± 37
205.7
± 38.3 *
165.5
±82
254.9
±48.9 ns
188.1
± 90.9
547.1
±104.9 *
201.1
± 88.5
394.1 ±
102.1 ns
IFNγ 274.1
±111
3.2
± 0.2 **
706.5
±211
33.5
±29.21 **
879.7 ±
240
260.7
±101.2 *
1066
±395.6
640.9
±372.
4
ns
IL17 4.5
± 4.1
2.0
± 0.9 ns
0.3
± 0.3
1.4
± 0.5 ns
0.3
± 0.3
1.4
± 0.6 ns
0.3
± 0.3
1.280
± 0.4 ns
Cytokine
Concentration
(pg/ml)
γδ T cells
Zol stimulated
γδ T cells

Results-I
145
4.4) Effect of IL6 and IFNγ neutralization in cell free supernatants of
“unstimulated” γδ T cells on osteoclast function
To validate that the effect of γδ T cells on osteoclastogenesis is mediated through cytokines
(IFNγ and IL6), functional assays were carried out using neutralizing antibodies to these
cytokines. Osteoclasts were generated in the presence of cell free supernatants of unstimulated
“activated” and “freshly isolated” γδ T cells in the presence or absence of αIFNγ or αIL6
antibody. As shown in Figure 22, osteoclasts generated in the presence of cell free supernatants
of “activated” γδ T cells showed significant (57.4%) reduction in resorption area (10.78±1 μm2)
compared to positive control (25.4±0.5 μm2, 100%), After addition of αIFNγ antibody to these
cultures the inhibition was reversed and brought to 89.7% (22.7±0.3 μm2), which was
comparable to that observed in positive control, confirming our observation that IFNγ is a major
cytokine generated by “activated” γδ T cells that inhibits osteoclastogenesis. Similarly,
osteoclasts generated in the presence of cell free supernatants of “freshly isolated” γδ T cells
showed increase in resorption area by 191.9% (74.1±1.6 μm2) over positive control (100%).
Upon addition of αIL6 antibody to the cultures, there was a marked reduction in the resorption
area (34.5±0.2 μm2, p=0.0068) reducing from 191.9% to 36.1% over positive control (100%).
Our results suggests that the dynamics of IFNγ and IL6 play a major role in mediating the pro
and antiosteoclastogenic effects of “activated” γδ T cells and “freshly isolated” γδ T cells
respectively.
Results-I
146
Figure 22: Effect of IFNγ and IL6 neutralization in cell free supernatants of “activated”
(ACT) and “freshly isolated” (FI) γδ T cells on osteoclast function.
CD14+ cells (1x10
5) were cultured in the presence of rhMCSF and rhRANKL for 12 days in
OAAS module to generate OPCs. After which, every 3rd
day, the cultures were supplemented
with 50 μl supernatants of unstimulated “activated” and “freshly isolated” γδ T cells, rhMCSF,
and rhRANKL with or without monoclonal mouse αIFNγ or αIL6 neutralization antibody
(10μg/ml/well). Osteoclasts generated in the presence of rhMCSF and rhRANKL were kept as
positive control. CD14+
cells cultured in the presence of MCSF only was considered as negative

Results-I
147
control. On the 21st
day, the cultures were terminated and resorption area was calculated.
Resorption area generated in positive control was normalized to 100% and data has been
represented as relative increase or decrease in resorption area compared to positive control. The
data shown is mean ± SEM of two independent experiments. [p < 0.05 (*), p <0.005 (**), p <
0.0005 (***)].
The present chapter investigated the role of γδ T cells in osteoclastogenesis. Our data
indicated that, “activated” γδ T cells secrete higher levels of IFNγ and have inhibitory effect on
generation and function of osteoclasts. “Freshly isolated” γδ T cells showed pro-
osteoclastogenic effect through higher levels of IL6, IL17 and TNFα. Neutralization of only IL6
and IFNγ showed significant differences explaining their decisive role in controlling
osteoclastogenesis.

Results-I
148

Results-II
149
Chapter 5
To understand the effect of aminobisphosphonate
(Zoledronate) on protein profiles of breast tumor
cells

Results-II
150
Results-II
151
Zoledronic acid is a third generation aminobisphosphonate (Chemical formula: C5H10N2O7P2,
molecular weight: 272.08 g/mol) with potent antiresorptive and antitumor activity, thus is used in
the treatment of skeletal disorders and metastasis associated skeletal malignancies [58,59,60].
Zoledronate is known to inhibit fernesyl pyrophosphate synthase (FPPS) enzyme in mevalonate
pathway, thus inhibits synthesis of fernesyl pyrophosphate and geranyl geranyl pyrophosphate,
ultimately inhibiting essential cellular processes. In vitro studies on inhibition of tumor cell
growth and induction of apoptosis by Zoledronate have been reported [77,78]. Earlier studies
from our lab demonstrated that, tumor cells (MCF7, PC3 and SaOS2) when treated with
aminobisphosphonates (Pamidronate and Zoledronate) are recognized and aggressively killed by
γδ T cells [26]. γδ T cells were found to form a strong conjugate with aminobisphosphonate
pretreated tumor cells. This process was NKG2D and γδ TCR dependent, as blocking of these
molecules inhibited cytotoxic effect by γδ T cells. The study further investigated the role of
conventional molecules like MICA, ICAM1 and FasL present on the tumor cells which are
known to be involved in conjugate formation between tumor cells and γδ T cells [26].
Zoledronate treatment did not alter expression of MICA, ICAM1 and FasL, indicating
involvement of other molecules. The present study was an attempt to investigate the protein
profiles of breast tumor cells (MCF7) after Zoledronate treatment to identify molecules that may
play key role in conjugate formation with γδ T cells. Comparative analysis of protein profiles of
Zoledronate treated and untreated MCF7 were analyzed using two proteomic approaches- [1]
2D-gel electrophoresis-Matrix assisted laser desorption ionization – time of flight (MALDI-
TOF/TOF) and [2] Liquid chromatography- Mass spectrometry.

Results-II
152
5.1) Determination of sublethal concentration of Zoledronate for treatment of
MCF7 cells
MCF7 cells (at different cell densities- 1x10³, 3x10
3 and 5x10
3) were treated with varying
concentrations of Zoledronate (50μM, 100μM, 200μM) or left untreated (control) for 16-18 hrs
and viability of the cells was determined by MTT assay. Optical density was measured at 540nm
with reference wavelength 690nm. The results are represented as percent viability of control
[Test viability (%) = (Test O.D / Control O.D.) x 100]. As shown in Figure 23, Zoledronate
concentration upto 100μM did not affect viability of MCF7 cells, while Zoledronate
concentration at 200μM reduced the viability by 50%. Thus, for further experiments, 100μM
Zoledronate concentration was used for treatment of MCF7 cells.
Figure 23: Determination of sublethal concentration of Zoledronate for in vitro assays using
MTT Assay
Sublethal concentration of Zoledronate for the treatment of tumor cells was assessed by MTT
assay. MCF7 cells (at different cell densities- 1x10³, 3x10
3, 5x10
3) were treated with Zoledronate
(50μM, 100μM, 200μM) or left untreated (control) for 16-18 hrs and viability of the cell was
assessed by measuring optical density at 540nm. The data is represented as percent viability of
control cells [viability of the test cells = (OD of treated cells / OD of control) x100]. Three
independent experiments were carried out. Significance obtained is indicated by p value as
p<0.05(*) and p<0.005(**), p<0.0005(***).

Results-II
153
5.2) Separation of differentially expressed proteins in MCF7 cells upon
Zoledronate treatment by 2-dimensional (2D) polyacrylamide gel electrophoresis
In 2D electrophoresis, proteins are separated on the basis of their isoelectric point (IEF) and
molecular weight (SDS-PAGE). These resolved proteins are then identified using a mass
spectrometer. To analyze the effect of Zoledronate treatment on MCF7 cells, comparative
analysis of protein profiles of Zoledronate treated and untreated MCF7 cells was carried out by
2DGE-MS. Involvement of these proteins in various cellular processes and protein-protein
interactions was analyzed by PANTHER analysis tool and interactome software STRING
respectively.
5.2.1) Generation of protein profiles for Zoledronate treated and untreated MCF7 cells
using 2D-PAGE
IEF was standardized for pH 3-10 nonlinear (NL), 17cm immobilized pH gradient (IPG) strip.
Figure 24 shows representative silver stained 2D gel pictures of untreated (A) and Zoledronate
treated (B) MCF7 cells. Images of silver stained gels were scanned on Bio-Rad GS-800
densitometer (raw images). Comparative analysis of the scanned gel images of untreated and
Zoledronate treated MCF7 cells generated by software PDQuest (Version 7.2).

Results-II
154
Figure 24: Images of silver stained 2D-Gels generated using pH 3-10NL, 17cm IPG strip
A representative image of silver stained 2-dimensional protein profiles of untreated [A] and
Zoledronate treated [B] MCF7 cells, generated using pH 3-10NL, 17 cm IPG strip.
KDa
KDa

Results-II
155
5.2.2) Analysis of differential protein expression in MCF7 cells upon Zoledronate treatment
PDQuest software (BioRad, Version 7.2) was used to analyze qualitative (position on the gel)
and quantitative (intensity of the position matched spot) differences in protein profiles of
untreated and Zoledronate treated MCF7 cells (Materials and methods 3.12.1.9). Protein profiles
of untreated and Zoledronate treated MCF7 were generated and then analyzed by PDQuest
software for differential protein expression (Figure 25). Zoledronate treatment of MCF7 cells
showed expression of 79 new proteins, while untreated MCF7 cells had 51 unique proteins.
Upon Zoledronate treatment, 96 proteins showed 2 fold change in their expression and 75
proteins showed 3 fold change. Gel plugs containing proteins were separated from silver stained
2D gels and proteins were identified using MALDI-TOF/TOF.

Results-II
156
Figure 25: Comparative analysis of 2D profiles of untreated and Zoledronate treated
MCF7 cells using PDQuest software
Protein profiles of untreated and Zoledronate treated MCF7 cells were compared using PDQuest
software to analyze differential protein expression. Based on densitometry and position of the
spot, quantitative and quantitative differences in protein expression of Zoledronate treated and
untreated MCF7 cells were detected. Zoledronate treatment showed changes in expression of
proteins (blue squares- 2 fold change, red open circles- more than 2 fold change). Yellow filled
circles show total number of proteins in a gel, while pink squares show manually added proteins
spots during generation of MasterSets.
5.2.3) In-solution digestion of proteins
In-solution digestion of proteins separated from silver stained 2D-gels generated using untreated
MCF7 cells was carried out using trypsin (Materials and methods, section 3.12.3.8). Figure 26
shows schematic representation of in solution digestion of proteins. Detailed information of
identified proteins is given in Table 7. Figure 27 is a representation of total 34 identified proteins
form gel.
Untreated MCF7 Zoledronate treated MCF7
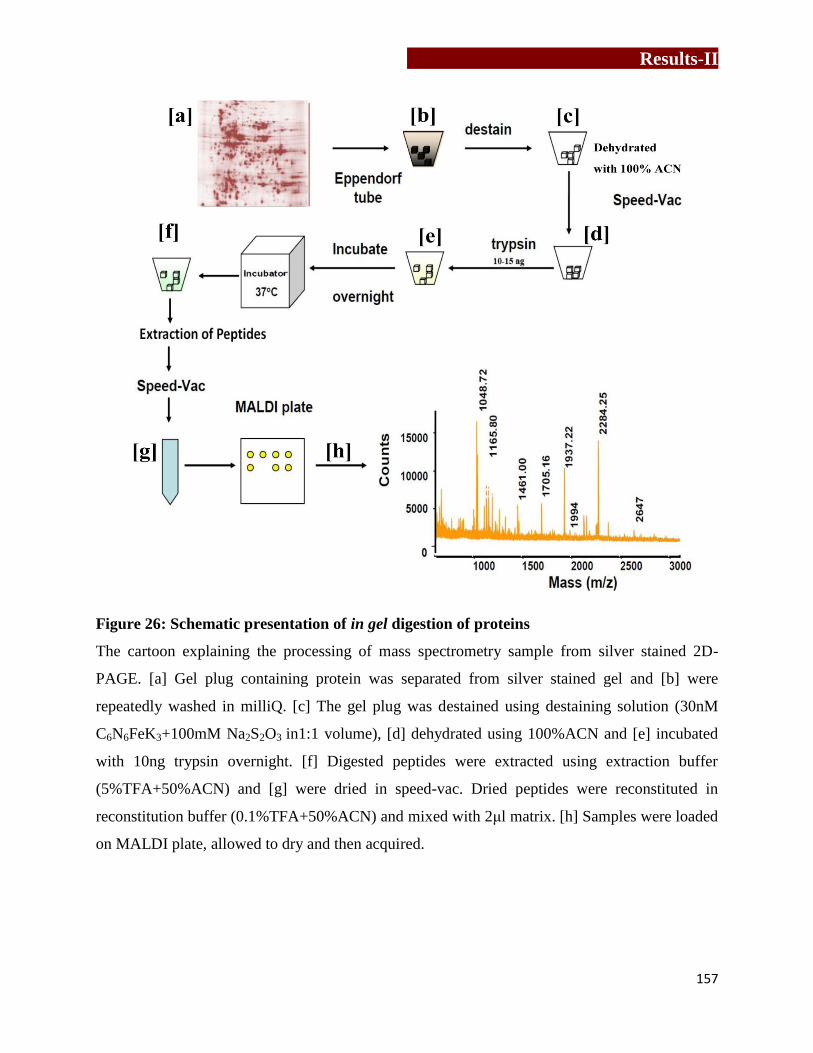
Results-II
157
Figure 26: Schematic presentation of in gel digestion of proteins
The cartoon explaining the processing of mass spectrometry sample from silver stained 2D-
PAGE. [a] Gel plug containing protein was separated from silver stained gel and [b] were
repeatedly washed in milliQ. [c] The gel plug was destained using destaining solution (30nM
C6N6FeK3+100mM Na2S2O3 in1:1 volume), [d] dehydrated using 100%ACN and [e] incubated
with 10ng trypsin overnight. [f] Digested peptides were extracted using extraction buffer
(5%TFA+50%ACN) and [g] were dried in speed-vac. Dried peptides were reconstituted in
reconstitution buffer (0.1%TFA+50%ACN) and mixed with 2μl matrix. [h] Samples were loaded
on MALDI plate, allowed to dry and then acquired.

Results-II
158
Figure 27: Diagrammatic representation of identified proteins in untreated MCF7 cell
lysate using MALDI-TOF/ TOF
Gel plugs containing protein samples were separated from silver stained gels and proteins were
digested in-gel using trypsin. Separated proteins were dried, reconstituted and analyzed
identified using MALDI-TOF/TOF. Acquired mass spectras were analyzed on Biotools software
and proteins were searched against SwissProt database.
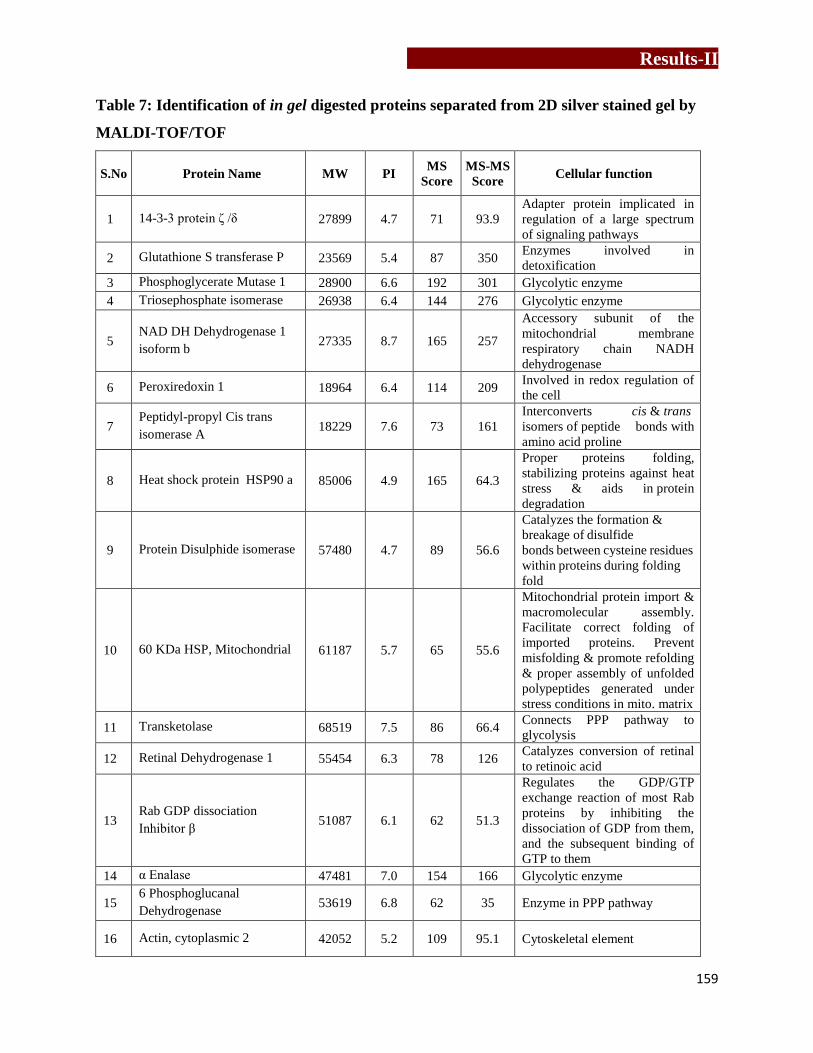
Results-II
159
Table 7: Identification of in gel digested proteins separated from 2D silver stained gel by
MALDI-TOF/TOF
S.No Protein Name MW PI MS
Score
MS-MS
Score Cellular function
1 14-3-3 protein ζ /δ 27899 4.7 71 93.9
Adapter protein implicated in
regulation of a large spectrum
of signaling pathways
2 Glutathione S transferase P 23569 5.4 87 350 Enzymes involved in
detoxification
3 Phosphoglycerate Mutase 1 28900 6.6 192 301 Glycolytic enzyme
4 Triosephosphate isomerase 26938 6.4 144 276 Glycolytic enzyme
5 NAD DH Dehydrogenase 1
isoform b 27335 8.7 165 257
Accessory subunit of the
mitochondrial membrane
respiratory chain NADH
dehydrogenase
6 Peroxiredoxin 1 18964 6.4 114 209 Involved in redox regulation of
the cell
7 Peptidyl-propyl Cis trans
isomerase A 18229 7.6 73 161
Interconverts cis & trans
isomers of peptide bonds with
amino acid proline
8 Heat shock protein HSP90 a 85006 4.9 165 64.3
Proper proteins folding,
stabilizing proteins against heat
stress & aids in protein
degradation
9 Protein Disulphide isomerase 57480 4.7 89 56.6
Catalyzes the formation &
breakage of disulfide
bonds between cysteine residues
within proteins during folding
fold
10 60 KDa HSP, Mitochondrial 61187 5.7 65 55.6
Mitochondrial protein import &
macromolecular assembly.
Facilitate correct folding of
imported proteins. Prevent
misfolding & promote refolding
& proper assembly of unfolded
polypeptides generated under
stress conditions in mito. matrix
11 Transketolase 68519 7.5 86 66.4 Connects PPP pathway to
glycolysis
12 Retinal Dehydrogenase 1 55454 6.3 78 126 Catalyzes conversion of retinal
to retinoic acid
13 Rab GDP dissociation
Inhibitor β 51087 6.1 62 51.3
Regulates the GDP/GTP
exchange reaction of most Rab
proteins by inhibiting the
dissociation of GDP from them,
and the subsequent binding of
GTP to them
14 α Enalase 47481 7.0 154 166 Glycolytic enzyme
15 6 Phosphoglucanal
Dehydrogenase 53619 6.8 62 35 Enzyme in PPP pathway
16 Actin, cytoplasmic 2 42052 5.2 109 95.1 Cytoskeletal element
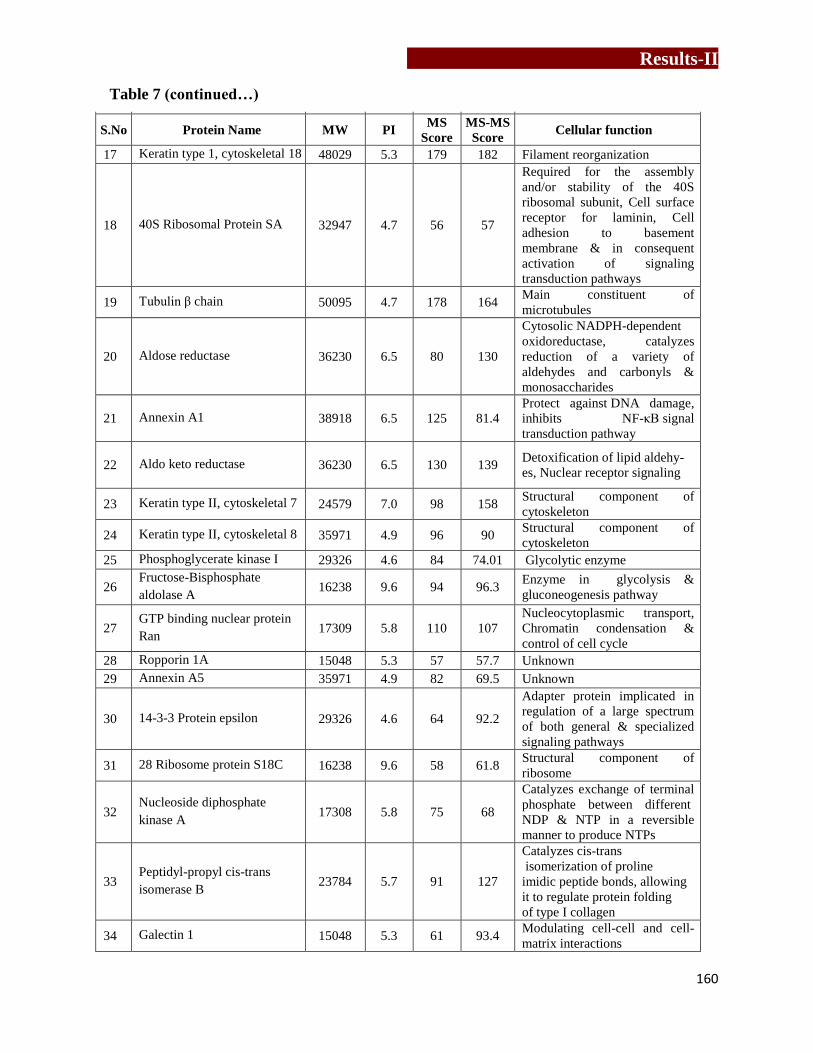
Results-II
160
S.No Protein Name MW PI MS
Score
MS-MS
Score Cellular function
17 Keratin type 1, cytoskeletal 18 48029 5.3 179 182 Filament reorganization
18 40S Ribosomal Protein SA 32947 4.7 56 57
Required for the assembly
and/or stability of the 40S
ribosomal subunit, Cell surface
receptor for laminin, Cell
adhesion to basement
membrane & in consequent
activation of signaling
transduction pathways
19 Tubulin β chain 50095 4.7 178 164 Main constituent of
microtubules
20 Aldose reductase 36230 6.5 80 130
Cytosolic NADPH-dependent
oxidoreductase, catalyzes
reduction of a variety of
aldehydes and carbonyls &
monosaccharides
21 Annexin A1 38918 6.5 125 81.4
Protect against DNA damage,
inhibits NF-κB signal
transduction pathway
22 Aldo keto reductase 36230 6.5 130 139 Detoxification of lipid aldehy-
es, Nuclear receptor signaling
23 Keratin type II, cytoskeletal 7 24579 7.0 98 158 Structural component of
cytoskeleton
24 Keratin type II, cytoskeletal 8 35971 4.9 96 90 Structural component of
cytoskeleton
25 Phosphoglycerate kinase I 29326 4.6 84 74.01 Glycolytic enzyme
26 Fructose-Bisphosphate
aldolase A 16238 9.6 94 96.3
Enzyme in glycolysis &
gluconeogenesis pathway
27 GTP binding nuclear protein
Ran 17309 5.8 110 107
Nucleocytoplasmic transport,
Chromatin condensation &
control of cell cycle
28 Ropporin 1A 15048 5.3 57 57.7 Unknown
29 Annexin A5 35971 4.9 82 69.5 Unknown
30 14-3-3 Protein epsilon 29326 4.6 64 92.2
Adapter protein implicated in
regulation of a large spectrum
of both general & specialized
signaling pathways
31 28 Ribosome protein S18C 16238 9.6 58 61.8 Structural component of
ribosome
32 Nucleoside diphosphate
kinase A 17308 5.8 75 68
Catalyzes exchange of terminal
phosphate between different
NDP & NTP in a reversible
manner to produce NTPs
33 Peptidyl-propyl cis-trans
isomerase B 23784 5.7 91 127
Catalyzes cis-trans
isomerization of proline
imidic peptide bonds, allowing
it to regulate protein folding
of type I collagen
34 Galectin 1 15048 5.3 61 93.4 Modulating cell-cell and cell-
matrix interactions
Table 7 (continued…)

Results-II
161
5.3) Identification of differentially expressed proteins in MCF7 upon
Zoledronate treatment by2DPAGE/MALDI-TOD TOF
Gel plugs of differential expressed proteins detected on 2D gel using PDQuest software were
excised from the gel, peptides were extracted and proteins were identified using MALDI-
TOF/TOF as described earlier. Using MASCOT search engine, MS peaklist and MS/MS ions of
the chosen peptides were searched in SwissProt database. The parameters used for search were
mass tolerance of 100 ppm for MS and fragment tolerance of 1 Da for MS/MS analysis. Detailed
information of identified proteins (name of the identified protein, combined MS and MS-MS
score, upregulated/downregulated, molecular weight, isoelectric point, cellular localization and
cellular function) are represented in Table 8. Total 12 differentially expressed proteins were
identified in Zoledronate treated MCF7 cells, which included cytoskeletal elements, heat shock
proteins and cellular enzymes. Among the cytoskeletal elements, expression of keratins was
found downregulated while β-tubulin showed increase in its expression. HSP60 and HSP90
expression was also found to be upregulated upon Zoledronate treatment of MCF7 cells.
Expression of glycolytic enzymes α-enolase, phosphoglycerate mutase-1, triosephosphate
isomerase was found upregulated, while expression of an anti-oxidative enzyme peroxiredoxin-1
was downregulated. Also, expression of 14-3-3ζ was found to be downregulated in MCF7 cells
upon Zoledronate treatment. Comparative analysis of Zoledronate treated and untreated MCF7
cells using 2D-PAGE/ MALDI-TOF approach showed changes in protein profiles upon
Zoledronate treatment, which needed to be confirmed by a more robust approach.

Results-II
162
Table 8: Differentially expressed proteins in 2D-PAGE identified by MS/MS
S.No Protein Name
Combined
MS-MS
Score
Up/
Down MW PI
Cellular
Localization Cellular Function
1 Keratin 7 98 Down 54 6.5 Cytoplasm Maintaining cellular structural integrity
2 Keratin 8 96 Down 36 4.9 Cytoplasm
Maintaining cellular structural
integrity, signal transduction &
cellular diff.
3 Keratin 18 179 Down 48 5.3 Cytoplasm Maintaining cellular structural integrity
4 Tubulin β
Chain 178 Up 45 4.7 Cytoplasm
Structural support, intra- cellular
transport, DNA segregation
5 HSP60 65 Up 60 5.7 Mito. Cyto.,
ER Golgi, PM
Transportation & refolding of proteins
from cytoplasm into mitochondrial
matrix
6 HSP90α 165 Up 90 4.9 Cytosolic
Protein folding, protein degradation,
anti-apoptotic as stabilizes PI3K/AKT,
signaling molecules & growth factors
receptors
7 α-Enolase 166 Up 47 7.1 Cytoplasm
Glycolytic enzyme (converts 2-
phospho-glycerate to
phosphoenolpyruvate)
8 Phosphoglycerate
mutase 1 301 UP 28.9 6.6 Cytoplasm
Glycolytic enzyme (conversion of 3-
phosphoglycerate to 2-
phosphoglycerate)
9 Triosephosphate
isomerase 276 Up 26.9 6.4 Cytoplasm
Glycolytic enzyme
(interconversion of triosephosphate
isomers dihydroxy-acetone phosphate
and D- glyceraldehyde 3-phosphate)
10 Peroxiredoxin 1 114 Up 18 6.4 Cytoplasm
Anti-oxidant enzyme, reduction of
ROS. Protects the cells from oxidative
stress & promotes cell survival
11 14-3-3ζ 71 Down 27.8 4.7 Ubiquitous
Regulates multiple oncogenes
Over expression: anchorage
independent growth & anti-apoptosis.
Acts as heat shock related molecular
chaperon. Co-operates with Her 2 to
increase cancer invasion
12
GTP binding
nuclear protein
Ran
110 Down 17.3 5.8
Nucleus,
Cytoplasm,
Nuclear
envelope
Nucleocytoplasmic transport, RNA
export, chromatin condensation, cell
cycle
Table 8: 2D profiles of Zoledronate treated and untreated MCF7 were compared using PDQuest
software for differential protein expression. These proteins were separated from gels, extracted
by in gel digestion method and were identified using MS/MS.
Results-II
163
5.4) Identification of differentially expressed proteins in Zoledronate treated
MCF7 cells by liquid chromatography-mass spectrometry (LC-MS)
Quantitative estimation of differentially expressed proteins in MCF7 cells upon Zoledronate
treatment was analyzed labeling of samples using iTRAQ (isobaric tags for relative and absolute
quantification) reagents and further separation and detection of peptides by LC-MS. Details of
iTRAQ/LC-MS are provided in detail in Materials and methods section 3.12.2. Digested proteins
(peptides) from untreated and Zoledronate treated MCF7 cells were labeled with different
isotopes, mixed together and analyzed on LC/MS. Differentially expressed proteins are identified
based on relative changes in test sample compared to control sample. Proteins in Zoledronate
treated MCF7 cells were analyzed for relative changes in expression to untreated MCF7 cells.
Proteins showing > 1.5 fold increase in their expression upon Zoledronate treatment were
considered as “upregulated proteins”, while proteins with < 0.5 fold decrease in their expression
upon Zoledronate treatment were considered as “downregulated proteins”. Total 31 proteins
were found to be significantly upregulated (Table 9), while 64 proteins showed significant
downregulation (Table 10) in MCF7 cells. The data was analyzed using PANTHER analysis
tool, where upregulated and downregulated proteins were classified on the basis of molecular
function, their involvement in biological processes and protein class. Figure 28 and Figure 29
shows detailed PANTHER analysis of upregulated and downregulated proteins respectively.
Among both upregulated and downregulated proteins, most of the proteins were
associated with metabolic (39.6% and 35.3% respectively) and cellular processes (28.6% and
20.6% respectively), as classified by PANTHER. Classification of upregulated and
downregulated proteins on the basis of their biological processes showed changes in proteins
with binding activity (41.3% upregulated and 36.4% downregulated) and with catalytic activity
(36.5% upregulated and 27.3% downregulated). Zoledronate treatment upregulated expression of

Results-II
164
signaling molecules (8.1 %), while expression of cytoskeletal elements (10.5%), ligases (10.5%),
membrane trafficking proteins (10.5%) and nucleic acid binding proteins (26.3%) were found to
be downregulated.

Results-II
165
Table 9: List of upregulated proteins in MCF7 upon Zoledronate treatment
S.No Protein
ID Gene ID Name
Pep
(95%) 114:117
(T:C) Cellular Function
1 Q5H909 Q5H909 Melanoma- associated
antigen D2 1 3.1 Tumor antigen
2 P62745 RHOB Rho-related GTP-
binding protein RhoB 5 2.8 Mediates apoptosis
3 Q58FF4 Q58FF4 HSP90Bf 4 2.8 Member of HSP90
4 P05109 S10A8 Protein S100-A8 2 2.6
Acts as DAMPs, chemotaxis of innate
immune cells, induction of apoptosis
& autophagy
5 G8JLD5 G8JLD5 Dynamin-1-like
protein 11 2.1
Producing microtubule bundles,
vesicular trafficking , Receptor-
mediated endocytosis
6 Q59H39 Q59H39 STAT 5B variant (frag) 1 2.1 TCR signaling, apoptosis,
7 P08582 TRFM Melanotransferrin 1 2.0 Iron uptake, melanoma tumor antigen
p97
8 Q59G80 Q59G80
Diphosphomevalonate
decarboxylase variant
(Frag.)
1 2.0
Involved in the pathway cholesterol
biosynthesis, which is part of Steroid
biosynthesis. ATP + (R)-5-
diphosphomevalonate = ADP +
phosphate + isopentenyl diphosphate +
CO2
9 O60220 TIM8A
Mito. Inner membrane
translocase subunit
Tim8 A
1 1.9
Insertion of multi-pass transmembrane
proteins into the mitochondrial inner
membrane
10 P35754 GLRX1 Glutaredoxin-1 4 1.9 GNT-binding proteins, downstream of
G protein-coupled receptors
11 Q9Y3A3 PHOCN Phocein 1 1.9 Membrane trafficking,
12 K7EPV0 K7EPV0 Cytochrome c oxidase
assembly protein 3 1 1.9
Essential for cytochrome c oxidase
function
13 J3KQ73 J3KQ73 Peptidyl-prolyl cis-
trans isomerase FKBP8 3 1.8
Chaperone for BCL2, phosphorylates
it & interfering with binding of BCL2
to its targets
14 Q6IB91 Q6IB91 PCK2 protein 5 1.8
Rate-limiting step: Producing glucose
from lactate & other precursors from
TCA cycle
15 E9PMQ6 E9PMQ6 HSF1 1 1.8 Transcribe HSP genes
16 Q03167 TGBR3
Transforming growth
factor beta receptor
type 3
0 1.8 Capturing and retaining TGF-beta for
presentation to the signaling receptors
17 K7ELW3 K7ELW3 EGFR substrate 8-like
protein 1 0 1.7
Membrane ruffling & remodeling of
actin cytoskeleton
18 Q53FV3 Q53FV3 COP9 signalosome
subunit 4 2 1.7
Promoting & protection of p53/TP53,
c-Jun/JUN from degradation by
phosphorylation
19 Q0VAM0 Q0VAM0 Catenin, beta like 1 1 1.7 Component of PRP19-CDC5L complex
(spliceosome). May induce apoptosis.
20 L0R849 L0R849 Enolase 47 1.6
Glycolytic enzyme, growth control,
hypoxia tolerance & allergic responses,
receptor & activator of plasminogen on
cell surface of cells. May be a tumor
suppressor

Results-II
166
S.No Protein
ID Gene ID Name
Pep
(95%) 114:117
(T:C) Cellular Function
21 Q7Z426 Q7Z426 Putative MAPK
activating protein 4 1.6
Proliferation, gene expression,
differentiation, mitosis, cell survival,
and apoptosis
22 Q6NTG0 Q6NTG0 SLC9A3R2 protein
(Frag.) 7 1.6
Scaffolding proteins. Binding to &
regulating membrane expression &
protein-protein interaction of membrane
receptors & transport proteins
23 Q9Y320 TMX2
Thioredoxin-related
transmembrane protein
2
4 1.6 Cell proliferation-inducing gene 26
protein, stress sensors
24 Q7Z6K5 CO038 UPF0552 protein
C15orf38 2 1.6 Inhibitor of actin polymerization
25 Q59GU6 Q59GU6
Sorting nexin 1
isoform a variant
(Frag.)
2 1.6
Targeting ligand-activated EGFR to the
lysosomes for degradation after
endocytosis from cell surface & release
from Golgi
26 P61586 RHOA Transforming protein
RhoA 19 1.6
Regulates a signal transduction pathway
linking plasma membrane receptors to
assembly of focal adhesions and actin
stress fibers
27 Q9Y5K6 CD2AP CD2-associated protein 1 1.5
Receptor clustering& cytoskeletal
polarity in the junction between T-cell
& APCs
28 Q9NYJ1 COA4 Cytochrome c oxidase
assembly factor 4 1 1.5 Putative COX assembly factor
29 P17858 K6PL 6-phosphofructokinase,
liver type 4 1.5
Catalyzes phosphorylation of D-
fructose 6-phosphate to fructose 1,6-
bisphosphate by ATP (committing step
of glycolysis)
30 P10909 CLUS Clusterin 3 1.5
Facilitates folding of secreted proteins
in ATP-independent way. Lipid
transport, membrane recycling, cell
adhesion, programmed cell death &
complement-mediated cell lysis
31 O60888 CUTA Protein CutA 1 1.5 Copper binding protein
Table 9: Protein profiles of Zoledronate treated and untreated MCF7 were analyzed on LC-MS
followed by iTRAQ labeling. Proteins showing >1.5 fold increase upon Zoledronate treatment
were considered as upregulated proteins.
Table 9 (continued…)

Results-II
167
Table 10: List of downregulated proteins in MCF7 upon Zoledronate treatment
S. No Protein
ID Gene ID Name
Pep
(95%) 114:117
(T:C) Cellular Function
1 B2RA72 B2RA72 cDNA, FLJ94734,
CHMP1.5 protein 1 0.2 Vacuolar transport
2 P62312 LSM6 U6 snRNA-associated Sm-
like protein LSm6 2 0.2 RNA processing
3 P17900 SAP3 Ganglioside GM2 activator 1 0.2 Phospholipids & FA metabolism
4 A8K180 A8K180
cDNA FLJ76749, highly
similar to Homo sapiens
Wiskott-Aldrich syndrome-
like (WASL), mRNA
2 0.3 Actin filament reorganization
5 P40855 PEX19 Peroxisomal biogenesis
factor 19 2 0.3 Early peroxisomal biogenesis
6 R4GMT0 R4GMT0 Alpha-centractin 2 0.3 Microtubule based vesicle motility
7 Q59G16 Q59G16
SWI/SNF-related matrix-
associated actin-dependent
regulator of chromatin c2
isoform b variant (Frag.)
1 0.3 Chromatin remodeling
8 E5RFF9 E5RFF9 DNA replication complex
GINS protein SLD5 1 0.4
Essential role in the initiation of
DNA replication
9 Q9H7H1 RUIT1
Putative uncharacterized
protein encoded by
RUNX1-IT1
1 0.4 Chromatin remodeling
10 Q9NTM9 CUTC Copper homeostasis protein
cutC homolog 1 0.4 Copper export
11 B3KPR5 B3KPR5 cDNA FLJ32094 fis, clone 0 0.4 Translation elongation factor
activity
12 Q7Z727 Q7Z727 PRKCA protein (Frag.) 1 0.4
Phosphorylates variety of proteins
in diverse cellular signaling
pathways
13 O95864 FADS2 Fatty acid desaturase 2 1 0.4 Fatty acid metabolism
14 Q8N1X3 Q8N1X3
cDNA FLJ37317 fis, clone
BRAMY2017455, highly
similar to Homo sapiens
ATP-binding cassette
protein M-ABC1 mRNA
1 0.4 Transport various substrates across
cellular membranes
15 Q8NDH3 PEPL1 Probable aminopeptidase
NPEPL1 2 0.4
Removal of unsubstituted N-
terminal amino acids from various
peptides
16 E9PQN3 E9PQN3 Lysosomal Pro-X
carboxypeptidase (Frag.) 1 0.4 Serine-type peptidase activity
17 B0UX83 B0UX83 HLA-B associated
transcript 3, isoform CRA a 4 0.4 Not known
18 Q8NBL9 Q8NBL9
cDNA PSEC0119 fis, clone
PLACE1002376, highly
similar to GPI transamidase
component PIG-S
1 0.4 Attachment of GPI anchor to
protein

Results-II
168
S. No Protein
ID Gene ID Name
Pep
(95%) 114:117
(T:C) Cellular Function
19 F8VZN8 F8VZN8
Protein phosphatase 1
regulatory subunit 12A
(Frag.)
2 0.4 phosphatase regulator activity and
signal transduction
20 F8W1Z8 F8W1Z8 ADP-ribosylation factor-
like protein 1 1 0.4 phosphatase regulator activity and
21 K7ERU7 K7ERU7 Uncharacterized protein
C19orf43 1 0.4 Not known
22 Q53GF4 Q53GF4 Syntaxin binding protein 2
variant (Frag.) 2 0.4
Intracellular vesicle trafficking and
vesicle fusion with membranes
23 Q96FJ2 DYL2 Dynein light chain 2,
cytoplasmic 2 0.5
Non-catalytic accessory
components of cytoplasmic dynein
1 complex
24 Q9NX47 MARH5 E3 ubiquitin-protein ligase
MARCH5 2 0.5
Control of mitochondrial
morphology by acting as a positive
regulator of mitochondrial fission
25 B4DZF1 B4DZF1 cDNA FLJ56541, highly
similar to Ubiquilin-2 8 0.5
Increases half-life of proteins
destined to be degraded by
proteasomes, Modulates
proteasome- mediated protein
degradation
26 H7BXQ8 H7BXQ8 Armadillo repeat-
containing protein 10 1 0.5
Cell survival and cell growth,
Suppress the transcriptional activity
of p53/TP53
27 Q8N8I9 Q8N8I9 cDNA FLJ39408 fis, clone
PLACE6013672 1 0.5 Phosphotransferase activity
28 Q8TBX8 PI42C
Phosphatidylinositol 5-
phosphate 4-kinase type-2
gamma
2 0.5
production of Phosphatidylinositol
bisphosphate (PIP2), in the
endoplasmic reticulum
29 P62249 RS16 40S ribosomal protein S16 2 0.5 RNA binding protein
30 Q32Q10 Q32Q10 RSU1 protein (Frag.) 3 0.5 Ras suppressor protein
31 J3KN55 J3KN55
Cob(I)yrinic acid a,c-
diamide adenosyl-
transferase, mitochondrial
1 0.5 Cobalamin biosynthetic process
32 Q6NZX3 Q6NZX3 5'-nucleotidase,ecto (CD73) 9 0.5 Hydrolase activity
33 Q5RLJ0 Q5RLJ0 CLE 1 0.5 Not known
34 P11441 UBL4A Ubiquitin-like protein 4A 1 0.5
Post-translational delivery of tail-
anchored (TA) membrane proteins
to ER mem
35 Q96I60 Q96I60 6-phosphofructokinase 9 0.5 Glycolytic Enzyme
36 F5H4Q5 F5H4Q5 Vacuolar protein sorting-
associated protein 37C Frag 1 0.5 Vacuolar protein sorting
37 H0YFI1 H0YFI1 Regulator complex protein
LAMT 1 0.5
Interacts with the Rag GTPases,
recruits them to lysosomes & is
essential for mTORC1 activation
38 B0ZTD4 B0ZTD4 Forkhead box A2 0 0.5 DNA-binding proteins, interacts
with chromatin
39 Q10567 AP1B1 AP-1 complex subunit β-1 1 0.5 Protein sorting in the late-
Golgi/trans-Golgi network
Table 10 (continued…)

Results-II
169
S. No Protein
ID Gene ID Name
Pep
(95%) 114:117
(T:C) Cellular Function
40 B3KNU0 B3KNU0
cDNA FLJ30470 fis, clone
BRAWH1000040, highly
similar to Rap1 GTPase-
GDP dissociation
stimulator 1
1 0.5
Stimulates GDP/GTP exchange
reaction of a group of G proteins
(Rap1a/Rap1b, RhoA, RhoB and
kRas
41 Q96CT7 CC124 Coiled-coil domain-
containing protein 124 2 0.5
Essential for proper progression of
late cytokinetic stages
42 D6W4Z6 D6W4Z6 HCG23833, isoform CRAb 2 0.5 Oxidoreductase activity
42 B4E245 B4E245
cDNA FLJ61538, highly
similar to Switch-
associated protein 70
3 0.5
Mediates signaling of membrane
ruffling, Regulates the actin
cytoskeleton
43 Q5H9T5 Q5H9T5 Putative uncharacterized
protein DKFZp686A2068 2 0.5 Signal transduction
44 F8W022 F8W022 CD63 antigen (Frag.) 1 0.5
Promotes cell survival,
reorganization of actin
cytoskeleton, cell adhesion,
spreading and migration, role in
intracellular vesicular transport
processes, VEGFA signaling via its
role in regulating the internalization
of KDR/VEGFR2
45 J3KNJ2 J3KNJ2
Eukaryotic translation
initiation factor 3 subunit
M (Frag)
1 0.5
Component of eukaryotic
translation initiation factor 3 (eIF-
3) complex, which is required for
several steps in the initiation of
protein synthesis
46 Q9H3H3 CK068 UPF0696 protein C11orf68 2 0.5 Poly(A) RNA binding protein
47 J3QRJ1 J3QRJ1 Secernin-2 1 0.5 Have dipeptidase activity, Function
in exocytosis
48 H7BZ18 H7BZ18 Multiple coagulation factor
deficiency protein 2 (Frag.) 1 0.5
The MCFD2-LMAN1 complex
forms a specific cargo receptor for
ER-to-Golgi transport of selected
proteins
49 Q5H9M0 MUML1 PWWP domain-containing
protein MUM1L1 1 0.5
Mutated melanoma-associated
antigen 1-like protein 1
50 B4DDM6 B4DDM6 Mitotic checkpoint protein
BUB3 1 0.5
BUB1/BUB3 complex plays role in
inhibition of APC/C
51 Q9UQ98 Q9UQ98 Multidrug resistance
protein (Frag.) 1 0.5 Extrusion of drugs from cell
52 Q5T0G8 Q5T0G8 Annexin 14 0.5 Vesicular transport, Membrane
scaffolding, apoptosis
53 Q96T76 MMS19
MMS19 nucleotide
excision repair protein
homolog
2 0.5
Key component of cytosolic Fe-S
protein assembly complex,
involved in DNA meta. & genomic
integrity
54 L0R6Q1 L0R6Q1 Alternative protein
SLC35A4 1 0.5
Probable UDP-sugar transporter
protein SLC35A4
55 H7C426 H7C426 E3 ubiquitin-protein ligase
RNF181 (Frag.) 1 0.5 Protein ubiquitination
Table10 (continued…)
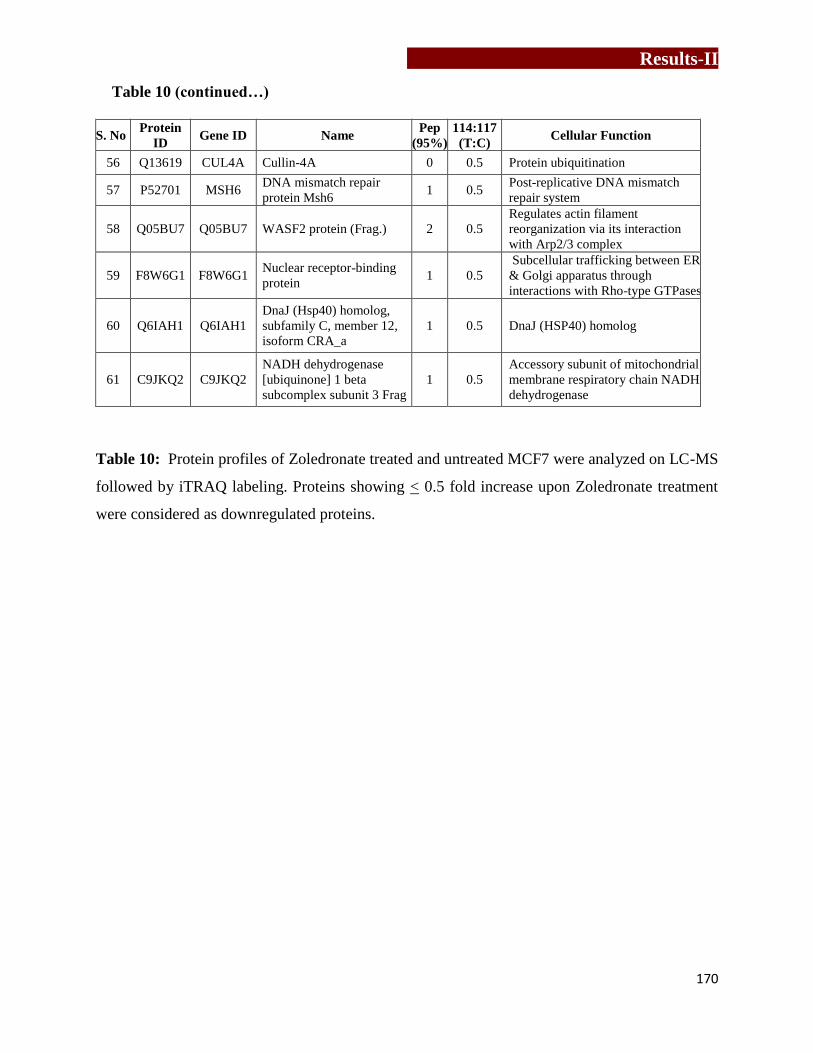
Results-II
170
S. No Protein
ID Gene ID Name
Pep
(95%) 114:117
(T:C) Cellular Function
56 Q13619 CUL4A Cullin-4A 0 0.5 Protein ubiquitination
57 P52701 MSH6 DNA mismatch repair
protein Msh6 1 0.5
Post-replicative DNA mismatch
repair system
58 Q05BU7 Q05BU7 WASF2 protein (Frag.) 2 0.5
Regulates actin filament
reorganization via its interaction
with Arp2/3 complex
59 F8W6G1 F8W6G1 Nuclear receptor-binding
protein 1 0.5
Subcellular trafficking between ER
& Golgi apparatus through
interactions with Rho-type GTPases
60 Q6IAH1 Q6IAH1
DnaJ (Hsp40) homolog,
subfamily C, member 12,
isoform CRA_a
1 0.5 DnaJ (HSP40) homolog
61 C9JKQ2 C9JKQ2
NADH dehydrogenase
[ubiquinone] 1 beta
subcomplex subunit 3 Frag
1 0.5
Accessory subunit of mitochondrial
membrane respiratory chain NADH
dehydrogenase
Table 10: Protein profiles of Zoledronate treated and untreated MCF7 were analyzed on LC-MS
followed by iTRAQ labeling. Proteins showing < 0.5 fold increase upon Zoledronate treatment
were considered as downregulated proteins.
Table 10 (continued…)
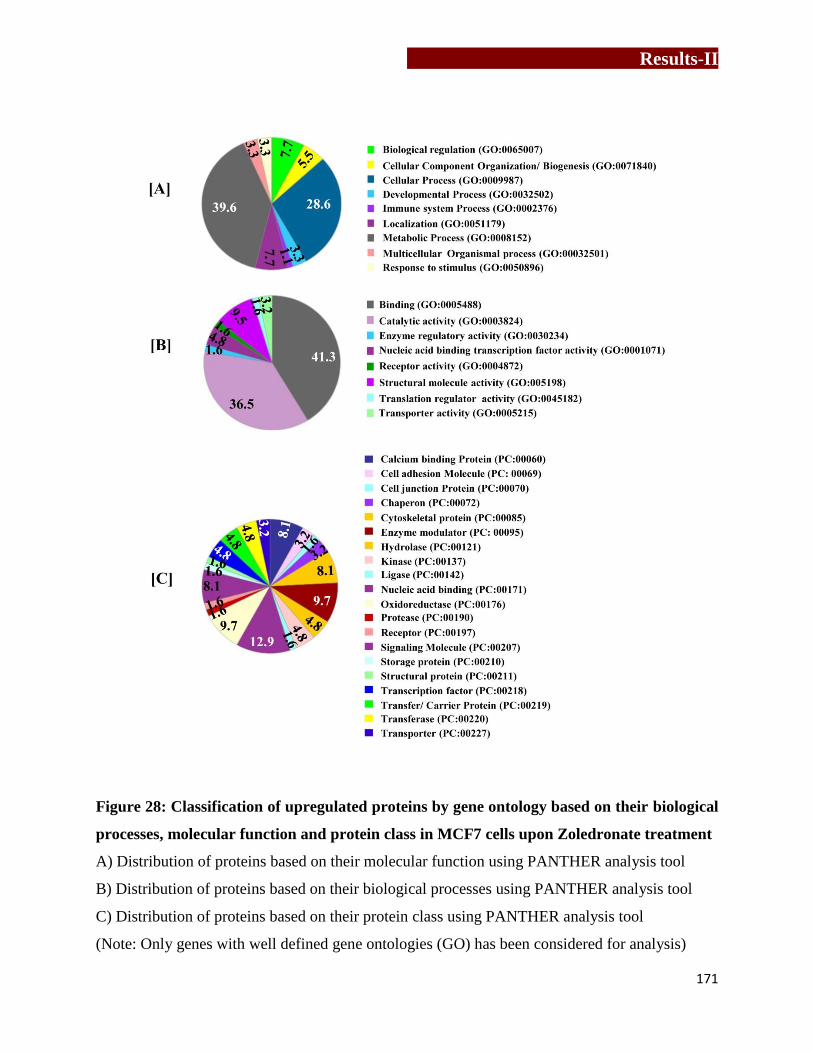
Results-II
171
Figure 28: Classification of upregulated proteins by gene ontology based on their biological
processes, molecular function and protein class in MCF7 cells upon Zoledronate treatment
A) Distribution of proteins based on their molecular function using PANTHER analysis tool
B) Distribution of proteins based on their biological processes using PANTHER analysis tool
C) Distribution of proteins based on their protein class using PANTHER analysis tool
(Note: Only genes with well defined gene ontologies (GO) has been considered for analysis)
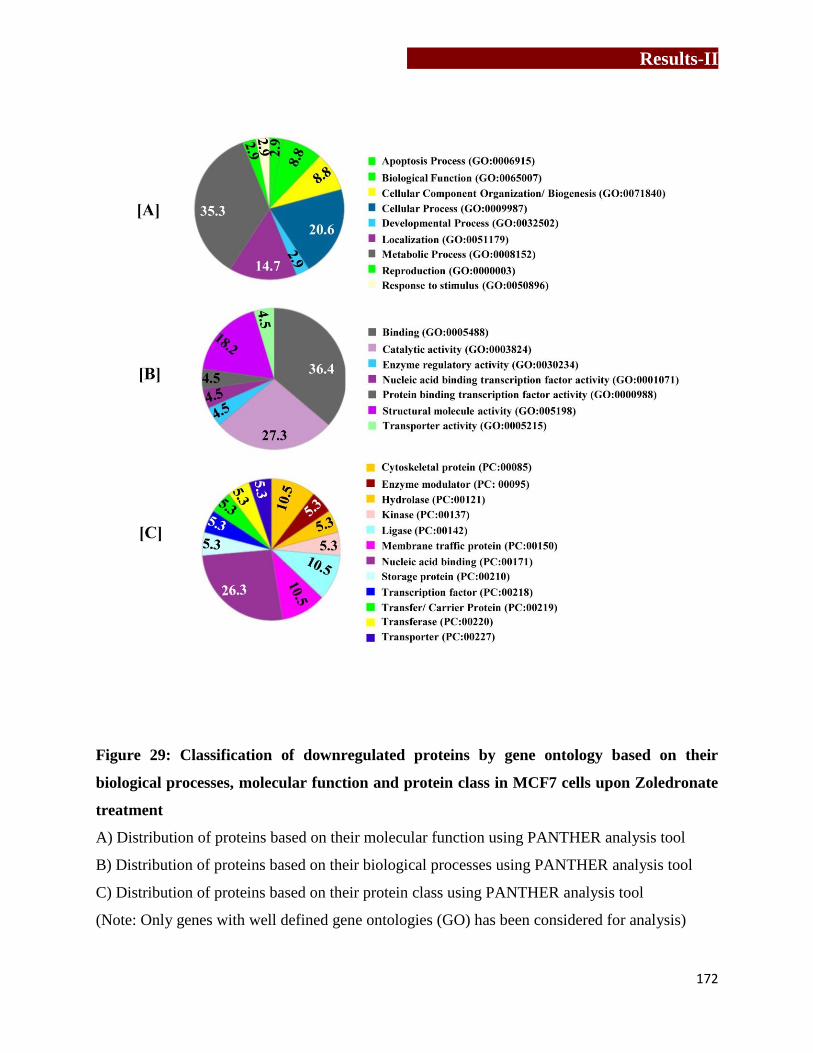
Results-II
172
Figure 29: Classification of downregulated proteins by gene ontology based on their
biological processes, molecular function and protein class in MCF7 cells upon Zoledronate
treatment
A) Distribution of proteins based on their molecular function using PANTHER analysis tool
B) Distribution of proteins based on their biological processes using PANTHER analysis tool
C) Distribution of proteins based on their protein class using PANTHER analysis tool
(Note: Only genes with well defined gene ontologies (GO) has been considered for analysis)
Results-II
173
5.4.2) Proteins associated with recruitment, activation and interaction with immune cell
Earlier studies form our laboratory have shown that, aminobisphosphonate (Pamidronate and
Zoledronate) treated tumor cells (MCF7) did not show any changes in expression of molecules
like MICA, FasL, ICAM-I, which are involved in conjugate formation, suggesting role of other
molecules. Therefore, protein profiles of untreated and Zoledronate treated MCF7 were analyzed
by proteomics approach. Comparative analysis of protein profiles of Zoledronate treated and
untreated MCF7 cells showed increase in expression of proteins involved in recruitment and
activation of γδ T cells along with increase in proteins involved in immune synapse formation
between T cells and target cells (Table 11). We observed, a significant increase in IPP
synthesizing enzyme “diphosphomevalonate decarboxylase” and calcium binding family protein
S100A8, in Zoledronate treated MCF7 cells. Increase in expression of heat shock factor 1
(HSF1) and HSP90bf was also noted in Zoledronate treated MCF7 cells. Our lab has earlier
reported that, HSPs are potent activators of γδ T cells and can specifically expands γδ T cells
from PBMCs [71]. Zoledronate treated MCF7 cells showed increased expression of α-enolase,
which acts as a receptor and activator of plasminogen on the cell surface leukocytes [260].
Expression of melanoma associated antigen D2 (acts as tumor associated antigen [261]) were
also found upregulated in Zoledronate treated MCF7 cells. Zoledronate treated MCF7 cells also
showed a significant increase in melanoma-associated antigen D2. Zoledronate treated MCF7
cells also showed a significant increase in molecules involved in synapse formation between T
cells and target cells which included dynamin-1-like protein, CD2-associated protein,
transforming protein RhoA, phocein, SLC9A3R2 protein, clusterins and laminin. Role of
dynamin-1-like protein has been proposed to regulate synaptic vesicle membrane dynamics,

Results-II
174
while CD2-associted proteins are implicated in dynamic actin remodeling and membrane
trafficking that occurs during receptor endocytosis and cytokinesis.
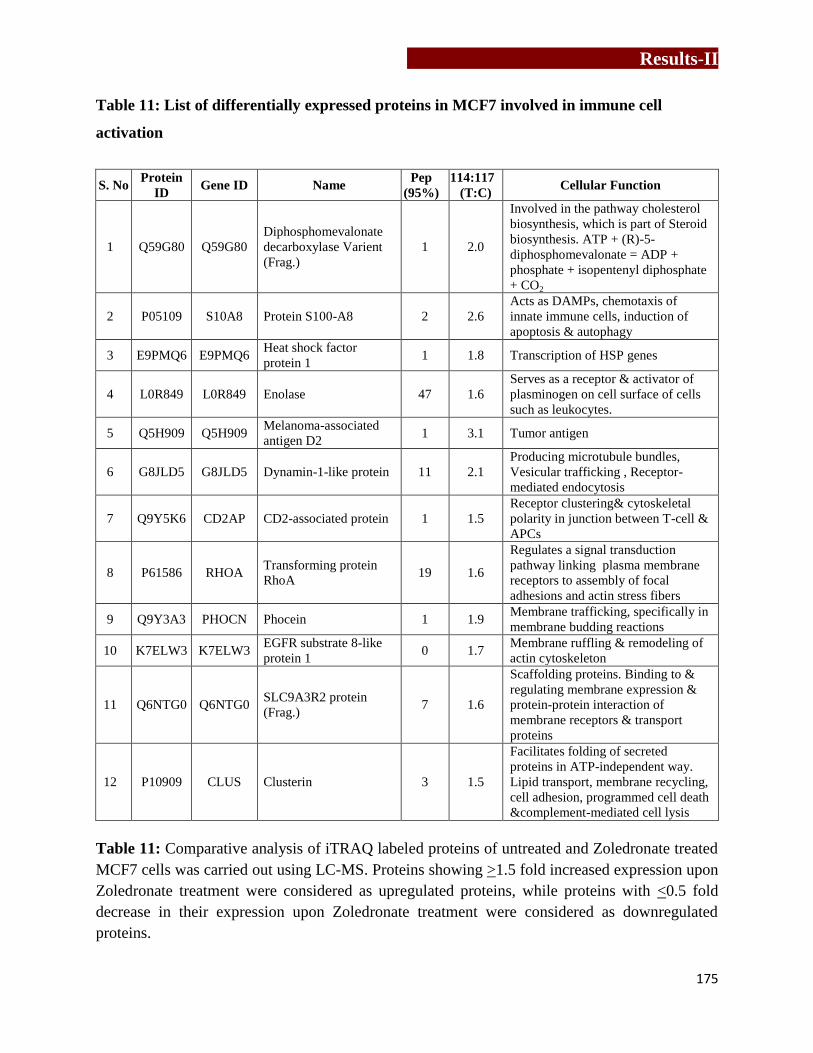
Results-II
175
Table 11: List of differentially expressed proteins in MCF7 involved in immune cell
activation
S. No Protein
ID Gene ID Name
Pep
(95%) 114:117
(T:C) Cellular Function
1 Q59G80 Q59G80
Diphosphomevalonate
decarboxylase Varient
(Frag.)
1 2.0
Involved in the pathway cholesterol
biosynthesis, which is part of Steroid
biosynthesis. ATP + (R)-5-
diphosphomevalonate = ADP +
phosphate + isopentenyl diphosphate
+ CO2
2 P05109 S10A8 Protein S100-A8 2 2.6
Acts as DAMPs, chemotaxis of
innate immune cells, induction of
apoptosis & autophagy
3 E9PMQ6 E9PMQ6 Heat shock factor
protein 1 1 1.8 Transcription of HSP genes
4 L0R849 L0R849 Enolase 47 1.6
Serves as a receptor & activator of
plasminogen on cell surface of cells
such as leukocytes.
5 Q5H909 Q5H909 Melanoma-associated
antigen D2 1 3.1 Tumor antigen
6 G8JLD5 G8JLD5 Dynamin-1-like protein 11 2.1
Producing microtubule bundles,
Vesicular trafficking , Receptor-
mediated endocytosis
7 Q9Y5K6 CD2AP CD2-associated protein 1 1.5
Receptor clustering& cytoskeletal
polarity in junction between T-cell &
APCs
8 P61586 RHOA Transforming protein
RhoA 19 1.6
Regulates a signal transduction
pathway linking plasma membrane
receptors to assembly of focal
adhesions and actin stress fibers
9 Q9Y3A3 PHOCN Phocein 1 1.9 Membrane trafficking, specifically in
membrane budding reactions
10 K7ELW3 K7ELW3 EGFR substrate 8-like
protein 1 0 1.7
Membrane ruffling & remodeling of
actin cytoskeleton
11 Q6NTG0 Q6NTG0 SLC9A3R2 protein
(Frag.) 7 1.6
Scaffolding proteins. Binding to &
regulating membrane expression &
protein-protein interaction of
membrane receptors & transport
proteins
12 P10909 CLUS Clusterin 3 1.5
Facilitates folding of secreted
proteins in ATP-independent way.
Lipid transport, membrane recycling,
cell adhesion, programmed cell death
&complement-mediated cell lysis
Table 11: Comparative analysis of iTRAQ labeled proteins of untreated and Zoledronate treated
MCF7 cells was carried out using LC-MS. Proteins showing >1.5 fold increased expression upon
Zoledronate treatment were considered as upregulated proteins, while proteins with <0.5 fold
decrease in their expression upon Zoledronate treatment were considered as downregulated
proteins.

Results-II
176
5.4.3) Protein associated with cell metabolism and apoptosis
Zoledronate affected the cell metabolism through multiple cellular processes, mostly by
perturbing essential cellular processes or by upregulating expression of apoptosis inducers or
tumor suppressors (Table 12). Zoledronate treated MCF7 cells showed significant
downregulation in proteins involved in vacuolar transport or vesicle trafficking. Expression of
protein involved in sorting and transport of proteins from endoplasmic reticulum to Golgi or
early/late Golgi compartments were found downregulated (Table 12A) in Zoledronate treated
MCF7 cells. As shown in Table 12B, proteins involved in fatty acid metabolism such as
gangliosides GM2 activator and fatty acid desaturase 2 were found downregulated upon
Zoledronate treatment in MCF7. Zoledronate treatment showed a significant reduction in
expression of PEX19 proteins, which is essential in early peroxisomal biogenesis pathway.
Pex19 binds to hydrophobic residues of newly synthesized peroxisomal membrane proteins in
cytoplasm, stabilizes them and targets them to peroxisomal membranes. Zoledronate treatment of
MCF7 was also found to affect copper homeostasis by changing expression of copper transport
protein. Expression of CutA (binds to copper and retains it inside the cell) was upregulated,
whereas and expression of CutC (plays key role in export of excessive copper outside the cell)
was downregulated. A significant upregulation in FKBP8 protein, which belongs to peptidyl-
prolyl cis-trans isomerase enzyme, was observed in Zoledronate treated MCF7 cells. This protein
acts as a chaperone, which phosphorylates BCL2 & interferes binding of BCL2 to its targets.
Significant increase in expression of cytochrome C assembly factor 3 and 4, which are essential
for cytochrome c oxidase function was found in Zoledronate treated MCF7 cells. Zoledronate
treated MCF7 cells also induced expression of apoptosis inducers as mentioned in Table 12C. It

Results-II
177
clearly indicates that, Zoledronate puts the breast tumor cells in metabolic crisis and induces
apoptosis.
Table 12: List of differentially expressed proteins in MCF7 involved in important cellular
processes
A) Protein Synthesis, Trafficking and deg radation
S.No Protein
ID Gene ID Name
Pep
(95%)
114:117
(T:C) Cellular Function
1 B2RA72 B2RA72 cDNA, FLJ94734,
CHMP1.5 1 0.2 Vacuolar transport
2 Q8N1X3 Q8N1X3
cDNA FLJ37317 fis,
clone BRAMY2017455,
highly similar to Homo
sapiens ATP-binding
cassette protein M-
ABC1 mRNA
1 0.4
Transport
various substrates across
cellular membranes
3 Q53GF4 Q53GF4 Syntaxin binding protein
2 variant (Frag.) 2 0.4
Intracellular vesicle trafficking
and vesicle fusion with
membranes
4 Q96FJ2 DYL2 Dynein light chain 2,
cytoplasmic 2 0.5
Non-catalytic accessory
components of cytoplasmic
dynein 1 complex
5 F5H4Q5 F5H4Q5
Vacuolar protein
sorting-associated
protein 37C Fra
1 0.5 Vacuolar protein sorting
6 Q10567 AP1B1 AP-1 complex subunit
β1 1 0.5
Protein sorting in the late-
Golgi/trans-Golgi network
7 Q5T0G8 Q5T0G8 Annexin 14 0.5 Vesicular transport, Membrane
scaffolding, apoptosis
8 H7C426 H7C426 E3 ubiquitin-protein
ligase RNF181 (Frag.) 1 0.5 Protein ubiquitination
9 J3KNJ2 J3KNJ2
Eukaryotic translation
initiation factor 3
subunit M (Frag)
1 0.5
Component of eukaryotic
translation initiation factor 3
(eIF-3) complex, which is
required for several steps in the
initiation of protein synthesis
10 H7BZ18 H7BZ18
Multiple coagulation
factor deficiency protein
2 (Frag.)
1 0.5
The MCFD2-LMAN1 complex
forms a specific cargo receptor
for ER-to-Golgi transport of
selected proteins
11 F8W6G1 F8W6G1 Nuclear receptor-
binding protein 1 0.5
Subcellular trafficking between
ER & Golgi apparatus through
interactions with Rho-type
GTPases
12 Q59GU6 Q59GU6 Sorting nexin 1 isoform
a variant (Frag.) 2 1.6
Targets ligand-activated EGFR
to lysosome for degradation
after endocytosis from cell
surface & release from golgi

Results-II
178
B) Important cellular processes
S.No Protein
ID Gene ID Name
Pep
(95%)
114:117
(T:C) Cellular Function
1 P17900 SAP3 Ganglioside GM2
activator 1 0.2
Phospholipids & FA
metabolism
2 P40855 PEX19 Peroxisomal biogenesis
factor 19 2 0.3 Early peroxisomal biogenesis
3 O95864 FADS2 Fatty acid desaturase 2 1 0.4 Fatty acid metabolism
4 Q32Q10 Q32Q10 RSU1 protein (Frag.) 3 0.5 Ras suppressor protein
5 F8W022 F8W022 CD63 antigen (Frag.) 1 0.5
Promotes cell survival,
migration, intracellular vesicular
transport processes
6 Q9NTM9 CUTC Copper homeostasis
protein cutC homolog 1 0.4 Copper export
7 Q7Z727 Q7Z727 PRKCA protein (Frag.) 1 0.4 Phosphorylates proteins in
diverse signaling pathways
8 Q9UQ98 Q9UQ98 Multidrug resistance
protein (Frag.) 1 0.5 Extrusion of drugs from cell
9 C9JKQ2 C9JKQ2
NADH dehydrogenase
[ubiquinone] 1 β subco-
mplex subunit 3 Frag
1 0.5
Accessory subunit of mito.
membrane respiratory chain
NADH dehydrogenase
10 H7BXQ8 H7BXQ8 Armadillo repeat-
containing protein 10 1 0.5
Cell survival and cell growth,
Suppress the transcriptional
activity of p53/TP53
11 L0R6Q1 L0R6Q1 Alternative protein
SLC35A4 1 0.5
Probable UDP-sugar transporter
protein SLC35A4
12 B4E245 B4E245
cDNA FLJ61538, highly
similar to Switch-
associated protein 70
3 0.5
Mediates signaling of membrane
ruffling, Regulates the actin
cytoskeleton
13 O60888 CUTA Protein CutA 1 1.5 Copper binding protein
14 Q9NYJ1 COA4 Cytochrome c oxidase
assembly factor 4 1 1.5 Putative COX assembly factor
15 Q9Y320 TMX2 Thioredoxin-related
transmem protein 2 4 1.6 Stress sensors
16 J3KQ73 J3KQ73 Peptidyl-prolyl cis-trans
isomerase FKBP8 3 1.8
Phosphorylate BCL2 & interfers
with binding of BCL2 to targets
17 P35754 GLRX1 Glutaredoxin-1 4 1.9
GNT-binding proteins,
downstream of G protein-
coupled receptors
18 Q9Y3A3 PHOCN MOB-like protein
phocein 1 1.9
Involved in hippo pathways
(plays pivotal role in organ size
control & tumor, suppression by
restricting proliferation &
promoting apoptosis)
19 K7EPV0 K7EPV0 Cytochrome c oxidase
assembly protein 3 1 1.9
Essential for cytochrome c
oxidase function
Table 12 (continued…)

Results-II
179
C) Apoptosis Inducers and tumor suppresso r
S.No Protein
ID Gene ID Name
Pep
(95%)
114:117
(T:C) Cellular Function
1 P14923 PLAK Junction plakoglobin 3 1.5
Pivotal role in regulation of cell-
cell adhesion, regulates gene
expression, cell proliferation,
apoptosis, invasion & migration,
acts as a tumor/ metastasis
suppressor
2 Q7Z426 Q7Z426 Putative MAPK
activating protein 4 1.6
Proliferation, gene expression,
differentiation, mitosis, cell
survival, and apoptosis
3 Q0VAM0 Q0VAM0 Catenin, beta like 1 1 1.7
Component of PRP19-CDC5L
complex (spliceosome). May
induce apoptosis.
4 Q53FV3 Q53FV3 COP9 signalosome
subunit 4 2 1.7
Promoting & protection of
p53/TP53, c-jun/JUN from
degradation by phosphorylation
5 J3KQ73 J3KQ73 Peptidyl-prolyl cis-trans
isomerase FKBP8 3 1.8
Chaperone for BCL2,
phosphorylates it & interfering
with binding of BCL2 to its
targets
6 Q9Y3A3 PHOCN Phocein 1 1.9
Membrane trafficking,
specifically in membrane
budding reactions
7 P35754 GLRX1 Glutaredoxin-1 4 1.9
GNT-binding proteins,
downstream of G protein-
coupled receptors
8 P62745 RHOB Rho-related GTP-
binding protein RhoB 5 2.8 Mediates apoptosis
Table 12: Expression of number proteins involved in cellular processes like A) protein synthesis,
trafficking and degradation, B) Important cellular processes, C) apoptosis inducers and tumor
suppressors, were found changed in Zoledronate treated MCF7 cells. Comparative analysis of
iTRAQ labeled proteins of untreated and Zoledronate treated MCF7 cells was carried out using
LC-MS. Proteins showing >1.5 fold increased expression upon Zoledronate treatment were
considered as upregulated proteins, while proteins with <0.5 fold decrease in their expression
upon Zoledronate treatment were considered as downregulated proteins.
Table 12 (continued…)
Results-II
180
5.5) Interactome analysis
The data was also analyzed using an interactome software- STRING (Search Tool for the
Retrieval of Interacting Genes/Proteins) database (version 9.6). STRING database contains
information from numerous sources, including experimental data, computational prediction
methods and public text collections and is used to predict protein-protein interactions. The
proteins were selected through textmining, experiments and databases at medium confidence
(0.4) interaction score. STRING analysis showed effect of Zoledronate treatment on cellular
metabolism like cytoskeletal elements, DNA-RNA processing and degradation, protein
synthesis, protein degradation, vesicular trafficking (Figure 30). Interestingly, some proteins
showed functional link to epidermal growth factor receptor (EGFR).
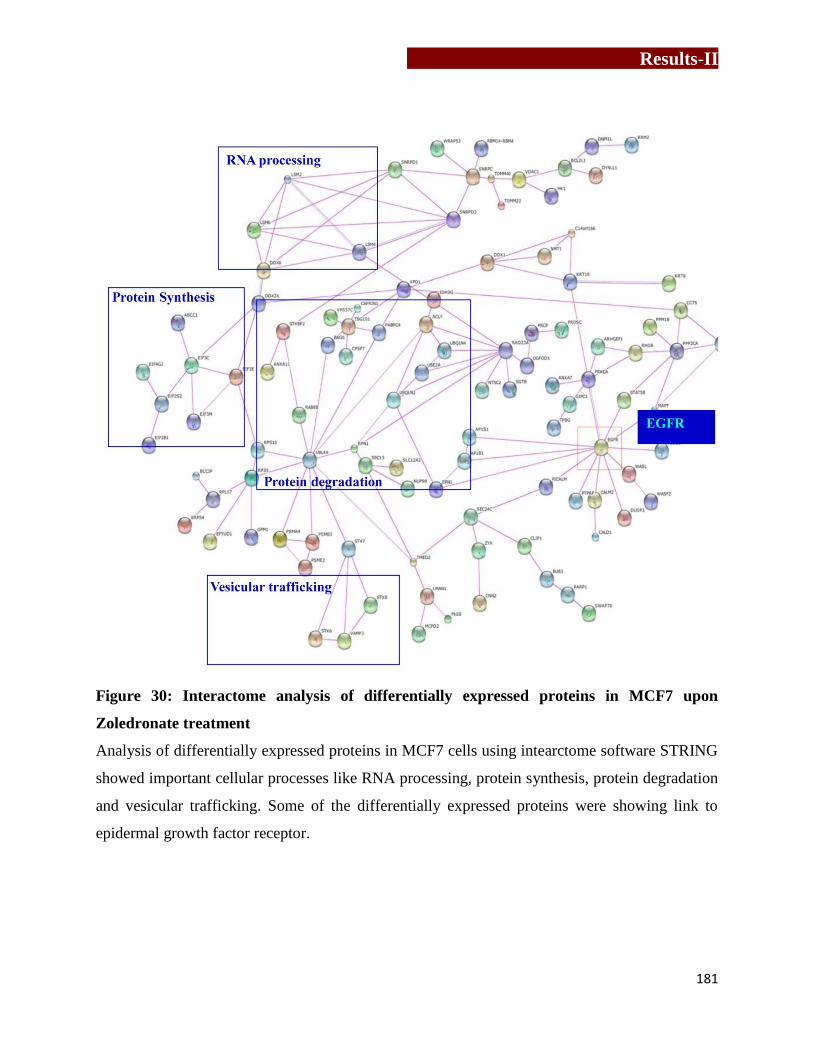
Results-II
181
Figure 30: Interactome analysis of differentially expressed proteins in MCF7 upon
Zoledronate treatment
Analysis of differentially expressed proteins in MCF7 cells using intearctome software STRING
showed important cellular processes like RNA processing, protein synthesis, protein degradation
and vesicular trafficking. Some of the differentially expressed proteins were showing link to
epidermal growth factor receptor.
Results-II
182
5.6) Validation of differentially expressed proteins
5.6.1) Effect of Zoledronate on cytoskeletal elements
5.6.1.1) Effect of Zoledronate on actin rearrangement in MCF7 cells
Actin microfilaments are major component of the cytoskeletal elements which controls shape
and movement of the cell. Actin structures are controlled by the Rho family of small GTP-
binding proteins such as Rho. Actin is a globular protein (42KDa) which reversibly polymerizes
to form filamentous structure known as F-actin [262]. Expression of multiple components of the
actin related protein 2/3 (ARP 2/3) was found to be downregulated in Zoledronate treated MCF7
cells (Table 13A). ARP2/3 is known as actin nucleation core as it is involved in initial process of
actin polymerization. It binds to the existing/mother filaments and initiates growth of a
new/daughter filament. Expression of another protein arpin protein (UPF0552 protein C15orf3),
which inhibits actin-nucleating activity of Arp2/3 complex was found upregulated upon
Zoledronate treatment in MCF7 cells. Overall, proteins involved in the process of actin
polymerization were found to be majorly affected upon Zoledronate treatment of MCF7 cells.
This effect was verified by confocal imaging, where untreated and Zoledronate treated MCF7
cells were stained with phalloidin-TRITC. As shown in Figure 31A, Zoledronate treated MCF7
cells showed disorganization of actin cytoskeleton. A marked derangement in actin filaments
was observed in Zoledronate treated MCF7 cells. It was observed that, Zoledronate disrupted the
focal adhesions and actin bundles/ fibers in MCF7 cells. However at the protein level, there was
no change observed in the expression of β-actin upon Zoledronate treatment, as validated by
western blotting (Figure 31A and D).

Results-II
183
5.6.1.2) Effect of Zoledronate on keratins in MCF7 cells
Keratins provide scaffold for epithelial cells, sustain mechanical stress, maintain structural
integrity, ensure mechanical resilience, protect against variations hydrostatic pressure and
establish cell polarity. Expressions of both acidic and basic keratins were found downregulated
upon zoledronate treatment in MCF7 cells, when analyzed by 2D-PAGE/MALDI-TOF (Table 8)
and iTRAQ/LC-MS (Table 13B). Expression of keratin 8, when validated by western blotting,
did not show significant changes upon Zoledronate treatment at protein level, (Figure 31B and
D). However, confocal imaging of keratin 8 showed thinning of keratin filaments in Zoledronate
treated MCF7 cells.
5.6.1.3) Effect of Zoledronate on tubulin in MCF7 cells
Microtubules are the largest filamentous structures of the cytoskeleton with a diameter of about
20 nm. α- and β -tubulin molecules form heterodimers to form microtubules. Protofilaments are
formed from there heterodimers using GTPases, which further combines to form a hollow
microtubule. Microtubules are polarized and, thus, can act as conveyor belts for micro-motor
molecules (e.g. dynein, kinesin) similar to microfilaments. Microtubules have the ability to shift
through various formations which enables the cell to undergo mitosis or to regulate intracellular
transport. Upregulation of tubulin was observed in both 2D-PAGE/MALDI-TOF (Table 8) and
iTRAQ/LC-MS (Table 13C). Thus the effects of Zoledronate treatment on re-organization and
expression of microtubules was analyzed by staining Zoledronate treated and untreated MCF7
cells with anti α-tubulin antibody. Since tubulin forms heterodimer of α and β tubulin subunits,
which share >50% homology, we used α tubulin antibody for confocal imaging and western
blotting experiments. Zoledronate treatment of MCF7 cells did not affect reorganization, which
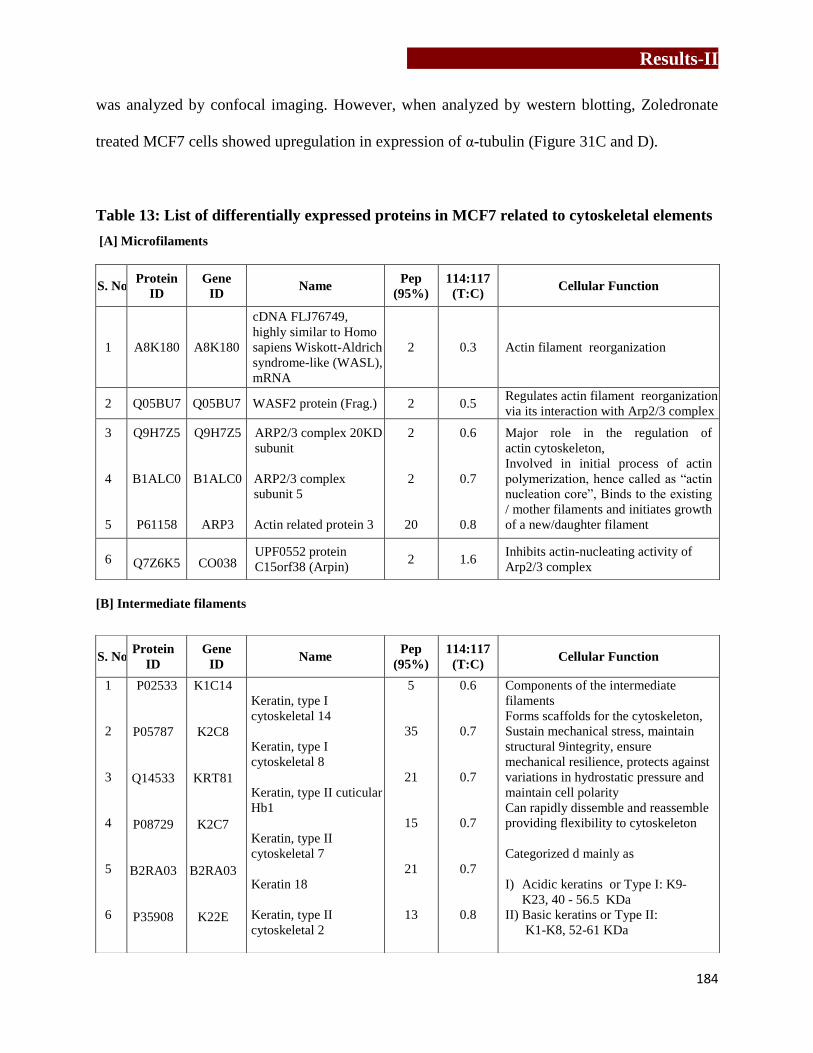
Results-II
184
was analyzed by confocal imaging. However, when analyzed by western blotting, Zoledronate
treated MCF7 cells showed upregulation in expression of α-tubulin (Figure 31C and D).
Table 13: List of differentially expressed proteins in MCF7 related to cytoskeletal elements
[A] Microfilaments
[B] Intermediate filaments
S. No Protein
ID Gene
ID Name
Pep
(95%) 114:117
(T:C) Cellular Function
1 A8K180 A8K180
cDNA FLJ76749,
highly similar to Homo
sapiens Wiskott-Aldrich
syndrome-like (WASL),
mRNA
2 0.3 Actin filament reorganization
2 Q05BU7 Q05BU7 WASF2 protein (Frag.) 2 0.5 Regulates actin filament reorganization
via its interaction with Arp2/3 complex
3
4
5
Q9H7Z5
B1ALC0
P61158
Q9H7Z5
B1ALC0
ARP3
ARP2/3 complex 20KD
subunit
ARP2/3 complex
subunit 5
Actin related protein 3
2
2
20
0.6
0.7
0.8
Major role in the regulation of
actin cytoskeleton,
Involved in initial process of actin
polymerization, hence called as “actin
nucleation core”, Binds to the existing
/ mother filaments and initiates growth
of a new/daughter filament
6 Q7Z6K5 CO038 UPF0552 protein
C15orf38 (Arpin) 2 1.6
Inhibits actin-nucleating activity of
Arp2/3 complex
S. No Protein
ID Gene
ID Name
Pep
(95%) 114:117
(T:C) Cellular Function
1
2
3
4
5
6
P02533
P05787
Q14533
P08729
B2RA03
P35908
K1C14
K2C8
KRT81
K2C7
B2RA03
K22E
Keratin, type I
cytoskeletal 14
Keratin, type I
cytoskeletal 8
Keratin, type II cuticular
Hb1
Keratin, type II
cytoskeletal 7
Keratin 18
Keratin, type II
cytoskeletal 2
5
35
21
15
21
13
0.6
0.7
0.7
0.7
0.7
0.8
Components of the intermediate
filaments
Forms scaffolds for the cytoskeleton,
Sustain mechanical stress, maintain
structural 9integrity, ensure
mechanical resilience, protects against
variations in hydrostatic pressure and
maintain cell polarity
Can rapidly dissemble and reassemble
providing flexibility to cytoskeleton
Categorized d mainly as
I) Acidic keratins or Type I: K9-
K23, 40 - 56.5 KDa
II) Basic keratins or Type II:
K1-K8, 52-61 KDa

Results-II
185
[C] Microtubules
S. No Protein
ID Gene
ID Name
Pep
(95%) 114:117
(T:C) Cellular Function
1 R4GMT0 R4GMT0 α-Centractin 2 0.3 Microtubule based vesicle motility
2 A2BDK6 A2BDK6 Microtubule-associated
protein 1B 3 0.6
Binds to at least two tubulin subunits
in the polymer & this bridging of
subunits might be involved in
nucleating microtubule polymerization
and in stabilizing microtubules.
Acts as a positive cofactor in DAPK1-
mediated autophagic vesicle formation
and membrane blebbing
3 B7U472 B7U472 Microtubule-associated
protein tau 1 0.7
Promotes microtubule assembly and
stability
4
5
6
Q5SU16
Q13509
Q9BUF
Q5SU16
TBB3
TBB6
Tubulin β-5 chain
Tubulin β-3 chain
Tubulin β-6 chain
107
51
36
1.2
1.2
1.2
Belongs to microtubule family
Assembled from α and β tubulin
heterodimers
Microtubules are largest filamentous
structures of cytoskeleton (20nm)
Table 13: Changes in expression of cytoskeletal elements and proteins involved in
reorganization of [A] microfilament, [B] Intermediate filament and [C] microtubules were found
in MCF7 upon Zoledronate treatment. Proteins showing >1.5 fold increased expression upon
Zoledronate treatment were considered as upregulated proteins, while proteins with < 0.5 fold
decrease in their expression upon Zoledronate treatment were considered as downregulated
proteins
Table 13 (continued…)
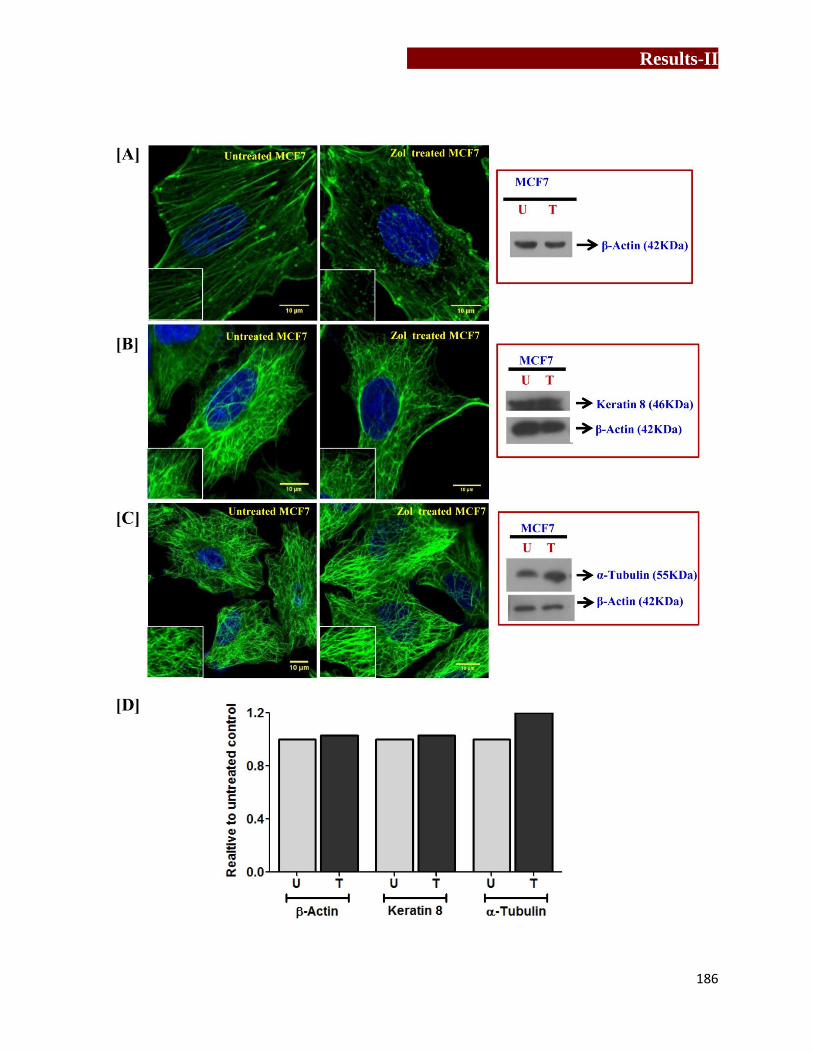
Results-II
186
Results-II
187
Figure 31: Effect of Zoledronate treatment on reorganization and expression of
cytoskeletal elements in MCF7
Re-organization and expression of actin, keratin 8 and tubulin in MCF7 cells upon Zoledronate
treatment was analyzed by confocal microscopy and western blotting respectively. [A] To
analyze changes in expression of actin, Zoledronate treated and untreated MCF7 cells were
stained with Phalloidin-TRITC. Change in expression of β-actin was analyzed by western
blotting. [B] Untreated and Zoledronate treated MCF7 cells were stained with anti-human
Keratin-8-AF488. [C] To study changes in reorganization of α-tubulin, untreated and
Zoledronate treated MCF7 cells were stained with α-Tubulin-AF488 antibody, [D] Densitometry
analysis of fold changes in expression of β-actin, keratin 8 and α-Tubulin in Zoledronate treated
MCF7 cells relative to untreated MCF7 cells (control). The figure is representative of three
independent experiments.

Results-II
188
5.6.2) Effect of Zoledronate on expression of heat shock proteins in MCF7 cells
Role of HSP 60 expressed on tumor cells in activation of γδ T cells has earlier been discussed
[71]. HSP60 is a eukaryotic mitochondrial chaperone, which also localizes in the cytosol, on cell
surface, extracellular space and in the peripheral blood under normal physiological conditions
[263,264]. HSP60 plays an important role in prevention of apoptosis by forming complexes with
the proteins involved in apoptosis. HSP activates “danger signal cascade” of immune response,
generated as a response to prevent any infection or disease. HSPs act as potent antigens of γδ T
cells [71,265,266, 267]. In our studies, Zoledronate treated MCF7 cells showed increased
expression of heat shock factor 1 and HSP90bf when analyzed by iTRAQ/LCMS (Table 9). Heat
shock factor 1 is a transcription factor transcribes expression of HSP70 and HSP90. Therefore,
effect of Zoledronate on expression of heat shock proteins (HSP60 and HSP70) was analyzed by
western blotting. Expression of HSP60 was not significantly altered, as analyzed both by western
blotting (Figure 32A) or confocal microscopy (Figure 32B). Further, flow cytometry was used to
study time kinetics of HSP60 and HSP70 expression (surface and intracellular) upon zoledronate
treatment in MCF7 cells. Expression of HSP60 and HSP70 on Zoledronate treated (100μM) and
untreated MCF7 cells were monitored after every 2 hrs for 24 hrs at 37˚C with baseline
expression at 0th
hr. As shown in Figure 32C, changes in expression of HSP60 were observed
with transient increase after 18 hrs in Zoledronate treated MCF7 cells compared to untreated
MCF7 cells. In case of HSP70, the expression was found to be reduced upon Zoledronate
treatment (Figure 32D).
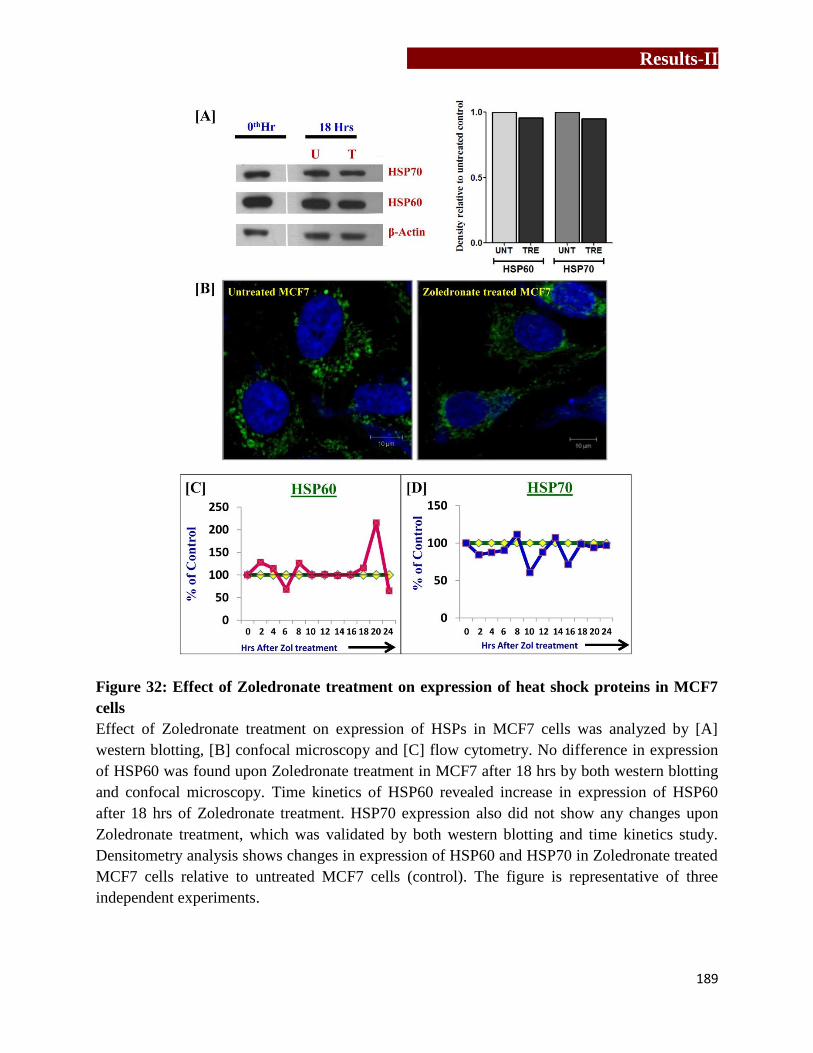
Results-II
189
Figure 32: Effect of Zoledronate treatment on expression of heat shock proteins in MCF7
cells
Effect of Zoledronate treatment on expression of HSPs in MCF7 cells was analyzed by [A]
western blotting, [B] confocal microscopy and [C] flow cytometry. No difference in expression
of HSP60 was found upon Zoledronate treatment in MCF7 after 18 hrs by both western blotting
and confocal microscopy. Time kinetics of HSP60 revealed increase in expression of HSP60
after 18 hrs of Zoledronate treatment. HSP70 expression also did not show any changes upon
Zoledronate treatment, which was validated by both western blotting and time kinetics study.
Densitometry analysis shows changes in expression of HSP60 and HSP70 in Zoledronate treated
MCF7 cells relative to untreated MCF7 cells (control). The figure is representative of three
independent experiments.

Results-II
190
5.6.3) Effect of Zoledronate treatment on expression of epidermal growth factor receptor
(EGFR/ErbB1) in MCF7 cells
Interactome analysis of upregulated and downregulated proteins using STRING showed link to
EGFR. Zoledronate treated cells MCF7 showed increased expression of RhoB and sortin nexin1
protein (Table 14). RhoB, a small GTPase from Rho family, is the only protein known to exist as
both farnesylated and geranylgeranylated forms within the cell [268]. Farnesyl transferase
inhibitors cause increase in geranylgeranylated form of RhoB, which causes EGFR degradation
[269]. As shown in Figure 33A, EGFR dimers are internalized and are transferred to
microvesicular bodies (MVBs), where it is degraded by lysosomal enzymes. RhoB has been
shown to be associated with both early endosomal vesicles and MVBs (a prelysosomal
compartment which is involved in the sorting of internalized receptors for degradation [268,270].
Mammalian sortin nexin family proteins have been implicated in endocytic trafficking of cell
surface receptors. Sortin nexin 1 (SNX1) was identified particularly by its interaction with EGFR
[271]. SNX1 recognizes EGFR lysosome targeting signals and targets EGFR to lysosome [271].
Expression of EGFR was found to be reduced upon Zoledronate treatment in MCF7 cells when
analyzed by western blotting (Figure 33B).

Results-II
191
Table 14: List of differentially expressed proteins in MCF7 involved in EGFR signaling
S. No
Protein
ID Gene
ID Name
Pep
(95%) 114:117
(T:C) Cellular Function
1 P62745 RHOB
Rho-related GTP-
binding protein
RhoB
5 2.8
Involved in trafficking of the
EGFR from late endosomes to
lysosomes
2 Q59GU6 Q59GU6
Sorting nexin 1
isoform a variant
(Frag.)
2 1.6
Targets ligand-activated EGFR to
lysosome for degradation after
endocytosis from cell surface &
release from Golgi
Table 14: Proteins involved in EGFR degradation in ErbB/ HER signaling pathway showed
increase in their expression. Comparative analysis of iTRAQ labeled proteins of untreated and
Zoledronate treated MCF7 cells was carried out using LC-MS. Proteins showing >1.5 fold
increased expression upon Zoledronate treatment were considered as upregulated proteins, while
proteins with <0.5 fold decrease in their expression upon Zoledronate treatment were considered
as downregulated proteins.
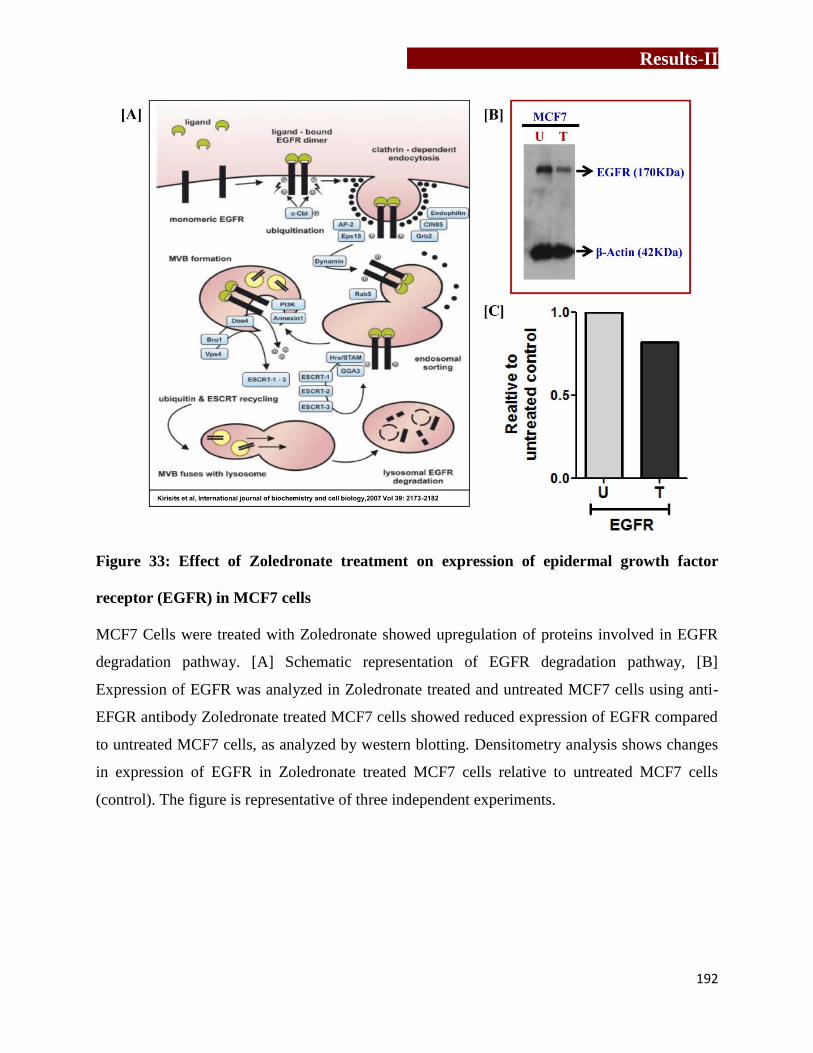
Results-II
192
Figure 33: Effect of Zoledronate treatment on expression of epidermal growth factor
receptor (EGFR) in MCF7 cells
MCF7 Cells were treated with Zoledronate showed upregulation of proteins involved in EGFR
degradation pathway. [A] Schematic representation of EGFR degradation pathway, [B]
Expression of EGFR was analyzed in Zoledronate treated and untreated MCF7 cells using anti-
EFGR antibody Zoledronate treated MCF7 cells showed reduced expression of EGFR compared
to untreated MCF7 cells, as analyzed by western blotting. Densitometry analysis shows changes
in expression of EGFR in Zoledronate treated MCF7 cells relative to untreated MCF7 cells
(control). The figure is representative of three independent experiments.

Results-II
193
5.6.4) Effect of Zoledronate on cell cycle on breast tumor cell line
Upon Zoledronate treatment MCF7 cells showed changes in expression of proteins required for
initiation of DNA replication, chromatin remodeling, cells cycle progression and DNA repair
(Table 15). Thus effect of Zoledronate treatment on cell cycle of breast tumor cells lines (MCF7
and MDAMB-231) was analyzed by flow cytometry by detection of nucleic acid stained with
propidium iodide (PI). Breast tumor cells lines (MCF7 and MDAMB-231) were serum starved
and then were treated with Zoledronate or left untreated for 16-18 hrs. Control (0th
hr cells,
before addition of Zoledronate) and test (cells incubated with Zoledronate or in medium alone
for 16-18 hrs) breast tumor cells (MCF7 cells and MDAMB-231) were fixed in chilled 70%
ethanol and were then stained with PI. With Modfit software, cells were gated on singlets using
width and area signals and cells in G0-G1, S and G2-M phase were calculated. Percentage of
cells in a particular phase of cell cycle were analyzed by calculating the differences in their
DNA content (PI) depicted as deconvolutions of histogram. As shown in Figure 34A and B, after
serum starvation more that ~98% MCF7 cells, while 90% MDAMB-231 cells were found
arrested in G0 phase. As shown in Figure 34A, Zoledronate treatment arrested MCF7 cells in S-
phase. As shown in Figure 34C, after 16-18 hrs, untreated MCF7 cells showed 85%
(mean+SEM) cells in G0 phase with 8% cells in S-phase and 7% cells in G2-M phase, while
Zoledronate treatment significantly arrested MCF7 cells in S- phase (30%) with 68 % cells in
G0-G1 phase and nearly absent in G2-M phase. In case of MDAMB-231 cells, Zoledronate
treatment arrested the cells in G0-G1 phase (Figure 34B). As shown in Figure 34D, Zoledronate
treatment in MDAMB-231 cells showed G0-G1 arrest (73%) with 20% cells in S-phase and 6%
cells in G2-M phase. Among untreated MDAMB-231 cells, 45% cells were G0-G1, 45% cells
were in S-phase and 10% cells in G2-M phase.
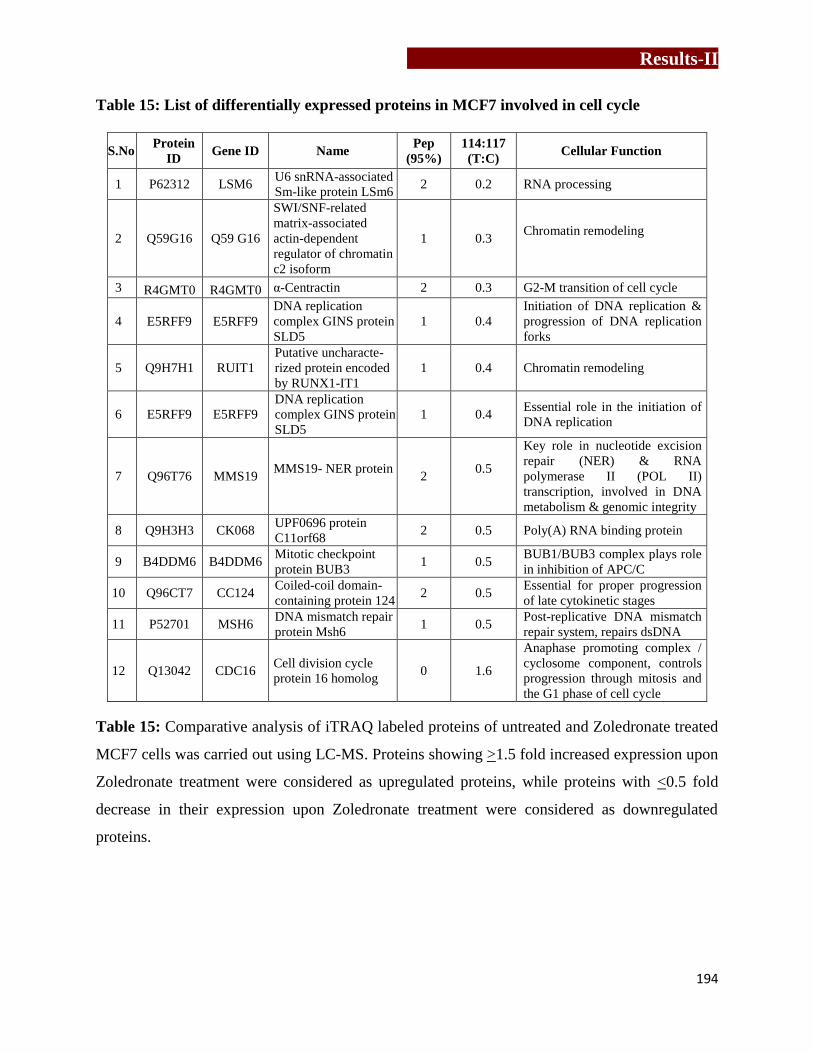
Results-II
194
Table 15: List of differentially expressed proteins in MCF7 involved in cell cycle
S.No Protein
ID Gene ID Name
Pep
(95%) 114:117
(T:C) Cellular Function
1 P62312 LSM6 U6 snRNA-associated
Sm-like protein LSm6 2 0.2 RNA processing
2 Q59G16 Q59 G16
SWI/SNF-related
matrix-associated
actin-dependent
regulator of chromatin
c2 isoform
1 0.3 Chromatin remodeling
3 R4GMT0 R4GMT0 α-Centractin 2 0.3 G2-M transition of cell cycle
4 E5RFF9 E5RFF9
DNA replication
complex GINS protein
SLD5
1 0.4
Initiation of DNA replication &
progression of DNA replication
forks
5 Q9H7H1 RUIT1
Putative uncharacte-
rized protein encoded
by RUNX1-IT1
1 0.4 Chromatin remodeling
6 E5RFF9 E5RFF9
DNA replication
complex GINS protein
SLD5
1 0.4 Essential role in the initiation of
DNA replication
7 Q96T76 MMS19 MMS19- NER protein
2
0.5
Key role in nucleotide excision
repair (NER) & RNA
polymerase II (POL II)
transcription, involved in DNA
metabolism & genomic integrity
8 Q9H3H3 CK068 UPF0696 protein
C11orf68 2 0.5 Poly(A) RNA binding protein
9 B4DDM6 B4DDM6 Mitotic checkpoint
protein BUB3 1 0.5
BUB1/BUB3 complex plays role
in inhibition of APC/C
10 Q96CT7 CC124 Coiled-coil domain-
containing protein 124 2 0.5
Essential for proper progression
of late cytokinetic stages
11 P52701 MSH6 DNA mismatch repair
protein Msh6 1 0.5
Post-replicative DNA mismatch
repair system, repairs dsDNA
12 Q13042 CDC16 Cell division cycle
protein 16 homolog 0 1.6
Anaphase promoting complex /
cyclosome component, controls
progression through mitosis and
the G1 phase of cell cycle
Table 15: Comparative analysis of iTRAQ labeled proteins of untreated and Zoledronate treated
MCF7 cells was carried out using LC-MS. Proteins showing >1.5 fold increased expression upon
Zoledronate treatment were considered as upregulated proteins, while proteins with <0.5 fold
decrease in their expression upon Zoledronate treatment were considered as downregulated
proteins.

Results-II
195
Figure 34: Effect of Zoledronate treatment on cell cycle of breast tumor cells
Breast tumor cell lines (MCF7 and MDAMB-231) were serum starved for 72 hrs and then
treated with Zoledronate or left untreated for 16-18 hrs. Further cells were stained for propidium
iodide. Atleast 10000 events were acquired on FACS Caliber and data was analyzed using

Results-II
196
Modfit software. [A,C] Upon Zoledronate treatment MCF7 cells got arrested in S-phase, with no
cells in G2-M phase. [B, D] In case of MDAMB-231 cells, Zoledronate treated cells were
arrested in G0-G1 phase showing reduced percentages of cells in S-phase and G2-M phase. Data
shown as mean + SEM of atleast 5 independent experiments. Significance is given by p value as
p<0.05(*), p<0.005(**) and p<0.0005(***)
In conclusion, Zoledronate treatment mediates its antitumor effect by two mechanisms-
by destabilizing cellular metabolism and through activation of γδ T cells. Zoledronate treated
breast tumor cells exhibited increased expression of proteins which could potentially recruit and
activate γδ T cells, which are known to have antitumor functions against broad range of tumors.

Results-III
197
Chapter 6
Immune profiling of breast cancer patients on
Zoledronate treatment

Results-III
198

Results-III
199
Zoledronate is used for prevention of skeletal-related events in patients with bone
metastases and other skeletal malignancies such as osteoporosis [58,214,272,273,274]. During
the last few years, evidence has accumulated that in addition to reducing osteolysis and
preserving bone, Zoledronate has shown anti cancer activity during adjuvant therapy of breast
cancer. Adjuvant Zoledronic Acid to Reduce Recurrence (AZURE) trial did not support the use
of Zoledronate as adjuvant therapy in breast cancer [275,276]. However further analysis
indicated that Zoledronate adjuvant therapy improve disease free survival in postmenopausal
breast cancer patients but not in premenopausal women. These findings were in contrast to
another study- the ABCSG-12 trial, showing improved disease free survival in premenopausal
early- stage breast cancer patients receiving Zoledronate adjuvant therapy [277,278]. Thus there
may be other cells or factors modulating the Zoledronate antitumor effects in addition to the role
of Zoledronate in targeting osteoclasts. Emerging evidence suggest that immune cells play a
critical role in controlling local tumor growth within the bone microenvironment. Zoledronate
was reported to increase the number of γδ T cells, however these studies were not in breast
cancer and not done in vivo. As mentioned earlier, Zoledronate inhibits FPPS enzyme of the
mevalonate pathway and this results in the upregulation of intracellular levels of IPP, which is a
potent activator of γδ T cells.
The purpose of the present study was to characterize the immunomodulatory effects of
Zoledronate in breast cancer patients who had bone metastasis and were on Zoledronate
treatment versus untreated breast cancer patients.

Results-III
200
6.1) Demographic analysis of breast cancer patients
Peripheral blood samples were collected from two groups of breast cancer
patients (stage I-IV, n=36) - (a) patients who were on Zoledronate treatment (Rx+, n= 21) for
atleast 3 months and (b) patients who had not received Zoledronate treatment i.e untreated (Rx-,
n=15). Zoledronate (4 mg) was intravenously (15 min) administered to the breast cancer
patients at the interval of every 4 weeks. As control, peripheral blood samples were collected
from age matched healthy female volunteers (n=38). Diagnosis for breast cancer was
histologically confirmed in both the groups of patients and was majorly found to be invasive
ductal carcinoma (IDC). Demographic analysis carried out showed equal distribution of patients
among the two groups of breast cancer patients (Rx- and Rx
+) on the basis of their age,
menopausal status and site of metastasis. Table 16 shows detailed inclusion- exclusion criteria
used for the breast cancer patients.
Due to limited sample size, we did not stratify patients based on ER, PR and Her2
status. The data was analyzed in the two groups of breast cancer patients a) who did not receive
Zoledronate treatment (Rx-), b) who received Zoledronate treatment (Rx
+). In the thesis, patients
who did not receive Zoledronate treatment (Rx-) are referred to as “untreated” breast cancer
patients.
Age distribution of healthy individuals ranged from 23-48 years (38±1, mean+
SEM). In case of untreated breast cancer patients, age distribution ranged from 32-77 years
(45±3), while in case of Zoledronate treated breast cancer patients, it ranged from 28-64 years
(49± 2).
Premenopausal [48%, (10/21)] and postmenopausal [52%, (11/21)] women were
almost equally distributed in Zoledronate treated breast cancer patients (Rx+). Among the

Results-III
201
untreated breast cancer patients (Rx-), 73% (11/15) were premenopausal, whereas 27% (4/15)
were postmenopausal.
All the breast cancer patients on Zoledronate treatment (Rx+) showed bone
metastasis, while patients from untreated group (Rx-) did not show bone metastasis, but 6/15
showed metastasis to liver/ lung/ brain/ lymph nodes.
Table 16: Inclusion- exclusion criteria for breast cancer patients
Table 16: Breast cancer patients were categorized into untreated (Rx-) and Zoledronate treated
(Rx+) groups based on these inclusion exclusion criteria.
Criteria Untreated Group (Rx-) Zoledronate Treated Group (Rx+)
Inclusion
Females
Age >18 years
Patients who have confirmed
diagnosis for invasive breast cancer
Patients with any receptor pattern
(ER, PR, Her2)
Patients who have been planned for
definitive treatment but are treatment
naïve at the time of inclusion
Females
Age >18 years
Patients who have confirmed
diagnosis for invasive breast cancer
Patients who have confirmed
diagnosis for metastasis
Patients who have confirmed
diagnosis for bone metastasis
Patients with bone metastasis who
have received treatment for
Zoledronate injection for at least 3
months
Patients with any receptor pattern
(ER, PR, Her2)
Exclusion
Males
Patients who refused to give consent
Patients who were receiving any
treatment at the time of inclusion
Males
Patients who refused to give consent
Patients who were not receiving
Zoledronate treatment

Results-III
202
6.2) Immune profile of metastatic (Zoledronate treated) and non-metastatic
(untreated) breast cancer patients
Comparative immune profiling of healthy individuals (HI) and breast cancer patients on
Zoledronate treatment (Rx+) or without Zoledronate treatment (Rx
-) was carried out using
multicolor flow cytometry. As shown in Figure 35, percentages of CD3+ T cells, CD4
+ T cells,
CD8+ T cells and B cells (CD19
+) in PBMCs were evaluated in HI, breast cancer patients on
Zoledronate treatment (Rx+) and untreated breast cancer patients (Rx
-). It was observed that,
CD3+ T cells population from Zoledronate treated breast cancer patients (Rx
+) did not differ
from untreated breast cancer patients (Rx-). Total CD3
+ T cell population from peripheral blood
of breast cancer patients (both Rx+ and R
x-) was found to be lower as compared to HI. In case of
CD4+ T cell population, Zoledronate treated (Rx
+) and untreated (Rx
-) breast cancer patients did
not show any differences, though the percentages were significantly lower as compared to HI.
Interestingly, CD8+
T cell population was significantly elevated in Zoledronate treated breast
cancer patients (Rx+) as compared to untreated (Rx
-) breast cancer patients (p=0.03) and HI
(p=<0.0001). Untreated breast cancer patients showed reduced percentages of B cells as
compared to HI (p=0.03). However, a significant increase in percentages of B cells was observed
in Zoledronate treated breast cancer patients as compared to untreated breast cancer patients
(p=0.02).
Amongst the other immune cells, a marked increase was observed in percentages of NK
cells (CD3-CD56
+) in Zoledronate treated breast cancer patients (Rx
+) as compared to HI
(p=0.003). However, a marginal increase in NK cells were observed in Zoledronate treated breast
cancer patients (Rx+) as compared to untreated breast cancer patients (Rx
-), but the increase was
not significant. No significant changes were observed in NK-T cells (CD3+CD56
+) in
Zoledronate treated breast cancer patients (Rx+) as compared to untreated breast cancer patients

Results-III
203
(Rx-) and HI. Interestingly, a sharp decline was observed in γδ T cells in patients who were on
Zoledronate treatment as compared to untreated breast cancer patients (p=0.03) and HI
(p=0.0006). This was surprising, as Zoledronate is known to activate γδ T cells. Further we
analyzed the percentages of regulatory T cells (CD4+CD25
+CD127
-) in HI and breast cancer
patients (Rx- and Rx
+). A significantly increased percentages of regulatory T cells were observed
in untreated breast cancer patients (Rx-) and Zoledronate treated breast cancer patients (Rx
+) as
compared to HI (p=0.003 and p=0.008 respectively). However, Zoledronate treated breast cancer
patients showed a marginal reduction in percentages of regulatory T cells as compared to
untreated breast cancer patients. Median fluorescent intensity (MFI) of FoxP3, a transcription
factor associated with regulatory T cells, showed an increasing trend in expression in untreated
and Zoledronate treated breast cancer patients compared to HI, but the differences were not
statistically significant. Untreated breast cancer patients (Rx-) showed increased percentages of
monocytes (CD14+ cells) as compared to HI (p=0.01). However, Zoledronate treated breast
cancer patients (Rx+) showed a remarkable reduction in percentages of monocytes as compared
to untreated breast cancer patients (p=0.0009) and HI (p=0.0037).

Results-III
204

Results-III
205
Figure 35: Immune profile of breast cancer patients on Zoledronate treatment and
untreated breast cancer patients
PBMCs separated from healthy individuals (HI, n=38), untreated breast cancer (Rx-, n=15) and
Zoledronate treated breast cancer patients (Rx+, n=21) were analyzed for different immune cell
subtypes, which included [A] CD3+, CD4
+, CD8
+, [B] B cells, [C] NK-T cells,[D] NK cells, [E]
γδ T cells monocytes, [F] regulatory T cells and [G] monocytes. Zoledronate treated breast
cancer patients showed increase percentages of CD3+CD8
+, B cells, NK cells, while percentages
of monocytes and γδ T cells were found to be reduced in peripheral blood. Significance is given
by p value as p<0.05(*), p<0.005(**), p<0.0005(***) and p >0.05 (not significant/ns).
6.3) Zoledronate treatment activated both αβ and γδ T cells in breast cancer
patients
Activated T cells are known to exhibit cytotoxic properties [279]. Thus, activation
status of αβ and γδ T cells from HI and breast cancer patients (on Zoledronate treatment and
untreated) was investigated by analyzing expression of early (CD69) and late (CD25 and
CD254/RANKL) activation markers on them using multicolor flow cytometry (Figure 36). CD69
is a human transmembrane C-Type lectin protein which is the earliest inducible glycoprotein
upon lymphocyte activation, while CD25 alpha chain of the IL2 receptor which associates with
beta chain of IL2 receptor creating high affinity receptor for IL2. It was observed that, there were
no changes in αβ+CD69
+ and γδ
+CD69
+T cells among HI, Zoledronate treated and untreated
breast cancer patients. A remarkable increase in percentages of αβ T cells expressing late
activation marker CD25 was observed in Zoledronate treated breast cancer patients as compared
to HI (p=< 0.0001) and untreated breast cancer patients (p=<0.0001) (Figure 36A). Percentages
of γδ T cells expressing CD25 were considerably higher in Zoledronate treated breast cancer
patients (p=< 0.0001) and untreated breast cancer patients (p=< 0.0001) as compared to HI.

Results-III
206
Similarly, expression of another late activation marker, RANKL (CD254), which plays important
role in osteoclastogenesis and immune responses, was also analyzed on αβ and γδ T cells.
Untreated breast cancer patients showed increased percentages of RANKL expressing αβ T cells
as compared to HI (p=0.0004). However, Zoledronate treated breast cancer patients and HI
showed comparable levels of αβ+RANKL
+ T cells, while percentages of αβ
+RANKL
+ T cells
were found reduced in Zoledronate treated breast cancer patient (p=<0.0001). Compared to HI,
percentages of γδ+RANKL
+ T cells were higher in untreated breast cancer patients (p= 0.0001)
and Zoledronate treated breast cancer patients (p= 0.0033). Comparative analysis between αβ
and γδ T cells showed that, percentage of γδ+CD25
+ and γδ
+RANKL
+ T cells were higher in HI
and breast cancer patients (both Zoledronate treated and untreated) compared to αβ T cells
(Figure 36C).
Median fluorescent intensity (MFI) of CD25 and RANKL was analyzed on αβ
and γδ T cells (Figure 36D-E). It was observed that, expression of CD25 on αβ and γδ T cells
was comparable between HI and untreated breast cancer patients but was found remarkably
increased upon Zoledronate treatment (p=0.02). As shown in Figure 36E, expression of RANKL
on αβ T cells was found to be upregulated in untreated breast cancer patients as compared to HI
(p= 0.009). RANKL expression on αβ T cells was found significantly reduced upon Zoledronate
treatment as compared to untreated breast cancer patients (p= 0.007) and was comparable to HI.
In case of γδ T cells, no significant changes were observed in expression of RANKL among HI
and untreated breast cancer patients. Expression of RANKL on γδ T cells was found significantly
reduced in Zoledronate treated breast cancer patients as compared to untreated breast cancer
patients (p=0.02). Details of MFI expressed by αβ and γδ T cells from HI and breast cancer
patients (both Zoledronate treated and untreated) are given in Table 17.

Results-III
207
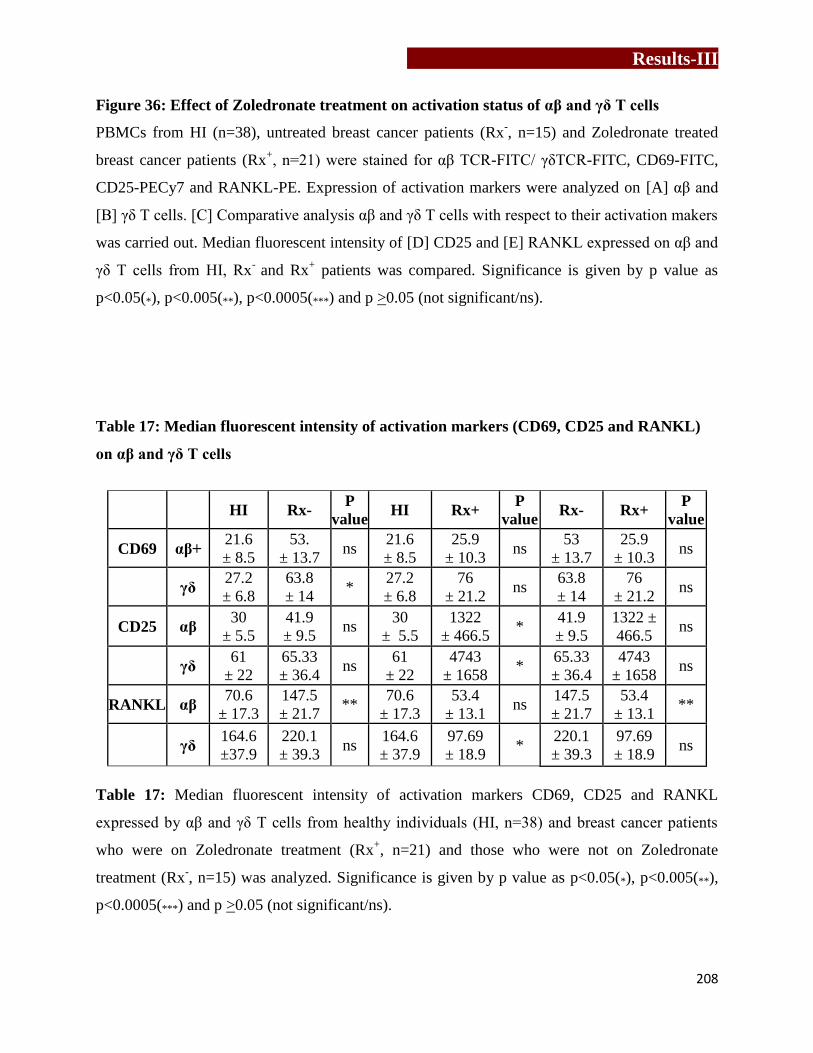
Results-III
208
Figure 36: Effect of Zoledronate treatment on activation status of αβ and γδ T cells
PBMCs from HI (n=38), untreated breast cancer patients (Rx-, n=15) and Zoledronate treated
breast cancer patients (Rx+, n=21) were stained for αβ TCR-FITC/ γδTCR-FITC, CD69-FITC,
CD25-PECy7 and RANKL-PE. Expression of activation markers were analyzed on [A] αβ and
[B] γδ T cells. [C] Comparative analysis αβ and γδ T cells with respect to their activation makers
was carried out. Median fluorescent intensity of [D] CD25 and [E] RANKL expressed on αβ and
γδ T cells from HI, Rx-
and Rx+ patients was compared. Significance is given by p value as
p<0.05(*), p<0.005(**), p<0.0005(***) and p >0.05 (not significant/ns).
Table 17: Median fluorescent intensity of activation markers (CD69, CD25 and RANKL)
on αβ and γδ T cells
HI Rx-
P
value HI Rx+
P
value Rx- Rx+
P
value
CD69 αβ+ 21.6
± 8.5
53.
± 13.7 ns
21.6
± 8.5
25.9
± 10.3 ns
53
± 13.7
25.9
± 10.3 ns
γδ 27.2
± 6.8
63.8
± 14 *
27.2
± 6.8
76
± 21.2 ns
63.8
± 14
76
± 21.2 ns
CD25 αβ 30
± 5.5
41.9
± 9.5 ns
30
± 5.5
1322
± 466.5 *
41.9
± 9.5
1322 ±
466.5 ns
γδ 61
± 22
65.33
± 36.4 ns
61
± 22
4743
± 1658 *
65.33
± 36.4
4743
± 1658 ns
RANKL αβ 70.6
± 17.3
147.5
± 21.7 **
70.6
± 17.3
53.4
± 13.1 ns
147.5
± 21.7
53.4
± 13.1 **
γδ 164.6
±37.9
220.1
± 39.3 ns
164.6
± 37.9
97.69
± 18.9 *
220.1
± 39.3
97.69
± 18.9 ns
Table 17: Median fluorescent intensity of activation markers CD69, CD25 and RANKL
expressed by αβ and γδ T cells from healthy individuals (HI, n=38) and breast cancer patients
who were on Zoledronate treatment (Rx+, n=21) and those who were not on Zoledronate
treatment (Rx-, n=15) was analyzed. Significance is given by p value as p<0.05(*), p<0.005(**),
p<0.0005(***) and p >0.05 (not significant/ns).
Results-III
209
6.4) Zoledronate treatment activated central memory γδ T cells
We further analyzed the memory status of γδ T cells in breast cancer patients and HI by staining
them for CD45RA and CD27. CD45RA is a protein tyrosine phosphatase, receptor type C
enzyme and is located on naive T cells while memory T cells express different isoform
(CD45RO). CD27 is a tumor necrosis factor receptor family member, acts as a co-stimulatory
molecule and is required for generation and long term maintenance of T cells [280]. Naïve or
unprimed cells (CD45RA+CD27
+) are less cytotoxic, need stronger signals for proliferation but
have migratory capacity to lymph nodes and other secondary lymphoid organs, while central
memory cells (CD45RA-CD27
+, CM) are more sensitive to antigenic stimuli, but are less
proliferative. On the other hand, effector memory cells (CD45RA-CD27
-, EM) are rapidly
proliferating cells with rapid effector functions and secrete higher amounts of cytokine such as
IFNγ, IL4, perforin and granzyme. CD45RA expressing effector memory cells (CD45RA+CD27,
TEMRA) are terminally differentiated cells with low proliferative capacity but highest cytotoxic
activity by exerted secretion of cytolytic granules and IFNγ [281,282,283,284,285,286]. As
shown in Figure 37, Zoledronate treated breast cancer patients showed a significant increase in
effector memory RA+ subtype of γδ T cells as compared to untreated breast cancer patients
(p=0.0009) and HI (p=<0.0001). A significant reduction in percentages of central memory cells
was observed in Zoledronate treated breast cancer patients as compared to untreated breast
cancer patients (p= 0.0014) and HI (p= 0.0002). Zoledronate treated breast cancer patients also
showed reduced percentages of naive γδ T cells as compared to HI (p= 0.04). The data clearly
showed conversion of central memory cells to effector memory cells after Zoledronate treatment.
No significant changes in other subcellular populations of γδ T cells were observed. .

Results-III
210
Figure 37: Effect of Zoledronate treatment on memory status of γδ T cells
Memory status of γδ T cells was analyzed by staining the PBMCs from HI (n=38), untreated
breast cancer patients (Rx-, n=15) and Zoledronate treated breast cancer patients (Rx
+, n=21) for
γδTCR-FITC, CD45RA-PECy5 and CD27APC. γδ T cells were gated and memory subsets were
analyzed as central memory (CM, CD45RA-CD27
+), naive (CD45RA
+CD27
+), terminally
differentiated effector memory (TEMRA, CD45RA+CD27
-) and effector memory (EM,
CD45RA-CD27
-) in gated population. Significance is given by p value as p<0.05(*), p<0.005(**),
p<0.0005(***) and p >0.05 (not significant/ns).

Results-III
211
6.5) Effect of Zoledronate treatment on intracellular cytokine profile of γδ T
cells
To understand the effect of Zoledronate on effector function of γδ T cells,
expression of intracellular cytokines IFNγ and IL17 were measured in γδ T cells at baseline and
after in vitro stimulation with phorbol myristate acetate (PMA) and ionomycin using multicolor
flow cytometry. PBMCs from HI (n= 38) and breast cancer patients who were on Zoledronate
treatment (n= 21) and those who were not on Zoledronate treatment (n= 15) were stimulated with
PMA+ Ionomycin or left untreated (in medium alone) for 6 hrs in the presence of Golgi-stop
brefeldin-A. The PBMCs were further were stained for γδTCR-FITC, IL17-PE and IFNγ-PECy7.
Ca2+
ionophores induce increase in Ca2+
in treated cells by virtue of their ability to transport Ca2+
across biologic membranes. Calcium ionophores are mitogenic for PBMC and when synergize
with direct PKC activators, such as phorbol esters activate in inducing T and B cell activation
and proliferation [287,288]. As shown in Figure 38, it was observed that Zoledronate treated
breast cancer patients showed notably increased percentages of γδ+IFNγ
+ T cells at baseline level
as compared to Zoledronate untreated breast cancer patients (p=< 0.0001) or HI (p=< 0.0001).
The percentages of γδ+IL17
+ cells were not significantly different in the three groups i.e. HI,
untreated and Zoledronate treated breast cancer patients when measured at baseline.
Upon stimulation of PBMCs from HI with PMA+Ionomycin, we found
significant increase in γδ+IFNγ
+ T cells as compared to unstimulated γδ T cells (p=< 0.0001),
however, no significant changes were observed in γδ+IL17
+ cell percentages upon stimulation .
In case of Zoledronate untreated breast cancer patients, upon PMA+Ionomycin stimulation,
percentages of γδ+IL17
+ and γδ
+IFNγ
+ T cells were found increased as compare to unstimulated
γδ T cells (p=0.008 and p=0.005, respectively). It was notable that, though there was increase in
γδ+IFNγ
+ T cells upon antigenic stimulation, γδ T from untreated breast cancer patients gave

Results-III
212
moderate response as compared to HI and Zoledronate breast cancer patients. In case of
Zoledronate treated breast cancer patients, a significant increase in γδ+IFNγ
+ T cells was
observed upon PMA+Ionomycin stimulation (p=0.03). Percentages of γδ+IL17
+ cells were also
found increased upon stimulation with PMA+Ionomycin in Zoledronate treated breast cancer
patients, but the percentage of γδ+IFNγ
+ T cells were remarkably higher (Figure 38). It clearly
indicated that, γδ T cells from Zoledronate treated breast cancer patients were functionally active
and responded well upon receiving antigenic stimuli.

Results-III
213
Figure 38: Intracellular cytokine profiling of Zoledronate treated breast cancer patients
PBMCs from HI (n= 38), untreated breast cancer patients (Rx-, n=15) and Zoledronate treated
breast cancer patients (Rx+, n=21) were stimulated with PMA+Ionomycin for 6 hrs (STIM) or
left in medium alone/control (CNTR) for 6 hrs in the presence of Golgistop brefeldin-A
(5µg/ml). Percentages of γδ T cells showing expression of intracellular cytokines IFNγ and IL17
were analyzed by staining PBMCs for γδTCR-FITC, IL17-PE and IFNγ-PECy7. [A] Percentages
of γδ T cells expressing intracellular cytokines IFNγ and IL17 were measured in control (CNTR)
group. [B] Comparative analysis of experimental group medium alone (CNTR) and PMA+
Ionomycin (STIM) showing percentages of γδ T cells producing IFNγ and IL17. Significance is
given by p value as p<0.05(*), p<0.005(**), p<0.0005(***) and p >0.05 (not significant/ns).
Results-III
214
6.6) Cytokine profiling of cell free supernatants of γδ T cells isolated from HI
and breast cancer patients (Rx- and Rx
+)
Besides measuring intracellular cytokines in γδ T cells, we also analyzed cytokines in the cell
free supernatants of purified γδ T cells isolated from HI (n=5) and breast cancer patients who
were on Zoledronate treatment (Rx+, n=5) or without Zoledronate treatment (Rx
-, n=5). PBMCs
from HI, untreated breast cancer patients (RX-) and Zoledronate treated breast cancer patients
(RX+) were expanded using αCD3/CD28+rhIL2 for 12 days and γδ T cells were
immunomagnetically separated (materials and methods section 3.6.2). Purified γδ T cells were
rested overnight and then cultured in medium alone for 24 hrs and cell free supernatants were
collected. These cell free supernatants were analyzed for Th1/Th2/Th17 cytokines (IL2, IL4,
IL6, IL10, TNFα, IFNγ and IL17) by cytometric bread array. As shown in Figure 39, cell free
supernatants of γδ T cells from untreated breast cancer patients (Rx-) showed significantly higher
levels of IL6 (pro-tumorigenic and pro-osteoclastogenic) as compared to HI. However a
remarkable reduction in IL6 levels (p=0.0002) was noted in cell free supernatants of γδ T cells
from Zoledronate treated breast cancer patients (Rx+) as compared untreated breast cancer
patients and HI. Cell free supernatants of γδ T cells from HI and untreated breast cancer patients
did not show any significant differences in the levels of IFNγ. However, levels of IFNγ were
found significantly reduced in Zoledronate treated breast cancer patients compared to
Zoledronate untreated breast cancer patients (p=0.009). We also found significant reduction in
levels of IL10 (immunosuppressive anti-inflammatory cytokine) in cell free supernatants of
Zoledronate treated breast cancer patients as compared to untreated breast cancer patients
(p=<0.0001). Concentrations of other cytokines detected in cell free supernatants of γδ T cells
isolated from HI, Rx- and Rx
+ are provided in Table 18.
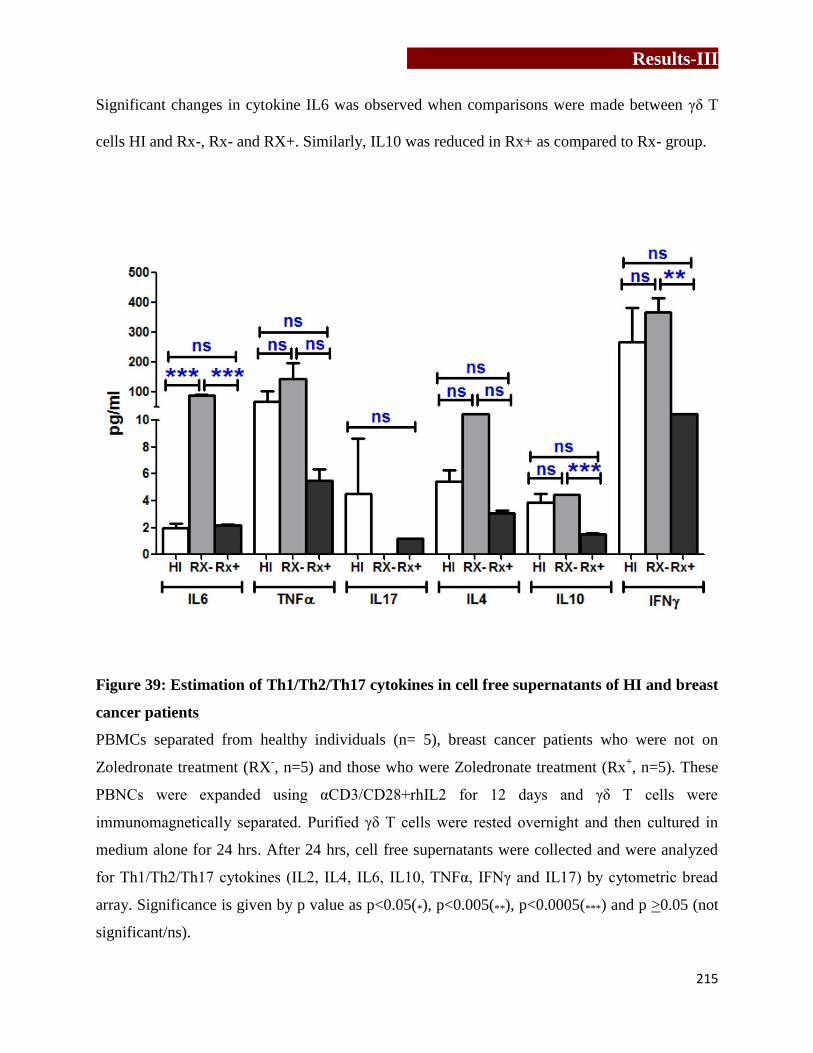
Results-III
215
Significant changes in cytokine IL6 was observed when comparisons were made between γδ T
cells HI and Rx-, Rx- and RX+. Similarly, IL10 was reduced in Rx+ as compared to Rx- group.
Figure 39: Estimation of Th1/Th2/Th17 cytokines in cell free supernatants of HI and breast
cancer patients
PBMCs separated from healthy individuals (n= 5), breast cancer patients who were not on
Zoledronate treatment (RX-, n=5) and those who were Zoledronate treatment (Rx
+, n=5). These
PBNCs were expanded using αCD3/CD28+rhIL2 for 12 days and γδ T cells were
immunomagnetically separated. Purified γδ T cells were rested overnight and then cultured in
medium alone for 24 hrs. After 24 hrs, cell free supernatants were collected and were analyzed
for Th1/Th2/Th17 cytokines (IL2, IL4, IL6, IL10, TNFα, IFNγ and IL17) by cytometric bread
array. Significance is given by p value as p<0.05(*), p<0.005(**), p<0.0005(***) and p >0.05 (not
significant/ns).

Results-III
216
Table 18: Cytokine profiling of cell free supernatants of antigen activated γδ T cells
HI
(n=5)
Rx-
(n=5)
P
value
HI
(n=5)
Rx+
(n=5)
P
value
Rx-
(n=5)
Rx+
(n=5)
P
value
IL2 2.7 ± 0.9 3.7 ± 1.3 ns 2.7 ± 0.9 3.1 ± 0.1 ns 3.7 ± 1.3 3.1 ± 0.1 ns
IL4 5.4 ± 0.8 11.2 ± 9.0 ns 5.4 ± 0.8 3.1 ± 0.2 ns 11.2 ± 9.0 3.1 ± 0.2 ns
IL6 1.9 ± 0.3 89.6 ±3.2 *** 1.9 ± 0.3 2.2 ± 0.06 ns 89.6 ±3.2 2.2 ± 0.1 ***
IL10 3.8 ± 0.6 4.4 ± 0.04 ns 3.8 ± 0.6 1.5 ± 0.03 ns 4.4 ± 0.04 1.5 ± 0.03 ***
TNFα 67.5 ±37.04 143.9 ± 55.5 ns 67.5 ± 37.04 5.5 ± 0.9 ns 143.9 ± 55.5 5.5 ± 0.9 ns
IFNγ 274.1 ±111.2 369.0 ± 45.4 ns 274.1 ± 111.2 20.1 ± 6.5 ns 369.0 ± 45.4 20.1 ± 6.5 **
IL17 4.5± 4.1 0 - 4.5 ± 4.1 1.2 ± 0.03 ns 0 1.2 ± 0.03 -
Table 18: PBMCs separated from healthy individuals (HI, n=5) and breast cancer patients who
were on Zoledronate treatment (Rx+, n=5) and those who were not on Zoledronate treatment
(Rx-, n=5) were expanded for 12 days using αCD3/CD28+rhIL2. Further, γδ T cells were
immunomagnetically purified, rested overnight and cultured in medium alone for 24 hrs. Cell
free supernatants were collected and TH1/Th2/Th17 cytokines were analysed using cytometric
bead array. Significance is given by p value as p<0.05(*), p<0.005(**), p<0.0005(***) and p >0.05
(not significant/ns).
In conclusion, it was observed that, Zoledronate improves antitumor immune responses by
increasing the pool of CD8+ T cells and effector memory γδ T cells. Activated γδ T cells
(CD25+) showed a marked increase in the intracellular levels of IFNγ which explains their ability
to mediate antitumor responses. Interestingly, Zoledronate treatment was also found to reduce
IL6 secretion by γδ T cells, a potent pro-osteoclastogenic cytokine (chapter 4). The study
highlights a new role of Zoledronate in breast cancer patients that can be explored further.
Cytokine levels secreted by αCD3/CD28+rhIL2 expanded γδ T cells

Discussion
217
Chapter 7
Discussion

Discussion
218

Discussion
219
Bone is the preferential site of metastasis in breast cancer, prostate cancer and
multiple myeloma [38,289]. Metastasized tumor release factors which induce differentiation and
activation of osteoclasts [43]. Cytokines secreted by lymphocytes present in the bone
microenvironment affect bone and disturbs the normal bone metabolism, which is otherwise a
very ordinate process [253,290]. The process of bone remodeling is majorly influenced by
soluble factors (cytokine, chemokines and soluble proteins) secreted by osteoblasts, stromal
cells, tumor cells and immune cells present in bone microenvironment [44].
Aminobisphosphonates are used for the treatment skeletal related events associated with bone
metastasis such as breast cancer [52]. Effect of these aminobisphosphonates on tumor cells and
immune cells is not well understood. Activated CD4+ T cells are known to play pro-
osteoclastogenic role through expression of RANKL and cytokines such as IL1β, IL6, IL17,
TNFα and RANKL [29,30,45,47]. Interestingly, it has also been reported that activated T
lymphocytes secrete cytokines such as IFNγ, IL4, IL10 and GMCSF that inhibit
osteoclastogenesis [31,32]. It is still not understood what dictates the pro and anti-
osteoclastogenic behavior of the lymphocytes. Although the role of CD4+ αβ T cells in
osteoclastogenesis has been investigated, the role of γδ T cells is not well understood. The
objective of the present thesis is to investigate how γδ T cells interact with osteoclasts and
influence their function and further investigate how aminobisphosphonate influence γδ T cells
and cytokine dynamics in breast cancer patients.
γδ T cells are a unique subset of T cells, which harbor properties of both innate
and adaptive immune cells [233]. They represent <10% of the total T cell population, where
>90% population resides in peripheral blood and expresses Vγ9Vδ2 TCR. γδ T cells possess
unique properties with respect to antigen recognition, tissue tropism, MHC-independent antigen

Discussion
220
recognition and antitumor response [74]. γδ T cells recognizes unique antigens, different from
conventional αβ T cells, which include small phosphoantigens such as isopentenyl
pyrophosphate (IPP) and (E)-4-Hydroxy-3-methyl-but-2-enyl pyrophosphate (HMBPP),
phospholipids, heat shock proteins, alkylamines and aminobisphosphonates [72]. IPP is an
intermediate molecule in eukaryotic mevalonate/ cholesterol pathway, while HMBPP is an
intermediate molecule in bacterial non-mevalonate/ rohmer pathway. Aminobisphosphonate
(Zoledronate), a class of potent antiresorptive drug, is used as a standard treatment modality to
treat postmenopausal osteoporosis and cancer patients with bone metastasis. γδ T cells are Th1
type cells but are extensively plastic and differentiate into different subsets like Th2, Th17, T-
follicular helper and T-regulatory cells under different pathological conditions, producing
different sets of cytokines [13]. γδ T cells have been appreciated for their role in antitumor
cytotoxicity [15,16], wound healing and tissue repair [17,18,19] and thus have generated much
interest in recent years. These cells produce several cytokines like IL17, IL6, IL10, TNFα, IFNγ
and RANKL depending on their activation status. Many of these factors are known to influence
bone metabolism. Most of the γδ T cell based studies, in context of osteoimmunology, have been
done in patients of rheumatoid arthritis (RA) and multiple myeloma [28,291]. Their presence has
been demonstrated in bone microenvironment, in synovial fluids of rheumatoid arthritis patients
and at bone fracture sites [28,292]. Various groups have also shown presence of chemokine
receptors like CCL5 and CCR1 on γδ T cells, which indicate their propensity to migrate to bone.
It has been reported that, Th17+ cells, and not IL17
+ γδ T cells drive arthritic bone destruction in
RA patients [28]. In contrast, another report shows that, IL17+ producing γδ T cells are increased
in synovial fluids and peripheral blood of RA patients [292]. Also, RA patients have shown
changes in γδ T cell subpopulations and their phenotypes [293,294]. Recently, IL17 producing γδ

Discussion
221
T cells were shown to promote bone formation and facilitate bone fracture healing [295].
However, role of γδ T cells in fracture healing has remained controversial as γδ T cell deficient
mice had shown stable fracture repair and better biochemical strength of bone [296]. Therefore,
the role of γδ T cells is not well understood in bone metabolism. The present study was therefore
an attempt to analyze the effect of “activated” and “freshly isolated” γδ T cells on osteoclast
generation and function.
We used γδ T cells from two sources; those that were isolated directly from
PBMCs (“freshly isolated” γδ T cells) and those that were isolated from PBMCs stimulated with
αCD3/CD28+rhIL2 (“activated” γδ T cells). Coculture of “freshly isolated” γδ T cells with
CD14+ cells enhanced the generation of osteoclasts and stimulated their resorptive ability. On the
contrary, “activated” γδ T cells showed inhibitory effect on generation and function of
osteoclasts. The process of osteoclastogenesis is majorly influenced by cytokine milieu in the
microenvironment, where IL6, IL17, TNFα, TGFβ, IFNγ and RANKL play indispensable role.
Analysis of cell free supernatants of “freshly isolated” γδ T cells at baseline levels (unstimulated)
showed marked difference in their IL6 and IFNγ levels. In an unstimulated state, “freshly
isolated” γδ T cells were major producers of IL6, with negligible levels of IFNγ. IL6 is a potent
pro-osteoclastogenic cytokine, with the capacity to induce osteoclastogenesis in RANKL
independent manner [176] and it also acts in synergistic manner with TNFα to induce
osteoclastogenesis [297]. IL6 has been reported to stimulate formation of osteoclast like
multinucleated cells in long term cultures of human bone marrow through induction of IL1β
[48]. T lymphocytes from IL6-/- mice have shown lesser production of IL17 (pro-
osteoclastogenic) and also affected RANKL/OPG production by T lymphocytes [298]. Cultures
of osteoclasts from bone marrow cells of IL6-/- mice in the presence of MCSF and RANKL
Discussion
222
produced ~50% lesser osteoclasts as compared to wild type mice [298]. On the contrary, IFNγ
has been appreciated for its protective role in osteoclastogenesis by inhibiting osteoclast
formation and bone resorption in vitro [51,299]. Mice lacking one of the components of IFNγ
receptor (IFNγR1) showed enhanced osteoclastogenesis from bone marrow derived
monocyte/macrophage precursor cells (BMMs) and bone loss[51]. Also, IFNγ producing
activated T cells showed osteoclast generation from BMMs in the absence of RANKL in
IFNγR-/-
mice[51]. IFNγ either downregulates TRAF6 (TNF receptor associated factor 6)
expression or activates/ enhances ubiquitin dependent proteosomal systems whose direct target is
TRAF6 [51,300], which results in disruption of RANK-RANKL signaling. We observed that
“activated” γδ T cells secreted significantly higher levels of IFNγ and negligible levels of IL6. In
order to confirm that IL6 and IFNγ are the key cytokines involved in the pro and anti-
osteoclastogenic effects mediated by “freshly isolated” and “activated” γδ T cells respectively,
neutralization experiment was carried out using αIL6 and αIFNγ antibodies. Addition of αIL6
antibody to the supernatants of “freshly isolated” γδ T cells showed a marked reduction in the
resorption area. However, the resorption area remained marginally above that was observed with
positive control (rhMCSF+rhRANKL). The data indicates that other cytokines like TNFα and
IL17 may also contribute to the pro-osteoclastogenic effect, which may be present in the
supernatants after blocking IL6. Similarly blocking of IFNγ significantly reversed (90%) the
anti-osteoclastogenic effect, indicating that IFNγ is the dominant cytokine inhibiting
osteoclastogenesis.
Human γδ T cells are Th1 type cells which produce copious amounts of IFNγ
upon stimulation [301,302,303]. BrHPP (analog of IPP) and Zoledronate
(aminobisphosphonate), potent antigen of γδ T cells, were used to stimulate “freshly isolated” γδ

Discussion
223
T cells in the presence of rhIL2. Upon stimulation with BrHPP+rhIL2 and Zoledronate +rhIL2
the activation markers (CD69, CD25 and RANKL) on these cells were found to be increased
compared to unstimulated γδ T cells. CD69, an early activation marker, is expressed on T cells
upon triggering through TCR complex [304]. T cell activation through CD69 results in
upregulation of CD25 and induction of Th1 cytokine (IL2 and IFNγ), ultimately triggering
proliferation of the lymphocytes [305]. As expected, higher levels of IFNγ along with increased
expression of activation markers (CD25 and RANKL) were observed on “activated” γδ T cells
(which were expanded using αCD3/CD28+rhIL2 or Zoledronate+rhIL2), while no significant
change was observed in early activation marker CD69. “Freshly isolated” γδ T cells upon
stimulation with BrHPP+rhIL2 showed increase in IFNγ production, along with significant
increase in early activation markers like CD69 and RANKL. Zoledronate treated “freshly
isolated” γδ T cells” showed remarkable higher levels of CD69 expression along with increased
IFNγ secretion. As Zoledronate induces apoptosis in osteoclasts [10], activation of γδ T cells in
coculture assays was carried out by addition of BrHPP. “Freshly isolated” γδ T cells stimulated
with BrHPP+rhIL2, irrespective of short or long term activation, showed inhibitory effect on
generation (vitronectin receptor expression) and resorptive ability (resorption area on OAAS
plates) of osteoclasts. Thus, “freshly isolated” γδ T cells stimulated with phosphoantigen
(BrHPP+rhIL2) exhibited the characteristics of “activated” γδ T cells to suppress osteoclast
generation and function.
Our study has shown that activation status and the cytokines released by γδ T
cells dictates their effect on osteoclastogenesis. Zoledronate activate γδ T cells which function as
anti-osteoclastogenic cells. Thus apart from exhibiting anti-osteoclastogenic activity [52],
Zoledronate also prevents osteoclastogenesis through activated γδ T cells. This data adds a new
Discussion
224
dimension towards understanding the crosstalk of γδ T cells and osteoclasts mediated by
Zoledronate.
Besides its anti-resorptive ability, Zoledronate also has antitumor activity. It is
well reported that, Zoledronate induces apoptosis in breast tumor cells [10,59,60,78,214,306].
Studies from our laboratory have shown that breast tumor cells treated with Zoledronate in vitro
are aggressively lysed by γδ T cells [26] compared to untreated cells. These results prompted us
to look at the changes in protein profiles of breast tumor cells after Zoledronate treatment. We
therefore used two proteomic approaches- MALDI/TOF-TOF and LC-MS, to compare the
protein profiles of MCF7 breast cancer cells before and after treatment with Zoledronate.
A normal cell metabolism involves nonspontaneous, energy-consuming processes
such as generation of concentration gradients, cytoskeletal dynamics, DNA repair, basal
transcription and translation, protein turnover and vesicle trafficking [307]. These cellular
requirements are fulfilled through multiple pathways. In the present study we observed that,
Zoledronate treated MCF7 cells showed changes in expression of proteins associated with crucial
metabolic pathways including glucose and fatty acid metabolism, cytoskeletal reorganization,
cell cycle progression, protein synthesis, trafficking and degradation, copper homeostasis,
apoptosis induction, epidermal growth factor receptor (EGFR) trafficking. We observed a
significant increase in 6-phosphofructokinase (PFK) and α-enolase (enzymes involved in
glycolytic pathway) in Zoledronate treated MCF7 cells. PFK catalyzes the first committing step
of glycolysis (phosphorylation of D-fructose 6-phosphate to fructose 1,6-bisphosphate by ATP),
while α-enolase catalyses the penultimate step of glycolysis (conversion of 2-
phosphoglycerate to phosphoenolpyruvate). Interestingly, we also found increase in expression
of cytochrome c oxidase assembly factor 3 and 4, with significant decrease in expression of

Discussion
225
NADH dehydrogenase 1 beta subunit complex. NADH: ubiquinone reductase is the first enzyme
of the mitochondrial electron transport chain. It is located in inner mitochondrial membrane and
also known to largest of five complexes. Downregulation of protein or mutation in NADH
dehydrogenase 1gene leads to mitochondrial dysfunction [308]. While expression of assembly
subunits of cytochrome c oxidase (COX) enzyme, involved in mitochondrial phosphorylation,
were found to be upregulated. Eukaryotic COX is a multimeric enzyme of dual genetic origin (13
subunits, 3 coded by mitochondrial genes and 10 by nuclear genes), whose assembly is a
complicated and highly regulated process. More than 20 assembly proteins are required for the
assembly of this protein. It is the last enzyme in mitochondrial respiratory chain [309].
Cytochrome c oxidase shuttles electrons from cytochrome c to molecular oxygen to capture
energy in the membrane potential by asymmetric proton uptake and proton pumping [310].
Cytochrome c oxidase assembly factor 3 and 4 plays a critical role in the biogenesis and activity
of cytochrome c oxidase. Overall it indicated that, Zoledronate treated tumor cells showed
increase in glycolytic enzymes and reduced the key enzyme in mitochondrial phosphorylation
chain. To the best of our knowledge, this is the first study showing the differentially expressed
proteins in MCF7 cells after Zoledronate treatment that regulate key pathways related to
glycolysis and mitochondrial phosphorylation.
Zoledronate treatment significantly downregulated expression of two crucial
proteins involved in lipid metabolism. Zoledronate treated MCF7 cells showed a significant
downregulation of fatty acid desaturase 2 enzyme, which catalyses first and rate limiting step in
biosynthesis of polyunsaturated fatty acid from its precursors. These highly unsaturated fatty
acids play pivotal roles in many biological functions. Expression of GM2 activator protein
(GM2AP) and PEX19 was found downregulated in Zoledronate treated MCF7 cells. For cellular
Discussion
226
membrane homeostasis, lysosomal digestion of membranes is essential. Glycosphingolipids are
present in cell membrane and functions as antigens, mediators of cell adhesion, and modulators
of signal transduction [311]. Breakdown-products of glycosphingolipids are continuously
recycled and re-utilized in salvage processes [312]. After endocytosis, glycosphingolipids are
degraded on the surface of intralysosomal membranes in a sequential pathway in a stepwise
manner, with the assistance of small glycoprotein cofactors like GM2A protein [313]. GM2A is a
small glycolipid transport protein which acts as a substrate specific co-factor for β-
hexosaminidase A enzyme present in the lysosome. GM2 ganglioside activator and β-
hexosaminidase A enzyme together catalyzes degradation of ganglioside GM2, and other
terminal N-acetyl hexosamines containing molecules. It binds to ganglioside GM2, extracts them
from membranes and presents them to β-hexosaminidase A for cleavage. It is proposed that,
GM2-activator contains a hydrophobic cavity for binding of the ceramide portion of GM2 or
other lipids. In an open conformation, the empty activator binds to the membrane with the aid of
hydrophobic loops and penetrates into the hydrophobic region of the bilayer. The lipid
recognition site of the activator can interact with the substrate, and its ceramide moiety moves
inside the hydrophobic cavity. The lipid loaded activator can change to the closed conformation,
becomes more water soluble and might leave the membrane. In solution or at the membrane
surface, it present gangliosides GM2 or GM1 to water-soluble hydrolases such as β-
hexosaminidase A [313]. Apart from ganglioside GM2, GM2AP can also extract other lipids, in
a pH-dependent fashion from membranes. GM2-activator acts as a lipid transfer protein that can
carry lipids from donor to acceptor liposomes in vitro [314]. The enzymatic, lysosomal
degradation of the ganglioside GM2 is catalyzed by β-hexosaminidase A (HexA) and requires
the GM2A protein as cofactor [313,315]. Defects or mutations in the genes of the subunits α and

Discussion
227
β or the gene encoding the GM2AP lead to the various forms of GM2 gangliosidosis [316].
GM2A protein can also activate T cells through lipid presentation.
Expression of Pex19 protein, which plays indispensible role in peroxisome
biogenesis, was found significantly reduced in Zoledronate treated MCF7 cells. Pex19 acts as
chaperone keeping newly synthesized membrane proteins in import-competent conformations
and is required for the import and/or membrane assembly of numerous peroxisomal membrane
proteins. Pex19 are required for proper localization and stability of peroxisomal membrane
proteins Peroxisomes function as sites for biosynthesis of ether phospholipids (plasmalogens),
cholesterol and bile acids, polyunsaturated fatty acids and degradation of amino acids, purines,
α-oxidation of fatty acids, β-oxidation of fatty acids, decomposition of hydrogen peroxide. Pex19
is farnesylated form and is found predominantly in the cytosol but also on peroxisomal
membranes [317,318,319]. Pex19 interacts with many integral membrane proteins and also with
some peripheral membrane proteins [317,319,320,321]. Farnesylation of Pex19 protein is
necessary for its structural integrity and to recognize membrane proteins during peroxisome
biogenesis [322]. Cells lacking Pex19 are either rapidly degraded in the cytosol or mislocalized
to mitochondria [317,319,320]. Thus in the absence of Pex19, cells lack functional peroxisomes
[317,318,323].
Zoledronate inhibits farnesyl pyrophosphate synthase enzyme in mevalonate
pathway, an exclusive route of isoprenoid production in eukaryotes, involved in cholesterol
biosynthesis and synthesis of intermediates important for intracellular signaling and growth
control [324]. Inhibition of FPPS enzyme causes a reduction in farnesyl pyrophosphate (FPP)
and geranylgeranylpyrophosphate (GGPP), which leads to impaired prenylation and defective
intracellular localization of GTPase signaling proteins such as Ras, Rho and Rac [325]. We

Discussion
228
observed a significant upregulation in expression of RhoB in Zoledronate treated MCF7 cells.
RhoB is small GDP/GTP binding GTPase, which belongs to Rho family and shares 86%
sequence similarity with RhoA, but their functions are completely different. Other GTPases
(RhoA, Ras, Rac1 and cdc42) promotes oncogenesis, invasion and metastasis
[326,327,328,329,330,331,332,333]. RhoB have tumor suppressive role and has been reported to
inhibit cell proliferation, induce apoptosis and inhibit tumor growth in a nude mouse xenograft
model [334,335,336, 337]. Farnesyltransferase inhibitors (FTIs) like aminobisphosphonates and
geranylgeranyltransferase I inhibitors (GGTIs) have been shown to upregulate RhoB protein
expression by increasing transcription of RhoB through increase in histone deacetylase 1
(HDAC1) dissociation, histone acetyltransferase (HAT) association and histone acetylation of
the RhoB promoter in number of human cancer cells (breast, pancreatic, lung, colon, bladder and
brain cancers) [338]. Treatment of cells with FTIs reduces farnesylated form of RhoB, with
concomitant increase in geranylgeranylated form (RhoB-GG), which is associated with loss of
growth-promoting activity [335]. Geranylgeranylated form of RhoB supports the FTI associated
inhibition of cell growth by inducing phenotypic reversion, cell growth inhibition, and activation
of the cell cycle kinase inhibitor p21WAF1 [335,336]. In tumors, expression of RhoB was found
to be reduced with increase in aggressiveness of the tumors [339,340,341]. RhoB has been noted
to be an essential factor for the apoptotic response of neoplastic cells to DNA damage [334].
RhoB has been shown to block ability of Ras/PI3K/Akt pathway to activate NFκB inhibit [342].
These pathways are involved in uncontrolled proliferation and tumor survival. Oncogenes
EGFR, ErbB2 and Ras oncogenes suppress RhoB expression through PI3K/Akt pathway which
leads to malignant transformation [342,343].
Discussion
229
Our interactome analysis using STRING software showed some proteins
associated with EFGR trafficking. EGFR is a transmembrane tyrosine kinase receptor and
functions in proliferation, survival and migration of both normal and cancerous cells [344].
EGFR ligands (EGF, transforming growth factor-α (TGFA), heparin-binding EGF-like growth
factor, amphiregulin, betacellulin, epiregulin and epigen) binding to the inactive monomeric
EGFR leads to homodimerisation or heterodimerisation (with any of the other ErbB family
members like ERBB2/Her2, ERBB3/ Her3, and ERBB4/ Her4) [345]. EGFR and HER2 is the
most common heterodimers, while HER2:3 plus neuregulin is the most potent combination
[344]. Binding of ligand to EGFR triggers internalization and subsequent degradation of ligand-
EGFR complex, desensitizing the cells from mitotic signals. Ligand binding causes recruitment
of active ligand-receptor complexes to clathrin coated vesicles/pits (CCPs) and dynamins carries
out vesicle fission from the plasma membrane [346]. These CCPs further gets fused to early
endosomes. From there, free EGFR is either recycled back to cell surface or ligand bound EGFR
gets sorted into internal vesicles of multivescicular bodies (MVBs) [347]. Early endosomes
mature into late endosomes, where EGF-EGFR complexes accumulate in internal vesicles of
MVBs [348], preventing interaction of EGFR with its cytoplasmic targets. Subsequently late
endosomes fuses with pre-existing lysosomes causing lysosomal protease mediated degradation
of ligand-EGFR complexes. EGFR signaling pathway is attenuated by internalization of the
ligand-EGFR complex. Internalization is not necessarily an attenuation process itself [349], but
EGFR needs to be degraded. An impaired or ineffective EGFR degradation pathway plays a
major role in increased ErbB-signaling leading to cancer development. In various cancers
dysregulated EGFR pathway has been shown due to constitutive overexpression, overstimulation
or mutational activation of EGFR [350]. EGFR overexpression in breast cancer has been
Discussion
230
reported and anti-EGFR targeted therapies are also used in such cancers [351]. Control of EGFR
signaling is either by neutralizing monoclonal antibodies (cituximab, panitumumab) and small-
molecule tyrosine kinase inhibitors targeted as therapeutic strategy [344]. Potential of EGFR
degradation for therapeutic purpose have been considered as promising approach for treatment of
cancer [352]. We observed that, Zoledronate treatment increased expression of protein involved
in EGFR internalization, endosomal and multivesicular body (MVB) sorting and lysosomal
degradation. Zoledronate treated MCF7 showed upregulated expression of RhoB and SNX1,
whose involvement in degradation is very well reported [271,348,352]. Thus, reduction in EGFR
expression upon Zoledronate treatment in MCF7 cells has unraveled a novel therapeutic target
and added a new dimension to the mechanism of action of Zoledronate.
Zoledronate treatment also affected cell cycle progression in breast tumor cells
(MCF7 and MDAMB231). Cell cycle is vital and tightly controlled event by which cells divides
to produce two daughter cells. It is crucial for the cell to detect and repair genetic damages,
which otherwise may leads to cell death, apoptosis or uncontrolled cell division. DNA repair
processes and cell cycle checkpoints regulate genome stability and cell cycle progression
respectively [353]. Deregulation of the cell cycle components may lead to uncontrolled cells
division and tumor formation [354]. Expression of proteins associated with initiation of DNA
replication, chromatin remodeling and DNA repair were found significantly downregulated upon
Zoledronate treatment in MCF7 cells. Zoledronate treated MCF7 cells showed significant
downregulation in expression of α-centractin, which is involved in G2-M transition of cell cycle.
In the present study we observed that, MCF7 cells upon Zoledronate treatment showed S-phase
arrest, while MDAMB231 largely arrested the G0-G1 phase.

Discussion
231
Cytoskeleton essentially provides a structural framework/scaffold to the cell,
organizes cell cytoplasm and is important for cell movement. Using confocal microscopy and
immunoblotting we demonstrated that, Zoledronate treated MCF7 cells showed thinning of
cytokeratin 8 filaments, while total protein expression (western blotting) remained unaltered.
Expression of tubulin was also found increased upon Zoledronate treatment in MCF7 cells.
Zoledronate preferentially affected actin reorganization compared to other two cytoskeletal
elements. Actin cytoskeleton is an essential in multiple biological functions which include cell
contraction, cell motility, vesicular trafficking, intracellular organization, cytokinesis and
apoptosis [262]. Zoledronate restricted polymerization of actin by increasing level of arpin and
inhibiting expression of proteins involved in actin polymerization process such as ARP3/2,
WASF2 and WASL. WASF2 and WASL are Wiskott-Aldrich syndrome (WAS) family proteins
which associate with a variety of signaling molecules to alter the actin cytoskeleton. WASP
family proteins bind to ARP2/3 proteins and activate them [355]. ARP2/3 protein acts as actin
nucleation core protein and organizes actin filaments into a branching network with filament
ends attached to the sides of other filaments at a fixed angle (70°) [356]. Binding of arpin to
Arp2/3 complex inhibits actin filament nucleation [356]. Role of actin as initiator and mediator
of apoptosis is very well discussed [262,357]. Sudden actin derangement has been shown to
induce cellular apoptosis [262,358,359,360]. Actin disruption also leads to aberrant
mitochondrial morphology and distribution [361,362]. In tumor cell, inhibition of actin
polymerization by cytochalacin D induced the apoptosis by receptor clustering of CD95 (FasL)
with aggregated nonfilamentous actin [357]. Treatment of mammalian cells with actin
polymerization inhibitors induced caspase mediated cytochrome C releases indicating that actin
also regulates mitochondrial membrane permeability [262]. It was reported that actin

Discussion
232
cytoskeleton regulates the subcellular compartmentalization of death effector molecules, while
disruption actin cytoskeleton leads to up-regulation of caspase-3 protease activity and increased
accessibility of active caspase-3 to its substrate, ultimately leading to apoptotic cell death [363].
In an another report, cytoskeleton disruption in the apoptotic cells promoted damage to
mitochondrial membrane and resulted in the enhanced release of cytochrome c necessary for the
activation of caspase-9, which initiates the pro-apoptotic caspase cascade [364]. It was observed
that, Zoledronate also induced expression of other apoptosis inducing proteins, which involved
mainly the cytochrome C oxidase assembly protein subunits, catenin-β, MAPK activating protein
and RhoB.
Essential cellular enzymes require microelements like copper as a cofactor.
Copper is an essential micronutrient and is required for important cellular processes like
mitochondrial respiration, iron metabolism, biosynthesis of neurotransmitter, and free radical
detoxification, indicating its vital function [365]. Cut family proteins (cutA, cutB, cutC, cutD,
cutE, and cutF) are associated with copper homeostasis and involved in uptake, storage, delivery,
and efflux of copper [366]. Zoledronate treated MCF7 cells showed significant upregulation in
expression of CutA protein while expression of CutC protein was found reduced. CutA is a
copper binding protein, while CutC protein plays an important role in the intracellular trafficking
of Cu(I) [366,367,368]. Overexpression of CutA isoforms sensitized HeLa cells to copper-
induced apoptosis [369]. CutC protein is conserved from bacteria to mammals and is expressed
ubiquitously in all the tissues [366]. CutC protein is involved in intracellular trafficking of Cu
(I). Biologically human CutC protein behaves as an enzyme involved in copper homeostasis
using Cu(I) as a cofactor rather than a copper transporter [366]. Knockdown of CutC gene has
been shown to cause copper sensitivity in cells and induced apoptosis [370]. Upregulation of

Discussion
233
copper binding protein CutA and downregulation of copper export protein CutC would create an
imbalance in intracellular copper distribution or metabolism. Excessive copper damages lipids
and proteins [371,372]. Zoledronate induced changes in expression of CutA and CutC protein
would make the cells susceptible to copper-mediated metal stress, eventually causing cells to
undergo apoptosis. Increase in copper inside the cells causes apoptosis in cell due to copper
toxicity [373]. This adds a new aspect to our understanding of the mechanism of action of
Zoledronate not reported earlier.
Apart from these effects, Zoledronate also exposed the breast tumor cells to the
lytic action of γδ T cells and other immune cells. Zoledronate inhibits farnesyl pyrophosphate
synthase enzyme of eukaryotic mevalonate pathway, thus intracellular levels of isopentenyl
pyrophosphate (IPP) increases [374,375]. IPP is a known activator of γδ T cells [75] and also
acts as chemotactic molecule for γδ T cells [256]. Interestingly, Zoledronate treated MCF7 cells
showed significant upregulation (2 fold) of “diphosphomevalonate decarboxylase” enzyme. This
enzyme catalyses the last step of IPP synthesis in mevalonate pathway [(ATP + (R)-5-
diphosphomevalonate = ADP + phosphate + isopentenyl diphosphate + CO2]. Thus apart from
inhibition of FPPS enzyme by Zoledronate, expression of IPP was found to be increased by
upregulation of IPP synthesizing enzyme.
Another protein, S100A8 was also found significantly upregulated (2.6 fold) in
MCF7 cells upon Zoledronate treatment. S100A8 belongs to S100 subfamily of calcium binding
proteins and conduct intracellular and extracellular processes [376,377,378]. Among their many
function, these proteins also acts like cytokines by binding to cell surface receptors like toll like
receptors (TLRs) or receptor for advanced glycation end products (RAGE) of the same cell. γδ T
cells have been shown to express TLRs [379] and are known to mediate antitumor responses by
Discussion
234
activation of TLRs [380]. S100A8 acts as a “danger associated molecular pattern (DAMP)” and
recruits innate immune cells by chemotaxis. Binding of S100A8 to RAGE induces apoptosis and
autophagy [376].
Zoledronate treated breast tumor cells (MCF7) also enhanced expression of heat
shock factor 1 (HSF1), which is transcription factor for HSPs. HSPS are molecular chaperons,
which functions as molecular chaperons which facilitating the folding of unfolded or nascent
polypeptides under stressed conditions [381]. Heat shock proteins (HSPs), play important roles
in antigen presentation and cross-presentation, activation of macrophages and lymphocytes, and
activation and maturation of dendritic cells [261]. Earlier reports from our lab showed that γδ T
cells recognized HSP60/70 expressed on tumor cells (oral and esophageal) and mediate the lysis
of tumor cells through recognition of HSP60/70 [27,71]. Upon validation by flow cytometry,
upregulation in HSP60 expression was observed in MCF7 cells upon Zoledronate treatment,
while HSP70 expression was reduced. HSP60 and HSP70 are also released by the tumor cells
[382,383,384,385] and therefore their expression on tumor cells may vary. α- enolase, apart from
being a glycolytic enzyme also serves as a receptor & activator of plasminogen on cell surface of
cells such as leukocytes and neoplastic cells [386]. Binding of plasminogen to enolase recruits
monocytes [387]. Molecules involved in synapse formation between T cells and target cells
(tumor) like dynamin-1-like protein, CD2-associated protein, transforming protein RhoA,
phocein, SLC9A3R2 protein, clusterins and laminin were found significantly upregulated in
Zoledronate treated MCF7 cells. Expression of NKG2D, perforin and granzyme increases upon
activation of the γδ T cells, through which γδ T cells are known to conduct their cytotoxic
functions [26]. It correlated with the early observation that, γδ T cells get recruited to
Zoledronate treated MCF7 cells, interact with them and kill them. Simultaneously, expression of

Discussion
235
melanoma antigen D2 (MAGE-D2) was also found upregulated in Zoledronate treated MCF7
cells. MAGE-D2 serves as a tumor-associated antigen that elicits immune responses [261]. To
conclude, our proteomics data on Zoledronate treated breast tumor cells have discovered novel
therapeutic targets that can be investigated further.
Further, the in vivo effect of Zoledronate was analyzed by comparing immune
profiles of breast cancer patients on Zoledronate treatment (Rx+) and untreated breast cancer
patients (Rx-) using multicolor flow cytometry. As control, immune profiles of healthy
individuals were analyzed. Peripheral blood samples of breast cancer patients (untreated and
Zoledronate treated) and healthy individuals were analyzed for different adaptive [CD3+, CD4
+ T
cells (T helper cells), CD8+ T cells (cytotoxic T cells),B cells], innate [NK cells, NK-T cells, γδ
T cells] and suppressive [regulatory T cells and monocytes] immune cells subsets. Activation
and memory markers and intracellular cytokines profiles were also analyzed to determine
functional status of the immune cells.
Zoledronate is known to activate γδ T cells [74,75,388]. It was observed that,
Zoledronate treated breast cancer patients showed reduced percentages of γδ T cells in peripheral
blood as compared to Zoledronate untreated breast cancer patients and healthy individuals.
Reduction in percentages of γδ T cells in peripheral blood of Zoledronate treated patients has
also been noted earlier [389]. This could be due to persistent activation of T cells, which induces
apoptosis (known as activation induced cell death/AICD) [390]. Despite the fact that, γδ T cells
from Zoledronate treated breast cancer patients were reduced in number, they were in highly
activated state (increased expression of CD25). Further, memory status of the γδ T cells was
analyzed as, immune cells at different memory status are known to behave differently [281].
TEMRA cells (CD45RA+CD27
-) are poorly proliferating cells, but produce copious amounts of

Discussion
236
IFNγ and mediate antitumor cytotoxicity [391]. We observed that, γδ T cells in Zoledronate
treated breast cancer patients showed increased percentages of terminally differentiated effector
memory γδ T cells (TEMRA, CD45RA+CD27
-), with concomitant reduction in central memory
cells (CD45RA-CD27
+), indicating conversion of central memory cells to effector memory cells,
as reported by others [392]. Zoledronate has been shown to induce immune responses through
increase in effector memory γδ T cells in early and metastatic breast cancer patients [393].
We also found a significant increase in percentages of NK cells in peripheral
blood of Zoledronate treated breast cancer patients. NK cells are known to contribute to innate
immune responses against neoplastic cells because NK cells usually recognize and attack tumor
cells that lack MHC class I molecules [394,395,396]. They are also one of the major producers
of IFNγ. NK cell based therapies are considered as potential therapies against cancer
[395,397,398]. Activated γδ T lymphocytes are also known to costimulate activation of NK cells
[399].
A significant increase in percentages of CD8+ T cells (T cytotoxic) cells was
observed in Zoledronate treated breast cancer patients. Activated γδ T cells behave as antigen
presenting cells [400,401]. Activated γδ T cells take up and crosspresent microbial and tumor
antigens to CD8+ T cells and induce proliferation, target cell killing and cytokine production
responses in antigen-experienced and naïve CD8 T cells [402]. Upon activation, γδ T cells also
activate CD4+ cells [402]. A significant increase in percentages of B cells in peripheral blood
was found unregulated in Zoledronate treated breast cancer patients. B cells represent humoral
arm of the immune system, which get activated when MHC-II bound peptides are presented by
CD4+ cells. Humoral immunity plays a vital role in metastasis-free survival of breast cancer
patients [403].

Discussion
237
We found a significant reduction in percentages of monocytes in Zoledronate
treated breast cancer patients as compared to untreated breast cancer patients and healthy
individuals. It is well reported that Zoledronate induces apoptosis in monocytes [404].
Monocytes are the osteoclast precursor cells and thus reduction in their percentages might reduce
osteoclastogenesis in metastatic breast cancer patients. Regulatory T cells (CD4+CD25
+CD127
-
FoxP3+) are immune suppressor cells and are considered as bad prognostic marker in breast
cancer [405]. In concordance to the earlier reports [406,407,408], we observed a significant
increase in regulatory T cells in untreated breast cancer patients. Zoledronate activated γδ T cells
are have been shown to reduce regulatory T cells in multiple myeloma patients [409]. We found
marginal decrease in percentages of regulatory T cells in Zoledronate treated breast cancer
patients as compared to untreated breast cancer patients.
αβ and γδ T cells from Zoledronate treated breast cancer patients showed
increased percentages of CD25 expressing cells as compared to untreated breast cancer patients
and healthy individuals. High CD25 expressing cells are sensitive to antigenic signals and are
highly active [410]. A transient increase in expression of CD25 correlated with production of
IFN-γ [411]. RANKL is also considered as an activation marker. It is expressed by stromal cells,
osteoblasts and activated T cells and plays indispensable role in osteoclastogenesis and immune
system [412]. Through RANKL signaling, T cells significantly enhances immunity by promoting
the survival and function of DCs, the most potent professional antigen-presenting cells, in the
context of an immune response [31]. Activated CD4 T cells enhance osteoclastogenesis through
increased expression of RANKL and pro-osteoclastogenic cytokines [51,413]. We observed that,
percentages of RANKL+
γδ T cells were higher in breast cancer patients (irrespective of
Zoledronate treatment) as compared to healthy individuals. It is well reported that, activated T

Discussion
238
cells release soluble RANKL [47,414,415]. RANKL MFI on αβ and γδ T cells was found to be
reduced upon Zoledronate treatment, but still remained higher on γδ T cells as compared to αβ T
cells.
Though, stimulation of γδ T cells with phosphoantigens (bromohydrin
pyrophosphate and Zoledronate) increased the expression of RANKL, IFNγ secretion was also
found to be increased. We observed, baseline percentages of IFNγ+γδ T cells to be higher in
Zoledronate treated breast cancer patients as compared to untreated breast cancer patients.
Activated γδ T cells are known to inhibit osteoclast generation and function through secretion of
increased levels of IFNγ [416]. IFNγ inhibits generation (degradation of TRAF6 adaptor protein
in RANKL signaling) and function (downregulated expression of cathepsin-k) of osteoclasts
[299]. Increased RANKL expression on activated γδ T cells assists their interaction with
osteoclasts; while increased IFNγ disrupts RANK-RANKL signaling thus inhibiting osteoclast
survival. IFNγ, which plays critical role in conducting innate and adaptive immunity and has
antiviral, immunoregulatory, and anti-tumor properties [417]. IFNγ is majorly produced by NK
cells, CD8 T cells and γδ T cells and has multiple functions which include activation of
macrophages and NK cells, activating T-helper and T cytotoxic cells by increasing expression of
MHC-I and MHC-II expression on antigen presenting cells, induces production
of IgG2a and IgG3 from activated plasma B cells. IFNγ induces type I immune response and
directly acts on cancer cells [395]. Stimulation of γδ T cells with PMA+ionomycin further
enhanced percentages of IFNγ+ γδ T cells in healthy individuals and breast cancer patients (both
Zoledronate treated and not treated with Zoledronate). Cell free supernatants of Zoledronate
treated breast cancer patients showed reduced levels of IFNγ. This could be due to exhaustion of
the cells because of activation induced cell death [418].

Discussion
239
Interestingly, cell free supernatants of antigen activated γδ T cells from
Zoledronate treated and untreated breast cancer patients showed major differences in their IL6
levels. γδ T cells from breast cancer patients who were on Zoledronate treatment showed reduced
secretion of IL6 as compared to breast cancer patients who were not on Zoledronate treatment.
These results also corroborated with our in vitro data (Results-I), where “activated γδ T cells”
showed reduced IL6 levels as compared to freshly isolated or non-activated γδ T cells”. IL6 is an
inflammatory cytokine with potent pro-osteoclastogenic and pro-tumorigenic activity [48,419].
IL6 has been associated with tumor progression through inhibition of cancer cell apoptosis,
stimulation of angiogenesis, and drug resistance, thus anti-IL6 therapies have been in use for
treatment of cancer [419].
To conclude, the data demonstrated that Zoledronate can activate several
immune cell types in breast cancer patients. A marked increase was observed in the activated
levels of γδ T cells that belong to the effector memory phenotype clearly explaining that besides
the antitumor effect of Zoledronate, the mechanism of action of Zoledronate could also be
mediated through the activation of γδ T cells. The decrease in levels of IL6 and IL10 secreted by
γδ T cells in breast cancer patients treated with Zoledronate, clearly indicates how the action of
pro-osteoclastogenic /immunosuppressive cytokines are reversed.
The present study has contributed towards understanding the crosstalk between
skeletal system, immune system and tumor cells mediated through aminobisphosphonate
Zoledronate. In detail proteomic analysis of Zoledronate treated breast cancer cells has
deciphered the mechanism of action of Zoledronate on tumor cells and has unraveled molecules
that may be viewed as potential therapeutic targets. The lacunae in the field has been the
unavailability of a good metastatic bone tumor model in immunecompetent mice and therefore

Discussion
240
the role of the immune system remains largely unexplored. Additional studies are needed to
further elucidate the key immunosuppressive cell types and identify biomarkers that can predict
responses to therapy in breast/ prostate cancer patients with bone metastasis.

Summary and conclusion
241
Chapter 8
Summary and Conclusion

Summary and conclusion
242

Summary and conclusion
243
Human γδ T cells represent a small population of total T cells (~1-10%), but play
an indispensible role in host defense against exogenous pathogens, immune surveillance of
endogenous pathogens and immune system homeostasis. γδ T cells bridge the gap between
innate and adaptive immunity. Various in vitro and in vivo studies have reported antitumor
activity of γδ T cells against solid tumors and hematologic malignancies. γδ T cells recognize
unique set of antigens, which include small phosphoantigens, heat shock proteins, alkylamines
and aminobisphosphonates. Unlike αβ T cells, γδ T cells do not need antigen processing. They
recognize antigen in MHC unrestricted manner and exert cytotoxic function, which make them
ideal candidates for cancer immunotherapy.
Aminobisphosphonates constitutes an important treatment modality for osteolytic
metastasis, observed in breast cancer patients. Aminobisphosphonates have high affinity for
calcium and thus locate to bone, where they are released by resorbing osteoclasts in bone
microenvironment. Zoledronate, a third generation aminobisphosphonate, is currently approved
for the prevention and treatment of skeletal complications in patients with bone metastases.
Zoledronate inhibits fernesyl pyrophosphate synthase (FPPS), a key enzyme in the mevalonate
pathway of cholesterol metabolism, which induces osteoclast and tumor cell apoptosis. However,
the process of osteoclastogenesis is influenced by number of cytokines released by immune cells
present in the bone microenvironment. Activated CD4+ T cells have been shown to enhance
osteoclast generation and activity through RANKL and pro-osteoclastogenic cytokines like IL17
and IL6. However, the role of γδ T cells in osteoclastogenesis remained unexplored.
Zoledronate inhibits proliferation and growth of breast tumor cells and induce
tumor cell apoptosis, but the mechanistic details have not been investigated. Earlier reports from
our lab have shown that, γδ T cells recognize and kill aminobisphosphate (Pamidronate and
Summary and conclusion
244
Zoledronate) treated tumor cells. Expression of conventional molecules on tumor cells involved
in the conjugate formation (MICA, NKG2D and ICAM1), of tumor cells with immune cells (γδ
T cells), were found unaltered upon Zoledronate treatment. It indicated potential involvement of
other molecules that had not been identified. Zoledronate also acts as an immunomodulator, and
has the ability to activate γδ T cells and induce their expansion. Clinical trials conducted to
investigate the effect Zoledronate in postmenopausal women have yielded controversial results
(AZURE trial and ABCSG-12 trial). Thus, it was necessary to investigate if the therapeutic effect
of Zoledronate is achieved through its ability to activate γδ T cells in breast cancer patients with
bone metastasis.
With this background, the objectives of the thesis were
1. To investigate the effect of T cells on osteoclastogenesis
2. To understand the effect of aminobisphosphonate (Zoledronate) on protein profiles of breast
tumor cells
3. Immune profiling of breast cancer patients on Zoledronate treatment
We investigated the effect γδ T cells on generation and function of osteoclasts.
The findings suggest that γδ T cells behave in both pro or anti-osteoclastogenic manner and it is
the activation status (expression of CD69, CD25 and RANKL) and cytokine dynamics of γδ T
cells, which dictates their pro or anti osteoclastogenic behavior. “Non-activated” γδ T cells
enhanced osteoclastogenesis through IL6 production (a potent stimulator of osteoclast
differentiation and activity). “Non-activated” γδ T cells also secrete higher levels of TNFα, a
proinflammatory cytokine, which may directly and indirectly enhance osteoclast generation and
their resorptive activity. On the contrary, “activated” γδ T cells inhibited osteoclast generation

Summary and conclusion
245
and function through secretion of increased levels of IFNγ. Stimulation of γδ T cells with
phosphoantigens (bromohydrin pyrophosphate and Zoledronate) increased the expression of
RANKL along with increase in IFNγ secretion. Increased RANKL expression on activated γδ T
cells assists their interaction with osteoclasts; while increased IFNγ disrupts RANK-RANKL
signaling, thus inhibiting osteoclast survival. The present study has provided a new insight into
understanding the dual role of γδ T cells on osteoclastogenesis not reported earlier. Fine tuning
the activation status and cytokine dynamics of γδ T cells will help in designing .future
immunotherapeutic modalities for patients with primary breast, prostate cancer and multiple
myeloma with bone metastasis.
In order to investigate the direct action of Zoledronate on tumor cells, we
investigated the in vitro effect of aminobisphosphonate (Zoledronate) on breast tumor cells
(MCF7) using proteomic approach (2D-PAGE/ MALDI-TOF TOF and LC-MS). Protein profiles
of untreated and Zoledronate treated MCF7 cells were compared for differential protein
expression. It was observed that, Zoledronate treatment in MCF7 cells inhibited crucial cellular
pathways, which included fatty acid metabolism, mitochondrial respiration, cytoskeletal
reorganization, cell cycle progression, protein synthesis- trafficking and degradation, copper
homeostasis, while apoptosis induction and epidermal growth factor receptor (EGFR)
degradation was found to be enhanced. Essentially, apart from inhibiting cholesterol synthesis
pathway, Zoledronate also inhibited expression of proteins involved in biosynthesis of
polyunsaturated fatty acid (fatty acid desaturase 2 enzyme) and degradation of
glycosphingolipids (GM2AP), which constitute essential components of cell membrane. A
significant downregulation in expression of proteins essential for peroxisomal biogenesis/
function (Pex19) and mitochondrial function (NADH: ubiquinone reductase enzyme subunit)

Summary and conclusion
246
was found upon Zoledronate treatment in MCF7 cells. A remarkable reduction in actin
nucleation core protein (ARP2/3) was observed, which resulted in actin derangement in
Zoledronate treated MCF7 cells and abrupt actin derangement is known to induce apoptosis in
these cells. Zoledronate treated MCF7 cells also showed thinning of keratin fibers. Expression
of proteins involved in initiation of DNA replication and DNA repair were found reduced upon
Zoledronate treatment. Proteins associated with cell cycle progression showed reduced
expression in Zoledronate treated MCF7 cells, which resulted in S-phase arrest of cell cycle.
Zoledronate treated MCF7 cells showed downregulation in proteins associated with protein
synthesis, trafficking and degradation, which is indispensible for the normal cellular metabolism.
Proteins associated with copper homeostasis (CutA and CutC) were found to be altered upon
Zoledronate treatment, resulting in apoptosis of cells due to copper toxicity. Zoledronate treated
MCF7 cells showed upregulation of proteins (RhoB and sortin nexin 1) involved in lysosomal
degradation of EGFR. EGFR pathway is one of the crucial pathways in cell as it plays important
role in proliferation, survival and migration. Expression of proteins associated with recruitment,
activation of γδ T cells (IPP synthesizing enzyme “diphosphomevalonate decarboxylase”,
S100A8 and HSP60) and proteins involved in immune synapse formation were found
significantly upregulated upon Zoledronate treatment of a MCF7 cells. Thus Zoledronate created
a ‘metabolic crisis’ in the breast tumor cells and made them vulnerable to recognition by
cytotoxic γδ T cells. This is the first study showing in-depth analysis of the effect of Zoledronate
treatment on breast tumor cells. The proteomics data has discovered novel therapeutic targets and
has also highlighted the therapeutic effects of Zoledronate on cancer cells as well as on the
immune system.

Summary and conclusion
247
Further, immune profiling of breast cancer patients was carried out to analyze the
in vivo effect of Zoledronate. Comparative immune profiling of healthy individuals, breast
cancer patients on Zoledronate treatment and those who were not on Zoledronate treatment, was
carried out using multicolor flow cytometry. It was observed that, Zoledronate treated breast
cancer patients showed increased percentages of CD8+ T cells (Cytotoxic T), natural killer cells
(CD3-CD56
+) and B cells (CD19), while percentages of monocytes (CD14
+) and γδ T cells were
found reduced in peripheral blood as compared to healthy individuals and untreated breast cancer
patients. Despite having reduced percentages in peripheral blood, γδ T cells were in highly
activated state and showed increased expression of late activation marker CD25. In Zoledronate
treated breast cancer patients, major subpopulation of γδ T cells was of terminally differentiated
effector memory (TEMRA) type. TEMRA memory subtype cells are highly cytotoxic in nature
and produce higher levels of cytolytic granules and IFNγ. Intracellular cytokine profiling of γδ T
cells showed increased percentages of γδ+IFNγ
+ cells in peripheral blood of Zoledronate treated
breast cancer patients as compared to untreated breast cancer patients and healthy individuals. γδ
T cells from Zoledronate treated breast cancer patients responded well to PMA+Ionomycin
stimulation as compared to untreated breast cancer patients and showed a significant increase in
percentages γδ+IFNγ
+ upon stimulation. IFNγ plays important role in promoting adaptive and
innate immune responses. IFNγ modulates immunogenic properties of the tumors and prevents
their proliferation. Analysis of cell free supernatants of activated γδ T cells isolated from
Zoledronate treated breast cancer patients showed reduced levels of IL6, which is a potent
proinflammatory and pro-osteoclastogenic cytokine. It clearly indicated that Zoledronate
treatment activates γδ T cells, which in turn activates other immune cells and also reduces
expression of pro-osteoclastogenic cytokines by γδ T cells (Figure 40).

Summary and conclusion
248
Figure 40: Crosstalk between bone and γδ T lymphocytes in breast cancer patients
mediated by Zoledronate
Zoledronate binds to bone due to its high affinity for calcium and gets embedded into bone
matrix by osteoblasts. It is released into bone microenvironment by resorbing osteoclasts, where
it activates γδ T cells. Upon Zoledronate treatment, breast tumor cells show change in expression
of proteins [upregulated ( ) and downregulated ( )] associated with crucial cellular processes.
Zoledronate treated breast cancer cells also upregulate expression of proteins associated
recruitment and activation of γδ T cells (heat shock protein (HSP) 60, HSP70, isopentenyl
pyrophosphate (IPP), S100A8) and proteins associated with conjugate formation between tumor
cells and immune cells. Thus, activated γδ T cells release higher levels of interferon γ (IFNγ) and
Summary and conclusion
249
cytolytic granules (perforin and granzyme), through which they exert antitumor effect. Upon
activation, γδ T cells activate other immune cells such as CD8+ T cells, B cells and NK cells,
thus expanding the antitumor effect. IFNγ released by activated γδ T cells also inhibit osteoclast
generation and function by disruption of RANK-RANKL signaling. In “non-activated” state, γδ
T cells release higher concentrations of IL6 and enhance generation and activity of osteoclast.
In conclusion, the present study demonstrates that Zoledronate facilitates the
tripartite crosstalk between the tumor cells, immune cells and bone cells. The study has
highlighted the effect of Zoledronate in breast cancer patients, which is significantly
different from its well defined anti-resorptive function. Given the development of new
generation aminobisphosphonates, synthetic phosphoantigens, immobilized antigens and
antibodies, it now appears practical to sculpt and expand γδ T cells to achieve therapeutic
effect in cancer patients. Results from Phase-I and Phase-II clinical trials indicate that the
efficacy of γδ T cell based cancer immunotherapy is comparable to conventional therapies.
Combining agents (aminobisophsopnates) that promote γδ T cell expansion and activation
with cytolytic tumor specific antibodies that can mediate ADCC (antibody dependant
cellular cytotoxicity) represents the new frontier of anticancer immunotherapy.

Summary and conclusion
250
References
251
References
1. Ahn SG, Lee HM, Cho SH, Lee SA, Hwang SH, et al. (2013) Prognostic factors for patients
with bone-only metastasis in breast cancer. Yonsei Med J 54: 1168-1177.
2. Soysa NS, Alles N, Aoki K, Ohya K (2012) Osteoclast formation and differentiation: an
overview. J Med Dent Sci 59: 65-74.
3. Teitelbaum SL (2007) Osteoclasts: what do they do and how do they do it? Am J Pathol 170:
427-435.
4. Zheng Y, Zhou H, Dunstan CR, Sutherland RL, Seibel MJ (2013) The role of the bone
microenvironment in skeletal metastasis. J Bone Oncol 2: 47-57.
5. Soki FN, Park SI, McCauley LK (2012) The multifaceted actions of PTHrP in skeletal
metastasis. Future Oncol 8: 803-817.
6. Fournier PG, Stresing V, Ebetino FH, Clezardin P (2010) How do bisphosphonates inhibit
bone metastasis in vivo? Neoplasia 12: 571-578.
7. Drake MT, Clarke BL, Khosla S (2008) Bisphosphonates: mechanism of action and role in
clinical practice. Mayo Clin Proc 83: 1032-1045.
8. Kimachi K, Kajiya H, Nakayama S, Ikebe T, Okabe K (2011) Zoledronic acid inhibits RANK
expression and migration of osteoclast precursors during osteoclastogenesis. Naunyn
Schmiedebergs Arch Pharmacol 383: 297-308.
9. Green JR (2003) Antitumor effects of bisphosphonates. Cancer 97: 840-847.
10. Jagdev SP, Coleman RE, Shipman CM, Rostami HA, Croucher PI (2001) The
bisphosphonate, zoledronic acid, induces apoptosis of breast cancer cells: evidence for
synergy with paclitaxel. Br J Cancer 84: 1126-1134.
11. Chiplunkar S, Dhar S, Wesch D, Kabelitz D (2009) gammadelta T cells in cancer
immunotherapy: current status and future prospects. Immunotherapy 1: 663-678.
12. Hayday AC (2000) [gamma][delta] cells: a right time and a right place for a conserved third
way of protection. Annu Rev Immunol 18: 975-1026.
13. Caccamo N, Todaro M, Sireci G, Meraviglia S, Stassi G, et al. (2013) Mechanisms
underlying lineage commitment and plasticity of human gammadelta T cells. Cell Mol
Immunol 10: 30-34.
14. Beetz S, Marischen L, Kabelitz D, Wesch D (2007) Human gamma delta T cells: candidates
for the development of immunotherapeutic strategies. Immunol Res 37: 97-111.
15. Konigshofer Y, Chien YH (2006) Gammadelta T cells - innate immune lymphocytes? Curr
Opin Immunol 18: 527-533.
16. Kabelitz D, Kalyan S, Oberg HH, Wesch D (2013) Human Vdelta2 versus non-Vdelta2
gammadelta T cells in antitumor immunity. Oncoimmunology 2: e23304.
17. Sharp LL, Jameson JM, Cauvi G, Havran WL (2005) Dendritic epidermal T cells regulate
skin homeostasis through local production of insulin-like growth factor 1. Nat Immunol
6: 73-79.
18. Jameson JM, Cauvi G, Sharp LL, Witherden DA, Havran WL (2005) Gammadelta T cell-
induced hyaluronan production by epithelial cells regulates inflammation. J Exp Med
201: 1269-1279.
19. Havran WL, Jameson JM, Witherden DA (2005) Epithelial cells and their neighbors. III.
Interactions between intraepithelial lymphocytes and neighboring epithelial cells. Am J
Physiol Gastrointest Liver Physiol 289: G627-630.
References
252
20. Born WK, Reardon CL, O'Brien RL (2006) The function of gammadelta T cells in innate
immunity. Curr Opin Immunol 18: 31-38.
21. Hayday AC (2009) Gammadelta T cells and the lymphoid stress-surveillance response.
Immunity 31: 184-196.
22. Wu YL, Ding YP, Tanaka Y, Shen LW, Wei CH, et al. (2014) gammadelta T cells and their
potential for immunotherapy. Int J Biol Sci 10: 119-135.
23. Wesch D, Marx S, Kabelitz D (1997) Comparative analysis of alpha beta and gamma delta T
cell activation by Mycobacterium tuberculosis and isopentenyl pyrophosphate. Eur J
Immunol 27: 952-956.
24. Gomes AQ, Correia DV, Grosso AR, Lanca T, Ferreira C, et al. (2010) Identification of a
panel of ten cell surface protein antigens associated with immunotargeting of leukemias
and lymphomas by peripheral blood gammadelta T cells. Haematologica 95: 1397-1404.
25. Gertner-Dardenne J, Castellano R, Mamessier E, Garbit S, Kochbati E, et al. (2012) Human
Vgamma9Vdelta2 T cells specifically recognize and kill acute myeloid leukemic blasts. J
Immunol 188: 4701-4708.
26. Dhar S, Chiplunkar SV (2010) Lysis of aminobisphosphonate-sensitized MCF-7 breast tumor
cells by Vgamma9Vdelta2 T cells. Cancer Immun 10: 10.
27. Thomas ML, Samant UC, Deshpande RK, Chiplunkar SV (2000) gammadelta T cells lyse
autologous and allogenic oesophageal tumours: involvement of heat-shock proteins in the
tumour cell lysis. Cancer Immunol Immunother 48: 653-659.
28. Pollinger B, Junt T, Metzler B, Walker UA, Tyndall A, et al. (2011) Th17 cells, not IL-17+
gammadelta T cells, drive arthritic bone destruction in mice and humans. J Immunol 186:
2602-2612.
29. Kotake S, Udagawa N, Hakoda M, Mogi M, Yano K, et al. (2001) Activated human T cells
directly induce osteoclastogenesis from human monocytes: possible role of T cells in
bone destruction in rheumatoid arthritis patients. Arthritis Rheum 44: 1003-1012.
30. Lee SJ, Nam KI, Jin HM, Cho YN, Lee SE, et al. (2011) Bone destruction by receptor
activator of nuclear factor kappaB ligand-expressing T cells in chronic gouty arthritis.
Arthritis Res Ther 13: R164.
31. Walsh MC, Kim N, Kadono Y, Rho J, Lee SY, et al. (2006) Osteoimmunology: interplay
between the immune system and bone metabolism. Annu Rev Immunol 24: 33-63.
32. Sato K, Takayanagi H (2006) Osteoclasts, rheumatoid arthritis, and osteoimmunology. Curr
Opin Rheumatol 18: 419-426.
33. Laemmli UK (1970) Cleavage of structural proteins during the assembly of the head of
bacteriophage T4. Nature 227: 680-685.
34. Weil RJ, Palmieri DC, Bronder JL, Stark AM, Steeg PS (2005) Breast cancer metastasis to
the central nervous system. Am J Pathol 167: 913-920.
35. Valastyan S, Weinberg RA (2011) Tumor metastasis: molecular insights and evolving
paradigms. Cell 147: 275-292.
36. Tracey A. Martin LY, Andrew J. Sanders, Jane Lane, and Wen G. Jiang (2000) Cancer
Invasion and Metastasis: Molecular and Cellular Perspective, .
37. Kozlow W, Guise TA (2005) Breast cancer metastasis to bone: mechanisms of osteolysis and
implications for therapy. J Mammary Gland Biol Neoplasia 10: 169-180.
38. Suva LJ, Griffin RJ, Makhoul I (2009) Mechanisms of bone metastases of breast cancer.
Endocr Relat Cancer 16: 703-713.

References
253
39. Raggatt LJ, Partridge NC (2010) Cellular and molecular mechanisms of bone remodeling. J
Biol Chem 285: 25103-25108.
40. Feng X, McDonald JM (2011) Disorders of bone remodeling. Annu Rev Pathol 6: 121-145.
41. Roodman GD (2004) Mechanisms of bone metastasis. N Engl J Med 350: 1655-1664.
42. Bussard KM, Gay CV, Mastro AM (2008) The bone microenvironment in metastasis; what is
special about bone? Cancer Metastasis Rev 27: 41-55.
43. Roodman GD (2001) Biology of osteoclast activation in cancer. J Clin Oncol 19: 3562-3571.
44. Takayanagi H (2007) Osteoimmunology: shared mechanisms and crosstalk between the
immune and bone systems. Nat Rev Immunol 7: 292-304.
45. Horwood NJ, Kartsogiannis V, Quinn JM, Romas E, Martin TJ, et al. (1999) Activated T
lymphocytes support osteoclast formation in vitro. Biochem Biophys Res Commun 265:
144-150.
46. Pang M, Martinez AF, Jacobs J, Balkan W, Troen BR (2005) RANK ligand and interferon
gamma differentially regulate cathepsin gene expression in pre-osteoclastic cells.
Biochem Biophys Res Commun 328: 756-763.
47. Kong YY, Feige U, Sarosi I, Bolon B, Tafuri A, et al. (1999) Activated T cells regulate bone
loss and joint destruction in adjuvant arthritis through osteoprotegerin ligand. Nature 402:
304-309.
48. Kurihara N, Bertolini D, Suda T, Akiyama Y, Roodman GD (1990) IL-6 stimulates
osteoclast-like multinucleated cell formation in long term human marrow cultures by
inducing IL-1 release. J Immunol 144: 4226-4230.
49. Sato K, Suematsu A, Okamoto K, Yamaguchi A, Morishita Y, et al. (2006) Th17 functions
as an osteoclastogenic helper T cell subset that links T cell activation and bone
destruction. J Exp Med 203: 2673-2682.
50. Weitzmann MN, Cenci S, Rifas L, Haug J, Dipersio J, et al. (2001) T cell activation induces
human osteoclast formation via receptor activator of nuclear factor kappaB ligand-
dependent and -independent mechanisms. J Bone Miner Res 16: 328-337.
51. Takayanagi H, Ogasawara K, Hida S, Chiba T, Murata S, et al. (2000) T-cell-mediated
regulation of osteoclastogenesis by signalling cross-talk between RANKL and IFN-
gamma. Nature 408: 600-605.
52. Caraglia M, Santini D, Marra M, Vincenzi B, Tonini G, et al. (2006) Emerging anti-cancer
molecular mechanisms of aminobisphosphonates. Endocr Relat Cancer 13: 7-26.
53. van Beek E, Pieterman E, Cohen L, Lowik C, Papapoulos S (1999) Farnesyl pyrophosphate
synthase is the molecular target of nitrogen-containing bisphosphonates. Biochem
Biophys Res Commun 264: 108-111.
54. Lipton A, Goessl C (2011) Clinical development of anti-RANKL therapies for treatment and
prevention of bone metastasis. Bone 48: 96-99.
55. Roodman GD, Dougall WC (2008) RANK ligand as a therapeutic target for bone metastases
and multiple myeloma. Cancer Treat Rev 34: 92-101.
56. Lee RJ, Saylor PJ, Smith MR (2011) Treatment and prevention of bone complications from
prostate cancer. Bone 48: 88-95.
57. Neville-Webbe HL, Coleman RE (2010) Bisphosphonates and RANK ligand inhibitors for
the treatment and prevention of metastatic bone disease. Eur J Cancer 46: 1211-1222.
58. Dhillon S, Lyseng-Williamson KA (2008) Zoledronic acid : a review of its use in the
management of bone metastases of malignancy. Drugs 68: 507-534.

References
254
59. Croucher P, Jagdev S, Coleman R (2003) The anti-tumor potential of zoledronic acid. Breast
12 Suppl 2: S30-36.
60. Clezardin P (2005) Anti-tumour activity of zoledronic acid. Cancer Treat Rev 31 Suppl 3: 1-
8.
61. Massaia M (2012) Aminobisphosphonates, statins and the mevalonate pathway: a cross-road
to fine-tune the activation of NK and Vγ9Vδ2 T cells. IBMS BoneKEy.
62. Gober HJ, Kistowska M, Angman L, Jeno P, Mori L, et al. (2003) Human T cell receptor
gammadelta cells recognize endogenous mevalonate metabolites in tumor cells. J Exp
Med 197: 163-168.
63. Morita CT, Beckman EM, Bukowski JF, Tanaka Y, Band H, et al. (1995) Direct presentation
of nonpeptide prenyl pyrophosphate antigens to human gamma delta T cells. Immunity 3:
495-507.
64. Wesch D, Glatzel A, Kabelitz D (2001) Differentiation of resting human peripheral blood
gamma delta T cells toward Th1- or Th2-phenotype. Cell Immunol 212: 110-117.
65. Sireci G, Champagne E, Fournie JJ, Dieli F, Salerno A (1997) Patterns of phosphoantigen
stimulation of human Vgamma9/Vdelta2 T cell clones include Th0 cytokines. Hum
Immunol 58: 70-82.
66. Ness-Schwickerath KJ, Jin C, Morita CT (2010) Cytokine requirements for the
differentiation and expansion of IL-17A- and IL-22-producing human Vgamma2Vdelta2
T cells. J Immunol 184: 7268-7280.
67. Caccamo N, La Mendola C, Orlando V, Meraviglia S, Todaro M, et al. (2011)
Differentiation, phenotype, and function of interleukin-17-producing human
Vgamma9Vdelta2 T cells. Blood 118: 129-138.
68. Casetti R, Agrati C, Wallace M, Sacchi A, Martini F, et al. (2009) Cutting edge: TGF-beta1
and IL-15 Induce FOXP3+ gammadelta regulatory T cells in the presence of antigen
stimulation. J Immunol 183: 3574-3577.
69. Wrobel P, Shojaei H, Schittek B, Gieseler F, Wollenberg B, et al. (2007) Lysis of a broad
range of epithelial tumour cells by human gamma delta T cells: involvement of NKG2D
ligands and T-cell receptor- versus NKG2D-dependent recognition. Scand J Immunol 66:
320-328.
70. Todaro M, D'Asaro M, Caccamo N, Iovino F, Francipane MG, et al. (2009) Efficient killing
of human colon cancer stem cells by gammadelta T lymphocytes. J Immunol 182: 7287-
7296.
71. Laad AD, Thomas ML, Fakih AR, Chiplunkar SV (1999) Human gamma delta T cells
recognize heat shock protein-60 on oral tumor cells. Int J Cancer 80: 709-714.
72. Born WK, Kemal Aydintug M, O'Brien RL (2013) Diversity of gammadelta T-cell antigens.
Cell Mol Immunol 10: 13-20.
73. Wang H, Sarikonda G, Puan KJ, Tanaka Y, Feng J, et al. (2011) Indirect stimulation of
human Vgamma2Vdelta2 T cells through alterations in isoprenoid metabolism. J
Immunol 187: 5099-5113.
74. Gogoi D, Chiplunkar SV (2013) Targeting gamma delta T cells for cancer immunotherapy:
bench to bedside. Indian J Med Res 138: 755-761.
75. Kondo M, Izumi T, Fujieda N, Kondo A, Morishita T, et al. (2011) Expansion of human
peripheral blood gammadelta T cells using zoledronate. J Vis Exp.
76. Das H, Wang L, Kamath A, Bukowski JF (2001) Vgamma2Vdelta2 T-cell receptor-mediated
recognition of aminobisphosphonates. Blood 98: 1616-1618.
References
255
77. Fromigue O, Lagneaux L, Body JJ (2000) Bisphosphonates induce breast cancer cell death in
vitro. J Bone Miner Res 15: 2211-2221.
78. Senaratne SG, Pirianov G, Mansi JL, Arnett TR, Colston KW (2000) Bisphosphonates
induce apoptosis in human breast cancer cell lines. Br J Cancer 82: 1459-1468.
79. Roelofs AJ, Thompson K, Gordon S, Rogers MJ (2006) Molecular mechanisms of action of
bisphosphonates: current status. Clin Cancer Res 12: 6222s-6230s.
80. Kunzmann V, Bauer E, Feurle J, Weissinger F, Tony HP, et al. (2000) Stimulation of
gammadelta T cells by aminobisphosphonates and induction of antiplasma cell activity in
multiple myeloma. Blood 96: 384-392.
81. Marten A, Lilienfeld-Toal M, Buchler MW, Schmidt J (2007) Zoledronic acid has direct
antiproliferative and antimetastatic effect on pancreatic carcinoma cells and acts as an
antigen for delta2 gamma/delta T cells. J Immunother 30: 370-377.
82. Sato K, Kimura S, Segawa H, Yokota A, Matsumoto S, et al. (2005) Cytotoxic effects of
gammadelta T cells expanded ex vivo by a third generation bisphosphonate for cancer
immunotherapy. Int J Cancer 116: 94-99.
83. Fredholm H, Eaker S, Frisell J, Holmberg L, Fredriksson I, et al. (2009) Breast cancer in
young women: poor survival despite intensive treatment. PLoS One 4: e7695.
84. Anders CK, Johnson R, Litton J, Phillips M, Bleyer A (2009) Breast cancer before age 40
years. Semin Oncol 36: 237-249.
85. Agarwal G, Pradeep PV, Aggarwal V, Yip CH, Cheung PS (2007) Spectrum of breast cancer
in Asian women. World J Surg 31: 1031-1040.
86. Mani SA, Guo W, Liao MJ, Eaton EN, Ayyanan A, et al. (2008) The epithelial-mesenchymal
transition generates cells with properties of stem cells. Cell 133: 704-715.
87. Onder TT, Gupta PB, Mani SA, Yang J, Lander ES, et al. (2008) Loss of E-cadherin
promotes metastasis via multiple downstream transcriptional pathways. Cancer Res 68:
3645-3654.
88. Peinado H, Olmeda D, Cano A (2007) Snail, Zeb and bHLH factors in tumour progression:
an alliance against the epithelial phenotype? Nat Rev Cancer 7: 415-428.
89. Zeleniuch-Jacquotte A, Afanasyeva Y, Kaaks R, Rinaldi S, Scarmo S, et al. (2012)
Premenopausal serum androgens and breast cancer risk: a nested case-control study.
Breast Cancer Res 14: R32.
90. Harris TJ, McCormick F (2010) The molecular pathology of cancer. Nat Rev Clin Oncol 7:
251-265.
91. Caffarel MM, Pensa S, Wickenden JA, Watson CJ (2011) Molecular Biology of Breast
Cancer. Encyclopedia of life sciences.
92. Singh V, Saunders C, Wylie L, Bourke A (2008) New diagnostic techniques for breast cancer
detection. Future Oncol 4: 501-513.
93. . http://www.cancer.org/cancer/breastcancer/detailedguide/breast-cancer-staging
94. Malhotra GK, Zhao X, Band H, Band V (2010) Histological, molecular and functional
subtypes of breast cancers. Cancer Biol Ther 10: 955-960.
95. Herschkowitz JI, Simin K, Weigman VJ, Mikaelian I, Usary J, et al. (2007) Identification of
conserved gene expression features between murine mammary carcinoma models and
human breast tumors. Genome Biol 8: R76.
96. Prat A, Parker JS, Karginova O, Fan C, Livasy C, et al. (2010) Phenotypic and molecular
characterization of the claudin-low intrinsic subtype of breast cancer. Breast Cancer Res
12: R68.

References
256
97. Perou CM, Sorlie T, Eisen MB, van de Rijn M, Jeffrey SS, et al. (2000) Molecular portraits
of human breast tumours. Nature 406: 747-752.
98. Sorlie T, Perou CM, Tibshirani R, Aas T, Geisler S, et al. (2001) Gene expression patterns of
breast carcinomas distinguish tumor subclasses with clinical implications. Proc Natl Acad
Sci U S A 98: 10869-10874.
99. Sorlie T, Tibshirani R, Parker J, Hastie T, Marron JS, et al. (2003) Repeated observation of
breast tumor subtypes in independent gene expression data sets. Proc Natl Acad Sci U S
A 100: 8418-8423.
100. Lam SW, Jimenez CR, Boven E (2014) Breast cancer classification by proteomic
technologies: current state of knowledge. Cancer Treat Rev 40: 129-138.
101. Weigelt B, Peterse JL, van 't Veer LJ (2005) Breast cancer metastasis: markers and models.
Nat Rev Cancer 5: 591-602.
102. Koscielny S, Tubiana M, Le MG, Valleron AJ, Mouriesse H, et al. (1984) Breast cancer:
relationship between the size of the primary tumour and the probability of metastatic
dissemination. Br J Cancer 49: 709-715.
103. Page DL (1991) Prognosis and breast cancer. Recognition of lethal and favorable prognostic
types. Am J Surg Pathol 15: 334-349.
104. Ross JS, Fletcher JA, Linette GP, Stec J, Clark E, et al. (2003) The Her-2/neu gene and
protein in breast cancer 2003: biomarker and target of therapy. Oncologist 8: 307-325.
105. Clemons M, Gelmon KA, Pritchard KI, Paterson AH (2012) Bone-targeted agents and
skeletal-related events in breast cancer patients with bone metastases: the state of the art.
Curr Oncol 19: 259-268.
106. Swain SM, Baselga J, Kim SB, Ro J, Semiglazov V, et al. (2015) Pertuzumab, trastuzumab,
and docetaxel in HER2-positive metastatic breast cancer. N Engl J Med 372: 724-734.
107. Mundy GR (2002) Metastasis to bone: causes, consequences and therapeutic opportunities.
Nat Rev Cancer 2: 584-593.
108. Paget S (1989) The distribution of secondary growths in cancer of the breast. 1889. Cancer
Metastasis Rev 8: 98-101.
109. Boyce BF, Yoneda T, Guise TA (1999) Factors regulating the growth of metastatic cancer
in bone. Endocr Relat Cancer 6: 333-347.
110. Vander Griend DJ, Rinker-Schaeffer CW (2004) A new look at an old problem: the survival
and organ-specific growth of metastases. Sci STKE 2004: pe3.
111. Nguyen DX, Bos PD, Massague J (2009) Metastasis: from dissemination to organ-specific
colonization. Nat Rev Cancer 9: 274-284.
112. Muller A, Homey B, Soto H, Ge N, Catron D, et al. (2001) Involvement of chemokine
receptors in breast cancer metastasis. Nature 410: 50-56.
113. Yin JJ, Pollock CB, Kelly K (2005) Mechanisms of cancer metastasis to the bone. Cell Res
15: 57-62.
114. Kraljevic Pavelic S, Sedic M, Bosnjak H, Spaventi S, Pavelic K (2011) Metastasis: new
perspectives on an old problem. Mol Cancer 10: 22.
115. Guise TA (2002) The vicious cycle of bone metastases. J Musculoskelet Neuronal Interact
2: 570-572.
116. Hess KR, Varadhachary GR, Taylor SH, Wei W, Raber MN, et al. (2006) Metastatic
patterns in adenocarcinoma. Cancer 106: 1624-1633.
References
257
117. Clines GA, Guise TA (2005) Hypercalcaemia of malignancy and basic research on
mechanisms responsible for osteolytic and osteoblastic metastasis to bone. Endocr Relat
Cancer 12: 549-583.
118. Chirgwin JM, Guise TA (2000) Molecular mechanisms of tumor-bone interactions in
osteolytic metastases. Crit Rev Eukaryot Gene Expr 10: 159-178.
119. Lerner UH (2006) Bone remodeling in post-menopausal osteoporosis. J Dent Res 85: 584-
595.
120. Chen YC, Sosnoski DM, Mastro AM (2010) Breast cancer metastasis to the bone:
mechanisms of bone loss. Breast Cancer Res 12: 215.
121. Caetano-Lopes J, Canhao H, Fonseca JE (2007) Osteoblasts and bone formation. Acta
Reumatol Port 32: 103-110.
122. Wang RN, Green J, Wang Z, Deng Y, Qiao M, et al. (2014) Bone Morphogenetic Protein
(BMP) signaling in development and human diseases. Genes Dis 1: 87-105.
123. Huang W, Yang S, Shao J, Li YP (2007) Signaling and transcriptional regulation in
osteoblast commitment and differentiation. Front Biosci 12: 3068-3092.
124. Chen G, Deng C, Li YP (2012) TGF-beta and BMP signaling in osteoblast differentiation
and bone formation. Int J Biol Sci 8: 272-288.
125. Ducy P, Zhang R, Geoffroy V, Ridall AL, Karsenty G (1997) Osf2/Cbfa1: a transcriptional
activator of osteoblast differentiation. Cell 89: 747-754.
126. Datta HK, Ng WF, Walker JA, Tuck SP, Varanasi SS (2008) The cell biology of bone
metabolism. J Clin Pathol 61: 577-587.
127. Hodge JM, Kirkland MA, Nicholson GC (2007) Multiple roles of M-CSF in human
osteoclastogenesis. J Cell Biochem 102: 759-768.
128. Yagi M, Miyamoto T, Sawatani Y, Iwamoto K, Hosogane N, et al. (2005) DC-STAMP is
essential for cell-cell fusion in osteoclasts and foreign body giant cells. J Exp Med 202:
345-351.
129. Arai F, Miyamoto T, Ohneda O, Inada T, Sudo T, et al. (1999) Commitment and
differentiation of osteoclast precursor cells by the sequential expression of c-Fms and
receptor activator of nuclear factor kappaB (RANK) receptors. J Exp Med 190: 1741-
1754.
130. Leibbrandt A, Penninger JM (2008) RANK/RANKL: regulators of immune responses and
bone physiology. Ann N Y Acad Sci 1143: 123-150.
131. Humphrey MB, Lanier LL, Nakamura MC (2005) Role of ITAM-containing adapter
proteins and their receptors in the immune system and bone. Immunol Rev 208: 50-65.
132. Vaananen HK, Zhao H, Mulari M, Halleen JM (2000) The cell biology of osteoclast
function. J Cell Sci 113 ( Pt 3): 377-381.
133. Mulari M, Vaaraniemi J, Vaananen HK (2003) Intracellular membrane trafficking in bone
resorbing osteoclasts. Microsc Res Tech 61: 496-503.
134. Luxenburg C, Geblinger D, Klein E, Anderson K, Hanein D, et al. (2007) The architecture
of the adhesive apparatus of cultured osteoclasts: from podosome formation to sealing
zone assembly. PLoS One 2: e179.
135. Saltel F, Destaing O, Bard F, Eichert D, Jurdic P (2004) Apatite-mediated actin dynamics in
resorbing osteoclasts. Mol Biol Cell 15: 5231-5241.
136. Graves AR, Curran PK, Smith CL, Mindell JA (2008) The Cl-/H+ antiporter ClC-7 is the
primary chloride permeation pathway in lysosomes. Nature 453: 788-792.

References
258
137. Kornak U, Kasper D, Bosl MR, Kaiser E, Schweizer M, et al. (2001) Loss of the ClC-7
chloride channel leads to osteopetrosis in mice and man. Cell 104: 205-215.
138. Nesbitt SA, Horton MA (1997) Trafficking of matrix collagens through bone-resorbing
osteoclasts. Science 276: 266-269.
139. Salo J, Lehenkari P, Mulari M, Metsikko K, Vaananen HK (1997) Removal of osteoclast
bone resorption products by transcytosis. Science 276: 270-273.
140. Akiyama T, Bouillet P, Miyazaki T, Kadono Y, Chikuda H, et al. (2003) Regulation of
osteoclast apoptosis by ubiquitylation of proapoptotic BH3-only Bcl-2 family member
Bim. EMBO J 22: 6653-6664.
141. Xing L, Boyce BF (2005) Regulation of apoptosis in osteoclasts and osteoblastic cells.
Biochem Biophys Res Commun 328: 709-720.
142. Coxon FP, Taylor A (2008) Vesicular trafficking in osteoclasts. Semin Cell Dev Biol 19:
424-433.
143. Coxon FP, Thompson K, Rogers MJ (2006) Recent advances in understanding the
mechanism of action of bisphosphonates. Curr Opin Pharmacol 6: 307-312.
144. Bonewald LF (2011) The amazing osteocyte. J Bone Miner Res 26: 229-238.
145. Weitzmann MN, Pacifici R (2006) Estrogen deficiency and bone loss: an inflammatory tale.
J Clin Invest 116: 1186-1194.
146. Bakker AD, Soejima K, Klein-Nulend J, Burger EH (2001) The production of nitric oxide
and prostaglandin E(2) by primary bone cells is shear stress dependent. J Biomech 34:
671-677.
147. Seeman E, Delmas PD (2006) Bone quality--the material and structural basis of bone
strength and fragility. N Engl J Med 354: 2250-2261.
148. Gu G, Hentunen TA, Nars M, Harkonen PL, Vaananen HK (2005) Estrogen protects
primary osteocytes against glucocorticoid-induced apoptosis. Apoptosis 10: 583-595.
149. Sims NA, Martin TJ (2015) Coupling Signals between the Osteoclast and Osteoblast: How
are Messages Transmitted between These Temporary Visitors to the Bone Surface? Front
Endocrinol (Lausanne) 6: 41.
150. Thomas GP, Baker SU, Eisman JA, Gardiner EM (2001) Changing RANKL/OPG mRNA
expression in differentiating murine primary osteoblasts. J Endocrinol 170: 451-460.
151. Baker PJ, Dixon M, Evans RT, Dufour L, Johnson E, et al. (1999) CD4(+) T cells and the
proinflammatory cytokines gamma interferon and interleukin-6 contribute to alveolar
bone loss in mice. Infect Immun 67: 2804-2809.
152. Lubberts E (2015) Role of T lymphocytes in the development of rheumatoid arthritis.
Implications for treatment. Curr Pharm Des 21: 142-146.
153. Di Rosa F, Pabst R (2005) The bone marrow: a nest for migratory memory T cells. Trends
Immunol 26: 360-366.
154. Weitzmann MN, Pacifici R (2005) The role of T lymphocytes in bone metabolism.
Immunol Rev 208: 154-168.
155. Karaplis AC, Goltzman D (2000) PTH and PTHrP effects on the skeleton. Rev Endocr
Metab Disord 1: 331-341.
156. Yamamoto I, Bringhurst FR, Potts JT, Jr., Segre GV (1988) Properties of parathyroid
hormone receptors on circulating bovine lymphocytes. J Bone Miner Res 3: 289-295.
157. Atkinson MJ, Hesch RD, Cade C, Wadwah M, Perris AD (1987) Parathyroid hormone
stimulation of mitosis in rat thymic lymphocytes is independent of cyclic AMP. J Bone
Miner Res 2: 303-309.
References
259
158. Joseph Lorenzo MH, Yongwon Choi, Hiroshi Takayanagi, Georg Schett Osteoimmunology:
Interactions of the Immune and Skeletal Systems.
159. Li H, Hong S, Qian J, Zheng Y, Yang J, et al. (2010) Cross talk between the bone and
immune systems: osteoclasts function as antigen-presenting cells and activate CD4+ and
CD8+ T cells. Blood 116: 210-217.
160. Roato I, Grano M, Brunetti G, Colucci S, Mussa A, et al. (2005) Mechanisms of
spontaneous osteoclastogenesis in cancer with bone involvement. FASEB J 19: 228-230.
161. Colucci S, Brunetti G, Rizzi R, Zonno A, Mori G, et al. (2004) T cells support
osteoclastogenesis in an in vitro model derived from human multiple myeloma bone
disease: the role of the OPG/TRAIL interaction. Blood 104: 3722-3730.
162. Giuliani N, Colla S, Sala R, Moroni M, Lazzaretti M, et al. (2002) Human myeloma cells
stimulate the receptor activator of nuclear factor-kappa B ligand (RANKL) in T
lymphocytes: a potential role in multiple myeloma bone disease. Blood 100: 4615-4621.
163. Neville-Webbe HL, Cross NA, Eaton CL, Nyambo R, Evans CA, et al. (2004)
Osteoprotegerin (OPG) produced by bone marrow stromal cells protects breast cancer
cells from TRAIL-induced apoptosis. Breast Cancer Res Treat 86: 269-279.
164. Al-Rawi MA, Rmali K, Watkins G, Mansel RE, Jiang WG (2004) Aberrant expression of
interleukin-7 (IL-7) and its signalling complex in human breast cancer. Eur J Cancer 40:
494-502.
165. Lee SK, Surh CD (2005) Role of interleukin-7 in bone and T-cell homeostasis. Immunol
Rev 208: 169-180.
166. Ryan MR, Shepherd R, Leavey JK, Gao Y, Grassi F, et al. (2005) An IL-7-dependent
rebound in thymic T cell output contributes to the bone loss induced by estrogen
deficiency. Proc Natl Acad Sci U S A 102: 16735-16740.
167. Bendre MS, Margulies AG, Walser B, Akel NS, Bhattacharrya S, et al. (2005) Tumor-
derived interleukin-8 stimulates osteolysis independent of the receptor activator of
nuclear factor-kappaB ligand pathway. Cancer Res 65: 11001-11009.
168. Casilli F, Bianchini A, Gloaguen I, Biordi L, Alesse E, et al. (2005) Inhibition of
interleukin-8 (CXCL8/IL-8) responses by repertaxin, a new inhibitor of the chemokine
receptors CXCR1 and CXCR2. Biochem Pharmacol 69: 385-394.
169. Siegel PM, Massague J (2003) Cytostatic and apoptotic actions of TGF-beta in homeostasis
and cancer. Nat Rev Cancer 3: 807-821.
170. Park IK, Shultz LD, Letterio JJ, Gorham JD (2005) TGF-beta1 inhibits T-bet induction by
IFN-gamma in murine CD4+ T cells through the protein tyrosine phosphatase Src
homology region 2 domain-containing phosphatase-1. J Immunol 175: 5666-5674.
171. Huber S, Schramm C, Lehr HA, Mann A, Schmitt S, et al. (2004) Cutting edge: TGF-beta
signaling is required for the in vivo expansion and immunosuppressive capacity of
regulatory CD4+CD25+ T cells. J Immunol 173: 6526-6531.
172. Fantini MC, Becker C, Monteleone G, Pallone F, Galle PR, et al. (2004) Cutting edge:
TGF-beta induces a regulatory phenotype in CD4+CD25- T cells through Foxp3
induction and down-regulation of Smad7. J Immunol 172: 5149-5153.
173. Thomas DA, Massague J (2005) TGF-beta directly targets cytotoxic T cell functions during
tumor evasion of immune surveillance. Cancer Cell 8: 369-380.
174. Kotake S, Nanke Y, Mogi M, Kawamoto M, Furuya T, et al. (2005) IFN-gamma-producing
human T cells directly induce osteoclastogenesis from human monocytes via the
expression of RANKL. Eur J Immunol 35: 3353-3363.

References
260
175. Devlin RD, Reddy SV, Savino R, Ciliberto G, Roodman GD (1998) IL-6 mediates the
effects of IL-1 or TNF, but not PTHrP or 1,25(OH)2D3, on osteoclast-like cell formation
in normal human bone marrow cultures. J Bone Miner Res 13: 393-399.
176. Kudo O, Sabokbar A, Pocock A, Itonaga I, Fujikawa Y, et al. (2003) Interleukin-6 and
interleukin-11 support human osteoclast formation by a RANKL-independent
mechanism. Bone 32: 1-7.
177. Kim N, Kadono Y, Takami M, Lee J, Lee SH, et al. (2005) Osteoclast differentiation
independent of the TRANCE-RANK-TRAF6 axis. J Exp Med 202: 589-595.
178. Cenci S, Weitzmann MN, Roggia C, Namba N, Novack D, et al. (2000) Estrogen deficiency
induces bone loss by enhancing T-cell production of TNF-alpha. J Clin Invest 106: 1229-
1237.
179. Zhang YH, Heulsmann A, Tondravi MM, Mukherjee A, Abu-Amer Y (2001) Tumor
necrosis factor-alpha (TNF) stimulates RANKL-induced osteoclastogenesis via coupling
of TNF type 1 receptor and RANK signaling pathways. J Biol Chem 276: 563-568.
180. Hofbauer LC, Lacey DL, Dunstan CR, Spelsberg TC, Riggs BL, et al. (1999) Interleukin-
1beta and tumor necrosis factor-alpha, but not interleukin-6, stimulate osteoprotegerin
ligand gene expression in human osteoblastic cells. Bone 25: 255-259.
181. Kurokouchi K, Kambe F, Yasukawa K, Izumi R, Ishiguro N, et al. (1998) TNF-alpha
increases expression of IL-6 and ICAM-1 genes through activation of NF-kappaB in
osteoblast-like ROS17/2.8 cells. J Bone Miner Res 13: 1290-1299.
182. Fujii T, Kitaura H, Kimura K, Hakami ZW, Takano-Yamamoto T (2012) IL-4 inhibits
TNF-alpha-mediated osteoclast formation by inhibition of RANKL expression in TNF-
alpha-activated stromal cells and direct inhibition of TNF-alpha-activated osteoclast
precursors via a T-cell-independent mechanism in vivo. Bone 51: 771-780.
183. Owens JM, Gallagher AC, Chambers TJ (1996) IL-10 modulates formation of osteoclasts in
murine hemopoietic cultures. J Immunol 157: 936-940.
184. Ooi LL, Zheng Y, Stalgis-Bilinski K, Dunstan CR (2011) The bone remodeling
environment is a factor in breast cancer bone metastasis. Bone 48: 66-70.
185. Gillespie MT, Thomas RJ, Pu ZY, Zhou H, Martin TJ, et al. (1997) Calcitonin receptors,
bone sialoprotein and osteopontin are expressed in primary breast cancers. Int J Cancer
73: 812-815.
186. Littlewood-Evans AJ, Bilbe G, Bowler WB, Farley D, Wlodarski B, et al. (1997) The
osteoclast-associated protease cathepsin K is expressed in human breast carcinoma.
Cancer Res 57: 5386-5390.
187. Mundy GR (1997) Mechanisms of bone metastasis. Cancer 80: 1546-1556.
188. Pederson L, Winding B, Foged NT, Spelsberg TC, Oursler MJ (1999) Identification of
breast cancer cell line-derived paracrine factors that stimulate osteoclast activity. Cancer
Res 59: 5849-5855.
189. Henderson MA, Danks JA, Slavin JL, Byrnes GB, Choong PF, et al. (2006) Parathyroid
hormone-related protein localization in breast cancers predict improved prognosis.
Cancer Res 66: 2250-2256.
190. Arima Y, Matsueda S, Yano H, Harada M, Itoh K (2005) Parathyroid hormone-related
protein as a common target molecule in specific immunotherapy for a wide variety of
tumor types. Int J Oncol 27: 981-988.
191. Yao A, Harada M, Matsueda S, Ishihara Y, Shomura H, et al. (2005) New epitope peptides
derived from parathyroid hormone-related protein which have the capacity to induce

References
261
prostate cancer-reactive cytotoxic T lymphocytes in HLA-A2+ prostate cancer patients.
Prostate 62: 233-242.
192. Yin JJ, Selander K, Chirgwin JM, Dallas M, Grubbs BG, et al. (1999) TGF-beta signaling
blockade inhibits PTHrP secretion by breast cancer cells and bone metastases
development. J Clin Invest 103: 197-206.
193. Guise TA, Yin JJ, Taylor SD, Kumagai Y, Dallas M, et al. (1996) Evidence for a causal role
of parathyroid hormone-related protein in the pathogenesis of human breast cancer-
mediated osteolysis. J Clin Invest 98: 1544-1549.
194. Guise TA (1997) Parathyroid hormone-related protein and bone metastases. Cancer 80:
1572-1580.
195. Thomas RJ, Guise TA, Yin JJ, Elliott J, Horwood NJ, et al. (1999) Breast cancer cells
interact with osteoblasts to support osteoclast formation. Endocrinology 140: 4451-4458.
196. Horwood NJ, Elliott J, Martin TJ, Gillespie MT (1998) Osteotropic agents regulate the
expression of osteoclast differentiation factor and osteoprotegerin in osteoblastic stromal
cells. Endocrinology 139: 4743-4746.
197. Fuller K, Wong B, Fox S, Choi Y, Chambers TJ (1998) TRANCE is necessary and
sufficient for osteoblast-mediated activation of bone resorption in osteoclasts. J Exp Med
188: 997-1001.
198. Luo JL, Tan W, Ricono JM, Korchynskyi O, Zhang M, et al. (2007) Nuclear cytokine-
activated IKKalpha controls prostate cancer metastasis by repressing Maspin. Nature
446: 690-694.
199. Sellers RS, LeRoy BE, Blomme EA, Tannehill-Gregg S, Corn S, et al. (2004) Effects of
transforming growth factor-beta1 on parathyroid hormone-related protein mRNA
expression and protein secretion in canine prostate epithelial, stromal, and carcinoma
cells. Prostate 58: 366-373.
200. Serra R, Karaplis A, Sohn P (1999) Parathyroid hormone-related peptide (PTHrP)-
dependent and -independent effects of transforming growth factor beta (TGF-beta) on
endochondral bone formation. J Cell Biol 145: 783-794.
201. Chen YC, Sosnoski DM, Gandhi UH, Novinger LJ, Prabhu KS, et al. (2009) Selenium
modifies the osteoblast inflammatory stress response to bone metastatic breast cancer.
Carcinogenesis 30: 1941-1948.
202. Morgan H, Tumber A, Hill PA (2004) Breast cancer cells induce osteoclast formation by
stimulating host IL-11 production and downregulating granulocyte/macrophage colony-
stimulating factor. Int J Cancer 109: 653-660.
203. Ono K, Akatsu T, Murakami T, Kitamura R, Yamamoto M, et al. (2002) Involvement of
cyclo-oxygenase-2 in osteoclast formation and bone destruction in bone metastasis of
mammary carcinoma cell lines. J Bone Miner Res 17: 774-781.
204. de la Mata J, Uy HL, Guise TA, Story B, Boyce BF, et al. (1995) Interleukin-6 enhances
hypercalcemia and bone resorption mediated by parathyroid hormone-related protein in
vivo. J Clin Invest 95: 2846-2852.
205. Mutinga MJ (1975) Phlebotomus fauna in the cutaneous leishmaniasis focus of Mt. Elgon,
Kenya. East Afr Med J 52: 340-347.
206. Siclari VA, Guise TA, Chirgwin JM (2006) Molecular interactions between breast cancer
cells and the bone microenvironment drive skeletal metastases. Cancer Metastasis Rev
25: 621-633.

References
262
207. Hussein O, Tiedemann K, Komarova SV (2011) Breast cancer cells inhibit spontaneous and
bisphosphonate-induced osteoclast apoptosis. Bone 48: 202-211.
208. Hiraga T, Nakamura H (2009) Imatinib mesylate suppresses bone metastases of breast
cancer by inhibiting osteoclasts through the blockade of c-Fms signals. Int J Cancer 124:
215-222.
209. Body JJ, Facon T, Coleman RE, Lipton A, Geurs F, et al. (2006) A study of the biological
receptor activator of nuclear factor-kappaB ligand inhibitor, denosumab, in patients with
multiple myeloma or bone metastases from breast cancer. Clin Cancer Res 12: 1221-
1228.
210. Lipton A, Steger GG, Figueroa J, Alvarado C, Solal-Celigny P, et al. (2007) Randomized
active-controlled phase II study of denosumab efficacy and safety in patients with breast
cancer-related bone metastases. J Clin Oncol 25: 4431-4437.
211. Lipton A, Steger GG, Figueroa J, Alvarado C, Solal-Celigny P, et al. (2008) Extended
efficacy and safety of denosumab in breast cancer patients with bone metastases not
receiving prior bisphosphonate therapy. Clin Cancer Res 14: 6690-6696.
212. Rogers MJ (2004) From molds and macrophages to mevalonate: a decade of progress in
understanding the molecular mode of action of bisphosphonates. Calcif Tissue Int 75:
451-461.
213. Reinholz GG, Getz B, Sanders ES, Karpeisky MY, Padyukova N, et al. (2002) Distinct
mechanisms of bisphosphonate action between osteoblasts and breast cancer cells:
identity of a potent new bisphosphonate analogue. Breast Cancer Res Treat 71: 257-268.
214. Polascik TJ, Mouraviev V (2008) Zoledronic acid in the management of metastatic bone
disease. Ther Clin Risk Manag 4: 261-268.
215. Kimmel DB (2007) Mechanism of action, pharmacokinetic and pharmacodynamic profile,
and clinical applications of nitrogen-containing bisphosphonates. J Dent Res 86: 1022-
1033.
216. Bukowski JF, Dascher CC, Das H (2005) Alternative bisphosphonate targets and
mechanisms of action. Biochem Biophys Res Commun 328: 746-750.
217. Huang KC, Cheng CC, Chuang PY, Yang TY (2015) The effects of zoledronate on the
survival and function of human osteoblast-like cells. BMC Musculoskelet Disord 16:
355.
218. Thurnher M, Nussbaumer O, Gruenbacher G (2012) Novel aspects of mevalonate pathway
inhibitors as antitumor agents. Clin Cancer Res 18: 3524-3531.
219. Ilyas A, Hashim Z, Naeem N, Haneef K, Zarina S (2014) The effect of alendronate on
proteome of hepatocellular carcinoma cell lines. Int J Proteomics 2014: 532953.
220. Kischel P, Guillonneau F, Dumont B, Bellahcene A, Stresing V, et al. (2008) Cell
membrane proteomic analysis identifies proteins differentially expressed in osteotropic
human breast cancer cells. Neoplasia 10: 1014-1020.
221. Susa M, Morii T, Yabe H, Horiuchi K, Toyama Y, et al. (2009) Alendronate inhibits growth
of high-grade chondrosarcoma cells. Anticancer Res 29: 1879-1888.
222. Gupta S, Kim C, Yel L, Gollapudi S (2004) A role of fas-associated death domain (FADD)
in increased apoptosis in aged humans. J Clin Immunol 24: 24-29.
223. Carding SR, Egan PJ (2002) Gammadelta T cells: functional plasticity and heterogeneity.
Nat Rev Immunol 2: 336-345.
224. Kalyan S, Kabelitz D (2013) Defining the nature of human gammadelta T cells: a
biographical sketch of the highly empathetic. Cell Mol Immunol 10: 21-29.

References
263
225. Thompson K, Rojas-Navea J, Rogers MJ (2006) Alkylamines cause Vgamma9Vdelta2 T-
cell activation and proliferation by inhibiting the mevalonate pathway. Blood 107: 651-
654.
226. Girlanda S, Fortis C, Belloni D, Ferrero E, Ticozzi P, et al. (2005) MICA expressed by
multiple myeloma and monoclonal gammopathy of undetermined significance plasma
cells Costimulates pamidronate-activated gammadelta lymphocytes. Cancer Res 65:
7502-7508.
227. Rincon-Orozco B, Kunzmann V, Wrobel P, Kabelitz D, Steinle A, et al. (2005) Activation
of V gamma 9V delta 2 T cells by NKG2D. J Immunol 175: 2144-2151.
228. Cosman D, Mullberg J, Sutherland CL, Chin W, Armitage R, et al. (2001) ULBPs, novel
MHC class I-related molecules, bind to CMV glycoprotein UL16 and stimulate NK
cytotoxicity through the NKG2D receptor. Immunity 14: 123-133.
229. Lanca T, Correia DV, Moita CF, Raquel H, Neves-Costa A, et al. (2010) The MHC class Ib
protein ULBP1 is a nonredundant determinant of leukemia/lymphoma susceptibility to
gammadelta T-cell cytotoxicity. Blood 115: 2407-2411.
230. Kong Y, Cao W, Xi X, Ma C, Cui L, et al. (2009) The NKG2D ligand ULBP4 binds to
TCRgamma9/delta2 and induces cytotoxicity to tumor cells through both
TCRgammadelta and NKG2D. Blood 114: 310-317.
231. Qin G, Mao H, Zheng J, Sia SF, Liu Y, et al. (2009) Phosphoantigen-expanded human
gammadelta T cells display potent cytotoxicity against monocyte-derived macrophages
infected with human and avian influenza viruses. J Infect Dis 200: 858-865.
232. Dieli F, Troye-Blomberg M, Ivanyi J, Fournie JJ, Krensky AM, et al. (2001) Granulysin-
dependent killing of intracellular and extracellular Mycobacterium tuberculosis by
Vgamma9/Vdelta2 T lymphocytes. J Infect Dis 184: 1082-1085.
233. Bonneville M, O'Brien RL, Born WK (2010) Gammadelta T cell effector functions: a blend
of innate programming and acquired plasticity. Nat Rev Immunol 10: 467-478.
234. Chen ZW, Letvin NL (2003) Vgamma2Vdelta2+ T cells and anti-microbial immune
responses. Microbes Infect 5: 491-498.
235. O'Brien RL, Roark CL, Born WK (2009) IL-17-producing gammadelta T cells. Eur J
Immunol 39: 662-666.
236. Kabelitz D, Bender A, Schondelmaier S, Schoel B, Kaufmann SH (1990) A large fraction of
human peripheral blood gamma/delta + T cells is activated by Mycobacterium
tuberculosis but not by its 65-kD heat shock protein. J Exp Med 171: 667-679.
237. Meuter S, Eberl M, Moser B (2010) Prolonged antigen survival and cytosolic export in
cross-presenting human gammadelta T cells. Proc Natl Acad Sci U S A 107: 8730-8735.
238. Yuasa T, Sato K, Ashihara E, Takeuchi M, Maita S, et al. (2009) Intravesical administration
of gammadelta T cells successfully prevents the growth of bladder cancer in the murine
model. Cancer Immunol Immunother 58: 493-502.
239. Bryant NL, Suarez-Cuervo C, Gillespie GY, Markert JM, Nabors LB, et al. (2009)
Characterization and immunotherapeutic potential of gammadelta T-cells in patients with
glioblastoma. Neuro Oncol 11: 357-367.
240. Rey J, Veuillen C, Vey N, Bouabdallah R, Olive D (2009) Natural killer and gammadelta T
cells in haematological malignancies: enhancing the immune effectors. Trends Mol Med
15: 275-284.
241. Deniger DC, Moyes JS, Cooper LJ (2014) Clinical applications of gamma delta T cells with
multivalent immunity. Front Immunol 5: 636.
References
264
242. Van Acker HH, Anguille S, Van Tendeloo VF, Lion E (2015) Empowering gamma delta T
cells with antitumor immunity by dendritic cell-based immunotherapy. Oncoimmunology
4: e1021538.
243. Gomes AQ, Martins DS, Silva-Santos B (2010) Targeting gammadelta T lymphocytes for
cancer immunotherapy: from novel mechanistic insight to clinical application. Cancer
Res 70: 10024-10027.
244. Meraviglia S, Eberl M, Vermijlen D, Todaro M, Buccheri S, et al. (2010) In vivo
manipulation of Vgamma9Vdelta2 T cells with zoledronate and low-dose interleukin-2
for immunotherapy of advanced breast cancer patients. Clin Exp Immunol 161: 290-297.
245. Naoe M, Ogawa Y, Takeshita K, Morita J, Shichijo T, et al. (2010) Zoledronate stimulates
gamma delta T cells in prostate cancer patients. Oncol Res 18: 493-501.
246. Godder KT, Henslee-Downey PJ, Mehta J, Park BS, Chiang KY, et al. (2007) Long term
disease-free survival in acute leukemia patients recovering with increased gammadelta T
cells after partially mismatched related donor bone marrow transplantation. Bone Marrow
Transplant 39: 751-757.
247. Khan MW, Eberl M, Moser B (2014) Potential Use of gammadelta T Cell-Based Vaccines
in Cancer Immunotherapy. Front Immunol 5: 512.
248. Cuetara BL, Crotti TN, O'Donoghue AJ, McHugh KP (2006) Cloning and characterization
of osteoclast precursors from the RAW264.7 cell line. In Vitro Cell Dev Biol Anim 42:
182-188.
249. Gupta N, Barhanpurkar AP, Tomar GB, Srivastava RK, Kour S, et al. (2010) IL-3 inhibits
human osteoclastogenesis and bone resorption through downregulation of c-Fms and
diverts the cells to dendritic cell lineage. J Immunol 185: 2261-2272.
250. Shevchenko A, Wilm M, Vorm O, Mann M (1996) Mass spectrometric sequencing of
proteins silver-stained polyacrylamide gels. Anal Chem 68: 850-858.
251. Takayanagi H (2007) Interaction between the immune system and bone metabolism: an
emerging field of osteoimmunology. Proc Jpn Acad Ser B Phys Biol Sci 83: 136-143.
252. Terpos E, Dimopoulos MA (2011) Interaction between the skeletal and immune systems in
cancer: mechanisms and clinical implications. Cancer Immunol Immunother 60: 305-317.
253. Gillespie MT (2007) Impact of cytokines and T lymphocytes upon osteoclast differentiation
and function. Arthritis Res Ther 9: 103.
254. Kuzuyama T (2002) Mevalonate and nonmevalonate pathways for the biosynthesis of
isoprene units. Biosci Biotechnol Biochem 66: 1619-1627.
255. Lange BM, Rujan T, Martin W, Croteau R (2000) Isoprenoid biosynthesis: the evolution of
two ancient and distinct pathways across genomes. Proc Natl Acad Sci U S A 97: 13172-
13177.
256. Benzaid I, Monkkonen H, Stresing V, Bonnelye E, Green J, et al. (2011) High
phosphoantigen levels in bisphosphonate-treated human breast tumors promote
Vgamma9Vdelta2 T-cell chemotaxis and cytotoxicity in vivo. Cancer Res 71: 4562-4572.
257. Ross FP, Teitelbaum SL (2005) alphavbeta3 and macrophage colony-stimulating factor:
partners in osteoclast biology. Immunol Rev 208: 88-105.
258. Mizukami J, Takaesu G, Akatsuka H, Sakurai H, Ninomiya-Tsuji J, et al. (2002) Receptor
activator of NF-kappaB ligand (RANKL) activates TAK1 mitogen-activated protein
kinase kinase kinase through a signaling complex containing RANK, TAB2, and TRAF6.
Mol Cell Biol 22: 992-1000.

References
265
259. Adams LM, Warburton MJ, Hayman AR (2007) Human breast cancer cell lines and tissues
express tartrate-resistant acid phosphatase (TRAP). Cell Biol Int 31: 191-195.
260. Lopez-Alemany R, Suelves M, Munoz-Canoves P (2003) Plasmin generation dependent on
alpha-enolase-type plasminogen receptor is required for myogenesis. Thromb Haemost
90: 724-733.
261. Tseng HY, Chen LH, Ye Y, Tay KH, Jiang CC, et al. (2012) The melanoma-associated
antigen MAGE-D2 suppresses TRAIL receptor 2 and protects against TRAIL-induced
apoptosis in human melanoma cells. Carcinogenesis 33: 1871-1881.
262. Desouza M, Gunning PW, Stehn JR (2012) The actin cytoskeleton as a sensor and mediator
of apoptosis. Bioarchitecture 2: 75-87.
263. Cappello F, Conway de Macario E, Marasa L, Zummo G, Macario AJ (2008) Hsp60
expression, new locations, functions and perspectives for cancer diagnosis and therapy.
Cancer Biol Ther 7: 801-809.
264. Itoh H, Komatsuda A, Ohtani H, Wakui H, Imai H, et al. (2002) Mammalian HSP60 is
quickly sorted into the mitochondria under conditions of dehydration. Eur J Biochem
269: 5931-5938.
265. O'Brien RL, Fu YX, Cranfill R, Dallas A, Ellis C, et al. (1992) Heat shock protein Hsp60-
reactive gamma delta cells: a large, diversified T-lymphocyte subset with highly focused
specificity. Proc Natl Acad Sci U S A 89: 4348-4352.
266. Kaur I, Voss SD, Gupta RS, Schell K, Fisch P, et al. (1993) Human peripheral gamma delta
T cells recognize hsp60 molecules on Daudi Burkitt's lymphoma cells. J Immunol 150:
2046-2055.
267. Wadia P, Atre N, Pradhan T, Mistry R, Chiplunkar S (2005) Heat shock protein induced
TCR gammadelta gene rearrangements in patients with oral cancer. Oral Oncol 41: 175-
182.
268. Adamson P, Paterson HF, Hall A (1992) Intracellular localization of the P21rho proteins. J
Cell Biol 119: 617-627.
269. Wherlock M, Gampel A, Futter C, Mellor H (2004) Farnesyltransferase inhibitors disrupt
EGF receptor traffic through modulation of the RhoB GTPase. J Cell Sci 117: 3221-
3231.
270. Robertson D, Paterson HF, Adamson P, Hall A, Monaghan P (1995) Ultrastructural
localization of ras-related proteins using epitope-tagged plasmids. J Histochem Cytochem
43: 471-480.
271. Kurten RC, Cadena DL, Gill GN (1996) Enhanced degradation of EGF receptors by a
sorting nexin, SNX1. Science 272: 1008-1010.
272. Park HM, Cho HI, Shin CA, Shon HJ, Kim TG (2016) Zoledronic acid induces dose-
dependent increase of antigen-specific CD8 T-cell responses in combination with
peptide/poly-IC vaccine. Vaccine 34: 1275-1281.
273. Lambrinoudaki I, Vlachou S, Galapi F, Papadimitriou D, Papadias K (2008) Once-yearly
zoledronic acid in the prevention of osteoporotic bone fractures in postmenopausal
women. Clin Interv Aging 3: 445-451.
274. Berenson JR (2005) Recommendations for zoledronic acid treatment of patients with bone
metastases. Oncologist 10: 52-62.
275. Coleman R, Cameron D, Dodwell D, Bell R, Wilson C, et al. (2014) Adjuvant zoledronic
acid in patients with early breast cancer: final efficacy analysis of the AZURE (BIG
01/04) randomised open-label phase 3 trial. Lancet Oncol 15: 997-1006.

References
266
276. Coleman RE, Marshall H, Cameron D, Dodwell D, Burkinshaw R, et al. (2011) Breast-
cancer adjuvant therapy with zoledronic acid. N Engl J Med 365: 1396-1405.
277. Gnant M, Mlineritsch B, Stoeger H, Luschin-Ebengreuth G, Heck D, et al. (2011) Adjuvant
endocrine therapy plus zoledronic acid in premenopausal women with early-stage breast
cancer: 62-month follow-up from the ABCSG-12 randomised trial. Lancet Oncol 12:
631-641.
278. Gnant M, Mlineritsch B, Stoeger H, Luschin-Ebengreuth G, Knauer M, et al. (2015)
Zoledronic acid combined with adjuvant endocrine therapy of tamoxifen versus
anastrozol plus ovarian function suppression in premenopausal early breast cancer: final
analysis of the Austrian Breast and Colorectal Cancer Study Group Trial 12. Ann Oncol
26: 313-320.
279. Janeway CA Jr TP, Walport M, et al. (2001) Immunobiology: The Immune System in
Health and Disease. 5th edition.
280. Hendriks J, Gravestein LA, Tesselaar K, van Lier RA, Schumacher TN, et al. (2000) CD27
is required for generation and long-term maintenance of T cell immunity. Nat Immunol 1:
433-440.
281. Sallusto F, Geginat J, Lanzavecchia A (2004) Central memory and effector memory T cell
subsets: function, generation, and maintenance. Annu Rev Immunol 22: 745-763.
282. Mackay CR (1999) Dual personality of memory T cells. Nature 401: 659-660.
283. Lefrancois L, Marzo AL (2006) The descent of memory T-cell subsets. Nat Rev Immunol 6:
618-623.
284. Lopez RD (2002) Human gammadelta-T cells in adoptive immunotherapy of malignant and
infectious diseases. Immunol Res 26: 207-221.
285. Kabelitz D, Wesch D, Pitters E, Zoller M (2004) Potential of human gammadelta T
lymphocytes for immunotherapy of cancer. Int J Cancer 112: 727-732.
286. Di Mitri D, Azevedo RI, Henson SM, Libri V, Riddell NE, et al. (2011) Reversible
senescence in human CD4+CD45RA+CD27- memory T cells. J Immunol 187: 2093-
2100.
287. Chatila T, Silverman L, Miller R, Geha R (1989) Mechanisms of T cell activation by the
calcium ionophore ionomycin. J Immunol 143: 1283-1289.
288. Hashimoto S, Takahashi Y, Tomita Y, Hayama T, Sawada S, et al. (1991) Mechanism of
calcium ionophore and phorbol ester-induced T-cell activation. Accessory cell
requirement for T-cell activation. Scand J Immunol 33: 393-403.
289. Roodman GD (2010) Pathogenesis of myeloma bone disease. J Cell Biochem 109: 283-291.
290. Lee SK, Lorenzo J (2006) Cytokines regulating osteoclast formation and function. Curr
Opin Rheumatol 18: 411-418.
291. Cui Q, Shibata H, Oda A, Amou H, Nakano A, et al. (2011) Targeting myeloma-osteoclast
interaction with Vgamma9Vdelta2 T cells. Int J Hematol 94: 63-70.
292. Meliconi R, Pitzalis C, Kingsley GH, Panayi GS (1991) Gamma/delta T cells and their
subpopulations in blood and synovial fluid from rheumatoid arthritis and
spondyloarthritis. Clin Immunol Immunopathol 59: 165-172.
293. Bank I, Cohen L, Mouallem M, Farfel Z, Grossman E, et al. (2002) gammadelta T cell
subsets in patients with arthritis and chronic neutropenia. Ann Rheum Dis 61: 438-443.
294. Bodman-Smith MD, Anand A, Durand V, Youinou PY, Lydyard PM (2000) Decreased
expression of FcgammaRIII (CD16) by gammadelta T cells in patients with rheumatoid
arthritis. Immunology 99: 498-503.

References
267
295. Ono T, Okamoto K, Nakashima T, Nitta T, Hori S, et al. (2016) IL-17-producing
gammadelta T cells enhance bone regeneration. Nat Commun 7: 10928.
296. Colburn NT, Zaal KJ, Wang F, Tuan RS (2009) A role for gamma/delta T cells in a mouse
model of fracture healing. Arthritis Rheum 60: 1694-1703.
297. Ragab AA, Nalepka JL, Bi Y, Greenfield EM (2002) Cytokines synergistically induce
osteoclast differentiation: support by immortalized or normal calvarial cells. Am J
Physiol Cell Physiol 283: C679-687.
298. Wong PK, Quinn JM, Sims NA, van Nieuwenhuijze A, Campbell IK, et al. (2006)
Interleukin-6 modulates production of T lymphocyte-derived cytokines in antigen-
induced arthritis and drives inflammation-induced osteoclastogenesis. Arthritis Rheum
54: 158-168.
299. Kamolmatyakul S, Chen W, Li YP (2001) Interferon-gamma down-regulates gene
expression of cathepsin K in osteoclasts and inhibits osteoclast formation. J Dent Res 80:
351-355.
300. Takayanagi H, Sato K, Takaoka A, Taniguchi T (2005) Interplay between interferon and
other cytokine systems in bone metabolism. Immunol Rev 208: 181-193.
301. Haas W, Pereira P, Tonegawa S (1993) Gamma/delta cells. Annu Rev Immunol 11: 637-
685.
302. Wang L, Kamath A, Das H, Li L, Bukowski JF (2001) Antibacterial effect of human V
gamma 2V delta 2 T cells in vivo. J Clin Invest 108: 1349-1357.
303. Garcia VE, Sieling PA, Gong J, Barnes PF, Uyemura K, et al. (1997) Single-cell cytokine
analysis of gamma delta T cell responses to nonpeptide mycobacterial antigens. J
Immunol 159: 1328-1335.
304. Ziegler SF, Ramsdell F, Alderson MR (1994) The activation antigen CD69. Stem Cells 12:
456-465.
305. Rutella S, Rumi C, Lucia MB, Barberi T, Puggioni PL, et al. (1999) Induction of CD69
antigen on normal CD4+ and CD8+ lymphocyte subsets and its relationship with the
phenotype of responding T-cells. Cytometry 38: 95-101.
306. Li EC, Davis LE (2003) Zoledronic acid: a new parenteral bisphosphonate. Clin Ther 25:
2669-2708.
307. Lunt SY, Vander Heiden MG (2011) Aerobic glycolysis: meeting the metabolic
requirements of cell proliferation. Annu Rev Cell Dev Biol 27: 441-464.
308. Anitha A, Nakamura K, Thanseem I, Matsuzaki H, Miyachi T, et al. (2013) Downregulation
of the expression of mitochondrial electron transport complex genes in autism brains.
Brain Pathol 23: 294-302.
309. Fontanesi F, Soto IC, Barrientos A (2008) Cytochrome c oxidase biogenesis: new levels of
regulation. IUBMB Life 60: 557-568.
310. Mick DU, Fox TD, Rehling P (2011) Inventory control: cytochrome c oxidase assembly
regulates mitochondrial translation. Nat Rev Mol Cell Biol 12: 14-20.
311. Hakomori S (2003) Structure, organization, and function of glycosphingolipids in
membrane. Curr Opin Hematol 10: 16-24.
312. Tettamanti G, Bassi R, Viani P, Riboni L (2003) Salvage pathways in glycosphingolipid
metabolism. Biochimie 85: 423-437.
313. Kolter T, Sandhoff K (2010) Lysosomal degradation of membrane lipids. FEBS Lett 584:
1700-1712.
References
268
314. Conzelmann E, Burg J, Stephan G, Sandhoff K (1982) Complexing of glycolipids and their
transfer between membranes by the activator protein for degradation of lysosomal
ganglioside GM2. Eur J Biochem 123: 455-464.
315. Meier EM, Schwarzmann G, Furst W, Sandhoff K (1991) The human GM2 activator
protein. A substrate specific cofactor of beta-hexosaminidase A. J Biol Chem 266: 1879-
1887.
316. Werth N, Schuette CG, Wilkening G, Lemm T, Sandhoff K (2001) Degradation of
membrane-bound ganglioside GM2 by beta -hexosaminidase A. Stimulation by GM2
activator protein and lysosomal lipids. J Biol Chem 276: 12685-12690.
317. Gotte K, Girzalsky W, Linkert M, Baumgart E, Kammerer S, et al. (1998) Pex19p, a
farnesylated protein essential for peroxisome biogenesis. Mol Cell Biol 18: 616-628.
318. Matsuzono Y, Kinoshita N, Tamura S, Shimozawa N, Hamasaki M, et al. (1999) Human
PEX19: cDNA cloning by functional complementation, mutation analysis in a patient
with Zellweger syndrome, and potential role in peroxisomal membrane assembly. Proc
Natl Acad Sci U S A 96: 2116-2121.
319. Sacksteder KA, Jones JM, South ST, Li X, Liu Y, et al. (2000) PEX19 binds multiple
peroxisomal membrane proteins, is predominantly cytoplasmic, and is required for
peroxisome membrane synthesis. J Cell Biol 148: 931-944.
320. Hettema EH, Girzalsky W, van Den Berg M, Erdmann R, Distel B (2000) Saccharomyces
cerevisiae pex3p and pex19p are required for proper localization and stability of
peroxisomal membrane proteins. EMBO J 19: 223-233.
321. Snyder WB, Koller A, Choy AJ, Subramani S (2000) The peroxin Pex19p interacts with
multiple, integral membrane proteins at the peroxisomal membrane. J Cell Biol 149:
1171-1178.
322. Rucktaschel R, Thoms S, Sidorovitch V, Halbach A, Pechlivanis M, et al. (2009)
Farnesylation of pex19p is required for its structural integrity and function in peroxisome
biogenesis. J Biol Chem 284: 20885-20896.
323. Snyder WB, Faber KN, Wenzel TJ, Koller A, Luers GH, et al. (1999) Pex19p interacts with
Pex3p and Pex10p and is essential for peroxisome biogenesis in Pichia pastoris. Mol Biol
Cell 10: 1745-1761.
324. Buhaescu I, Izzedine H (2007) Mevalonate pathway: a review of clinical and therapeutical
implications. Clin Biochem 40: 575-584.
325. Rogers MJ, Gordon S, Benford HL, Coxon FP, Luckman SP, et al. (2000) Cellular and
molecular mechanisms of action of bisphosphonates. Cancer 88: 2961-2978.
326. Khosravi-Far R, Solski PA, Clark GJ, Kinch MS, Der CJ (1995) Activation of Rac1, RhoA,
and mitogen-activated protein kinases is required for Ras transformation. Mol Cell Biol
15: 6443-6453.
327. Pruitt K, Der CJ (2001) Ras and Rho regulation of the cell cycle and oncogenesis. Cancer
Lett 171: 1-10.
328. Westwick JK, Lambert QT, Clark GJ, Symons M, Van Aelst L, et al. (1997) Rac regulation
of transformation, gene expression, and actin organization by multiple, PAK-independent
pathways. Mol Cell Biol 17: 1324-1335.
329. Whitehead IP, Abe K, Gorski JL, Der CJ (1998) CDC42 and FGD1 cause distinct signaling
and transforming activities. Mol Cell Biol 18: 4689-4697.
References
269
330. Bouzahzah B, Albanese C, Ahmed F, Pixley F, Lisanti MP, et al. (2001) Rho family
GTPases regulate mammary epithelium cell growth and metastasis through
distinguishable pathways. Mol Med 7: 816-830.
331. Jaffe AB, Hall A (2002) Rho GTPases in transformation and metastasis. Adv Cancer Res
84: 57-80.
332. Janda E, Lehmann K, Killisch I, Jechlinger M, Herzig M, et al. (2002) Ras and TGF[beta]
cooperatively regulate epithelial cell plasticity and metastasis: dissection of Ras signaling
pathways. J Cell Biol 156: 299-313.
333. Keely PJ, Westwick JK, Whitehead IP, Der CJ, Parise LV (1997) Cdc42 and Rac1 induce
integrin-mediated cell motility and invasiveness through PI(3)K. Nature 390: 632-636.
334. Liu A, Cerniglia GJ, Bernhard EJ, Prendergast GC (2001) RhoB is required to mediate
apoptosis in neoplastically transformed cells after DNA damage. Proc Natl Acad Sci U S
A 98: 6192-6197.
335. Du W, Lebowitz PF, Prendergast GC (1999) Cell growth inhibition by farnesyltransferase
inhibitors is mediated by gain of geranylgeranylated RhoB. Mol Cell Biol 19: 1831-1840.
336. Du W, Prendergast GC (1999) Geranylgeranylated RhoB mediates suppression of human
tumor cell growth by farnesyltransferase inhibitors. Cancer Res 59: 5492-5496.
337. Delarue FL, Taylor BS, Sebti SM (2001) Ras and RhoA suppress whereas RhoB enhances
cytokine-induced transcription of nitric oxide synthase-2 in human normal liver AKN-1
cells and lung cancer A-549 cells. Oncogene 20: 6531-6537.
338. Delarue FL, Adnane J, Joshi B, Blaskovich MA, Wang DA, et al. (2007)
Farnesyltransferase and geranylgeranyltransferase I inhibitors upregulate RhoB
expression by HDAC1 dissociation, HAT association and histone acetylation of the RhoB
promoter. Oncogene 26: 633-640.
339. Adnane J, Muro-Cacho C, Mathews L, Sebti SM, Munoz-Antonia T (2002) Suppression of
rho B expression in invasive carcinoma from head and neck cancer patients. Clin Cancer
Res 8: 2225-2232.
340. Forget MA, Desrosiers RR, Del M, Moumdjian R, Shedid D, et al. (2002) The expression of
rho proteins decreases with human brain tumor progression: potential tumor markers.
Clin Exp Metastasis 19: 9-15.
341. Mazieres J, Antonia T, Daste G, Muro-Cacho C, Berchery D, et al. (2004) Loss of RhoB
expression in human lung cancer progression. Clin Cancer Res 10: 2742-2750.
342. Jiang K, Sun J, Cheng J, Djeu JY, Wei S, et al. (2004) Akt mediates Ras downregulation of
RhoB, a suppressor of transformation, invasion, and metastasis. Mol Cell Biol 24: 5565-
5576.
343. Jiang K, Delarue FL, Sebti SM (2004) EGFR, ErbB2 and Ras but not Src suppress RhoB
expression while ectopic expression of RhoB antagonizes oncogene-mediated
transformation. Oncogene 23: 1136-1145.
344. Martinelli E, De Palma R, Orditura M, De Vita F, Ciardiello F (2009) Anti-epidermal
growth factor receptor monoclonal antibodies in cancer therapy. Clin Exp Immunol 158:
1-9.
345. Schneider MR, Wolf E (2009) The epidermal growth factor receptor ligands at a glance. J
Cell Physiol 218: 460-466.
346. McNiven MA, Cao H, Pitts KR, Yoon Y (2000) The dynamin family of mechanoenzymes:
pinching in new places. Trends Biochem Sci 25: 115-120.

References
270
347. Felder S, Miller K, Moehren G, Ullrich A, Schlessinger J, et al. (1990) Kinase activity
controls the sorting of the epidermal growth factor receptor within the multivesicular
body. Cell 61: 623-634.
348. Futter CE, Pearse A, Hewlett LJ, Hopkins CR (1996) Multivesicular endosomes containing
internalized EGF-EGF receptor complexes mature and then fuse directly with lysosomes.
J Cell Biol 132: 1011-1023.
349. Burke P, Schooler K, Wiley HS (2001) Regulation of epidermal growth factor receptor
signaling by endocytosis and intracellular trafficking. Mol Biol Cell 12: 1897-1910.
350. Yarden Y, Sliwkowski MX (2001) Untangling the ErbB signalling network. Nat Rev Mol
Cell Biol 2: 127-137.
351. Masuda H, Zhang D, Bartholomeusz C, Doihara H, Hortobagyi GN, et al. (2012) Role of
epidermal growth factor receptor in breast cancer. Breast Cancer Res Treat 136: 331-345.
352. Kirisits A, Pils D, Krainer M (2007) Epidermal growth factor receptor degradation: an
alternative view of oncogenic pathways. Int J Biochem Cell Biol 39: 2173-2182.
353. Elledge SJ (1996) Cell cycle checkpoints: preventing an identity crisis. Science 274: 1664-
1672.
354. Champeris Tsaniras S, Kanellakis N, Symeonidou IE, Nikolopoulou P, Lygerou Z, et al.
(2014) Licensing of DNA replication, cancer, pluripotency and differentiation: an
interlinked world? Semin Cell Dev Biol 30: 174-180.
355. Veltman DM, Insall RH (2010) WASP family proteins: their evolution and its physiological
implications. Mol Biol Cell 21: 2880-2893.
356. Veltman D (2014) Actin dynamics: cell migration takes a new turn with arpin. Curr Biol 24:
R31-33.
357. Kulms D, Dussmann H, Poppelmann B, Stander S, Schwarz A, et al. (2002) Apoptosis
induced by disruption of the actin cytoskeleton is mediated via activation of CD95
(Fas/APO-1). Cell Death Differ 9: 598-608.
358. White SR, Williams P, Wojcik KR, Sun S, Hiemstra PS, et al. (2001) Initiation of apoptosis
by actin cytoskeletal derangement in human airway epithelial cells. Am J Respir Cell Mol
Biol 24: 282-294.
359. Genesca M, Sola A, Hotter G (2006) Actin cytoskeleton derangement induces apoptosis in
renal ischemia/reperfusion. Apoptosis 11: 563-571.
360. Rao JY, Jin YS, Zheng Q, Cheng J, Tai J, et al. (1999) Alterations of the actin
polymerization status as an apoptotic morphological effector in HL-60 cells. J Cell
Biochem 75: 686-697.
361. Boldogh IR, Yang HC, Nowakowski WD, Karmon SL, Hays LG, et al. (2001) Arp2/3
complex and actin dynamics are required for actin-based mitochondrial motility in yeast.
Proc Natl Acad Sci U S A 98: 3162-3167.
362. Simon VR, Karmon SL, Pon LA (1997) Mitochondrial inheritance: cell cycle and actin
cable dependence of polarized mitochondrial movements in Saccharomyces cerevisiae.
Cell Motil Cytoskeleton 37: 199-210.
363. Suria H, Chau LA, Negrou E, Kelvin DJ, Madrenas J (1999) Cytoskeletal disruption
induces T cell apoptosis by a caspase-3 mediated mechanism. Life Sci 65: 2697-2707.
364. Yamazaki Y, Tsuruga M, Zhou D, Fujita Y, Shang X, et al. (2000) Cytoskeletal disruption
accelerates caspase-3 activation and alters the intracellular membrane reorganization in
DNA damage-induced apoptosis. Exp Cell Res 259: 64-78.

References
271
365. Krupanidhi S, Sreekumar A, Sanjeevi CB (2008) Copper & biological health. Indian J Med
Res 128: 448-461.
366. Li Y, Du J, Zhang P, Ding J (2010) Crystal structure of human copper homeostasis protein
CutC reveals a potential copper-binding site. J Struct Biol 169: 399-405.
367. Tanaka Y, Tsumoto K, Nakanishi T, Yasutake Y, Sakai N, et al. (2004) Structural
implications for heavy metal-induced reversible assembly and aggregation of a protein:
the case of Pyrococcus horikoshii CutA. FEBS Lett 556: 167-174.
368. Arnesano F, Banci L, Benvenuti M, Bertini I, Calderone V, et al. (2003) The evolutionarily
conserved trimeric structure of CutA1 proteins suggests a role in signal transduction. J
Biol Chem 278: 45999-46006.
369. Yang J, Li Q, Yang H, Yan L, Yang L, et al. (2008) Overexpression of human CUTA
isoform2 enhances the cytotoxicity of copper to HeLa cells. Acta Biochim Pol 55: 411-
415.
370. Kunjunni R, Sathianathan S, Behari M, Chattopadhyay P, Subbiah V (2016) Silencing of
Human CutC Gene (hCutC) Induces Apoptosis in HepG2 Cells. Biol Trace Elem Res
172: 120-126.
371. Gunther MR, Hanna PM, Mason RP, Cohen MS (1995) Hydroxyl radical formation from
cuprous ion and hydrogen peroxide: a spin-trapping study. Arch Biochem Biophys 316:
515-522.
372. White AR, Multhaup G, Maher F, Bellingham S, Camakaris J, et al. (1999) The Alzheimer's
disease amyloid precursor protein modulates copper-induced toxicity and oxidative stress
in primary neuronal cultures. J Neurosci 19: 9170-9179.
373. Liang Q, Zhou B (2007) Copper and manganese induce yeast apoptosis via different
pathways. Mol Biol Cell 18: 4741-4749.
374. Raikkonen J, Crockett JC, Rogers MJ, Monkkonen H, Auriola S, et al. (2009) Zoledronic
acid induces formation of a pro-apoptotic ATP analogue and isopentenyl pyrophosphate
in osteoclasts in vivo and in MCF-7 cells in vitro. Br J Pharmacol 157: 427-435.
375. Raikkonen J, Monkkonen H, Auriola S, Monkkonen J (2010) Mevalonate pathway
intermediates downregulate zoledronic acid-induced isopentenyl pyrophosphate and ATP
analog formation in human breast cancer cells. Biochem Pharmacol 79: 777-783.
376. Chen H, Xu C, Jin Q, Liu Z (2014) S100 protein family in human cancer. Am J Cancer Res
4: 89-115.
377. Sedaghat F, Notopoulos A (2008) S100 protein family and its application in clinical
practice. Hippokratia 12: 198-204.
378. Santamaria-Kisiel L, Rintala-Dempsey AC, Shaw GS (2006) Calcium-dependent and -
independent interactions of the S100 protein family. Biochem J 396: 201-214.
379. Paleja B, Anand A, Chaukar D, D'Cruz A, Chiplunkar S (2013) Decreased functional
response to Toll like receptor ligands in patients with oral cancer. Hum Immunol 74: 927-
936.
380. Pietschmann K, Beetz S, Welte S, Martens I, Gruen J, et al. (2009) Toll-like receptor
expression and function in subsets of human gammadelta T lymphocytes. Scand J
Immunol 70: 245-255.
381. Becker J, Craig EA (1994) Heat-shock proteins as molecular chaperones. Eur J Biochem
219: 11-23.
382. Campanella C, Bucchieri F, Merendino AM, Fucarino A, Burgio G, et al. (2012) The
odyssey of Hsp60 from tumor cells to other destinations includes plasma membrane-
References
272
associated stages and Golgi and exosomal protein-trafficking modalities. PLoS One 7:
e42008.
383. Merendino AM, Bucchieri F, Campanella C, Marciano V, Ribbene A, et al. (2010) Hsp60 is
actively secreted by human tumor cells. PLoS One 5: e9247.
384. Chen T, Guo J, Han C, Yang M, Cao X (2009) Heat shock protein 70, released from heat-
stressed tumor cells, initiates antitumor immunity by inducing tumor cell chemokine
production and activating dendritic cells via TLR4 pathway. J Immunol 182: 1449-1459.
385. Barreto A, Gonzalez JM, Kabingu E, Asea A, Fiorentino S (2003) Stress-induced release of
HSC70 from human tumors. Cell Immunol 222: 97-104.
386. Chang GC, Liu KJ, Hsieh CL, Hu TS, Charoenfuprasert S, et al. (2006) Identification of
alpha-enolase as an autoantigen in lung cancer: its overexpression is associated with
clinical outcomes. Clin Cancer Res 12: 5746-5754.
387. Wygrecka M, Marsh LM, Morty RE, Henneke I, Guenther A, et al. (2009) Enolase-1
promotes plasminogen-mediated recruitment of monocytes to the acutely inflamed lung.
Blood 113: 5588-5598.
388. Kondo M, Sakuta K, Noguchi A, Ariyoshi N, Sato K, et al. (2008) Zoledronate facilitates
large-scale ex vivo expansion of functional gammadelta T cells from cancer patients for
use in adoptive immunotherapy. Cytotherapy 10: 842-856.
389. Dieli F, Gebbia N, Poccia F, Caccamo N, Montesano C, et al. (2003) Induction of
gammadelta T-lymphocyte effector functions by bisphosphonate zoledronic acid in
cancer patients in vivo. Blood 102: 2310-2311.
390. Green DR, Droin N, Pinkoski M (2003) Activation-induced cell death in T cells. Immunol
Rev 193: 70-81.
391. Gioia C, Agrati C, Casetti R, Cairo C, Borsellino G, et al. (2002) Lack of CD27-CD45RA-
V gamma 9V delta 2+ T cell effectors in immunocompromised hosts and during active
pulmonary tuberculosis. J Immunol 168: 1484-1489.
392. Welton JL, Marti S, Mahdi MH, Boobier C, Barrett-Lee PJ, et al. (2013) gammadelta T
cells predict outcome in zoledronate-treated breast cancer patients. Oncologist 18: e22-
23.
393. Erika P Hamilton1 KKH, Amy C Hobeika2, Jeffrey Peppercorn3, Michael A Morse3, H
Kim Lyerly4, Kouros Owzar5, Gretchen Kimmick3, P Kelly Marcom3, Kimberly L
Blackwell3 (2015) Zoledronic acid induces an immune response through increased
central memory and effector memory gamma/delta T cells in early and metastatic breast
cancer patients. Clinical communication-oncology 2: 1.
394. Poli A, Michel T, Theresine M, Andres E, Hentges F, et al. (2009) CD56bright natural killer
(NK) cells: an important NK cell subset. Immunology 126: 458-465.
395. Zamai L, Ponti C, Mirandola P, Gobbi G, Papa S, et al. (2007) NK cells and cancer. J
Immunol 178: 4011-4016.
396. Munz C, Steinman RM, Fujii S (2005) Dendritic cell maturation by innate lymphocytes:
coordinated stimulation of innate and adaptive immunity. J Exp Med 202: 203-207.
397. Yang Q, Goding SR, Hokland ME, Basse PH (2006) Antitumor activity of NK cells.
Immunol Res 36: 13-25.
398. Dahlberg CI, Sarhan D, Chrobok M, Duru AD, Alici E (2015) Natural Killer Cell-Based
Therapies Targeting Cancer: Possible Strategies to Gain and Sustain Anti-Tumor
Activity. Front Immunol 6: 605.
References
273
399. Maniar A, Zhang X, Lin W, Gastman BR, Pauza CD, et al. (2010) Human gammadelta T
lymphocytes induce robust NK cell-mediated antitumor cytotoxicity through CD137
engagement. Blood 116: 1726-1733.
400. Brandes M, Willimann K, Moser B (2005) Professional antigen-presentation function by
human gammadelta T Cells. Science 309: 264-268.
401. Himoudi N, Morgenstern DA, Yan M, Vernay B, Saraiva L, et al. (2012) Human
gammadelta T lymphocytes are licensed for professional antigen presentation by
interaction with opsonized target cells. J Immunol 188: 1708-1716.
402. Brandes M, Willimann K, Bioley G, Levy N, Eberl M, et al. (2009) Cross-presenting human
gammadelta T cells induce robust CD8+ alphabeta T cell responses. Proc Natl Acad Sci
U S A 106: 2307-2312.
403. Schmidt M, Bohm D, von Torne C, Steiner E, Puhl A, et al. (2008) The humoral immune
system has a key prognostic impact in node-negative breast cancer. Cancer Res 68: 5405-
5413.
404. Fowler DW, Copier J, Dalgleish AG, Bodman-Smith MD (2014) Zoledronic acid causes
gammadelta T cells to target monocytes and down-modulate inflammatory homing.
Immunology 143: 539-549.
405. Shang B, Liu Y, Jiang SJ (2015) Prognostic value of tumor-infiltrating FoxP3+ regulatory T
cells in cancers: a systematic review and meta-analysis. Sci Rep 5: 15179.
406. Abo-Elenein A, Elgohary SE, Hashish A, El-Halaby E (2008) Significance of
immunoregulatory T cells in different stages of breast cancer patients. Egypt J Immunol
15: 145-152.
407. Okita R, Saeki T, Takashima S, Yamaguchi Y, Toge T (2005) CD4+CD25+ regulatory T
cells in the peripheral blood of patients with breast cancer and non-small cell lung cancer.
Oncol Rep 14: 1269-1273.
408. Wolf AM, Wolf D, Steurer M, Gastl G, Gunsilius E, et al. (2003) Increase of regulatory T
cells in the peripheral blood of cancer patients. Clin Cancer Res 9: 606-612.
409. Castella B, Riganti C, Fiore F, Pantaleoni F, Canepari ME, et al. (2011) Immune
modulation by zoledronic acid in human myeloma: an advantageous cross-talk between
Vgamma9Vdelta2 T cells, alphabeta CD8+ T cells, regulatory T cells, and dendritic cells.
J Immunol 187: 1578-1590.
410. Boyman O, Sprent J (2012) The role of interleukin-2 during homeostasis and activation of
the immune system. Nat Rev Immunol 12: 180-190.
411. Toka FN, Kenney MA, Golde WT (2011) Rapid and transient activation of gammadelta T
cells to IFN-gamma production, NK cell-like killing, and antigen processing during acute
virus infection. J Immunol 186: 4853-4861.
412. Anderson DM, Maraskovsky E, Billingsley WL, Dougall WC, Tometsko ME, et al. (1997)
A homologue of the TNF receptor and its ligand enhance T-cell growth and dendritic-cell
function. Nature 390: 175-179.
413. Pappalardo A, Thompson K (2013) Activated gammadelta T cells inhibit osteoclast
differentiation and resorptive activity in vitro. Clin Exp Immunol 174: 281-291.
414. Kanamaru F, Iwai H, Ikeda T, Nakajima A, Ishikawa I, et al. (2004) Expression of
membrane-bound and soluble receptor activator of NF-kappaB ligand (RANKL) in
human T cells. Immunol Lett 94: 239-246.

References
274
415. Wong BR, Rho J, Arron J, Robinson E, Orlinick J, et al. (1997) TRANCE is a novel ligand
of the tumor necrosis factor receptor family that activates c-Jun N-terminal kinase in T
cells. J Biol Chem 272: 25190-25194.
416. Phalke S CS (2015) Activation status of γδ T cells dictates their effect on osteoclast
generation and bone resorption. Bone Reports 1: 8.
417. Schroder K, Hertzog PJ, Ravasi T, Hume DA (2004) Interferon-gamma: an overview of
signals, mechanisms and functions. J Leukoc Biol 75: 163-189.
418. Yi JS, Cox MA, Zajac AJ (2010) T-cell exhaustion: characteristics, causes and conversion.
Immunology 129: 474-481.
419. Guo Y, Xu F, Lu T, Duan Z, Zhang Z (2012) Interleukin-6 signaling pathway in targeted
therapy for cancer. Cancer Treat Rev 38: 904-910.

Publications
275
Publications

Activation status ofγδ T cells dictates their effect on osteoclast generationand bone resorption
Swati P. Phalke, Shubhada V. Chiplunkar ⁎Chiplunkar Laboratory, Advanced Centre for Treatment, Research and Education in Cancer (ACTREC), Tata Memorial Centre, Navi Mumbai, India
a b s t r a c ta r t i c l e i n f o
Article history:Received 20 June 2015Received in revised form 20 September 2015Accepted 14 October 2015Available online 23 October 2015
Keywords:γδ T cellsActivation statusPhosphoantigenCytokinesOsteoclasts
γδ T cells, a small subset of T cell population (5–10%), forms a bridge between innate and adaptive immunity. Al-though the role of γδ T cells in infectious diseases and antitumor immunity iswell investigated, their role in bonebiology needs to be explored. Aminobisphosphonates are used as a standard treatmentmodality for bone relateddisorders and are potent activators of γδ T cells. In the present study, we have compared the effect of “activated”and “freshly isolated” γδ T cells on osteoclast generation and function. We have shown that “activated” (αCD3/CD28 + rhIL2 or BrHPP + rhIL2 stimulated) γδ T cells inhibit osteoclastogenesis, while “freshly isolated” γδ Tcells enhance osteoclast generation and function. Upon stimulation with phosphoantigen (BrHPP), “freshly iso-lated” γδ T cells were also able to suppress osteoclast generation and function. Cytokine profiles of these cells re-vealed that, “freshly isolated” γδ T cells secrete higher amounts of IL6 (pro-osteoclastogenic), while “activated”γδ T cells secrete high IFNγ levels (anti-osteoclastogenic). Neutralization of IFNγ and IL6 reversed the “inhibito-ry” or “stimulatory” effect of γδ T cells on osteoclastogenesis. In conclusion,we have shown that, activation statusand dynamics of IL6 and IFNγ secretion dictate pro and anti-osteoclastogenic role of γδ T cells.
© 2015 The Authors. Published by Elsevier Inc. This is an open access article under the CC BY-NC-ND license(http://creativecommons.org/licenses/by-nc-nd/4.0/).
1. Introduction
γδ T cells represent a unique subset of immune cells accounting for5–10% of total T cell population in peripheral blood of humans. γδ Tcells are unique as compared to αβ T cells due to their T-cell receptor(TCR) gene usage, tissue tropism and MHC independent antigen recog-nition (Chiplunkar et al., 2009; Hayday, 2000). Major subtype of γδ Tcells in human peripheral blood express Vγ9Vδ2 TCR (also called asVγ2Vδ2) and are typically of Th1 type secreting copious amount ofIFNγ upon stimulation (Caccamo et al., 2013; Beetz et al., 2007). Similarto αβ T cells, γδ T cells exhibit plasticity and can differentiate into Th2(Wesch et al., 2001; Sireci et al., 1997), Th17 (Ness-Schwickerathet al., 2010; Caccamo et al., 2011), Tfh (Caccamo et al., 2013) and T
regulatory (Casetti et al., 2009) type. γδ T cells play an important rolein antitumor cytotoxicity (Konigshofer and Chien, 2006; Kabelitz et al.,2013), wound healing and tissue repair (Sharp et al., 2005; Jamesonet al., 2005; Havran et al., 2005). These cells express natural killer recep-tors (Born et al., 2006; Hayday, 2009) and recognize stressed/tumourcells expressing MICA/B and ULBPs (Wu et al., 2014). γδ T cells are in-creased in bacterial, viral and parasitic infections (Born et al., 2006). An-titumor ability of γδ T cells against solid tumours and leukaemia's hasbeen widely reported (Wrobel et al., 2007; Todaro et al., 2009; Gomeset al., 2010; Gertner-Dardenne et al., 2012; Dhar and Chiplunkar,2010; Thomas et al., 2000; Laad et al., 1999). A unique set of antigensrecognized by γδ T cells include intermediate products of eukaryoticmevalonate pathway (isopentenyl pyrophosphate or its synthetic ana-logue bromohydrin pyrophosphate) and bacterial Rohmer pathway(HMBPP [(E)-4-hydroxy-3-methyl-but-2-enylpyrophosphate]). Plantderived alkylamines and aminobisphosphonates are also known toactivate γδ T cells (Born et al., 2006). Aminobisphosphonates and anti-RANKL therapies are used to treat patients with bone metastasis toreduce the skeletal complications and tumour burden (Lipton andGoessl, 2011; Roodman and Dougall, 2008; Lee et al., 2011a;Neville-Webbe and Coleman, 2010). The meta-analysis done to analysethe safety and efficacy of Vγ9Vδ2 based immunotherapy has shown im-proved overall survival in patients compared to conventional therapies(Buccheri et al., 2014).
Though bone appears to be static in nature, it is a dynamic structurewhich undergoes continuous remodelling. The process of bone
Bone Reports 3 (2015) 95–103
Abbreviations: PBMCs, peripheral bloodmononuclear cells; FH, Ficoll-Hypaque; RPMI,Roswell Park Memorial Institute medium; BrHPP, bromohydrin pyrophosphate; OPCs,osteoclast precursor cells; TRAP, tartarate resistant acid phosphatase; rhIL2, recombinanthuman interleukin 2; IL6, interleukin 6; IFNγ, interferon gamma; αIL6, anti-interleukin6;αIFNγ, anti-interferon gamma; rhMCSF, recombinant humanmacrophage-colony stim-ulating factor; rhRANKL, recombinant human receptor activator of nuclear factor kappa-Bligand; cαMEM, completeminimumessential mediumwith alphamodification; FCS, Fetalcalf serum; PBS, phosphate buffered saline; CBA, cytometric bead array; OAAS, osteoclastactivity assay substrate; MACS, magnetic-activated cell sorting; MFI, mean fluorescent in-tensity; SEM, standard error of mean.⁎ Corresponding author at: Chiplunkar Laboratory, Advanced Centre for Treatment,
Research and Education in Cancer (ACTREC), Tata Memorial Centre, Kharghar, NaviMumbai 410210, India.
E-mail address: [email protected] (S.V. Chiplunkar).
http://dx.doi.org/10.1016/j.bonr.2015.10.0042352-1872/© 2015 The Authors. Published by Elsevier Inc. This is an open access article under the CC BY-NC-ND license (http://creativecommons.org/licenses/by-nc-nd/4.0/).
Contents lists available at ScienceDirect
Bone Reports
j ourna l homepage: www.e lsev ie r .com/ locate /bonr

remodelling is under the tight control of osteoblasts and osteoclasts.Osteoblasts are derived from mesenchymal cells, secrete bone matrixproteins and promote mineralization. Osteoclasts are large multinucle-ated cells generated by fusion of monocyte-macrophage precursorcells (Soysa et al., 2012) and are known to decalcify and degrade thebone by secreting the lysosomal proteases (Teitelbaum, 2007). In nor-mal conditions, osteoclasts and osteoblastswork in coordinatedmannerto maintain normal bone physiology, while their imbalance results inpathological conditions, such as osteoporosis, rheumatoid arthritis(RA), Paget's disease and osteopetrosis. Immune system and skeletalsystem are influenced by a number of common cytokines, chemokines,signalling molecules and transcription factors (Takayanagi, 2007). Acti-vated T lymphocytes support osteoclastogenesis through production ofIL6 (Kurihara et al., 1990), IL17 (Sato et al., 2006), RANKL (Horwoodet al., 1999; Weitzmann et al., 2001; Takayanagi et al., 2000) andTNFα (Lam et al., 2000). Inflamed synovial joints of rheumatoid arthriticpatients showed presence of γδ T cells (Keystone et al., 1991), thoughγδ T cells were not recognized as major contributors of arthritic bonedestruction (Pollinger et al., 2011). It was recently demonstrated thatactivated γδ T cells inhibit osteoclast differentiation and their resorptivefunction hence have important implications in understandingpathogenesis of rheumatoid arthritis (Pappalardo and Thompson,2013). In disease free breast cancer patients, a single dose ofaminobisphosphonate (zoledronic acid) induces a long lasting activa-tion of effector subsets of γδ T cells (Santini et al., 2009). These studiesindicate that activation status of γδ T cells is responsible for theirantiosteoclastogenic activity. The objective of the present study was tohave a comparative analysis of “activated” and “freshly isolated” γδ Tcells with respect to their effect on generation and function of osteo-clasts. Our results demonstrate that “activated” γδ T cells inhibit gener-ation and resorptive ability of osteoclasts, while “freshly isolated” γδ Tcells promote osteoclast formation and function.
2. Materials and methods
2.1. Study group
Peripheral blood from healthy volunteers (age, 25–45 years) wascollected in heparin containing vacutainers. The present study was ap-proved by the Institutional Ethics Committee and informed consentswere taken from the healthy volunteers before collecting the bloodsample.
2.2. Expansion and isolation of γδ T cells
γδ T cells were either directly isolated from peripheral blood mono-nuclear cells (PBMCs) or from ex-vivo expanded PBMC cultures. Briefly,PBMCs were separated from heparinised peripheral blood of healthyindividuals by Ficoll-Hypaque (Sigma-Aldrich, USA) density gradientcentrifugation. PBMCs (5 × 10⁶), resuspended in 5 ml cRPMI (10%heat-inactivated human AB serum, 2 mM glutamine, and antibiotics)were stimulated for 12 days with rhIL-2 (30 IU/ml) in 25 mm2 tissueculture flasks precoated with αCD3 (1 μg) + αCD28 (1 μg), withintermediate feedings with rhIL2. These cells were subcultured after6 days. On the 12th day, cultures were terminated and γδ T cells wereimmunomagnetically separated (positive selection) by using γδ-TCRMACS kit (magnetic activated cell sorting, Milteney Biotech, Germany)as per the kit instructions. On the 12th day, 13 ± 2.5 × 10⁶ γδ T cellswere obtained from αCD3/CD28 expanded PBMCs (150 ± 40 × 106).“Freshly isolated” γδ T cells were obtained from PBMCs without expan-sion. About 3.8± 1.6 × 10⁶ γδ T cells were isolated directly from PBMCs(130±52× 106) byMACS purification. The purity of theMACS separat-ed γδ T cells (FITC labelled)was analysed by flow cytometry and rangedfrom 95 to 98%. The γδ T cells were rested overnight in medium beforeusing them for further experiments. γδ T cells purified from αCD3/CD28 + rhIL2 expanded PBMCs are termed as “activated” γδ T cells,
while γδ T cells isolated directly from PBMCs are referred as “freshlyisolated” γδ T cells.
2.3. Flow cytometry
Expression of CD69, CD25 and RANKL was analysed on “activated”and “freshly isolated” γδ T cells. To analyse expression of CD69, CD25and RANKL on “activated” γδ T cells, PBMCs (1 × 10⁶/ml) were culturedin cRPMI supplemented with either rhIL2 (30 IU/ml) alone, BrHPP(200 nM) + rhIL2 or αCD3/CD28 (1 μg) + rhIL2 for 12 days in 24well plate at 37 °C in 5% CO2 incubator. BrHPP is a synthetic analogueof isopentenyl pyrophosphate (Espinosa et al., 2001) and is used as an-tigen for γδ T cells. The cells were fed with rhIL2 every 3rd day andsubcultured on the 6th day. PBMCs without any stimulation (Day0) were kept as control. On termination of culture on the 12th day, ex-panded PBMCs were collected, washed in cold 1× PBS (4 °C) and resus-pended in cold FACS buffer (1× PBS, 2% FCS, 0.01% sodium azide) as1 × 106 PBMCs/50 μl. These PBMCs were then stained for markers likeγδ-TCR-APC (BD Pharmingen, USA), CD25-PECy7 (BD Pharmingen,USA), CD69-FITC (BD Pharmingen, USA), RANKL-PE (Biolegend, USA)at 4 °C for 30 min in dark, followed by fixing in 1% paraformaldehydeat 4 °C for 15 min in dark. For “freshly isolated” γδ T cells (directly sep-arated from PBMCs on Day 0), purified γδ T cells were rested overnightand then were stimulated either with rhIL2 (0.5 IU) alone, αCD3/CD28(1 μg) + rhIL2, BrHPP (200 nM) + rhIL2 or left unstimulated (control)for 24 h at 37 °C in 5% CO2 incubator. 50,000 events were acquired on aFACS Aria (Becton Dickinson, USA) flow cytometer and data wasanalysed using FlowJo Software (Version 10, Tree Star, USA). For theabove experiments, lymphocytes were gated on the basis of their for-ward and side scatter. Further γδ T cells were gated on the basis of thefluorescence intensity versus forward scatter and expression of CD69,CD25 and RANKL was analysed on the gated γδ T cell population.
2.4. Cytometric bead array
“Activated” (separated from αCD3/CD28 expanded PBMCs) and“freshly isolated” γδ T cells (5 × 10⁴), resuspended in cRPMI (200 μl),were stimulated with rhIL2 (0.5 IU) alone or BrHPP (200 nM) + rhIL2(0.5 IU), in round bottom 96 well plate (Nunc) for 24 h at 37 °C in 5%CO2 incubator. The experimental groups were as represented below(Groups 1 to 4).
After 24 h, cells free supernatants from Groups 1–4 were collectedand were stored at−80 °C. As experimental controls, cell free superna-tantswere collected from “activated” and “freshly isolated” γδ T cells in-cubated in medium only (unstimulated) for 24 h. Th1/Th2/Th17cytokines (IL2, IL4, IL6, IL10, TNFα, IFNγ and IL17A) in these superna-tants were analysed using cytometric bead array kit (BD Biosciences)as per the kit instructions. In brief, 50 μl test samples and PE detectionantibody were incubated with capture bead reagent for 3 h at roomtemperature in dark, followed by washing with wash buffer. Sampleswere acquired on BD FACS Aria cytometer (BD Bioscience, San Jose,CA, USA) and data was analyzed using FCAP Array software version1.0 (BD Biosciences).
2.5. Generation of human osteoclasts
Human osteoclasts were generated from CD14+ cells (monocytes)in the presence of rhMCSF and rhRANKL (Gupta et al., 2010). In brief,
96 S.P. Phalke, S.V. Chiplunkar / Bone Reports 3 (2015) 95–103
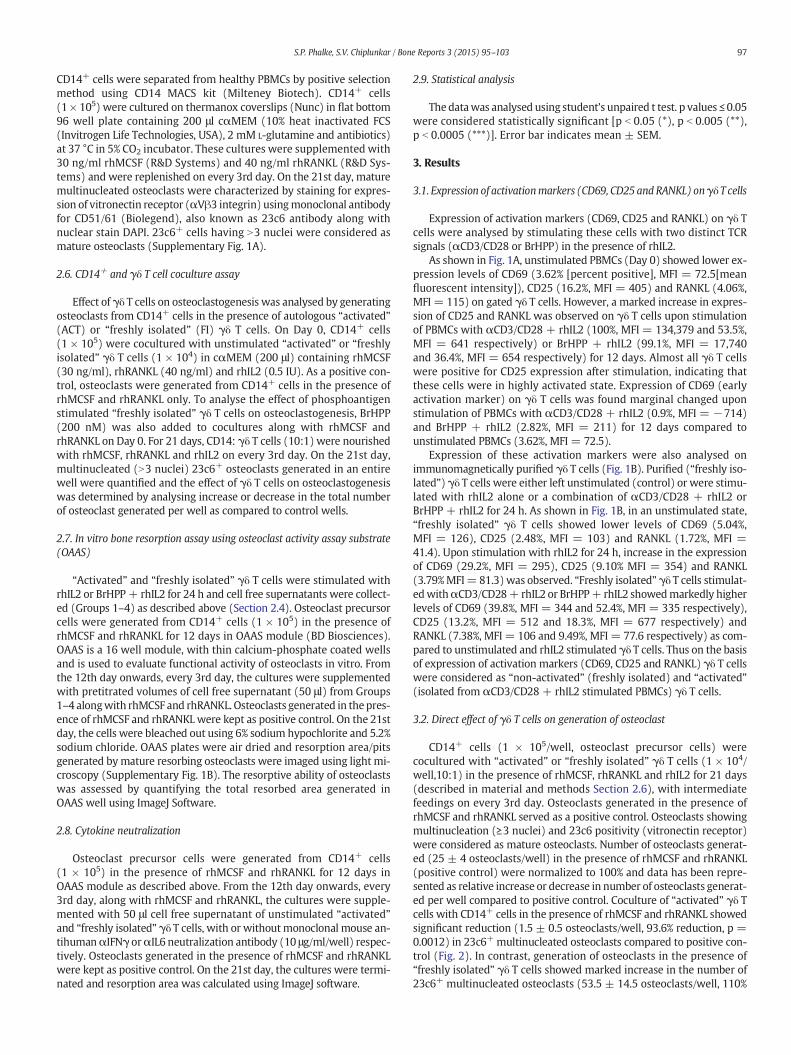
CD14+ cells were separated from healthy PBMCs by positive selectionmethod using CD14 MACS kit (Milteney Biotech). CD14+ cells(1 × 10⁵) were cultured on thermanox coverslips (Nunc) in flat bottom96 well plate containing 200 μl cαMEM (10% heat inactivated FCS(Invitrogen Life Technologies, USA), 2 mM L-glutamine and antibiotics)at 37 °C in 5% CO2 incubator. These cultures were supplemented with30 ng/ml rhMCSF (R&D Systems) and 40 ng/ml rhRANKL (R&D Sys-tems) and were replenished on every 3rd day. On the 21st day, maturemultinucleated osteoclasts were characterized by staining for expres-sion of vitronectin receptor (αVβ3 integrin) usingmonoclonal antibodyfor CD51/61 (Biolegend), also known as 23c6 antibody along withnuclear stain DAPI. 23c6+ cells having N3 nuclei were considered asmature osteoclasts (Supplementary Fig. 1A).
2.6. CD14+ and γδ T cell coculture assay
Effect of γδ T cells on osteoclastogenesis was analysed by generatingosteoclasts from CD14+ cells in the presence of autologous “activated”(ACT) or “freshly isolated” (FI) γδ T cells. On Day 0, CD14+ cells(1 × 10⁵) were cocultured with unstimulated “activated” or “freshlyisolated” γδ T cells (1 × 10⁴) in cαMEM (200 μl) containing rhMCSF(30 ng/ml), rhRANKL (40 ng/ml) and rhIL2 (0.5 IU). As a positive con-trol, osteoclasts were generated from CD14+ cells in the presence ofrhMCSF and rhRANKL only. To analyse the effect of phosphoantigenstimulated “freshly isolated” γδ T cells on osteoclastogenesis, BrHPP(200 nM) was also added to cocultures along with rhMCSF andrhRANKL on Day 0. For 21 days, CD14: γδ T cells (10:1) were nourishedwith rhMCSF, rhRANKL and rhIL2 on every 3rd day. On the 21st day,multinucleated (N3 nuclei) 23c6+ osteoclasts generated in an entirewell were quantified and the effect of γδ T cells on osteoclastogenesiswas determined by analysing increase or decrease in the total numberof osteoclast generated per well as compared to control wells.
2.7. In vitro bone resorption assay using osteoclast activity assay substrate(OAAS)
“Activated” and “freshly isolated” γδ T cells were stimulated withrhIL2 or BrHPP+ rhIL2 for 24 h and cell free supernatants were collect-ed (Groups 1–4) as described above (Section 2.4). Osteoclast precursorcells were generated from CD14+ cells (1 × 10⁵) in the presence ofrhMCSF and rhRANKL for 12 days in OAAS module (BD Biosciences).OAAS is a 16 well module, with thin calcium-phosphate coated wellsand is used to evaluate functional activity of osteoclasts in vitro. Fromthe 12th day onwards, every 3rd day, the cultures were supplementedwith pretitrated volumes of cell free supernatant (50 μl) from Groups1–4 alongwith rhMCSF and rhRANKL. Osteoclasts generated in thepres-ence of rhMCSF and rhRANKL were kept as positive control. On the 21stday, the cells were bleached out using 6% sodium hypochlorite and 5.2%sodium chloride. OAAS plates were air dried and resorption area/pitsgenerated bymature resorbing osteoclasts were imaged using light mi-croscopy (Supplementary Fig. 1B). The resorptive ability of osteoclastswas assessed by quantifying the total resorbed area generated inOAAS well using ImageJ Software.
2.8. Cytokine neutralization
Osteoclast precursor cells were generated from CD14+ cells(1 × 10⁵) in the presence of rhMCSF and rhRANKL for 12 days inOAAS module as described above. From the 12th day onwards, every3rd day, along with rhMCSF and rhRANKL, the cultures were supple-mented with 50 μl cell free supernatant of unstimulated “activated”and “freshly isolated” γδ T cells, with or withoutmonoclonal mouse an-tihumanαIFNγ orαIL6 neutralization antibody (10 μg/ml/well) respec-tively. Osteoclasts generated in the presence of rhMCSF and rhRANKLwere kept as positive control. On the 21st day, the cultures were termi-nated and resorption area was calculated using ImageJ software.
2.9. Statistical analysis
Thedatawas analysed using student's unpaired t test. p values ≤ 0.05were considered statistically significant [p b 0.05 (*), p b 0.005 (**),p b 0.0005 (***)]. Error bar indicates mean ± SEM.
3. Results
3.1. Expression of activationmarkers (CD69, CD25 and RANKL) onγδ T cells
Expression of activation markers (CD69, CD25 and RANKL) on γδ Tcells were analysed by stimulating these cells with two distinct TCRsignals (αCD3/CD28 or BrHPP) in the presence of rhIL2.
As shown in Fig. 1A, unstimulated PBMCs (Day 0) showed lower ex-pression levels of CD69 (3.62% [percent positive], MFI = 72.5[meanfluorescent intensity]), CD25 (16.2%, MFI = 405) and RANKL (4.06%,MFI = 115) on gated γδ T cells. However, a marked increase in expres-sion of CD25 and RANKL was observed on γδ T cells upon stimulationof PBMCs with αCD3/CD28 + rhIL2 (100%, MFI = 134,379 and 53.5%,MFI = 641 respectively) or BrHPP + rhIL2 (99.1%, MFI = 17,740and 36.4%, MFI = 654 respectively) for 12 days. Almost all γδ T cellswere positive for CD25 expression after stimulation, indicating thatthese cells were in highly activated state. Expression of CD69 (earlyactivation marker) on γδ T cells was found marginal changed uponstimulation of PBMCs with αCD3/CD28 + rhIL2 (0.9%, MFI = −714)and BrHPP + rhIL2 (2.82%, MFI = 211) for 12 days compared tounstimulated PBMCs (3.62%, MFI = 72.5).
Expression of these activation markers were also analysed onimmunomagnetically purified γδ T cells (Fig. 1B). Purified (“freshly iso-lated”) γδ T cells were either left unstimulated (control) or were stimu-lated with rhIL2 alone or a combination of αCD3/CD28 + rhIL2 orBrHPP + rhIL2 for 24 h. As shown in Fig. 1B, in an unstimulated state,“freshly isolated” γδ T cells showed lower levels of CD69 (5.04%,MFI = 126), CD25 (2.48%, MFI = 103) and RANKL (1.72%, MFI =41.4). Upon stimulation with rhIL2 for 24 h, increase in the expressionof CD69 (29.2%, MFI = 295), CD25 (9.10% MFI = 354) and RANKL(3.79%MFI= 81.3)was observed. “Freshly isolated” γδ T cells stimulat-edwithαCD3/CD28+ rhIL2 or BrHPP+ rhIL2 showedmarkedly higherlevels of CD69 (39.8%, MFI = 344 and 52.4%, MFI = 335 respectively),CD25 (13.2%, MFI = 512 and 18.3%, MFI = 677 respectively) andRANKL (7.38%, MFI = 106 and 9.49%, MFI = 77.6 respectively) as com-pared to unstimulated and rhIL2 stimulated γδ T cells. Thus on the basisof expression of activation markers (CD69, CD25 and RANKL) γδ T cellswere considered as “non-activated” (freshly isolated) and “activated”(isolated from αCD3/CD28 + rhIL2 stimulated PBMCs) γδ T cells.
3.2. Direct effect of γδ T cells on generation of osteoclast
CD14+ cells (1 × 10⁵/well, osteoclast precursor cells) werecocultured with “activated” or “freshly isolated” γδ T cells (1 × 10⁴/well,10:1) in the presence of rhMCSF, rhRANKL and rhIL2 for 21 days(described in material and methods Section 2.6), with intermediatefeedings on every 3rd day. Osteoclasts generated in the presence ofrhMCSF and rhRANKL served as a positive control. Osteoclasts showingmultinucleation (≥3 nuclei) and 23c6 positivity (vitronectin receptor)were considered as mature osteoclasts. Number of osteoclasts generat-ed (25 ± 4 osteoclasts/well) in the presence of rhMCSF and rhRANKL(positive control) were normalized to 100% and data has been repre-sented as relative increase or decrease in number of osteoclasts generat-ed per well compared to positive control. Coculture of “activated” γδ Tcells with CD14+ cells in the presence of rhMCSF and rhRANKL showedsignificant reduction (1.5 ± 0.5 osteoclasts/well, 93.6% reduction, p =0.0012) in 23c6+ multinucleated osteoclasts compared to positive con-trol (Fig. 2). In contrast, generation of osteoclasts in the presence of“freshly isolated” γδ T cells showed marked increase in the number of23c6+ multinucleated osteoclasts (53.5 ± 14.5 osteoclasts/well, 110%
97S.P. Phalke, S.V. Chiplunkar / Bone Reports 3 (2015) 95–103

Fig. 1. Analysis of activation markers (CD69, CD25, and RANKL) on γδ T cells. A) Expression of activation markers (CD69, CD25, and RANKL) was analysed on γδ T cells in unstimulatedPBMCs (1 × 10⁶/ml/well) or PBMCs expanded with rhIL2 (30 IU/ml) alone, αCD3/CD28 (1 μg) + rhIL2 or BrHPP (200 nM) + rhIL2 for 12 days. After the 12th day, PBMCs were stainedusingγδ-APC, CD69-FITC, CD25-PeCy7, andRANKL-PE. Baseline expression of thesemakers onγδT cellswas analysed by staining unstimulated PBMCs (Day 0, control). The gating strategyusedwas as follows: Lymphocyteswere gated based on their forward and side scatter. Depending on thefluorescence intensity ofγδ-APC,γδ T cellswere gated. Further percentages ofγδTcells expressing CD69, CD25 and RANKLwere analysed on gatedγδ T cells. The gates have been set according to only cell controls for respective stimulation.B) Purifiedγδ T cells were alsostimulated with rhIL2 alone, αCD3/CD28 + rhIL2 or BrHPP + rhIL2 for 24 h or left unstimulated (medium alone) and were analysed for the expression of CD69, CD25 and RANKL. Thegating strategy used was as described above. (Three independent experiments were carried out and the representative figure is given.)
98 S.P. Phalke, S.V. Chiplunkar / Bone Reports 3 (2015) 95–103

increase, p= 0.0458). These results indicated that “activated” γδ T cellsinhibit osteoclastogenesis, while “freshly isolated” γδ T cells tend to in-crease the number of osteoclasts upon coculture. In order to confirmthis observation “freshly isolated” γδ T cells were cocultured withCD14+ cells in the presence of phosphoantigen BrHPP along withrhMCSF, rhRANKL and rhIL2. It was interesting to observe that genera-tion of osteoclasts in the presence of “freshly isolated” γδ T cells thatwere stimulatedwith BrHPP showed significant reduction (2.5±1.5 os-teoclasts/well, 88.8% reduction, p = 0.0078) in the total number of23c6+ osteoclasts, confirming that “activation status” of γδ T cells gov-ern their function to regulate osteoclastogenesis. CD14+ cells culturedin the presence of rhMCSF and rhRANKL in the presence of rhIL2(26.5 ± 3.5 osteoclasts/well) or BrHPP+ rhIL2 (28 ± 3 osteoclasts/well) showed osteoclast numbers that were comparable to that ob-served in positive control (25 ± 4 osteoclasts/well), indicating thatrhIL2 or BrHPP + rhIL2 had no effect on osteoclast generation.
3.3. Effect of soluble factors secreted by phosphoantigen stimulated γδ Tcells on function of osteoclasts
In order to investigate the indirect effect of γδ T cells on osteoclastfunction mediated through secretion of soluble factors uponphosphoantigenic stimuli, osteoclast precursor cells (OPCs, generatedon OAAS using rhMCSF and rhRANKL for 12 days) were cultured inthe presence of pretitrated volumes of cell free supernatants of “activat-ed” and “freshly isolated” γδ T cells, stimulated with rhIL2 orBrHPP + rhIL2 (Groups 1–4), along with rhMCSF and rhRANKL. Osteo-clasts cultured in the presence of rhMCSF and rhRANKL were kept aspositive control. Total resorbed area generated by resorbing osteoclasts
in OAASwellwas used as end pointmeasurement of assay. Total resorp-tion area generated per well by osteoclasts cultured in the presence ofrhMCSF and rhRANKL (positive control) was normalized to 100% anddata has been represented as relative increase or decrease in resorptionarea compared to positive control. As shown in Fig. 3, OPCs, supple-mented with supernatants of “activated” γδ T cells which were stimu-lated with rhIL2 alone (Group 1) or BrHPP + rhIL2 (Group 2) showed72% and 70.4% reduction (p = 0.0001 and p = 0.0011 respectively) inthe total resorbed area as compared to positive control. Similarly, effectof soluble factors secreted by “freshly isolated” γδ T cells which werestimulated with rhIL2 alone (Group 3) or BrHPP + rhIL2 (Group 4) onosteoclast function showed significant increase (184.1%, p = 0.002and 42.6%, p = 0.0192 respectively) in total resorbed area as comparedto positive control. The results clearly indicated that soluble factors se-creted by “activated” γδ T cells potentially suppress osteoclastmediatedbone resorption, whereas soluble factors secreted by “freshly isolated”γδ T cells increase bone resorption.
3.4. Cytokine profiling of supernatants of antigen activated γδ T cells
Cell free supernatants were collected from “activated” (ACT) and“freshly isolated” (FI) γδ T cells. The various groups are described inma-terials and methods, Section 2.4. “Activated” and “freshly isolated” γδ Tcells were either left unstimulated (mediumonly control) or were stim-ulated with rhIL2 alone (Group 1, Group 3), BrHPP + rhIL2 (Group 2,Group 4). Cell free supernatants of these cells were collected andanalysed for Th1/Th2/Th17 cytokines by CBA, as represented in Supple-mentary data, Table 1. Analysis of cell free supernatants of “activated”and “freshly isolated” γδ T cells in the unstimulated control group inter-estingly showed significant differences in levels of two cytokines- IL6(pro-osteoclastogenic) and IFNγ (anti-osteoclastogenic) compared toother cytokines (Supplementary data, Table 1). As shown in Fig. 4, in
Fig. 2. Effect of “activated” and “freshly isolated” γδ T cells on generation of osteoclasts.CD14+ cells (1 × 10⁵/well) were co-cultured with “activated” (ACT) or “freshly isolated”(FI) γδ T cells (1 × 10⁴) in cαMEM supplemented with rhMCSF (30 ng/ml), rhRANKL(40 ng/ml) and rhIL2 (0.5 IU/well) on thermanox coverslips (Nunc) in flat bottom 96well plate. Osteoclasts generated in the presence of rhMCSF and rhRANKL were kept aspositive control. “Freshly isolated” γδ T cells were stimulated with phosphoantigen bysupplementing the cultures with BrHPP (200 nM) along with rhMCSF, rhRANKL andrhIL2 on Day 0. The CD14+: γδ T cell cocultures were fed with rhMCSF, rhRANKL, rhIL2every 3rd day for 21 days. On the 21st day, osteoclasts were characterized by stainingthem for vitronectin receptor (anti-human-CD51/CD61-AF488) and total number ofosteoclasts (multinucleated 23c6+ cells) generated per well were quantitated. Numberof osteoclasts generated in the presence of rhMCSF and rhRANKL (positive control) werenormalized to 100% and data has been represented as relative increase or decreasein number of osteoclasts generated per well compared to positive control. Three indepen-dent experiments were carried out and the data is represented as mean ± SEM.[p b 0.05 (*), p b 0.005 (**), p b 0.0005 (***)].
Fig. 3. Effect of supernatants of γδ T cells on resorptive ability of osteoclasts. Osteoclastswere generated from CD14+ cells (1 × 10⁵/well) in the presence of rhMCSF (30 ng/ml)and rhRANKL (40 ng/ml) for 12 days on osteoclast activity assay substrate. Fromthe 12th day onwards, the cultures were fed with cell free supernatants of “activated”and “freshly isolated” γδ T cells, stimulated with rhIL2 (Group 1 and Group 3) orBrHPP + rhIL2 (Group 2 and Group 4) respectively, along with rhMCSF and rhRANKL onevery 3rd day. Osteoclasts generated in the presence of rhMCSF and rhRANKL were keptas positive control. The cultures were terminated on the 21st day and the area resorbedby mature osteoclasts was calculated using ImageJ software. Total resorption area gener-ated per well by osteoclasts cultured in the presence of rhMCSF and rhRANKL (positivecontrol) was normalized to 100% and data has been represented as relative increase ordecrease in resorption area compared to positive control. The data shown is mean ±SEM of three independent experiments. [p b 0.05 (*), p b 0.005 (**), p b 0.0005 (***)].
99S.P. Phalke, S.V. Chiplunkar / Bone Reports 3 (2015) 95–103
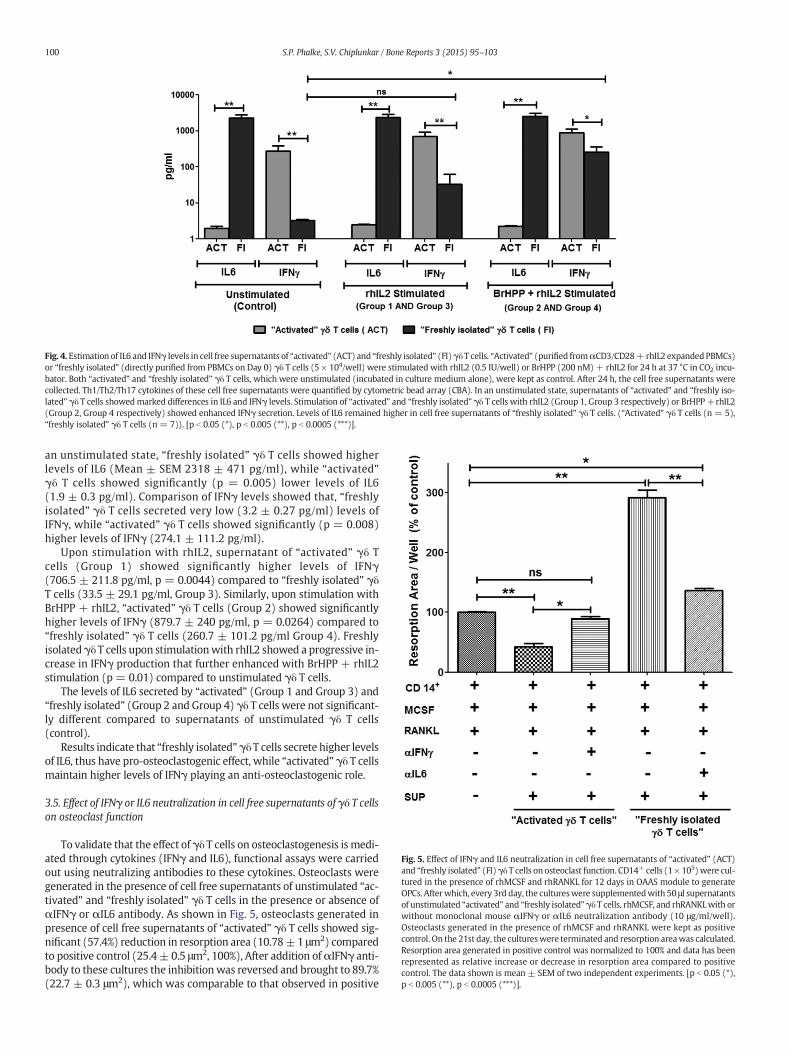
an unstimulated state, “freshly isolated” γδ T cells showed higherlevels of IL6 (Mean ± SEM 2318 ± 471 pg/ml), while “activated”γδ T cells showed significantly (p = 0.005) lower levels of IL6(1.9 ± 0.3 pg/ml). Comparison of IFNγ levels showed that, “freshlyisolated” γδ T cells secreted very low (3.2 ± 0.27 pg/ml) levels ofIFNγ, while “activated” γδ T cells showed significantly (p = 0.008)higher levels of IFNγ (274.1 ± 111.2 pg/ml).
Upon stimulation with rhIL2, supernatant of “activated” γδ Tcells (Group 1) showed significantly higher levels of IFNγ(706.5 ± 211.8 pg/ml, p = 0.0044) compared to “freshly isolated” γδT cells (33.5 ± 29.1 pg/ml, Group 3). Similarly, upon stimulation withBrHPP + rhIL2, “activated” γδ T cells (Group 2) showed significantlyhigher levels of IFNγ (879.7 ± 240 pg/ml, p = 0.0264) compared to“freshly isolated” γδ T cells (260.7 ± 101.2 pg/ml Group 4). Freshlyisolatedγδ T cells upon stimulationwith rhIL2 showed a progressive in-crease in IFNγ production that further enhanced with BrHPP + rhIL2stimulation (p = 0.01) compared to unstimulated γδ T cells.
The levels of IL6 secreted by “activated” (Group 1 and Group 3) and“freshly isolated” (Group 2 and Group 4) γδ T cells were not significant-ly different compared to supernatants of unstimulated γδ T cells(control).
Results indicate that “freshly isolated”γδ T cells secrete higher levelsof IL6, thus have pro-osteoclastogenic effect, while “activated” γδ T cellsmaintain higher levels of IFNγ playing an anti-osteoclastogenic role.
3.5. Effect of IFNγ or IL6 neutralization in cell free supernatants of γδ T cellson osteoclast function
To validate that the effect ofγδ T cells on osteoclastogenesis is medi-ated through cytokines (IFNγ and IL6), functional assays were carriedout using neutralizing antibodies to these cytokines. Osteoclasts weregenerated in the presence of cell free supernatants of unstimulated “ac-tivated” and “freshly isolated” γδ T cells in the presence or absence ofαIFNγ or αIL6 antibody. As shown in Fig. 5, osteoclasts generated inpresence of cell free supernatants of “activated” γδ T cells showed sig-nificant (57.4%) reduction in resorption area (10.78±1 μm2) comparedto positive control (25.4± 0.5 μm2, 100%), After addition ofαIFNγ anti-body to these cultures the inhibitionwas reversed and brought to 89.7%(22.7 ± 0.3 μm2), which was comparable to that observed in positive
Fig. 4. Estimation of IL6 and IFNγ levels in cell free supernatants of “activated” (ACT) and “freshly isolated” (FI)γδ T cells. “Activated” (purified fromαCD3/CD28+ rhIL2 expandedPBMCs)or “freshly isolated” (directly purified from PBMCs on Day 0) γδ T cells (5 × 10⁴/well) were stimulated with rhIL2 (0.5 IU/well) or BrHPP (200 nM) + rhIL2 for 24 h at 37 °C in CO2 incu-bator. Both “activated” and “freshly isolated” γδ T cells, which were unstimulated (incubated in culture medium alone), were kept as control. After 24 h, the cell free supernatants werecollected. Th1/Th2/Th17 cytokines of these cell free supernatants were quantified by cytometric bead array (CBA). In an unstimulated state, supernatants of “activated” and “freshly iso-lated” γδ T cells showedmarked differences in IL6 and IFNγ levels. Stimulation of “activated” and “freshly isolated” γδ T cells with rhIL2 (Group 1, Group 3 respectively) or BrHPP+rhIL2(Group 2, Group 4 respectively) showed enhanced IFNγ secretion. Levels of IL6 remained higher in cell free supernatants of “freshly isolated” γδ T cells. (“Activated” γδ T cells (n = 5),“freshly isolated” γδ T cells (n = 7)). [p b 0.05 (*), p b 0.005 (**), p b 0.0005 (***)].
Fig. 5. Effect of IFNγ and IL6 neutralization in cell free supernatants of “activated” (ACT)and “freshly isolated” (FI)γδ T cells on osteoclast function. CD14+ cells (1× 10⁵)were cul-tured in the presence of rhMCSF and rhRANKL for 12 days in OAAS module to generateOPCs. Afterwhich, every 3rd day, the cultureswere supplementedwith 50 μl supernatantsof unstimulated “activated” and “freshly isolated”γδ T cells, rhMCSF, and rhRANKLwith orwithout monoclonal mouse αIFNγ or αIL6 neutralization antibody (10 μg/ml/well).Osteoclasts generated in the presence of rhMCSF and rhRANKL were kept as positivecontrol. On the 21st day, the cultureswere terminated and resorption areawas calculated.Resorption area generated in positive control was normalized to 100% and data has beenrepresented as relative increase or decrease in resorption area compared to positivecontrol. The data shown is mean ± SEM of two independent experiments. [p b 0.05 (*),p b 0.005 (**), p b 0.0005 (***)].
100 S.P. Phalke, S.V. Chiplunkar / Bone Reports 3 (2015) 95–103

control, confirming our observation that IFNγ is amajor cytokine gener-ated by “activated” γδ T cells that inhibits osteoclastogenesis.
Similarly, osteoclasts generated in the presence of cell free superna-tants of “freshly isolated” γδ T cells showed increase in resorption areaby 191.9% (74.1± 1.6 μm2) over positive control (100%). Upon additionofαIL6 antibody to the cultures, therewas amarked reduction in the re-sorption area (34.5 ± 0.2 μm2, p = 0.0068) reducing from 191.9% to36.1% over positive control (100%).Our results suggests that the dynam-ics of IFNγ and IL6 play a major role in mediating the pro and anti-osteoclastogenic effects of “activated” γδ T cells and “freshly isolated”γδ T cells respectively.
4. Discussion
Bone is a common site of metastasis in breast cancer (Suva et al.,2009), prostate cancer andmultiplemyeloma (Roodman, 2010).Metas-tasized tumour cells disturb the bone metabolism by releasing factorswhich induce differentiation and activation of osteoclasts (Roodman,2001). It has also been reported that cytokines secreted by lymphocytespresent in the bone microenvironment affect bone metabolism(Gillespie, 2007). Investigations are focused on understanding how Tlymphocytes interact with osteoclasts and influence their function.Activated CD4+ T cells express RANKL and secrete cytokines such asIL1β, IL6, IL17, TNFα and RANKL that support osteoclastogenesis(Horwood et al., 1999; Kotake et al., 2001; Lee et al., 2011b; Konget al., 1999). Interestingly, it has also been reported that activated T lym-phocytes secrete cytokines such as IFNγ, IL4, IL10 andGMCSF that inhib-it osteoclastogenesis (Walsh et al., 2006; Sato and Takayanagi, 2006). Itis still not understood what dictates the pro and anti-osteoclastogenicbehaviour of the lymphocytes. Although the role of CD4+ αβ T cells inosteoclastogenesis has been investigated, the role of γδ T cells is notwell understood. In the present study, we have made an attempt toanalyze the effect of “activated” and “freshly isolated” γδ T cells on oste-oclast generation and function.
We used γδ T cells from two sources; those that were isolated di-rectly from PBMCs (“freshly isolated” γδ T cells) and those that wereisolated from PBMCs stimulated with αCD3/CD28 + rhIL2 (“activat-ed” γδ T cells). Coculture of “freshly isolated” γδ T cells with CD14+
cells enhanced the generation of osteoclasts and stimulated theirresorptive ability. On the contrary, “activated” γδ T cells showed inhib-itory effect on generation and function of osteoclasts. The process ofosteoclastogenesis is majorly influenced by cytokine milieu in themicroenvironment, where IL6, IL17, TNFα, TGFβ, IFNγ and RANKLplay indispensable role. Analysis of cell free supernatants of “freshlyisolated” γδ T cells at baseline levels (unstimulated) showed markeddifference in their IL6 and IFNγ levels. In an unstimulated state, “freshlyisolated” γδ T cellsweremajor producers of IL6, with negligible levels ofIFNγ. On the contrary, “activated” γδ T cells showed higher IFNγ levelswith low IL6 production.
IL6 is a potent pro-osteoclastogenic cytokine, with the capacity to in-duce osteoclastogenesis in RANKL independent manner (Kudo et al.,2003) and it also acts in synergistic manner with TNFα to induce osteo-clastogenesis (Ragab et al., 2002). IL6 has been reported to stimulateformation of osteoclast like multinucleated cells in long term culturesof human bone marrow through induction of IL1β (Kurihara et al.,1990). T lymphocytes from IL6/ mice have shown lesser production ofIL17 (pro-osteoclastogenic) and also affected RANKL/OPG productionby T lymphocytes (Wong et al., 2006). Cultures of osteoclasts frombonemarrow cells of IL6/ mice in the presence of MCSF and RANKL pro-duced ~50% lesser osteoclasts as compared to wild type mice (Wonget al., 2006). On the contrary, IFNγ has been appreciated for its protec-tive role in osteoclastogenesis by inhibiting osteoclast formation andbone resorption in vitro (Takayanagi et al., 2000; Kamolmatyakulet al., 2001). Mice lacking one of the components of IFNγ receptor(IFNγR1) showed enhanced osteoclastogenesis from bone marrow de-rived monocyte/macrophage precursor cells (BMMs) and bone loss
(Takayanagi et al., 2000). Also, IFNγ producing activated T cells showedosteoclast generation from BMMs in the absence of RANKL in IFNγR−/−
mice (Takayanagi et al., 2000). IFNγ either downregulates TRAF6(TNF receptor associated factor 6) expression or activates/enhancesubiquitin dependant proteosomal systems whose direct target isTRAF6 (Takayanagi et al., 2000; Takayanagi et al., 2005), which resultsin disruption of RANK–RANKL signalling.
In order to confirm that IL6 and IFNγ are the key cytokines involvedin the pro and anti-osteoclastogenic effects mediated by “freshly isolat-ed” and “activated” γδ T cells respectively, neutralization experimentwas carried out usingαIL6 andαIFNγ antibodies. Addition ofαIL6 anti-body to the supernatants of “freshly isolated” γδ T cells showed amarked reduction in the resorption area. However, the resorption arearemained marginally above that was observed with positive control(rhMCSF + rhRANKL). The data indicates that other cytokines likeTNFα and IL17 may also contribute to the pro-osteoclastogenic effect,which may be present in the supernatants after blocking IL6 (Supple-mentary Table 1). Similarly blocking of IFNγ significantly reversed(89.74%) the anti-osteoclastogenic effect, indicating that IFNγ is thedominant cytokine inhibiting osteoclastogenesis.
Human γδ T cells are Th1 type cells which produce copious amountsof IFNγ upon stimulation (Haas et al., 1993; Wang et al., 2001; Garciaet al., 1997). BrHPP, an analogue of IPP, known to be a potent antigenof γδ T cells was used to stimulate “freshly isolated” γδ T cells in thepresence of rhIL2. Upon stimulation with BrHPP + rhIL2, the activationmarkers (CD69, CD25 and RANKL) on these cells were found to be in-creased compared to unstimulated γδ T cells. CD69, an early activationmarker, is expressed on T cells upon triggering through TCR complex(Ziegler et al., 1994). T cell activation through CD69 results in upregula-tion of CD25 and induction of Th1 cytokine (IL2 and IFNγ), ultimatelytriggering proliferation of the lymphocytes (Rutella et al., 1999). Asexpected, higher levels of IFNγ along with increased expression ofactivation markers (CD25 and RANKL) were observed on “activated”γδ T cells (which were expanded using αCD3/CD28 + rhIL2), whileno significant change was observed in early activation marker CD69.“Freshly isolated” γδ T cells upon stimulation with BrHPP + rhIL2showed increase in IFNγ production, along with significant increase inearly activation markers like CD69 and RANKL. Compared to rhIL2stimulated, “freshly isolated” γδ T cells stimulated with BrHPP +rhIL2, irrespective of short or long term activation, showed inhibitoryeffect on generation (vitronectin receptor expression) and resorptiveability (resorption area on OAAS plates) of osteoclasts. Thus, “freshlyisolated” γδ T cells stimulated with phosphoantigen (BrHPP + rhIL2)exhibited the characteristics of “activated” γδ T cells to suppress osteo-clast generation and function.
To best of our knowledge, this is the first study to show that activa-tion status and the cytokines released by γδ T cells dictates their effecton osteoclastogenesis. Aminobisphosphonates, the new generationbisphosphonates, are used as standard treatment modality in patientswith breast cancer, prostate cancer and multiple myeloma patientsexhibiting skeletal metastasis (Dhar and Chiplunkar, 2010; Roodmanand Dougall, 2008). Aminobisphosphonates inhibit activity and survivalof osteoclasts (Caraglia et al., 2006). Besides their antitumor and anti-resorptive ability, aminobisphosphonate (Zoledronic acid) are potentactivators of γδ T cells. IL6, dominantly secreted by “freshly isolated”γδ T cells (low CD25, CD69 expression) promote osteoclastogenesis,while antigen (BrHPP) activated γδ T cells (high CD25, CD69 expres-sion) inhibit osteoclastogenesis through increased IFNγ production.This data adds a newdimension towards understanding themechanismof action of aminobisphosphonate in patients receiving this treatmentfor skeletal metastasis. Although antitumor and anti-resorptive rolesof aminobisphosphonates are reported, the present study furtherdemonstrates the crosstalk of immune cells and osteoclasts mediatedby aminobisphosphonates. Future immunotherapeutic approaches canutilize aminobisphosphonates activated γδ T cells for treatment ofskeletal metastasis.
101S.P. Phalke, S.V. Chiplunkar / Bone Reports 3 (2015) 95–103

5. Conclusion
Effect of γδ T cells on osteoclastogenesis depends on their activationstatus. Phosphoantigen “activated” γδ T cells express higher levels of ac-tivation markers (CD25 and RANKL expression) and secrete higherlevels of IFNγ (anti-osteoclastogenic), thus inhibiting osteoclast genera-tion and function. On the contrary, “freshly isolated” γδ T cells, in anunstimulated state (low CD25, CD69 and RANKL expression) secretehigher levels of IL6 (pro-osteoclastogenic) and enhance osteoclast gen-eration and function. “Freshly isolated” γδ T cells, when stimulatedwithphosphoantigen (BrHPP) showed increased IFNγ secretion and attainedanti-osteoclastogenic potential. Neutralization of IFNγ and IL6 usingblocking antibodies majorly diminished the “inhibitory” or “stimulato-ry” effect of “freshly isolated” and “activated” γδ T cells respectivelyon osteoclastogenesis. In conclusion, activation status and dynamics ofIL6/IFNγ dictates pro or anti-osteoclastogenic role of γδ T cells.
Supplementary data to this article can be found online at http://dx.doi.org/10.1016/j.bonr.2015.10.004.
Conflict of interest statement
The author (s) declare(s) that there is no conflict of interest.
Acknowledgements
The present studywas funded through the intramural funding of theTataMemorial Centre, India (Grant— “Seed in Air-2700”).We thank the“Department of Biotechnology, India” for providing fellowship to Ms.Swati P. Phalke.We are thankful to all the healthy volunteers for provid-ing blood samples for this study.
References
Beetz, S., Marischen, L., Kabelitz, D., Wesch, D., 2007. Human gamma delta T cells: candi-dates for the development of immunotherapeutic strategies. Immunol. Res. 37,97–111.
Born, W.K., Reardon, C.L., O'Brien, R.L., 2006. The function of gammadelta T cells in innateimmunity. Curr. Opin. Immunol. 18, 31–38.
Buccheri, S., Guggino, G., Caccamo, N., Li Donni, P., Dieli, F., 2014. Efficacy and safety ofgammadelta T cell-based tumor immunotherapy: a meta-analysis. J. Biol. Regul.Homeost. Agents 28, 81–90.
Caccamo, N., La Mendola, C., Orlando, V., Meraviglia, S., Todaro, M., Stassi, G., Sireci, G.,Fournie, J.J., Dieli, F., 2011. Differentiation, phenotype, and function of interleukin-17-producing human Vgamma9Vdelta2 T cells. Blood 118, 129–138.
Caccamo, N., Todaro, M., Sireci, G., Meraviglia, S., Stassi, G., Dieli, F., 2013. Mechanisms un-derlying lineage commitment and plasticity of human gammadelta T cells. Cell. Mol.Immunol. 10, 30–34.
Caraglia, M., Santini, D., Marra, M., Vincenzi, B., Tonini, G., Budillon, A., 2006. Emerginganti-cancer molecular mechanisms of aminobisphosphonates. Endocr. Relat. Cancer13, 7–26.
Casetti, R., Agrati, C., Wallace, M., Sacchi, A., Martini, F., Martino, A., Rinaldi, A., Malkovsky,M., 2009. Cutting edge: TGF-beta1 and IL-15 induce FOXP3+ gammadelta regulatoryT cells in the presence of antigen stimulation. J. Immunol. 183, 3574–3577.
Chiplunkar, S., Dhar, S., Wesch, D., Kabelitz, D., 2009. Gammadelta T cells in cancer immu-notherapy: current status and future prospects. Immunotherapy 1, 663–678.
Dhar, S., Chiplunkar, S.V., 2010. Lysis of aminobisphosphonate-sensitized MCF-7 breasttumor cells by Vgamma9Vdelta2 T cells. Cancer Immun. 10, 10.
Espinosa, E., Belmant, C., Pont, F., Luciani, B., Poupot, R., Romagne, F., Brailly, H., Bonneville,M., Fournie, J.J., 2001. Chemical synthesis and biological activity of bromohydrin py-rophosphate, a potent stimulator of human gamma delta T cells. J. Biol. Chem. 276,18337–18344.
Garcia, V.E., Sieling, P.A., Gong, J., Barnes, P.F., Uyemura, K., Tanaka, Y., Bloom, B.R., Morita,C.T., Modlin, R.L., 1997. Single-cell cytokine analysis of gamma delta T cell responsesto nonpeptide mycobacterial antigens. J. Immunol. 159, 1328–1335.
Gertner-Dardenne, J., Castellano, R., Mamessier, E., Garbit, S., Kochbati, E., Etienne, A.,Charbonnier, A., Collette, Y., Vey, N., Olive, D., 2012. Human Vgamma9Vdelta2 Tcells specifically recognize and kill acute myeloid leukemic blasts. J. Immunol. 188,4701–4708.
Gillespie, M.T., 2007. Impact of cytokines and T lymphocytes upon osteoclast differentia-tion and function. Arthritis Res. Ther. 9, 103.
Gomes, A.Q., Correia, D.V., Grosso, A.R., Lanca, T., Ferreira, C., Lacerda, J.F., Barata, J.T., Silva,M.G., Silva-Santos, B., 2010. Identification of a panel of ten cell surface protein anti-gens associated with immunotargeting of leukemias and lymphomas by peripheralblood gammadelta T cells. Haematologica 95, 1397–1404.
Gupta, N., Barhanpurkar, A.P., Tomar, G.B., Srivastava, R.K., Kour, S., Pote, S.T., Mishra, G.C.,Wani, M.R., 2010. IL-3 inhibits human osteoclastogenesis and bone resorption
through downregulation of c-Fms and diverts the cells to dendritic cell lineage.J. Immunol. 185, 2261–2272.
Haas, W., Pereira, P., Tonegawa, S., 1993. Gamma/delta cells. Annu. Rev. Immunol. 11,637–685.
Havran, W.L., Jameson, J.M., Witherden, D.A., 2005. Epithelial cells and their neighbors. III.Interactions between intraepithelial lymphocytes and neighboring epithelial cells.Am. J. Physiol. Gastrointest. Liver Physiol. 289, G627–G630.
Hayday, A.C., 2000. [Gamma][delta] cells: a right time and a right place for a conservedthird way of protection. Annu. Rev. Immunol. 18, 975–1026.
Hayday, A.C., 2009. Gammadelta T cells and the lymphoid stress-surveillance response.Immunity 31, 184–196.
Horwood, N.J., Kartsogiannis, V., Quinn, J.M., Romas, E., Martin, T.J., Gillespie, M.T., 1999.Activated T lymphocytes support osteoclast formation in vitro. Biochem. Biophys.Res. Commun. 265, 144–150.
Jameson, J.M., Cauvi, G., Sharp, L.L., Witherden, D.A., Havran, W.L., 2005. Gammadelta Tcell-induced hyaluronan production by epithelial cells regulates inflammation.J. Exp. Med. 201, 1269–1279.
Kabelitz, D., Kalyan, S., Oberg, H.H., Wesch, D., 2013. Human Vdelta2 versus non-Vdelta2gammadelta T cells in antitumor immunity. Oncoimmunology 2, e23304.
Kamolmatyakul, S., Chen, W., Li, Y.P., 2001. Interferon-gamma down-regulates gene ex-pression of cathepsin K in osteoclasts and inhibits osteoclast formation. J. Dent. Res.80, 351–355.
Keystone, E.C., Rittershaus, C., Wood, N., Snow, K.M., Flatow, J., Purvis, J.C., Poplonski, L.,Kung, P.C., 1991. Elevation of a gamma delta T cell subset in peripheral blood and sy-novial fluid of patients with rheumatoid arthritis. Clin. Exp. Immunol. 84, 78–82.
Kong, Y.Y., Feige, U., Sarosi, I., Bolon, B., Tafuri, A., Morony, S., Capparelli, C., Li, J., Elliott, R.,McCabe, S., Wong, T., Campagnuolo, G., Moran, E., Bogoch, E.R., Van, G., Nguyen, L.T.,Ohashi, P.S., Lacey, D.L., Fish, E., Boyle, W.J., Penninger, J.M., 1999. Activated T cellsregulate bone loss and joint destruction in adjuvant arthritis through osteoprotegerinligand. Nature 402, 304–309.
Konigshofer, Y., Chien, Y.H., 2006. Gammadelta T cells —innate immune lymphocytes?Curr. Opin. Immunol. 18, 527–533.
Kotake, S., Udagawa, N., Hakoda, M., Mogi, M., Yano, K., Tsuda, E., Takahashi, K., Furuya, T.,Ishiyama, S., Kim, K.J., Saito, S., Nishikawa, T., Takahashi, N., Togari, A., Tomatsu, T.,Suda, T., Kamatani, N., 2001. Activated human T cells directly induce osteoclastogen-esis from human monocytes: possible role of T cells in bone destruction in rheuma-toid arthritis patients. Arthritis Rheum. 44, 1003–1012.
Kudo, O., Sabokbar, A., Pocock, A., Itonaga, I., Fujikawa, Y., Athanasou, N.A., 2003.Interleukin-6 and interleukin-11 support human osteoclast formation by a RANKL-independent mechanism. Bone 32, 1–7.
Kurihara, N., Bertolini, D., Suda, T., Akiyama, Y., Roodman, G.D., 1990. IL-6 stimulatesosteoclast-like multinucleated cell formation in long term human marrow culturesby inducing IL-1 release. J. Immunol. 144, 4226–4230.
Laad, A.D., Thomas, M.L., Fakih, A.R., Chiplunkar, S.V., 1999. Human gamma delta T cellsrecognize heat shock protein-60 on oral tumor cells. Int. J. Cancer 80, 709–714.
Lam, J., Takeshita, S., Barker, J.E., Kanagawa, O., Ross, F.P., Teitelbaum, S.L., 2000. TNF-alphainduces osteoclastogenesis by direct stimulation of macrophages exposed to permis-sive levels of RANK ligand. J. Clin. Invest. 106, 1481–1488.
Lee, R.J., Saylor, P.J., Smith, M.R., 2011a. Treatment and prevention of bone complicationsfrom prostate cancer. Bone 48, 88–95.
Lee, S.J., Nam, K.I., Jin, H.M., Cho, Y.N., Lee, S.E., Kim, T.J., Lee, S.S., Kee, S.J., Lee, K.B., Kim, N.,Park, Y.W., 2011b. Bone destruction by receptor activator of nuclear factor kappaBligand-expressing T cells in chronic gouty arthritis. Arthritis Res. Ther. 13, R164.
Lipton, A., Goessl, C., 2011. Clinical development of anti-RANKL therapies for treatmentand prevention of bone metastasis. Bone 48, 96–99.
Ness-Schwickerath, K.J., Jin, C., Morita, C.T., 2010. Cytokine requirements for the differen-tiation and expansion of IL-17A- and IL-22-producing human Vgamma2Vdelta2 Tcells. J. Immunol. 184, 7268–7280.
Neville-Webbe, H.L., Coleman, R.E., 2010. Bisphosphonates and RANK ligand inhibitors forthe treatment and prevention of metastatic bone disease. Eur. J. Cancer 46,1211–1222.
Pappalardo, A., Thompson, K., 2013. Activated gammadelta T cells inhibit osteoclast differ-entiation and resorptive activity in vitro. Clin. Exp. Immunol. 174, 281–291.
Pollinger, B., Junt, T., Metzler, B., Walker, U.A., Tyndall, A., Allard, C., Bay, S., Keller, R., Raulf,F., Di Padova, F., O'Reilly, T., Horwood, N.J., Patel, D.D., Littlewood-Evans, A., 2011.Th17 cells, not IL-17+ gammadelta T cells, drive arthritic bone destruction in miceand humans. J. Immunol. 186, 2602–2612.
Ragab, A.A., Nalepka, J.L., Bi, Y., Greenfield, E.M., 2002. Cytokines synergistically induce os-teoclast differentiation: support by immortalized or normal calvarial cells. Am.J. Physiol. Cell Physiol. 283, C679–C687.
Roodman, G.D., 2001. Biology of osteoclast activation in cancer. J. Clin. Oncol. 19,3562–3571.
Roodman, G.D., 2010. Pathogenesis of myeloma bone disease. J. Cell. Biochem. 109,283–291.
Roodman, G.D., Dougall, W.C., 2008. RANK ligand as a therapeutic target for bone metas-tases and multiple myeloma. Cancer Treat. Rev. 34, 92–101.
Rutella, S., Rumi, C., Lucia, M.B., Barberi, T., Puggioni, P.L., Lai, M., Romano, A., Cauda, R.,Leone, G., 1999. Induction of CD69 antigen on normal CD4+ and CD8+ lymphocytesubsets and its relationship with the phenotype of responding T-cells. Cytometry38, 95–101.
Santini, D., Martini, F., Fratto, M.E., Galluzzo, S., Vincenzi, B., Agrati, C., Turchi, F., Piacentini,P., Rocci, L., Manavalan, J.S., Tonini, G., Poccia, F., 2009. In vivo effects of zoledronicacid on peripheral gammadelta T lymphocytes in early breast cancer patients. CancerImmunol. Immunother. 58, 31–38.
Sato, K., Takayanagi, H., 2006. Osteoclasts, rheumatoid arthritis, and osteoimmunology.Curr. Opin. Rheumatol. 18, 419–426.
102 S.P. Phalke, S.V. Chiplunkar / Bone Reports 3 (2015) 95–103

Sato, K., Suematsu, A., Okamoto, K., Yamaguchi, A., Morishita, Y., Kadono, Y., Tanaka, S.,Kodama, T., Akira, S., Iwakura, Y., Cua, D.J., Takayanagi, H., 2006. Th17 functions asan osteoclastogenic helper T cell subset that links T cell activation and bone destruc-tion. J. Exp. Med. 203, 2673–2682.
Sharp, L.L., Jameson, J.M., Cauvi, G., Havran, W.L., 2005. Dendritic epidermal T cells regu-late skin homeostasis through local production of insulin-like growth factor 1. Nat.Immunol. 6, 73–79.
Sireci, G., Champagne, E., Fournie, J.J., Dieli, F., Salerno, A., 1997. Patterns ofphosphoantigen stimulation of human Vgamma9/Vdelta2 T cell clones include Th0cytokines. Hum. Immunol. 58, 70–82.
Soysa, N.S., Alles, N., Aoki, K., Ohya, K., 2012. Osteoclast formation and differentiation: anoverview. J. Med. Dent. Sci. 59, 65–74.
Suva, L.J., Griffin, R.J., Makhoul, I., 2009. Mechanisms of bone metastases of breast cancer.Endocr. Relat. Cancer 16, 703–713.
Takayanagi, H., 2007. Osteoimmunology: shared mechanisms and crosstalk between theimmune and bone systems. Nat. Rev. Immunol. 7, 292–304.
Takayanagi, H., Ogasawara, K., Hida, S., Chiba, T., Murata, S., Sato, K., Takaoka, A., Yokochi,T., Oda, H., Tanaka, K., Nakamura, K., Taniguchi, T., 2000. T-cell-mediated regulation ofosteoclastogenesis by signalling cross-talk between RANKL and IFN-gamma. Nature408, 600–605.
Takayanagi, H., Sato, K., Takaoka, A., Taniguchi, T., 2005. Interplay between interferon andother cytokine systems in bone metabolism. Immunol. Rev. 208, 181–193.
Teitelbaum, S.L., 2007. Osteoclasts: what do they do and how do they do it? Am. J. Pathol.170, 427–435.
Thomas, M.L., Samant, U.C., Deshpande, R.K., Chiplunkar, S.V., 2000. Gammadelta T cellslyse autologous and allogenic oesophageal tumours: involvement of heat-shock pro-teins in the tumour cell lysis. Cancer Immunol. Immunother. 48, 653–659.
Todaro, M., D'Asaro, M., Caccamo, N., Iovino, F., Francipane, M.G., Meraviglia, S., Orlando,V., La Mendola, C., Gulotta, G., Salerno, A., Dieli, F., Stassi, G., 2009. Efficient killingof human colon cancer stem cells by gammadelta T lymphocytes. J. Immunol. 182,7287–7296.
Walsh, M.C., Kim, N., Kadono, Y., Rho, J., Lee, S.Y., Lorenzo, J., Choi, Y., 2006.Osteoimmunology: interplay between the immune system and bone metabolism.Annu. Rev. Immunol. 24, 33–63.
Wang, L., Kamath, A., Das, H., Li, L., Bukowski, J.F., 2001. Antibacterial effect of human Vgamma 2V delta 2 T cells in vivo. J. Clin. Invest. 108, 1349–1357.
Weitzmann, M.N., Cenci, S., Rifas, L., Haug, J., Dipersio, J., Pacifici, R., 2001. T cell activationinduces human osteoclast formation via receptor activator of nuclear factor kappaBligand-dependent and -independent mechanisms. J. Bone Miner. Res. 16, 328–337.
Wesch, D., Glatzel, A., Kabelitz, D., 2001. Differentiation of resting human peripheral bloodgamma delta T cells toward Th1- or Th2-phenotype. Cell. Immunol. 212, 110–117.
Wong, P.K., Quinn, J.M., Sims, N.A., van Nieuwenhuijze, A., Campbell, I.K., Wicks, I.P., 2006.Interleukin-6 modulates production of T lymphocyte-derived cytokines in antigen-induced arthritis and drives inflammation-induced osteoclastogenesis. ArthritisRheum. 54, 158–168.
Wrobel, P., Shojaei, H., Schittek, B., Gieseler, F., Wollenberg, B., Kalthoff, H., Kabelitz, D.,Wesch, D., 2007. Lysis of a broad range of epithelial tumour cells by human gammadelta T cells: involvement of NKG2D ligands and T-cell receptor- versus NKG2D-dependent recognition. Scand. J. Immunol. 66, 320–328.
Wu, Y.L., Ding, Y.P., Tanaka, Y., Shen, L.W., Wei, C.H., Minato, N., Zhang, W., 2014.Gammadelta T cells and their potential for immunotherapy. Int. J. Biol. Sci. 10,119–135.
Ziegler, S.F., Ramsdell, F., Alderson, M.R., 1994. The activation antigen CD69. Stem Cells 12,456–465.
103S.P. Phalke, S.V. Chiplunkar / Bone Reports 3 (2015) 95–103

Supplementary Table 1
Unstimulated
γδ T cells
IL2 stimulated
γδ T cells
BrHPP stimulated
γδ T cells
Cytokine
Concentration (pg/ml)
Cytokine
Concentration (pg/ml)
Cytokine
Concentration(pg/ml)
ACT
(n=5)
FI
(n=7)
P
value
ACT
(n=5)
FI
(n=7)
P
value
ACT
(n=5)
FI
(n=7)
P
value
IL2 2.7 ± 0.9 17.2 ± 9.4 ns 13.7 ± 3.4 680.2±412 ns 14.1 ± 5.0 366.9±330.4 ns
IL4 5.4 ± 0.8 2.6 ± 0.6 * 18.3 ± 5.4 3.1 ± 0.6 ** 20.2 ± 4.6 2.3 ± 0.7 ***
IL6 1.9 ± 0.3 2318±471 ** 2.4 ± 0.09 2375±537.8 ** 2.24 ± 0.07 2563±498.7 **
IL10 3.8 ± 0.6 10.6 ± 3.2 ns 3.3 ± 0.6 12.2 ± 4.5 ns 3.9 ± 0.5 12.3 ± 3.8 ns
TNFα 67.5 ± 37 205.7± 38.3 * 165.5±82 254.9±48.9 ns 188.1±90.9 547.1±104.9 *
IFNγ 274.1±111 3.2 ± 0.2 ** 706.5±211 33.5±29.21 ** 879.7±240 260.7±101.2 *
IL17 4.5 ± 4.1 2.0 ± 0.9 ns 0.3 ± 0.3 1.4 ± 0.5 ns 0.3 ± 0.3 1.4 ± 0.6 ns

Supplementary Figure 1


Cytokine Dynamics of γδ T Cells: A Double Edged Sword in OsteoclastogenesisSwati Phalke and Shubhada V. Chiplunkar*
Chiplunkar Laboratory, Advanced Centre for Treatment, Research and Education in Cancer (ACTREC), Tata Memorial Centre, Navi Mumbai, India*Corresponding author: Shubhada V. Chiplunkar, Chiplunkar Laboratory, Advanced Centre for Treatment, Research and Education in Cancer (ACTREC), TataMemorial Centre, Kharghar, Navi Mumbai – 410210, India, Tel: +91-022-27405075; Fax: +91-022-27405080; E-mail: [email protected]
Received date: June 28, 2016; Accepted date: September 28, 2016; Published date: October 05, 2016
Copyright: © 2016 Phalke S, et al. This is an open-access article distributed under the terms of the Creative Commons Attribution License, which permits unrestricteduse, distribution, and reproduction in any medium, provided the original author and source are credited.
Key wordsγδ T cells; Aminobisphosphonates; Cytokines; Osteoclastogenesis;
IL6; IFNγ
Short CommunicationBone remodelling is necessary to maintain mineral homeostasis and
structural integrity of bone. It is a continuous and highly coordinatedprocess, which is essentially carried out by osteoblasts (bone formingcells) and osteoclasts (bone resorbing cells) through release ofcytokines or soluble factors. Number of reports suggests that, tumorcells, immune cells and bone cells share cytokines, chemokines andsignalling molecules. Conventional T cells (αβ T cells) are known toenhance osteoclast generation and function through release of pro-osteoclastogenic factors like IL17 and RANKL. Although the presenceof γδ T cells in bone microenvironment has been reported, their role inbone biology is not well understood. Studies from our lab suggest that,depending on the activation status and cytokine dynamics, γδ T cellscan function in a pro or anti-osteoclastogenic manner. Activated γδ Tcells secrete higher levels of IFNγ (anti-osteoclastogenic cytokine) andinhibit the process of osteoclastogenesis, while non-activated γδ T cellsproduce increased levels of IL6 (anti-osteoclastogenic cytokine) andwere found to enhance osteoclast generation and function.Aminobisphosphonate Zoledronate has potent antiresorptive activityand is used for the treatment of postmenopausal osteoporosis andskeletal malignancies associated with metastatic cancer. Zoledronate isalso known be a potent activator of γδ T cells. Aminobisphosphonatesare embedded in bone due to their high affinity for calcium and getreleased in the bone microenvironment by resorbing osteoclasts. TheseAminobisphosphonates activate γδ T cells, which have antitumor andantiresorptive activity. The present review highlights the new roleplayed by aminobisphosphonates in cancer patients through activationof effector functions of γδ T cells and other immune cells, whichextends beyond their well-defined antiresorptive function.
Bone is a dynamic structure and is continuously remodelled. Tomaintain the quality of the bone, it is necessary to replace old /damaged bone with new bone and this process is carried out byosteoblasts and osteoclasts. Osteoblasts are bone forming cells, whichdifferentiate from mesenchymal stem cells, while osteoclasts are boneresorbing cells which are formed by fusion of monocyte-macrophageprecursor cells under the influence of macrophage colony stimulatingfactor (MCSF) and receptor activator of nuclear factor kappa B ligand(RANKL). MCSF is crucial for proliferation and survival ofmacrophages and osteoclast precursor cells [1] while RANKL isessential for differentiation of osteoclasts [2]. Osteoblasts andosteoclasts work in a tightly regulated manner to maintain the normalbone physiology, while imbalance results in pathological conditionssuch as osteopetrosis, osteoporosis, Paget’s diseases, rheumatoidarthritis (RA), periodontal disease [3,4]. The process of bone
remodelling is regulated by cytokines present in the bonemicroenvironment.
There is enough data suggesting that immune cells influence skeletalsystem through cytokines, chemokines, signalling molecules andsurface receptors [5]. Cytokines and chemokines released bymacrophages, T lymphocytes, bone marrow cells and B cells present inthe bone microenvironment mediate crosstalk between immune cellsand bone cells. There is an increasing interest in studying how T cellsare involved in bone metabolism and how they influence thegeneration and resorptive activity of osteoclasts [2,6,7]. Immune cellssecrete an array of cytokines like IL6, IL17, TGFβ, TNFα and RANKLwhich induce osteoclast formation and function, while cytokines likeIL4, IL10, IL12, IL13, IL18 and IFNγ inhibit the process ofosteoclastogenesis [8]. Conventional CD4+ T cells upon activationincrease expression of RANKL and are known to be pro-osteoclastogenic [9]. IL17 producing CD4+ T cells cause bonedestruction by inducing RANKL expression on synovial fibroblastsand osteoblasts. Although αβ T cells are studied with respect to theirrole in bone biology, role of γδ T cells has not been explored in detail.
γδ T cells are a unique subset of T cells, which harbor properties ofboth innate and adaptive immune cells. They represent <10% of thetotal T cell population, where >90% population resides in peripheralblood and expresses Vγ9Vδ2 TCR. γδ T cells possess uniqueproperties with respect to antigen recognition, tissue tropism, MHC-independent antigen recognition and antitumor response. γδ T cellsrecognizes unique antigens, different from conventional αβ T cells,which include small phosphoantigens such as isopentenylpyrophosphate (IPP) and (E)-4-Hydroxy-3-methyl-but-2-enylpyrophosphate (HMBPP), phospholipids, heat shock proteins, alkylamines and aminobisphosphonates [10]. IPP is an intermediatemolecule in eukaryotic mevalonate/ cholesterol pathway, whileHMBPP is an intermediate molecule in bacterial non-mevalonate/rohmer pathway. Aminobisphosphonates (Zoledronate), a class ofpotent antiresorptive drug, are used as a standard treatment modalityto treat postmenopausal osteoporosis and cancer patients with bonemetastasis [11,12]. γδ T cells are Th1 type cells but are extensivelyplastic and differentiate into different subsets like Th2, Th17, T-follicular helper and T-regulatory cells under different pathologicalconditions, producing different sets of cytokines [13]. γδ T cells havebeen appreciated for their role in antitumor cytotoxicity [14,15],wound healing and tissue repair [16-18] and thus have generated muchinterest in recent years. These cells produce several cytokines like IL17,IL6, IL10, TNFα, IFNγ and RANKL depending on their activationstatus. Many of these factors are known to influence bone metabolism.Most of the γδ T cell based studies, in context of osteoimmunology,have been done in patients of rheumatoid arthritis (RA) and multiplemyeloma [19,20]. Their presence has been demonstrated in bonemicroenvironment, in synovial fluids of rheumatoid arthritis patientsand at bone fracture sites [19,21]. Various groups have also shown
Journal of Cytokine Biology Phalke and Chiplunkar, J Cytokine Biol 2016, 1:3
Short Communication OMICS International
J Cytokine Biol, an open access journal Volume 1 • Issue 3 • 1000111
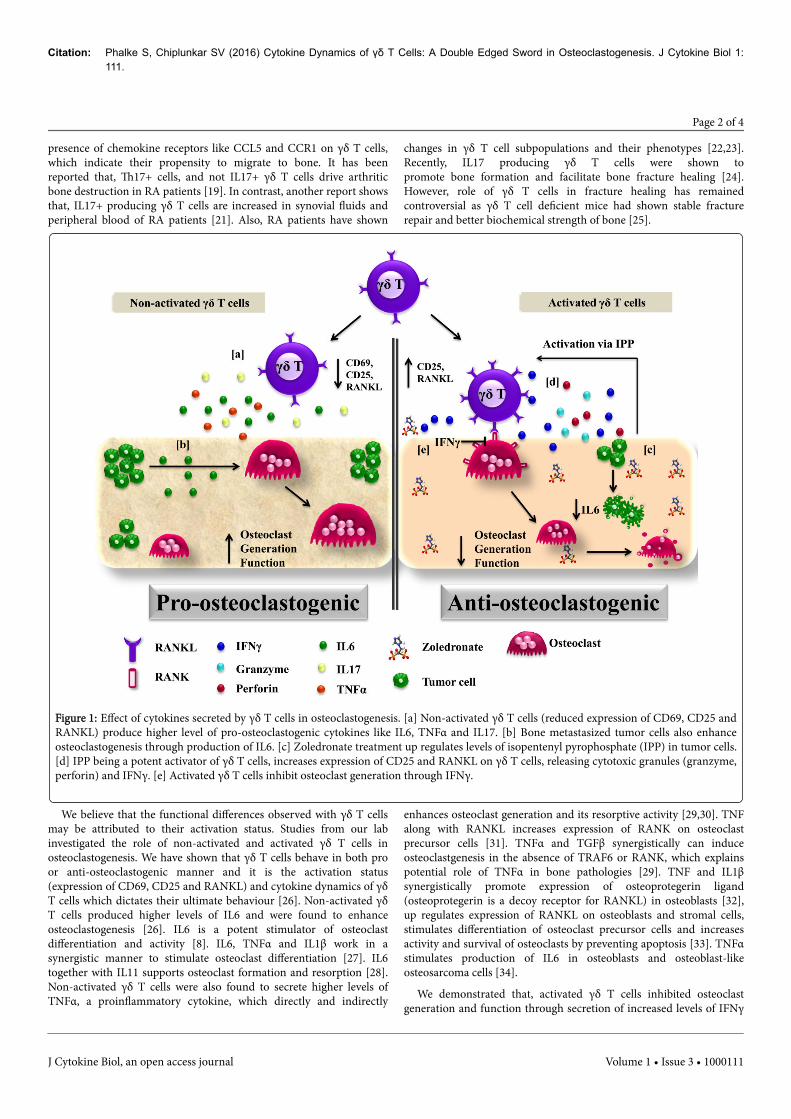
presence of chemokine receptors like CCL5 and CCR1 on γδ T cells,which indicate their propensity to migrate to bone. It has beenreported that, Th17+ cells, and not IL17+ γδ T cells drive arthriticbone destruction in RA patients [19]. In contrast, another report showsthat, IL17+ producing γδ T cells are increased in synovial fluids andperipheral blood of RA patients [21]. Also, RA patients have shown
changes in γδ T cell subpopulations and their phenotypes [22,23].Recently, IL17 producing γδ T cells were shown topromote bone formation and facilitate bone fracture healing [24].However, role of γδ T cells in fracture healing has remainedcontroversial as γδ T cell deficient mice had shown stable fracturerepair and better biochemical strength of bone [25].
Figure 1: Effect of cytokines secreted by γδ T cells in osteoclastogenesis. [a] Non-activated γδ T cells (reduced expression of CD69, CD25 andRANKL) produce higher level of pro-osteoclastogenic cytokines like IL6, TNFα and IL17. [b] Bone metastasized tumor cells also enhanceosteoclastogenesis through production of IL6. [c] Zoledronate treatment up regulates levels of isopentenyl pyrophosphate (IPP) in tumor cells.[d] IPP being a potent activator of γδ T cells, increases expression of CD25 and RANKL on γδ T cells, releasing cytotoxic granules (granzyme,perforin) and IFNγ. [e] Activated γδ T cells inhibit osteoclast generation through IFNγ.
We believe that the functional differences observed with γδ T cellsmay be attributed to their activation status. Studies from our labinvestigated the role of non-activated and activated γδ T cells inosteoclastogenesis. We have shown that γδ T cells behave in both proor anti-osteoclastogenic manner and it is the activation status(expression of CD69, CD25 and RANKL) and cytokine dynamics of γδT cells which dictates their ultimate behaviour [26]. Non-activated γδT cells produced higher levels of IL6 and were found to enhanceosteoclastogenesis [26]. IL6 is a potent stimulator of osteoclastdifferentiation and activity [8]. IL6, TNFα and IL1β work in asynergistic manner to stimulate osteoclast differentiation [27]. IL6together with IL11 supports osteoclast formation and resorption [28].Non-activated γδ T cells were also found to secrete higher levels ofTNFα, a proinflammatory cytokine, which directly and indirectly
enhances osteoclast generation and its resorptive activity [29,30]. TNFalong with RANKL increases expression of RANK on osteoclastprecursor cells [31]. TNFα and TGFβ synergistically can induceosteoclastgenesis in the absence of TRAF6 or RANK, which explainspotential role of TNFα in bone pathologies [29]. TNF and IL1βsynergistically promote expression of osteoprotegerin ligand(osteoprotegerin is a decoy receptor for RANKL) in osteoblasts [32],up regulates expression of RANKL on osteoblasts and stromal cells,stimulates differentiation of osteoclast precursor cells and increasesactivity and survival of osteoclasts by preventing apoptosis [33]. TNFαstimulates production of IL6 in osteoblasts and osteoblast-likeosteosarcoma cells [34].
We demonstrated that, activated γδ T cells inhibited osteoclastgeneration and function through secretion of increased levels of IFNγ
Citation: Phalke S, Chiplunkar SV (2016) Cytokine Dynamics of γδ T Cells: A Double Edged Sword in Osteoclastogenesis. J Cytokine Biol 1:111.
Page 2 of 4
J Cytokine Biol, an open access journal Volume 1 • Issue 3 • 1000111

[26]. IFNγ inhibits generation (degradation of TRAF6 adaptor proteinin RANKL signalling) and function (down regulated expression ofcathepsin-k) in osteoclasts [35]. Stimulation of γδ T cells withphosphoantigens (bromohydrin pyrophosphate) and Zoledronateincreased the expression of RANKL along with increase in IFNγsecretion. Increased RANKL expression on activated γδ T cells assiststheir interaction with osteoclasts; while increased IFNγ disruptsRANK-RANKL signalling, thus inhibiting osteoclast survival (Figure1).
The present study has provided a new insight into understandingthe crosstalk of γδ T cells with osteoclasts that can be extrapolated topatients with bone metastasis such as multiple myeloma, breast andprostate cancer. Through a vicious cycle, metastasized tumor cellsincrease osteoclast generation, activity and survival by releasingcytokines such as IL6, PTHrP, TNFα and prostaglandin E2. Thesetumor cells recruit immune cells at bone microenvironment byreleasing IL7, IL8 and parathyroid hormone related protein (PTHrP).Memory T cells have been detected in bone microenvironment buttheir proliferation and function are inhibited by increased levels ofTGFβ, released upon bone resorption by osteoclasts [36]. Blocking ofTGFβ at metastatic sites activates local antitumor immune responsesby these T cells [37]. Thus, in case of bone metastasis, metastasizedtumor cells exacerbate the situation by enhancing osteoclastogenesisand compromising the immune system.
Anti-IL6 or anti-RANKL therapies have shown effective results incontrol of bone metastasis. Zoledronate, a third generationaminobisphosphonate, is a most potent antiresorptive drug, withantitumor activity [38]. It has high affinity for bone minerals and thusgets incorporated into bone and is slowly released in the bonemicroenvironment by resorbing osteoclasts. Zoledronate inhibitsfernesyl pyrophosphate synthase (FPPS), a key enzyme in mevalonatepathway/ cholesterol pathway, which causes osteoclast and tumor cellapoptosis. Inhibition of FPPS causes accumulation of IPP, which inturn activates γδ T cells. αβ T cells remain unaffected upon aminobisphosphonate treatment [38,39].
In this scenario, Zoledronate treatment to breast cancer patientsprovides a favorable environment for the consistent activation of the γδT cells in bone microenvironment. Activation of γδ T cells throughaminobisphosphonates could exert a potent inhibitory effect onosteoclasts and tumor cells. Activated γδ T cells mediate theircytotoxic effects through release of perforin, granzyme and cytokines(IFNγ and TNFα). IFNγ alone has an ability to up regulate expressionof MHC I and II molecules and promote activation of CD4+, CD8+ Tcells , B cells, dendritic cells and monocyte-macrophage precursor cellsand thus increase antigen presentation by these cells [40] . ActivatedCD4+ T cells secrete pro-osteoclastogenic cytokines like IL17, TNFα,IL1β and IL6 which support and enhance osteoclastogenesis. Unlike αβT cells, γδ T cells are Th1 cells and predominantly produce copiousamount of IFNγ upon activation. IFNγ has multiple antitumor effectslike direct inhibition of tumor growth, inhibition of angiogenesis andmacrophage stimulation. It has also been reported that, metastaticbreast cancer cells produce factors which promote survival ofosteoclasts and block the apoptotic effects of bisphosphonates [41].Aminobisphosphonates can activate γδ T cells that are capable ofexhibiting antitumor effects. This action of aminobisphosphonates maycounteract the inhibitory effects of tumor derived factors.
A growing body of evidence points towards the role of γδ T cells asan anticancer immunotherapeutic treatment modality.Bisphosphonates are known to activate γδ T cells and therefore, their
use in cancer therapy warrants further investigation. Bisphosphonatescan be used as bone targeting anticancer agent that have direct effecton tumor cell proliferation, invasion and bone metastasis. Theinteresting aspect is that cytokines (IFNγ) released by bisphosphonateactivated γδ T cells has anti-osteoclastogenic effect. Fine tuning theactivation status and cytokine dynamics of γδ T cells may pave way fordevelopment of future immunotherapeutic modalities for patients withprimary breast, prostate cancer and multiple myeloma and bonemetastasis.
References1. Takayanagi H (2007) Osteoimmunology: shared mechanisms and
crosstalk between the immune and bone systems. Nat Rev Immunol 7:292-304.
2. Takayanagi H, Ogasawara K, Hida S, Chiba T, Murata S, et al. (2000) T-cell-mediated regulation of osteoclastogenesis by signalling cross-talkbetween RANKL and IFN-gamma. Nature 408: 600-605.
3. Drake MT (2013) Osteoporosis and cancer. Curr Osteoporos Rep 11:163-170.
4. Boyle WJ, Simonet WS, Lacey DL (2003) Osteoclast differentiation andactivation. Nature 423: 337-342.
5. Lee SK, Lorenzo J (2006) Cytokines regulating osteoclast formation andfunction. Curr Opin Rheumatol 18: 411-418.
6. Rifas L, Weitzmann MN (2009) A novel T cell cytokine, secretedosteoclastogenic factor of activated T cells, induces osteoclast formationin a RANKL-independent manner. Arthritis Rheum 60: 3324-3335.
7. Weitzmann MN, Cenci S, Rifas L, Haug J, Dipersio J, et al. (2001) T cellactivation induces human osteoclast formation via receptor activator ofnuclear factor kappaB ligand-dependent and -independent mechanisms. JBone Miner Res 16: 328-337.
8. Datta HK, Ng WF, Walker JA, Tuck SP, Varanasi SS (2008) The cellbiology of bone metabolism. J Clin Pathol 61: 577-587.
9. Kotake S, Nanke Y, Mogi M, Kawamoto M, Furuya T, et al. (2005) IFN-gamma-producing human T cells directly induce osteoclastogenesis fromhuman monocytes via the expression of RANKL. Eur J Immunol 35:3353-3363.
10. Born WK, Kemal Aydintug M, O'Brien RL (2013) Diversity ofgammadelta T-cell antigens. Cell Mol Immunol 10: 13-20.
11. Rizzoli R (2010) Zoledronic Acid for the treatment and prevention ofprimary and secondary osteoporosis. Ther Adv Musculoskelet Dis 2:3-16.
12. Drake MT, Clarke BL, Khosla S (2008) Bisphosphonates: mechanism ofaction and role in clinical practice. Mayo Clin Proc 83: 1032-1045.
13. Caccamo N, Todaro M, Sireci G, Meraviglia S, Stassi G, et al. (2013)Mechanisms underlying lineage commitment and plasticity of humangammadelta T cells. Cell Mol Immunol 10: 30-34.
14. Konigshofer Y, Chien YH (2006) Gammadelta T cells - innate immunelymphocytes? Curr Opin Immunol 18: 527-533.
15. Kabelitz D, Kalyan S, Oberg HH, Wesch D (2013) Human Vdelta2 versusnon-Vdelta2 gammadelta T cells in antitumor immunity.Oncoimmunology 2: e23304.
16. Sharp LL, Jameson JM, Cauvi G, Havran WL (2005) Dendritic epidermalT cells regulate skin homeostasis through local production of insulin-likegrowth factor 1. Nat Immunol 6: 73-79.
17. Jameson JM, Cauvi G, Sharp LL, Witherden DA, Havran WL (2005)Gammadelta T cell-induced hyaluronan production by epithelial cellsregulates inflammation. J Exp Med 201: 1269-1279.
18. Havran WL, Jameson JM, Witherden DA (2005) Epithelial cells and theirneighbors. III. Interactions between intraepithelial lymphocytes andneighboring epithelial cells. Am J Physiol Gastrointest Liver Physiol 289:G627-630.
Citation: Phalke S, Chiplunkar SV (2016) Cytokine Dynamics of γδ T Cells: A Double Edged Sword in Osteoclastogenesis. J Cytokine Biol 1:111.
Page 3 of 4
J Cytokine Biol, an open access journal Volume 1 • Issue 3 • 1000111
19. Pollinger B, Junt T, Metzler B, Walker UA, Tyndall A, et al. (2011) Th17cells, not IL-17+ gammadelta T cells, drive arthritic bone destruction inmice and humans. J Immunol 186: 2602-2612.
20. Cui Q, Shibata H, Oda A, Amou H, Nakano A, et al. (2011) Targetingmyeloma-osteoclast interaction with Vgamma9Vdelta2 T cells. Int JHematol 94: 63-70.
21. Meliconi R, Pitzalis C, Kingsley GH, Panayi GS (1991) Gamma/delta Tcells and their subpopulations in blood and synovial fluid fromrheumatoid arthritis and spondyloarthritis. Clin ImmunolImmunopathol 59: 165-172.
22. Bank I, Cohen L, Mouallem M, Farfel Z, Grossman E, et al. (2002)gammadelta T cell subsets in patients with arthritis and chronicneutropenia. Ann Rheum Dis 61: 438-443.
23. Bodman-Smith MD, Anand A, Durand V, Youinou PY, Lydyard PM(2000) Decreased expression of FcgammaRIII (CD16) by gammadelta Tcells in patients with rheumatoid arthritis. Immunology 99: 498-503.
24. Ono T, Okamoto K, Nakashima T, Nitta T, Hori S, et al. (2016) IL-17-producing gammadelta T cells enhance bone regeneration. Nat Commun7: 10928.
25. Colburn NT, Zaal KJ, Wang F, Tuan RS (2009) A role for gamma/delta Tcells in a mouse model of fracture healing. Arthritis Rheum 60:1694-1703.
26. Phalke SP (2015) Activation status of γδ T cells dictates their effect onosteoclast generation and bone resorption. Bone Reports 1: 8.
27. Devlin RD, Reddy SV, Savino R, Ciliberto G, Roodman GD (1998) IL-6mediates the effects of IL-1 or TNF, but not PTHrP or 1,25(OH)2D3, onosteoclast-like cell formation in normal human bone marrow cultures. JBone Miner Res 13: 393-399.
28. Kudo O, Sabokbar A, Pocock A, Itonaga I, Fujikawa Y, et al. (2003)Interleukin-6 and interleukin-11 support human osteoclast formation bya RANKL-independent mechanism. Bone 32: 1-7.
29. Kim N, Kadono Y, Takami M, Lee J, Lee SH, et al. (2005) Osteoclastdifferentiation independent of the TRANCE-RANK-TRAF6 axis. J ExpMed 202: 589-595.
30. Cenci S, Weitzmann MN, Roggia C, Namba N, Novack D, et al. (2000)Estrogen deficiency induces bone loss by enhancing T-cell production ofTNF-alpha. J Clin Invest 106: 1229-1237.
31. Zhang YH, Heulsmann A, Tondravi MM, Mukherjee A, Abu-Amer Y(2001) Tumor necrosis factor-alpha (TNF) stimulates RANKL-inducedosteoclastogenesis via coupling of TNF type 1 receptor and RANKsignaling pathways. J Biol Chem 276: 563-568.
32. Hofbauer LC, Lacey DL, Dunstan CR, Spelsberg TC, Riggs BL, et al.(1999) Interleukin-1beta and tumor necrosis factor-alpha, but notinterleukin-6, stimulate osteoprotegerin ligand gene expression in humanosteoblastic cells. Bone 25: 255-259.
33. Weitzmann MN, Pacifici R (2006) Estrogen deficiency and bone loss: aninflammatory tale. J Clin Invest 116: 1186-1194.
34. Kurokouchi K, Kambe F, Yasukawa K, Izumi R, Ishiguro N, et al. (1998)TNF-alpha increases expression of IL-6 and ICAM-1 genes throughactivation of NF-kappaB in osteoblast-like ROS17/2.8 cells. J Bone MinerRes 13: 1290-1299.
35. Kamolmatyakul S, Chen W, Li YP (2001) Interferon-gamma down-regulates gene expression of cathepsin K in osteoclasts and inhibitsosteoclast formation. J Dent Res 80: 351-355.
36. D'Amico L, Roato I (2012) Cross-talk between T cells and osteoclasts inbone resorption. Bonekey Rep 1: 82.
37. Wrzesinski SH, Wan YY, Flavell RA (2007) Transforming growth factor-beta and the immune response: implications for anticancer therapy. ClinCancer Res 13: 5262-5270.
38. Dhar S, Chiplunkar SV (2010) Lysis of aminobisphosphonate-sensitizedMCF-7 breast tumor cells by Vgamma9Vdelta2 T cells. Cancer Immun10: 10.
39. Fournier PG, Chirgwin JM, Guise TA (2006) New insights into the role ofT cells in the vicious cycle of bone metastases. Curr Opin Rheumatol 18:396-404.
40. Schroder K, Hertzog PJ, Ravasi T, Hume DA (2004) Interferon-gamma:an overview of signals, mechanisms and functions. J Leukoc Biol 75:163-189.
41. Hussein O, Tiedemann K, Komarova SV (2011) Breast cancer cells inhibitspontaneous and bisphosphonate-induced osteoclast apoptosis. Bone 48:202-211.
Citation: Phalke S, Chiplunkar SV (2016) Cytokine Dynamics of γδ T Cells: A Double Edged Sword in Osteoclastogenesis. J Cytokine Biol 1:111.
Page 4 of 4
J Cytokine Biol, an open access journal Volume 1 • Issue 3 • 1000111

Understanding the crosstalk between γδ T cells and osteoclasts inpatients with breast cancerShubhada Chiplunkar1*, Swati P. Phalke1, Vani Parmar2 and Rajendra A. Badwe2
1 ACTREC‐TMC, India2 Tata Memorial Hospital, India
Bone metastasis is a common cause of morbidity in breast cancer patients. Aminobisphosphonates are widely used in treatment of bone metastasis and skeletal disorders. Aminobisphosphonates increase endogenous pool of isopentenyl pyrophosphate (IPP) of mevalonate pathway in tumor cells, which acts as potent antigen for γδ T cells. γδ T cells are unique subsets of Tlymphocytes that areactivated by aminobisphosphonates and phosphoantigens (bromohydrin pyrophosphate, IPP). The present study aims at understanding the crosstalk between γδ T cells and osteoclasts in patients with breast cancer metastasis. Multicolor flow cytometry showed higher expression of RANKL on γδ T cells of breast cancer patients. Stimulation with aminobisphosphonate (zoledronate) increased RANKL expression on γδ T cells. Osteoclasts generated from CD14+ monocytes of breast cancer patients and healthy individuals in the presence of zoledronate activated γδ T cells showed reduced osteoclastogenesis as analysed by 23c6 mAb (CD51/61)and DAPI staining. Osteoclasts generated in the presence of cell free supernatants of activated γδ T cells showed reduced resorption area (pits) on Osteoclast Activity Assay Substrate. Cytokine analysis of activated γδ T cells showed presence of IFNγ, antiosteoclastogenic cytokine. Zoledronate activated γδ T cells have high propensity to migrate to bone and inhibit osteoclastogenesis.Aminobisphosphonate activated γδ T cell based immunotherapy would be a promising approach to treat bone metastasis in breast cancer.
Keywords: Aminobisphosphonates, γδ T cells, Osteoclasts, bone metastasis, breast cancer
Conference: 15th International Congress of Immunology (ICI), Milan, Italy, 22 Aug ‐ 27 Aug, 2013. Presentation Type: Abstract Topic: Innate immunity
Citation: Chiplunkar S, Phalke SP, Parmar V and Badwe RA (2013). Understanding the crosstalk between γδ T cells and osteoclasts in patients with breast cancer. Front.Immunol. Conference Abstract: 15th International Congress of Immunology (ICI). doi: 10.3389/conf.fimmu.2013.02.01017
Received: 30 Jun 2013; Published Online: 22 Aug 2013.
* Correspondence: Prof. Shubhada Chiplunkar, ACTREC‐TMC, Navi Mumbai, Maharashtra, 410210, India, [email protected]
© 2007 ‐ 2016 Frontiers Media S.A. All Rights Reserved
About Submit Journals Research Topics
Search for articles, people, events and more. Login Register
EVENT ABSTRACT Back to Event