Embed Size (px)
Citation preview

1 © FSG |
Understanding the Affordable
Private School Market in India Program to Improve Private Early Education (PIPE)

2 © FSG |
Contents
1 Scope and objectives of PIPE research on the
APS market in India
2 APS market in India
3 The APS business
4 Motivations of APS owner
5 Buying behavior of APS owner
6 ECE provision and pedagogy in an APS
7 Introduction to PIPE and FSG Inclusive Markets
8 Appendix
3 © FSG |
5 key objectives of the research
Understand the Indian APS market 1
Understand APS owners’ buying process for ‘non-traditional’ purchases i.e.,
purchases not uniformly made across schools, especially those linked to improvements
in quality1
2
Assess how APS owners view the Early Childhood Education (ECE) business 3
Understand how the ECE section of an APS functions 4
Identify the top challenges faced by APSs, and the approach APS owners take to
address these challenges
5
1. Improvement in quality is defined as the owner’s perception of a positive change in any aspect related to the school

4 © FSG |
Findings are based on interviews with a cross-section of
stakeholders, observations at APSs, and secondary research
Review of existing research on key areas, including:
– Customers (Gray Matters1, MSDF2)
– Business economics (Gray Matters3, MSDF2)
– Education policy (Dr. Archana Mehendale4, Accountability Initiative5)
– Quality (CECED6, Pratham7)
– Sector wide trends (Ernst & Young8)
Findings from FSG research9 aimed at understanding customer behavior and
drivers of that behavior
Structured interviews at 28 schools across 3 cities (Bengaluru, Delhi,
Hyderabad)
– 28 APS owners
– 19 ECE teachers
Structured interviews with 31 experts and solution providers
Informal interviews with owners and teachers in 20 schools in Mumbai, Pune,
Hyderabad and Delhi (in addition to the structured interviews)
Primary
research
Secondary
research
1. Gray Matters Capital, 2010, “Consumers of Affordable Private Schools: A study of parents in low-income communities in Hyderabad, India”; 2.
MSDF, 2014, “Market Assessment of Affordable Private Schools in Five Cities”; 3. Gray Matters Capital, 2012, “APS Sector Analysis Report-
2012”; 4.Dr. Archana Mehendale, 2011, “ECE in India: Policy and Law”; 5. Accountability Initiative, 2015, “SSA Budget Brief”; 6. CECED, 2015,
“Indian ECE Impact Study- 1”; 7. Pratham, 2014, “The 10th Annual Status of Education Report (ASER)”; 8. Ernst & Young, 2012, “Private Sector’s
contribution to K-12 education in India: Current impact, challenges and way forward”; 9. FSG primary customer research of 4,179 households in
NCCS (National Consumer Classification System) classes A3-D1 (April-July 2015)

5 © FSG |
Contents
1 Scope and objectives of PIPE research on the APS
market in India
2 APS market in India
3 The APS business
4 Motivations of APS owner
5 Buying behavior of APS owner
6 ECE provision and pedagogy in an APS
7 Introduction to PIPE and FSG Inclusive Markets
8 Appendix

6 © FSG |
On the basis of control, schools can be divided into two groups.
PIPE focuses on APSs – low-fee, unaided private schools
* This definition is based on a synthesis of the following reports: ”Education Technology in India: Designing Ed-Tech for Affordable Private
Schools", by Hila Mehr et al. (2013);.”Affordable Private Schools (APS) Sector Analysis Report-2012” by Gray Matters Capital (2012);
”Market assessment of Affordable Private Schools in Five Cities”, by MSDF (2014)
Government
Schools
Private schools that
receive government
grant-in-aid to cover
costs such as teacher
salaries
Private schools that do
not receive any grants
from the government
Private unaided schools
with fees over INR
1,500/ month
Private unaided schools
with fees under INR
1,500/ month
Schools in India
Private Schools
Private Aided
Schools
Private Unaided
Schools
Expensive Private
Schools
Affordable Private
Schools
Affordable private schools (APS) are a fast growing segment of
private schools in the developing world. The APS sector provides an
affordable alternative to government schools for low-income families
PIPE focus
1
2
3 4

7 © FSG |
FSG estimates that there are around 1.5 lakh APSs in urban
India
1. James Tooley (Professor of Education Policy and Director, E.G. West Centre, Newcastle University ) in “Understanding parental choice for
Budget Private Schools”, Report on Budget Private Schools in India 2016-17, Centre for Civil Society (2017)
2. Geeta Gandhi Kingdon (Chair, Education Economics and International Development, Institute of Education, University College London) in “The
emptying of public schools and growth of private schools in India”, Report on Budget Private Schools in India 2016-17 Centre for Civil Society
(2017)
3. ”The Private School Revolution in Bihar: Findings from a Survey in Urban Patna”, by B Rangaraju, J Tooley, P Dixon (2012)
4. Eighth All India Educational Survey conducted by the National Council for Educational Research and Training (2009)
FSG estimate
of APS
numbers in
urban India
FSG estimates suggest urban India could have anywhere between 1.3 -1.7 lakh
APSs
– The mid-point of this range is around 1.5 lakh APSs
Please see the next slide for detailed calculations
Other sources
of information
on APS
numbers /
enrolments
Noted APS expert James Tooley has estimated that 70 percent of urban Indian
children (~65 million) are in private unaided schools1
Educationist Geeta Gandhi Kingdon has calculated that India (rural and urban) has
around 2.9 lakh private unaided schools (in 2014-15)2
As per the 8th All India Educational Survey4, urban India had approximately 80,000
private unaided schools (in 2009)
There is no current data on the total number of private schools in India. Data from the official source (District
Information Urban India System on Education (DISE)) does not include all private schools2,3

8 © FSG |
Estimating the number of APSs in urban India – detailed
calculations
1. Single year age returns by residence and sex (Table C-13), Census of India: http://www.censusindia.gov.in/2011census/c-series/c-13.html
2. Assuming that the proportion of children by socio-economic classes is the same as the distribution of households. Data from Indian Readership
Survey 2014 (see slide 67)
3. FSG primary customer research of 4,179 households in NCCS classes A3-D1 (April-July 2015)
4. FSG assumption
5. FSG assumption based on schools in research sample
Scenario 1 Scenario 2
Number of children aged 3-5 (both inclusive) in urban India1 19,139,027 19,139,027
% of children in A3-D1 category in urban India2 69.41% 69.41%
Number of children in A3-D1 category in urban India (3-5 years, both
inclusive)
13,284,399 13,284,399
% of these children going to ECE in APS (3-5 years)3 86% 86%
Number of children in A3-D1 category in urban India going to ECE in APS 11,424,583 11,424,583
# of children from other segments going to APS (from A2 and D2
assuming 12% from each of those categories)4
390,436 390,436
Number of children going to ECE in APS in urban India 11,815,019 11,815,019
Average enrolment in ECE in an urban APS5 90 75
Number of APSs 131,278 157,534

9 © FSG |
The APS market is highly fragmented, and a large number of
standalone schools operate within a small geography
1. ”Affordable Private Schools (APS) Sector Analysis Report-2012” by Gray Matters Capital (2012); 2. APS location data: National
Independent School Association (NISA)
Illustration: 89 APSs in 12 sq. km. area in a Hyderabad
locality (not exhaustive)2
Situation in APS market
Most dense, low-income
communities have nearly 30-40
APSs in a 2-km radius1
Only 1/3rd of the APSs are part
of a chain1
82% of these chains have less
than 5 schools1

10 © FSG |
The proliferation of APSs is being driven by demand from
parents and profitability of the business
1 Low-income parents prefer APSs to government schools
FSG research shows that 87% of urban low-income parents are sending their ECE-age children to
APSs1
– Parents associate government schools with poor quality education and a lack of good facilities
– Parents also feel government schools are attended by students from poorer families, and do not
want their children to associate with them
– ‘English-medium’ schools are preferred as parents feel that being in an ‘English-speaking
environment’ would help their child pick up the language – important for success later in life
2 APSs have low costs and running an APS is a profitable business
APSs are able to operate at a lower cost per child compared to even government schools
– A study by Muralidharan and Sundararaman (2015) shows private schools were able to achieve
similar level of learning as government schools for around one third of the cost2
80%+ APSs are making an operational surplus3
Successful APSs can make profits of over INR 1.5 million per year (~USD 25,000)4
The APS market in India is estimated to be around USD 5.2 billion5
1. FSG primary customer research of 4,179 households in NCCS (National Consumer Classification System) classes A3-D1 (April-July 2015); 2. The
Aggregate Effect of School Choice: Evidence from a two-stage experiment in India, The Quarterly Journal of Economics; 3.” Affordable Private Schools
(APS) Sector Analysis Report-2012” by Gray Matters Capital (2012); 4. FSG estimates, based on schools in research sample. See slides 27 and 31 for
detailed estimates; 5.”Emerging Markets, Emerging models: Market Based Solutions to the Challenges of Global Poverty” by M Kubzansky, P Frandano
& A Karamchandani (2009)
11 © FSG |
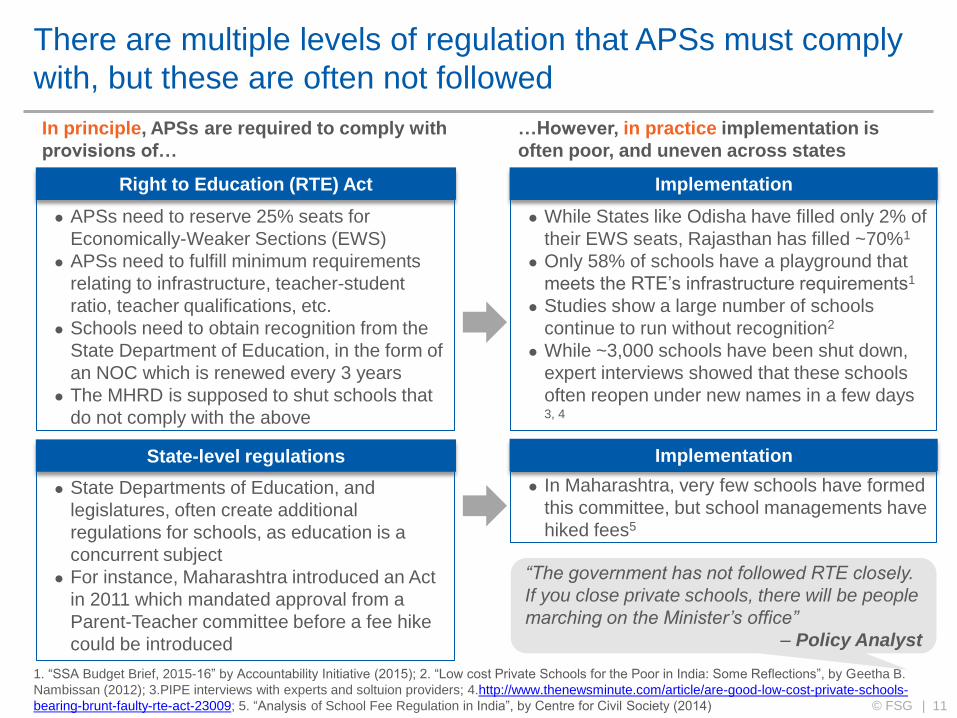
There are multiple levels of regulation that APSs must comply
with, but these are often not followed
“The government has not followed RTE closely.
If you close private schools, there will be people
marching on the Minister’s office”
– Policy Analyst
In principle, APSs are required to comply with
provisions of…
…However, in practice implementation is
often poor, and uneven across states
Implementation
1. “SSA Budget Brief, 2015-16” by Accountability Initiative (2015); 2. “Low cost Private Schools for the Poor in India: Some Reflections”, by Geetha B.
Nambissan (2012); 3.PIPE interviews with experts and soltuion providers; 4.http://www.thenewsminute.com/article/are-good-low-cost-private-schools-
bearing-brunt-faulty-rte-act-23009; 5. “Analysis of School Fee Regulation in India”, by Centre for Civil Society (2014)
While States like Odisha have filled only 2% of
their EWS seats, Rajasthan has filled ~70%1
Only 58% of schools have a playground that
meets the RTE’s infrastructure requirements1
Studies show a large number of schools
continue to run without recognition2
While ~3,000 schools have been shut down,
expert interviews showed that these schools
often reopen under new names in a few days 3, 4
Right to Education (RTE) Act
APSs need to reserve 25% seats for
Economically-Weaker Sections (EWS)
APSs need to fulfill minimum requirements
relating to infrastructure, teacher-student
ratio, teacher qualifications, etc.
Schools need to obtain recognition from the
State Department of Education, in the form of
an NOC which is renewed every 3 years
The MHRD is supposed to shut schools that
do not comply with the above
State-level regulations
State Departments of Education, and
legislatures, often create additional
regulations for schools, as education is a
concurrent subject
For instance, Maharashtra introduced an Act
in 2011 which mandated approval from a
Parent-Teacher committee before a fee hike
could be introduced
Implementation
In Maharashtra, very few schools have formed
this committee, but school managements have
hiked fees5
12 © FSG |
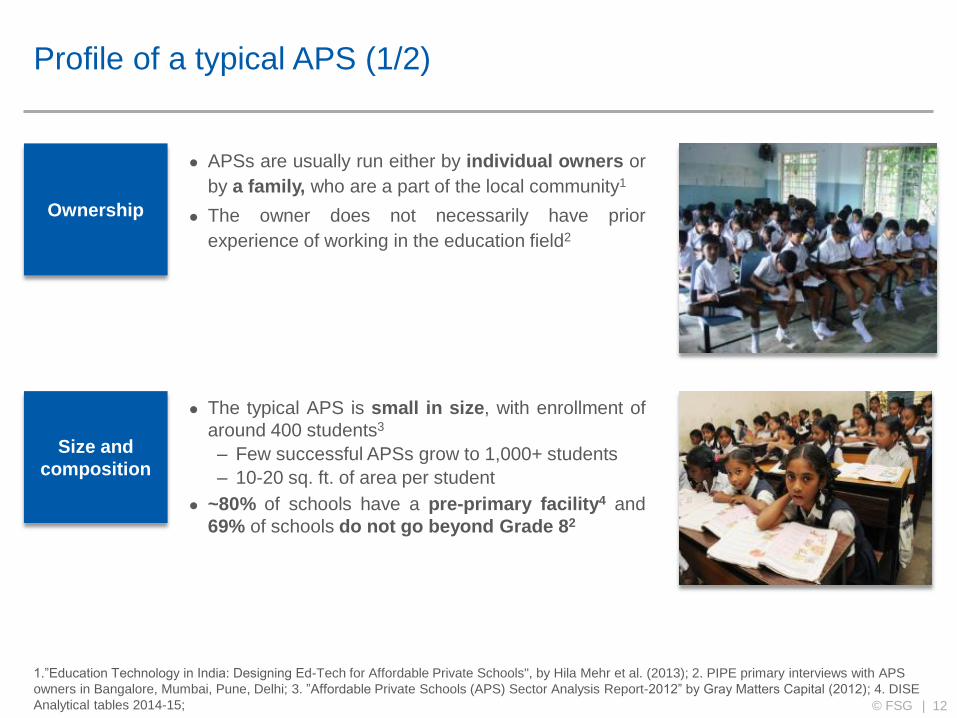
Profile of a typical APS (1/2)
Ownership
APSs are usually run either by individual owners or
by a family, who are a part of the local community1
The owner does not necessarily have prior
experience of working in the education field2
1.”Education Technology in India: Designing Ed-Tech for Affordable Private Schools", by Hila Mehr et al. (2013); 2. PIPE primary interviews with APS
owners in Bangalore, Mumbai, Pune, Delhi; 3. ”Affordable Private Schools (APS) Sector Analysis Report-2012” by Gray Matters Capital (2012); 4. DISE
Analytical tables 2014-15;
Size and
composition
The typical APS is small in size, with enrollment of
around 400 students3
– Few successful APSs grow to 1,000+ students
– 10-20 sq. ft. of area per student
~80% of schools have a pre-primary facility4 and
69% of schools do not go beyond Grade 82
13 © FSG |
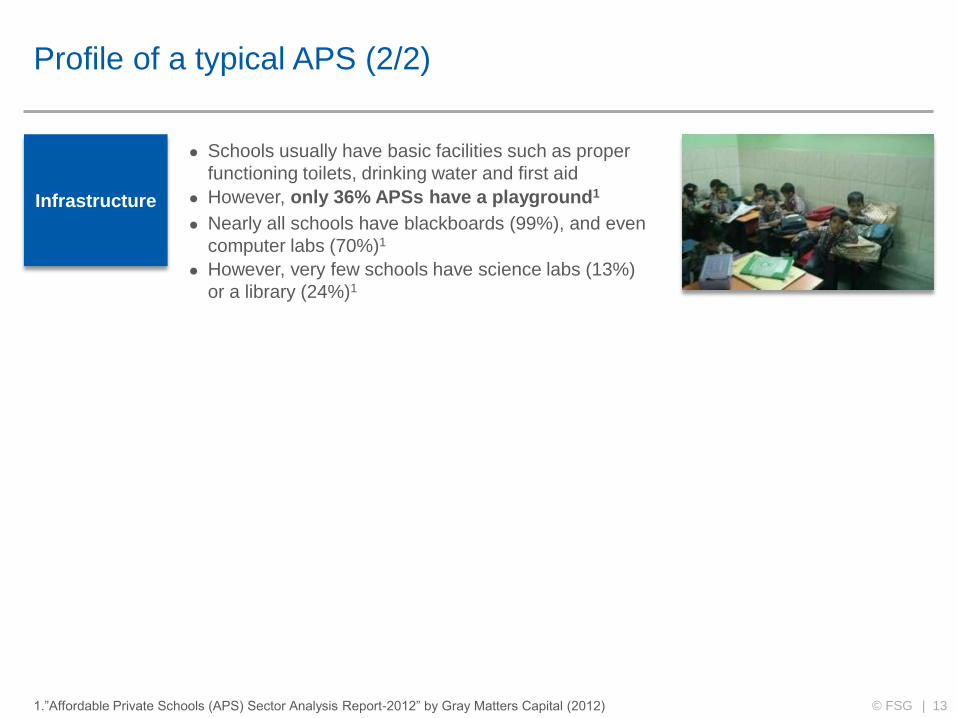
Infrastructure
Schools usually have basic facilities such as proper
functioning toilets, drinking water and first aid
However, only 36% APSs have a playground1
Nearly all schools have blackboards (99%), and even
computer labs (70%)1
However, very few schools have science labs (13%)
or a library (24%)1
Profile of a typical APS (2/2)
1.”Affordable Private Schools (APS) Sector Analysis Report-2012” by Gray Matters Capital (2012)

14 © FSG |
Summary: Profitability and demand drive growth in the poorly-
regulated, highly competitive and fragmented APS market
The APS business has low entry barriers and is highly fragmented: APSs are generally run by
individual owners or families that do not necessarily have prior experience of working in education.
Only one-third of APSs are part of a chain, and more than 80% of these chains have less than 5
schools
Adherence to regulation is low: An elaborate regulatory structure exists at multiple levels, but
most regulations are not enforced. Enforcement is also uneven across states
Low-income parents prefer sending their children to an APS over a government school:
Close to 90% of urban low-income parents prefer APSs to government schools due to English-
medium teaching and low teacher absenteeism
APSs form a large chunk of schools in India: As per government data, 39% of schools in urban
India are APSs. Independent studies indicate that this proportion might be much higher in reality as
a substantial chunk of private schools are not listed in government records
APS teachers generally lack required qualifications and are poorly paid: Most APS teachers
lack formal teaching qualifications, and may not even have completed college. The average salary
for an APS teacher is around INR 4,000/month
15 © FSG |
Contents
1 Scope and objectives of PIPE research on the APS
market in India
2 APS market in India
3 The APS business
4 Motivations of APS owner
5 Buying behavior of APS owner
6 ECE provision and pedagogy in an APS
7 Introduction to PIPE and FSG Inclusive Markets
8 Appendix
16 © FSG |
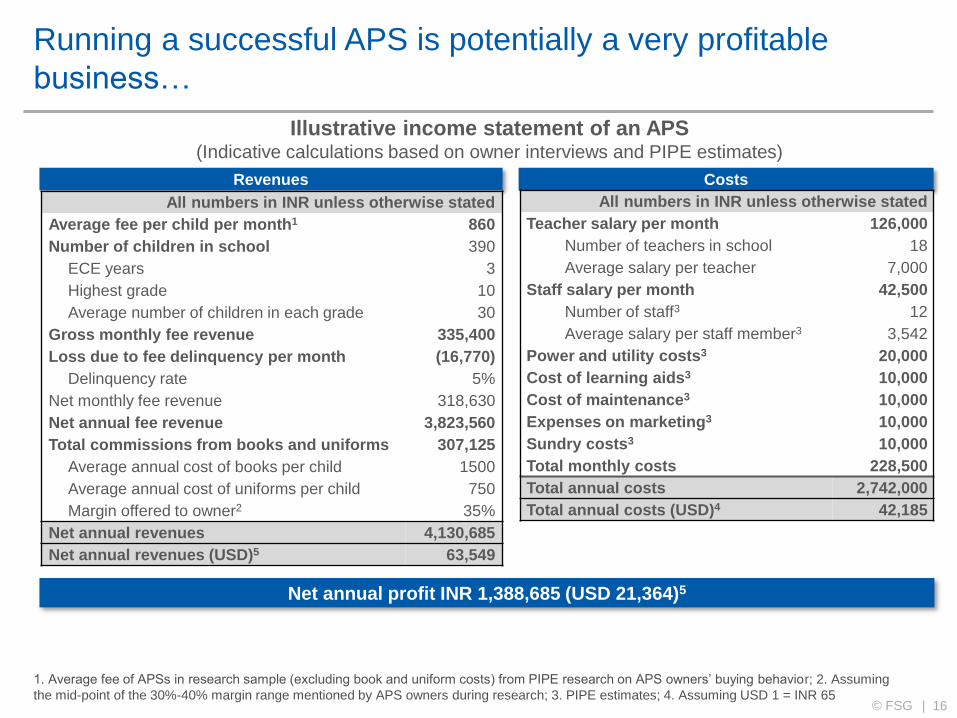
Running a successful APS is potentially a very profitable
business…
Illustrative income statement of an APS (Indicative calculations based on owner interviews and PIPE estimates)
1. Average fee of APSs in research sample (excluding book and uniform costs) from PIPE research on APS owners’ buying behavior; 2. Assuming
the mid-point of the 30%-40% margin range mentioned by APS owners during research; 3. PIPE estimates; 4. Assuming USD 1 = INR 65
Net annual profit INR 1,388,685 (USD 21,364)5
Revenues Costs
All numbers in INR unless otherwise stated
Average fee per child per month1 860
Number of children in school 390
ECE years 3
Highest grade 10
Average number of children in each grade 30
Gross monthly fee revenue 335,400
Loss due to fee delinquency per month (16,770)
Delinquency rate 5%
Net monthly fee revenue 318,630
Net annual fee revenue 3,823,560
Total commissions from books and uniforms 307,125
Average annual cost of books per child 1500
Average annual cost of uniforms per child 750
Margin offered to owner2 35%
Net annual revenues 4,130,685
Net annual revenues (USD)5 63,549
All numbers in INR unless otherwise stated
Teacher salary per month 126,000
Number of teachers in school 18
Average salary per teacher 7,000
Staff salary per month 42,500
Number of staff3 12
Average salary per staff member3 3,542
Power and utility costs3 20,000
Cost of learning aids3 10,000
Cost of maintenance3 10,000
Expenses on marketing3 10,000
Sundry costs3 10,000
Total monthly costs 228,500
Total annual costs 2,742,000
Total annual costs (USD)4 42,185
17 © FSG |
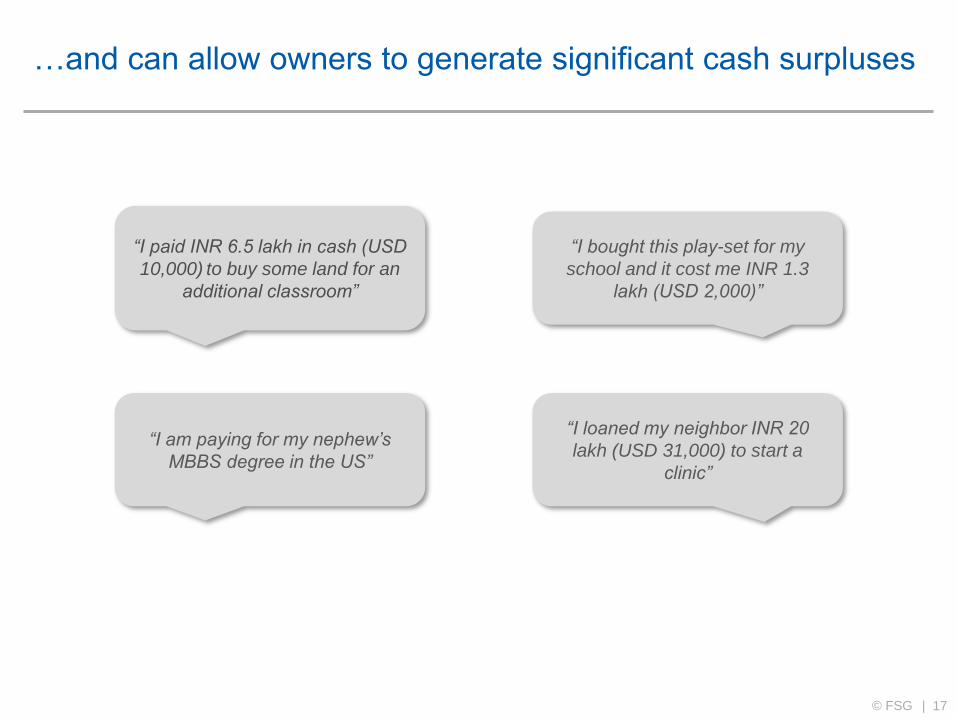
…and can allow owners to generate significant cash surpluses
“I paid INR 6.5 lakh in cash (USD
10,000) to buy some land for an
additional classroom”
“I bought this play-set for my
school and it cost me INR 1.3
lakh (USD 2,000)”
“I am paying for my nephew’s
MBBS degree in the US”
“I loaned my neighbor INR 20
lakh (USD 31,000) to start a
clinic”

18 © FSG |
Schools earn revenue through a variety of fees that are
collected at different intervals
Month 1
Start of the academic year
Annual fees
Admission fees
Text book charges
Monthly
fees
Month 2 Month 3
Monthly fees
Exam fees
Monthly fees
Term fees
Computer lab fees
Month 4 Month 5
Monthly fees
Picnic charge
Monthly fees
Exam fees
Month 6
Schools may also charge activity specific fees (e.g., extra fee for a karate class or a school outing)
Illustration of various fees charged by APSs

19 © FSG |
Successful schools are able to increase fees periodically, but
to a limited extent
Frequency of fee increase
No
information
7%
Longer
period/no
fixed
period
10%
Once
every 2-
3 years
7%
Every year
72%
N=28
APS owner’s response to the question:
“How often do you raise your fees?”
Fee increases
Most schools in the sample increased fees every
year
The increase is typically limited to below 10%
The ability to increase fees is constrained by
– Parents’ ability to pay
– Competition within the micro-market
Schools do not always need a new intervention /
improvement to justify the fee increase

20 © FSG |
Revenues (INR) Scenario 1 (30% margin) Scenario 2 (35% margin)
Average fee per child per month2 860 860
Number of children in school 390 390
Gross annual fee revenue 4,024,800 4,024,800
Annual fee delinquency (assuming 5% delinquency rate) (201,240) (201,240)
Net annual fee revenues 3,823,560 3,823,560
Average annual cost of books per child 1,500 1,500
Total revenue from books 585,000 585,000
Total earnings from commission on books 175,500 204,750
Average annual cost of uniforms per child3 750 750
Total revenue from uniforms 292,500 292,500
Total earnings from commission on uniforms 87,750 102,375
Total earnings from commissions 263,250 307,125
Net annual profits of school 1,344,810 1,388,685
Commission earnings as % of net profits 19.58% 22.12%
Commissions on the sale of products to parents are a
substantial source of additional income for APSs
Commissions on sale of products to parents (e.g., text books and uniforms) can
constitute close to 20% of an APS’ net earnings
Commission on sales represent pure profit for the APS, with no associated costs
APSs can earn margins of around 30-40%, and consider the margin offered a key
criteria for selecting a supplier
1. Rough estimates based on FSG research; 2. Avg. fee of APSs in research sample 3. Assuming two sets cost INR 1500 and are replaced once
every two years
Illustrative case study1 of importance of commission from text books and school uniforms

21 © FSG |
Common challenges faced by APSs (1/4)
Parent engagement
Teacher
retention /
recruitment
32%
Space
39%
Fee
collection
64%
Parent
engagement
71%
APS owner’s response to the question:
“What are the biggest challenges that
you face?”
*Responses to an open-ended question with multiple responses possible
Frequency of responses (n=28)*
Owners’ response
Some parents ‘do not care about the child’s
education’ and therefore do not engage with the
school
Some parents have ‘unrealistic expectations’
about what the school can achieve for the child
Some parents are ‘uneducated and cannot
support the child at home’
PIPE analysis
While ‘disengaged parents’ was one of the most
frequently reported challenges, it did not appear to
be a major challenge in practice
Owners were often referring to only a minority of
parents as being disengaged
Teachers also described how parents would often
complete the child’s homework themselves,
indicating a considerable level of engagement

22 © FSG |
Common challenges faced by APSs (2/4)
Teacher
retention /
recruitment
32%
Space
39%
Fee
collection
64%
Parent
engagement
71%
Frequency of responses (n=28)*
Fee collection
Owners’ response
20-25% of parents are behind on fee payments
5-10% do not pay at all
Parents often demand discounts on the listed fee
PIPE analysis
To reduce risk, some schools collect 50% of the
total annual fee upfront and the rest in 2 (or more)
equal instalments
Owners anticipate the need to provide discounts and
quote higher fee amounts
Owners price discriminate between parents
depending on their ability pay, offering larger
discounts to those who have a lower ability to pay
APS owner’s response to the question:
“What are the biggest challenges that
you face?”
*Responses to an open-ended question with multiple responses possible
23 © FSG |
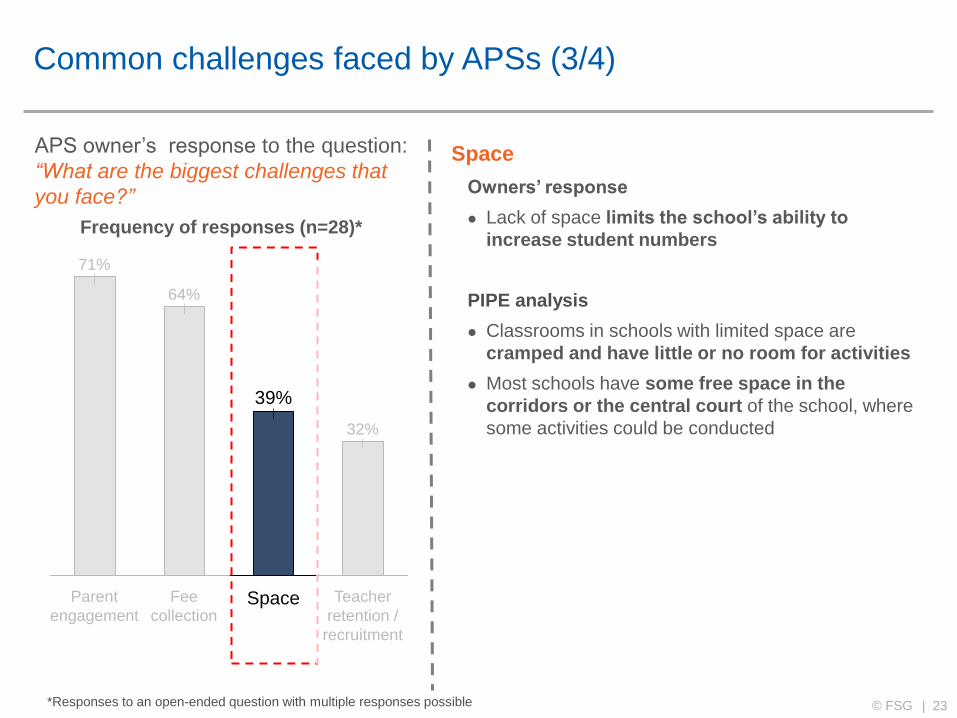
Common challenges faced by APSs (3/4)
Teacher
retention /
recruitment
32%
Space
39%
Fee
collection
64%
Parent
engagement
71%
Frequency of responses (n=28)*
APS owner’s response to the question:
“What are the biggest challenges that
you face?”
Space
Owners’ response
Lack of space limits the school’s ability to
increase student numbers
PIPE analysis
Classrooms in schools with limited space are
cramped and have little or no room for activities
Most schools have some free space in the
corridors or the central court of the school, where
some activities could be conducted
*Responses to an open-ended question with multiple responses possible

24 © FSG |
Common challenges faced by APSs (4/4)
Teacher
retention /
recruitment
32%
Space
39%
Fee
collection
64%
Parent
engagement
71%
Frequency of responses (n=28)*
Teacher retention / recruitment
Owners’ response
Teacher attrition is as high as 50% in some schools
– Teachers may move to competing schools who
pay slightly higher wages, or may discontinue for
personal reasons
There is a scarcity of “good” teachers
PIPE analysis
Owners often recruit untrained teachers for ECE
and are able to replace them relatively easily
Frequent churn of teachers, and the ability to hire
untrained teachers, helps owners keep salaries low
Owners seldom invest in the professional
development of teachers, despite hiring untrained
teachers
APS owner’s response to the question:
“What are the biggest challenges that
you face?”
*Responses to an open-ended question with multiple responses possible
25 © FSG |
Summary: APSs are run like small businesses, owners have
limited education but understand parent expectations
Most APS owners are driven by economics: APSs tend to be run as businesses, and decisions
regarding the school are driven by the impact on revenue and cost
Successful APSs are able to regularly raise fees, but to a limited extent: Fees are often
increased annually and are not necessarily linked to new investments / improvements in the school,
but the ability to increase fees is constrained by the parents’ ability to pay and the level of
competition in the micro-market
‘Commission’ on goods is an important source of income: Commissions on text books and
uniforms can account for ~20% of income for an APS, and are an important factor when owners
select suppliers
APSs can be a very profitable business: Successful APSs can make profits of over INR 1.5
million per year (~USD 25,000)
26 © FSG |
Contents
1 Scope and objectives of PIPE research on the APS
market in India
2 APS market in India
3 The APS business
4 Motivations of APS owner
5 Buying behavior of APS owner
6 ECE provision and pedagogy in an APS
7 Introduction to PIPE and FSG Inclusive Markets
8 Appendix

27 © FSG |
A typical APS owner is a small businessman looking to
differentiate and grow his business
Name: Kamal Kumar Sharma
Age: 34
Education: Graduate
Years in-charge of school: 6
Prior experience: Owned a real
estate brokerage firm
Note: Fictional portrait for illustrative purposes only, based on FSG primary research using qualitative interviews
Has inherited the school which was started by his
father
Divides his time between the school and a real
estate business
Has hired a Principal to take care of most of the
day-to-day affairs of the school
Believes that parents are not interested in quality
and only run after big brands and gimmicks
Feels increasing fees is not easy as the newer
schools are happy to undercut fees in attempt to
lure parents
Wants to add a new building to increase his school’s
capacity
Faces challenges with fee collection, and
bureaucratic issues due to RTE

28 © FSG |
APS owners often view the school as a business, and tend to
be primarily motivated by economics
What drives the typical APS owner’s decisions about the school?
Financial
motives are
the primary
drivers for
running APSs
APSs are often run as businesses (family businesses in
many cases).
Decisions about the school are therefore analyzed on the
basis of their impact on costs and revenues.
Some owners may believe that improving quality could
lead to better financials in the long-term.
“I cannot introduce
anything for which the
parents are not willing
to pay”
Some owners
are also
driven by
social and
altruistic
motives
Social
APS owners enjoy a certain standing within the local
community.
Being seen as providing ‘quality’ or ‘caring about students’
can enhance this standing, and may drive some decisions
made by the owner
Altruistic
Some owners may be committed to improving the quality
of education for its own sake.
Decisions to invest in certain aspects may therefore be
driven by an ‘altruistic’ motivation to improve quality
“My school is well-
respected in this
community and
everyone greets me
with respect”
“I noticed that my
students were bored in
class and wanted to do
something to engage
them”
29 © FSG |
APS owners operate in a highly competitive environment and
under multiple pressures
APS owners are running a difficult business
– APSs operate in a highly fragmented and competitive environment
– Increased competition has limited the ability of APSs to increase fees
– A small proportion of schools is struggling with falling enrolment numbers due to increased
competition
– Parents often delay paying fees and also negotiate discounts, leading to challenges in managing
cash flows
– Teacher attrition is high
– Owners have to contend with multiple regulations and rent-seeking behavior by the official
machinery
Parents are often reluctant to pay higher fees and this makes it difficult for owners to invest in
intangibles or in product that show impact over a longer period
– Low-income parents are skeptical of additional spending
– APS owners generally pass on costs of any new purchases (products/services) to parents (often
with a markup)
– Any product or service that is not visible to parents (e.g., teacher training), or one that is likely to
show significant results only over a longer-term, is a difficult acquisition for the APS
30 © FSG |
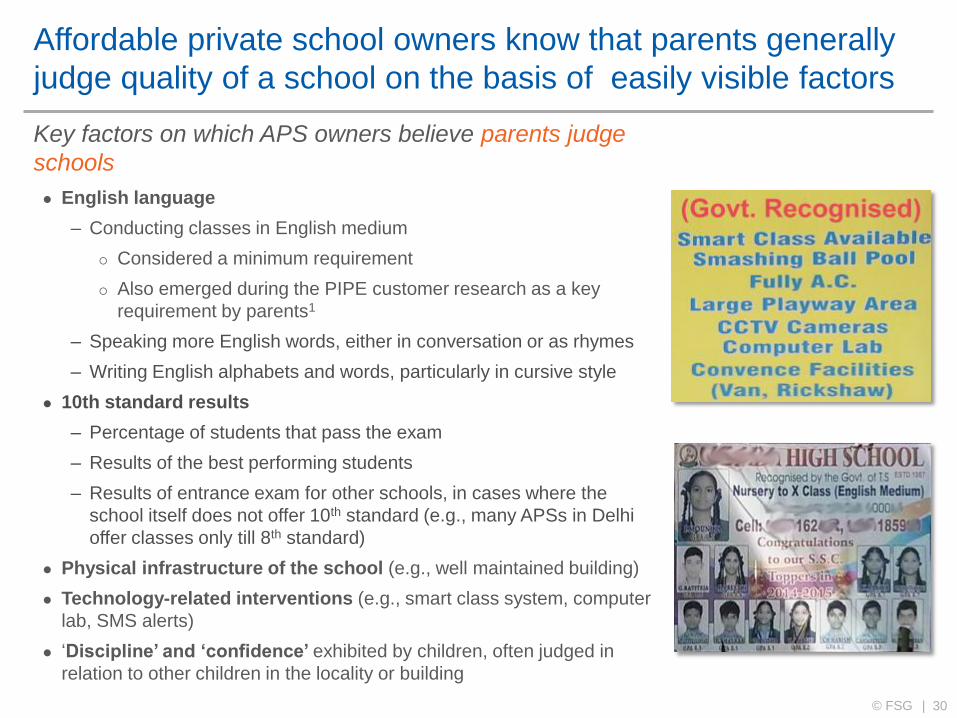
Affordable private school owners know that parents generally
judge quality of a school on the basis of easily visible factors
Key factors on which APS owners believe parents judge
schools
English language
– Conducting classes in English medium
Considered a minimum requirement
Also emerged during the PIPE customer research as a key
requirement by parents1
– Speaking more English words, either in conversation or as rhymes
– Writing English alphabets and words, particularly in cursive style
10th standard results
– Percentage of students that pass the exam
– Results of the best performing students
– Results of entrance exam for other schools, in cases where the
school itself does not offer 10th standard (e.g., many APSs in Delhi
offer classes only till 8th standard)
Physical infrastructure of the school (e.g., well maintained building)
Technology-related interventions (e.g., smart class system, computer
lab, SMS alerts)
‘Discipline’ and ‘confidence’ exhibited by children, often judged in
relation to other children in the locality or building

31 © FSG |
Summary: APSs are generally run by financially-driven owners
who have a keen sense of parent expectations
APS owners often view the school as a business, and tend to be primarily motivated by
economics: APSs are often family-owned businesses and most decisions are analyzed on the
basis of their financial impact. Some owners are also driven by social and altruistic motives
APS owners operate in a highly competitive environment and face several challenges: APSs
operate in a highly fragmented and competitive environment. They face challenges in timely
collection of fees, retaining teachers, and in complying with multiple regulations
Affordable private school owners know that parents generally judge quality of a school on
the basis of easily visible factors: Parents tend to assess ‘quality’ of the school on factors such
as 10th standard results, English language skills of the child, or the use of technology in the school

32 © FSG |
Contents
1 Scope and objectives of PIPE research on the APS
market in India
2 APS market in India
3 The APS business
4 Motivations of APS owner
5 Buying behavior of APS owner
6 ECE provision and pedagogy in an APS
7 Introduction to PIPE and FSG Inclusive Markets
8 Appendix
33 © FSG |
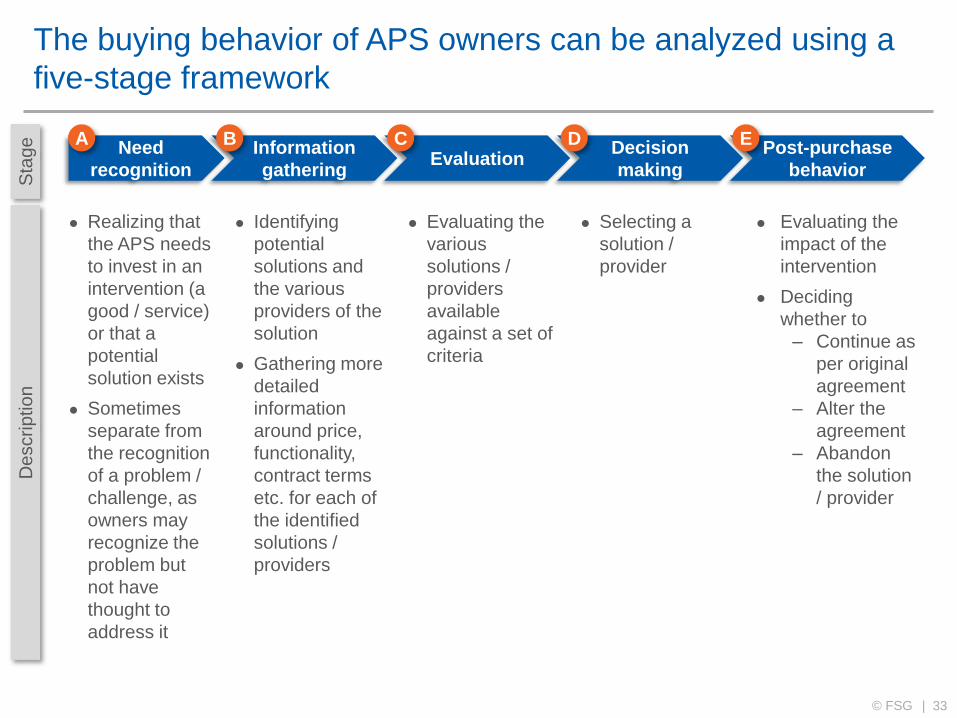
The buying behavior of APS owners can be analyzed using a
five-stage framework
Need
recognition
Information
gathering Evaluation
Decision
making
Post-purchase
behavior
Realizing that
the APS needs
to invest in an
intervention (a
good / service)
or that a
potential
solution exists
Sometimes
separate from
the recognition
of a problem /
challenge, as
owners may
recognize the
problem but
not have
thought to
address it
Identifying
potential
solutions and
the various
providers of the
solution
Gathering more
detailed
information
around price,
functionality,
contract terms
etc. for each of
the identified
solutions /
providers
Evaluating the
various
solutions /
providers
available
against a set of
criteria
Selecting a
solution /
provider
Evaluating the
impact of the
intervention
Deciding
whether to
– Continue as
per original
agreement
– Alter the
agreement
– Abandon
the solution
/ provider
Sta
ge
D
escrip
tio
n
A B C D E
34 © FSG |
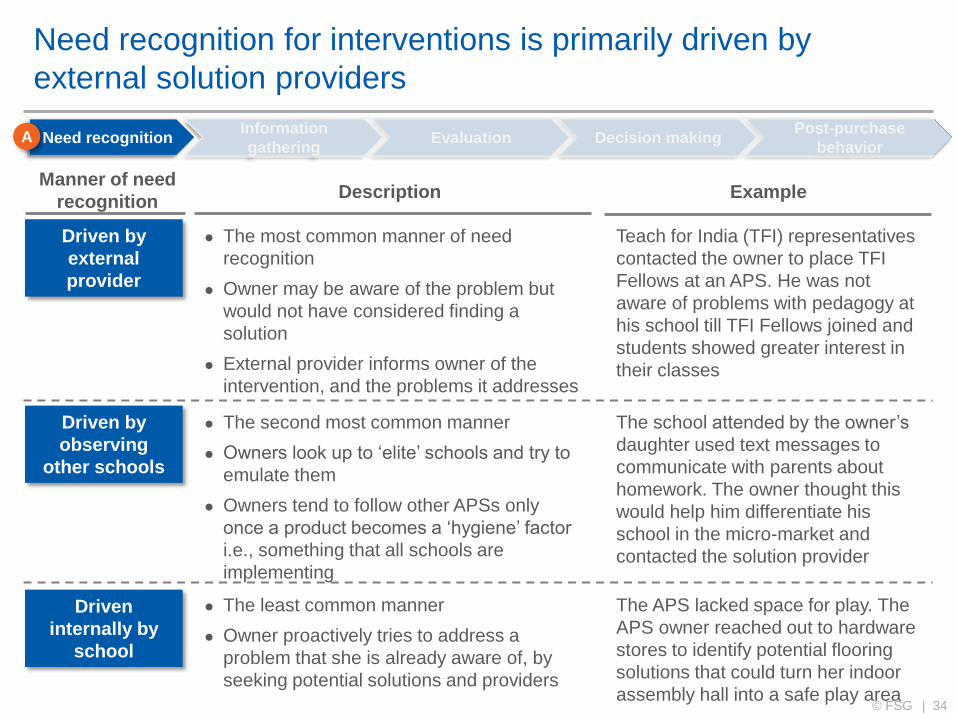
Need recognition for interventions is primarily driven by
external solution providers
Driven by
observing
other schools
Manner of need
recognition Description Example
Driven by
external
provider
Need recognition Information
gathering Evaluation Decision making
Post-purchase
behavior
The most common manner of need
recognition
Owner may be aware of the problem but
would not have considered finding a
solution
External provider informs owner of the
intervention, and the problems it addresses
Teach for India (TFI) representatives
contacted the owner to place TFI
Fellows at an APS. He was not
aware of problems with pedagogy at
his school till TFI Fellows joined and
students showed greater interest in
their classes
The second most common manner
Owners look up to ‘elite’ schools and try to
emulate them
Owners tend to follow other APSs only
once a product becomes a ‘hygiene’ factor
i.e., something that all schools are
implementing
The school attended by the owner’s
daughter used text messages to
communicate with parents about
homework. The owner thought this
would help him differentiate his
school in the micro-market and
contacted the solution provider
Driven
internally by
school
The least common manner
Owner proactively tries to address a
problem that she is already aware of, by
seeking potential solutions and providers
The APS lacked space for play. The
APS owner reached out to hardware
stores to identify potential flooring
solutions that could turn her indoor
assembly hall into a safe play area
A
35 © FSG |
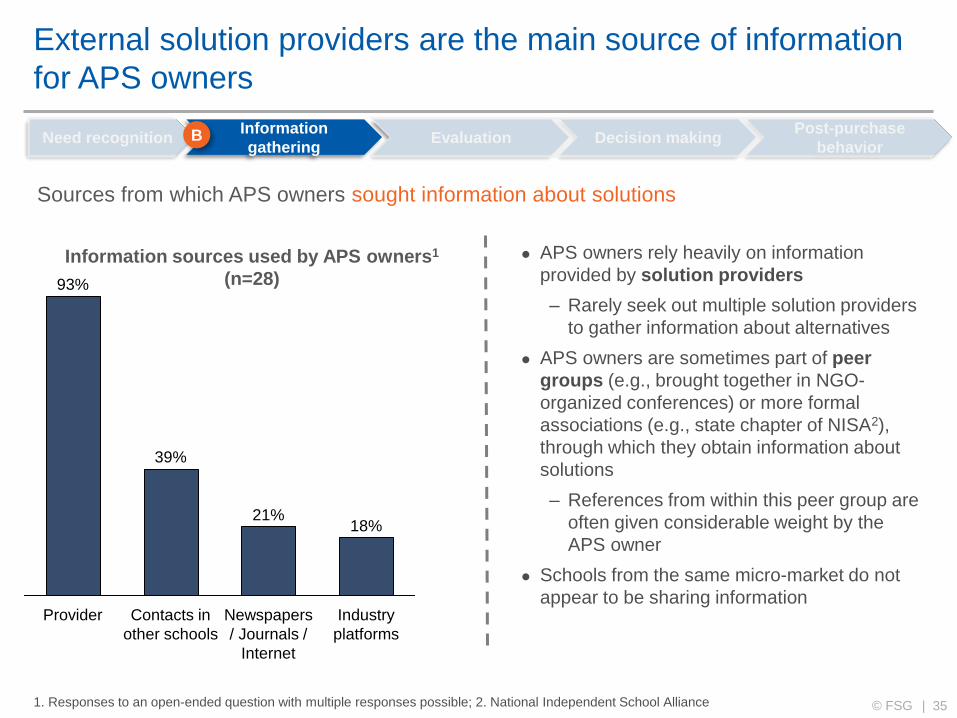
External solution providers are the main source of information
for APS owners
Contacts in
other schools
Provider
39%
21%
93%
Industry
platforms
Newspapers
/ Journals /
Internet
18%
Sources from which APS owners sought information about solutions
APS owners rely heavily on information
provided by solution providers
– Rarely seek out multiple solution providers
to gather information about alternatives
APS owners are sometimes part of peer
groups (e.g., brought together in NGO-
organized conferences) or more formal
associations (e.g., state chapter of NISA2),
through which they obtain information about
solutions
– References from within this peer group are
often given considerable weight by the
APS owner
Schools from the same micro-market do not
appear to be sharing information
1. Responses to an open-ended question with multiple responses possible; 2. National Independent School Alliance
Need recognition Information
gathering Evaluation Decision making
Post-purchase
behavior
Information sources used by APS owners1
(n=28)
B
36 © FSG |
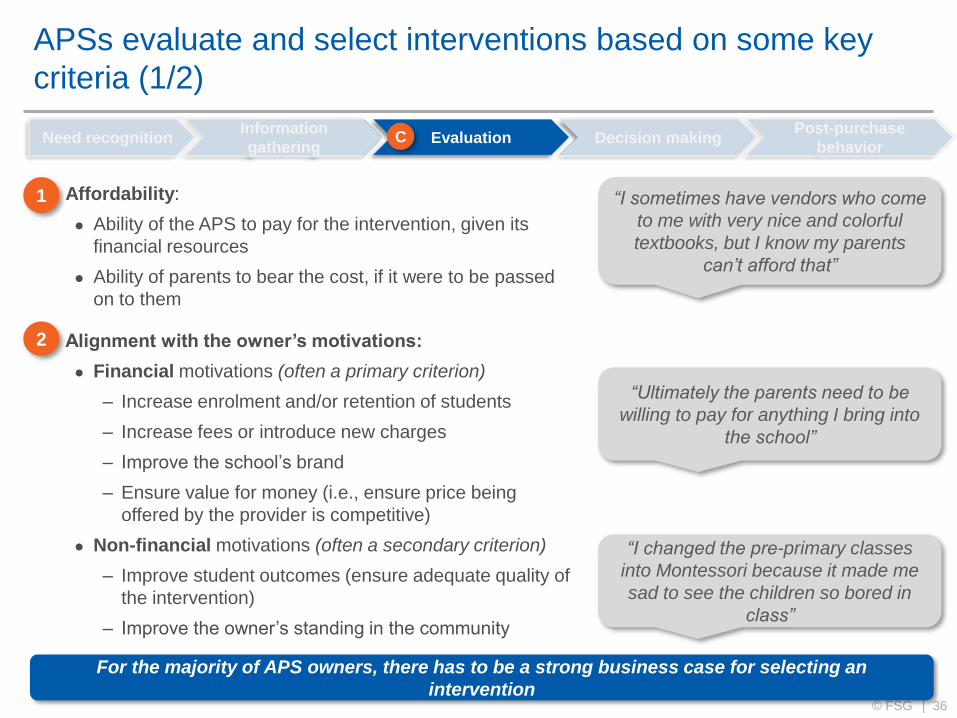
APSs evaluate and select interventions based on some key
criteria (1/2)
Affordability:
Ability of the APS to pay for the intervention, given its
financial resources
Ability of parents to bear the cost, if it were to be passed
on to them
1
2 Alignment with the owner’s motivations:
Financial motivations (often a primary criterion)
– Increase enrolment and/or retention of students
– Increase fees or introduce new charges
– Improve the school’s brand
– Ensure value for money (i.e., ensure price being
offered by the provider is competitive)
Non-financial motivations (often a secondary criterion)
– Improve student outcomes (ensure adequate quality of
the intervention)
– Improve the owner’s standing in the community
Need recognition Information
gathering Evaluation Decision making
Post-purchase
behavior
For the majority of APS owners, there has to be a strong business case for selecting an
intervention
“I sometimes have vendors who come
to me with very nice and colorful
textbooks, but I know my parents
can’t afford that”
“Ultimately the parents need to be
willing to pay for anything I bring into
the school”
“I changed the pre-primary classes
into Montessori because it made me
sad to see the children so bored in
class”
C
37 © FSG |
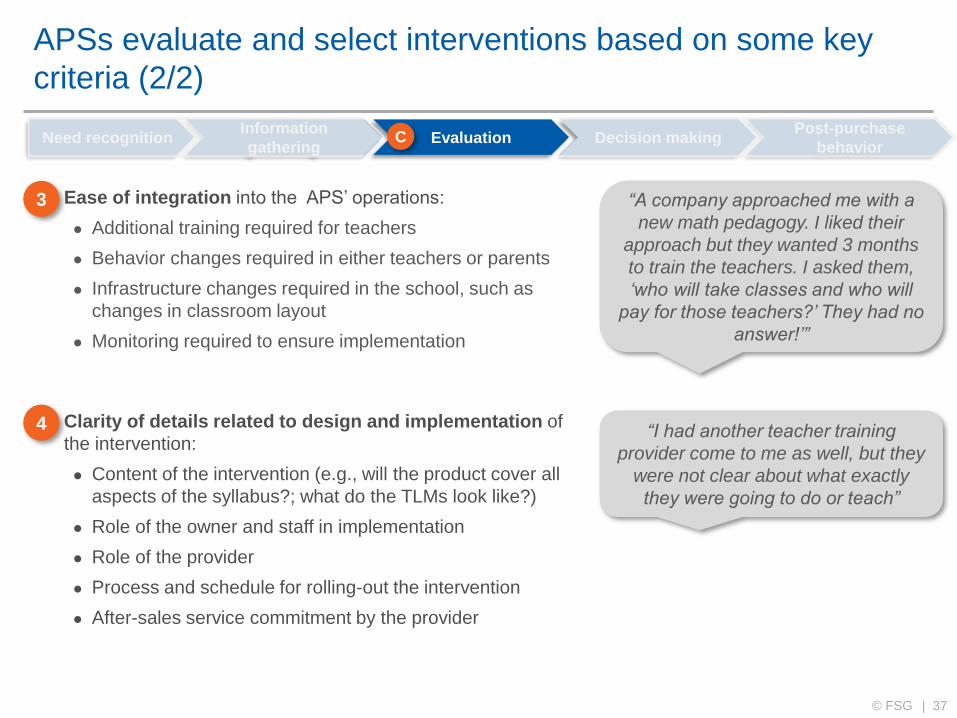
APSs evaluate and select interventions based on some key
criteria (2/2)
3
4
Ease of integration into the APS’ operations:
Additional training required for teachers
Behavior changes required in either teachers or parents
Infrastructure changes required in the school, such as
changes in classroom layout
Monitoring required to ensure implementation
Clarity of details related to design and implementation of
the intervention:
Content of the intervention (e.g., will the product cover all
aspects of the syllabus?; what do the TLMs look like?)
Role of the owner and staff in implementation
Role of the provider
Process and schedule for rolling-out the intervention
After-sales service commitment by the provider
Need recognition Information
gathering Evaluation Decision making
Post-purchase
behavior
“I had another teacher training
provider come to me as well, but they
were not clear about what exactly
they were going to do or teach”
“A company approached me with a
new math pedagogy. I liked their
approach but they wanted 3 months
to train the teachers. I asked them,
‘who will take classes and who will
pay for those teachers?’ They had no
answer!’”
C

38 © FSG |
The APS owner is often a unilateral decision maker on
adopting interventions
Need recognition Information
gathering Evaluation Decision making
Post-purchase
behavior
Decision maker Consulted Informed
Owner
Principal
Teacher
Parent
Unilaterally decides on
taking up an intervention
May shortlist vendors, or
provide advice on quality,
particularly for
interventions directly
related to academics
May raise concerns in
some cases, but owners
feel they can manage the
concerns if required
Expected to ensure
implementation
Expected to implement May provide some advice
if she is among the small
group of ‘trusted’ teachers
D

39 © FSG |
APS owners do not systematically assess impact on students
or teachers, but track parent perceptions
Parent perception is one of the most
important factors that determine the
school’s ability to increase revenue
Impact on parent perception is tracked
through three measures
– Informal feedback from parents
– Enrolment and retention numbers
– Ability to raise fees
…but track impact on parent perception
No consultations with teachers on
impact of intervention, unless there are
complaints from the teachers
No targets set for improvements in
student outcomes
Owners do not systematically track
impact on either students or teachers…
“The Abacus math class is a good product.
Parents tell me they are very happy with it”
“I was hoping the karate class would help
me reach a strength of 700 students. I
discontinued when that didn’t happen”
“I don’t know how the teachers are feeling
about the multimedia system – I need to ask
them”
“The company told me the abacus classes
will help with mental math - I’m sure it will
help in someway”
Need recognition Information
gathering Evaluation Decision making
Post-purchase
behavior E

40 © FSG |
Quality of after-sales service is a key factor when deciding
whether to continue with an intervention
A smart board vendor approached me some 3 years
ago and impressed me with the product. I paid INR
4,00,000 (~USD 6,000) for it
Need recognition Information
gathering Evaluation Decision making
Post-purchase
behavior
Illustration: Discontinued smart board service Illustration: Praise for strong after-sales service
He promised regular content updates and
troubleshooting support
After the first year, their after-sales service became
very poor. They took days to answer our calls
It was not worth the hassle anymore and I stopped
using their service last year
I purchased the spoken English program for my Sr.
KG, 1st , and 2nd grades some 6 years ago. It was
the ideal program
The company provided handholding and support in
implementing the program, including lesson
planning and training teachers
The trainer continued to come regularly to observe
the teachers and provide feedback
The company shut down, but I would have loved to
continue with them
E

41 © FSG |
Timing of decisions to purchase interventions
Curriculum
changes
An intervention which
replaces the text books,
on which weekly and
daily lessons are based
(e.g., an English program
that requires existing
classes to be replaced)
Timing of decision Rationale
5-6 months prior
to start of the
academic year
Description
Non-curriculum
changes
Smaller interventions
which supplement the
existing curriculum,
rather than replacing it
(e.g., a math program
that is run twice a week
in addition to the existing
math classes)
Ideally 2-3
months prior to
start of the
academic year
Much greater
flexibility to make
decisions
throughout the
year
Schools decide on a
publisher and give
out orders 5-6
months prior to start
of the academic year
School gets sufficient
time to plan for the
coming year
Publisher gets
sufficient time to fulfill
the order
Any required teacher
training can happen
in the 10 days prior to
the start of the
academic year
Limited training is
also possible
throughout the year
Intervention type

42 © FSG |
Examples of items that schools have invested in (1/2)
Quarterly instalments
of INR 100,000 (~USD
1,500)2 for 5 years (for
13 boards)
1. As mentioned by school owner
2. Assuming USD 1 = INR 65
Item Expenditure1 Description
Classroom(s) fitted with an
interactive board and
computer
– Used to deliver
educational content that
maps to the curriculum
Smart boards are a
hygiene factor in most
micro-markets, as almost
all schools within the fee
range tend to have one
Rationale
Smart
board
Annual cost of INR
400,000 (~USD
6,000)2 for 1st-10th
grade
Extra math classes,
taught using the Abacus
method
– Intended to improve the
students’ ability to
perform calculations
and do mental math
Math skills are valued by
parents
Program could help the
school differentiate itself
in the micro-market
Abacus
math class
One-time expense of
INR 1.8 million (~USD
28,000)2
New coat of paint
New flooring
Plumbing repairs
Electrical works
Building quality and level
of maintenance is
considered by parents as
a proxy for quality
Building
renovation
43 © FSG |
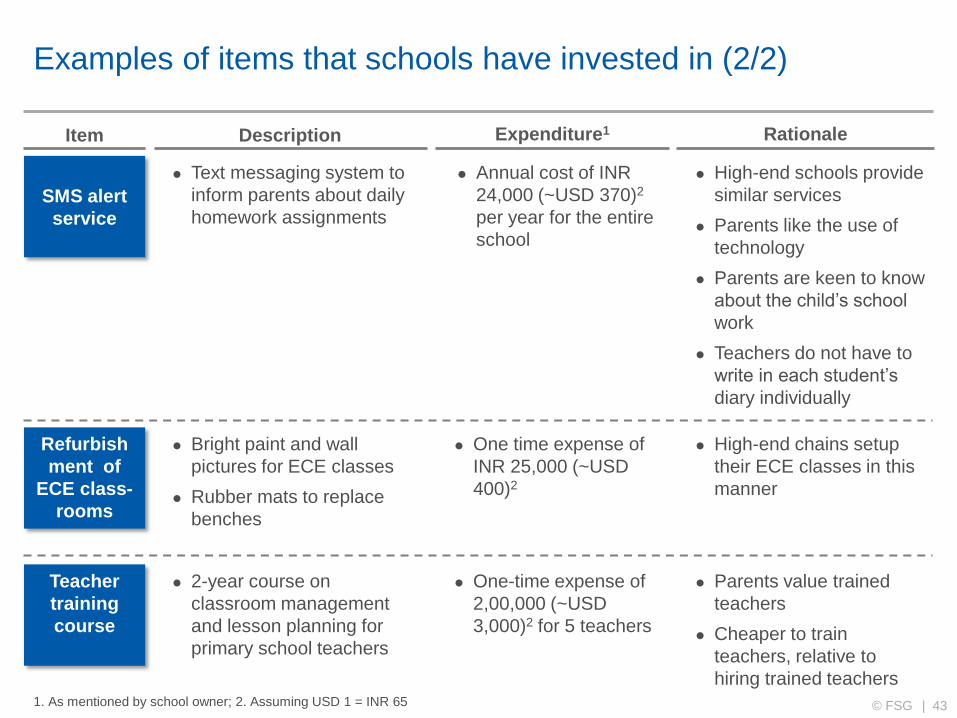
Examples of items that schools have invested in (2/2)
1. As mentioned by school owner; 2. Assuming USD 1 = INR 65
One time expense of
INR 25,000 (~USD
400)2
Bright paint and wall
pictures for ECE classes
Rubber mats to replace
benches
High-end chains setup
their ECE classes in this
manner
Refurbish
ment of
ECE class-
rooms
Item Expenditure1 Description Rationale
One-time expense of
2,00,000 (~USD
3,000)2 for 5 teachers
2-year course on
classroom management
and lesson planning for
primary school teachers
Parents value trained
teachers
Cheaper to train
teachers, relative to
hiring trained teachers
Teacher
training
course
Annual cost of INR
24,000 (~USD 370)2
per year for the entire
school
Text messaging system to
inform parents about daily
homework assignments
High-end schools provide
similar services
Parents like the use of
technology
Parents are keen to know
about the child’s school
work
Teachers do not have to
write in each student’s
diary individually
SMS alert
service
44 © FSG |
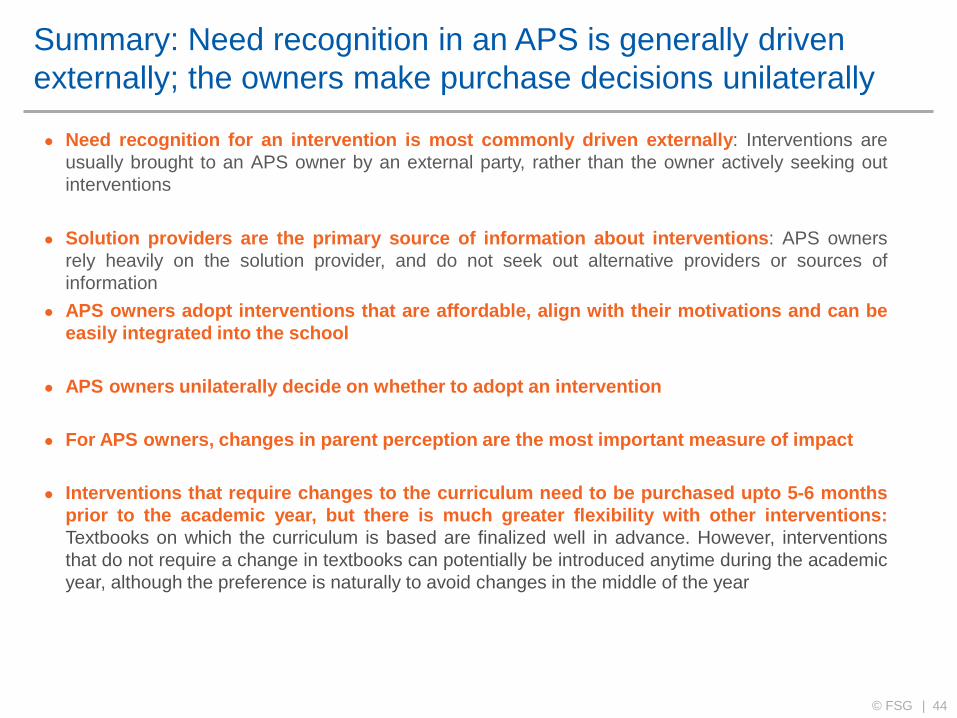
Summary: Need recognition in an APS is generally driven
externally; the owners make purchase decisions unilaterally
Need recognition for an intervention is most commonly driven externally: Interventions are
usually brought to an APS owner by an external party, rather than the owner actively seeking out
interventions
Solution providers are the primary source of information about interventions: APS owners
rely heavily on the solution provider, and do not seek out alternative providers or sources of
information
APS owners adopt interventions that are affordable, align with their motivations and can be
easily integrated into the school
APS owners unilaterally decide on whether to adopt an intervention
For APS owners, changes in parent perception are the most important measure of impact
Interventions that require changes to the curriculum need to be purchased upto 5-6 months
prior to the academic year, but there is much greater flexibility with other interventions:
Textbooks on which the curriculum is based are finalized well in advance. However, interventions
that do not require a change in textbooks can potentially be introduced anytime during the academic
year, although the preference is naturally to avoid changes in the middle of the year
45 © FSG |
Contents
1 Scope and objectives of PIPE research on the APS
market in India
2 APS market in India
3 The APS business
4 Motivations of APS owner
5 Buying behavior of APS owner
6 ECE provision and pedagogy in an APS
7 Introduction to PIPE and FSG Inclusive Markets
8 Appendix

46 © FSG |
ECE classes are setup in a manner very similar to other
classes…
Fixed benches and desks in all KG classes
More flexible seating arrangements in the Nursery
section in roughly a third of schools (but not the KG
sections)
– Some owners believe Nursery aged children
require more space
Lack of teaching-learning-materials
Drab walls
Hard concrete floors
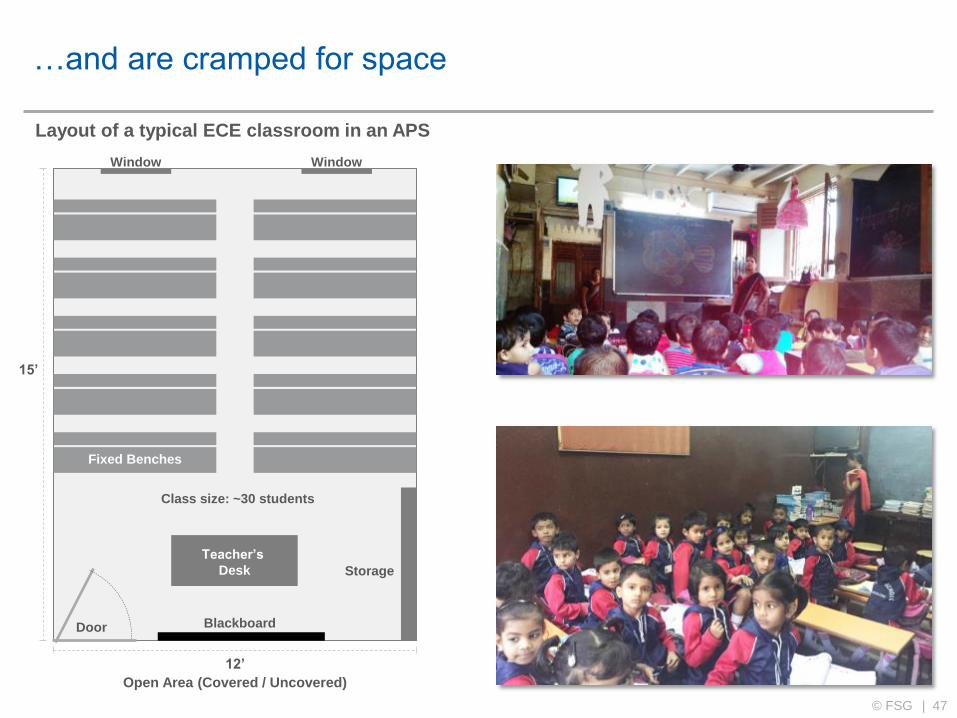
47 © FSG |
…and are cramped for space
Teacher’s
Desk Storage
Blackboard Door
Window Window
Fixed Benches
15’
12’
Open Area (Covered / Uncovered)
Layout of a typical ECE classroom in an APS
Class size: ~30 students

48 © FSG |
The approach to teaching in ECE classes is similar to other
classes, and is often not developmentally appropriate…
Teacher-directed rote learning
– Students intone words, sentences, rhymes
and numerals – mimicking the teacher
– Students write letters or words by copying
from the board, or tracing on work books
Lessons are repetitive, with the same material
covered several times in the same manner
Little time for play or activities
Open ended conversation or questioning is
often discouraged

49 © FSG |
…but the flexibility in curriculum and pedagogy provides an
opportunity for developmentally appropriate ECE
There is no regulation
stipulating the ECE
curriculum to be followed
Topics to be covered in
the year are determined
by the textbook that is
selected
Schools have complete
autonomy in selecting
textbooks, and can
change the selection
every year
Curriculum Pedagogy Monitoring
Teachers decide how a
particular topic should be
taught in class, and often
have complete autonomy
Teachers rely on
previous experience or
suggestions from other
teachers on how to teach
a lesson
Classes have no formal
lesson plans
There are no in-class
observations
Many schools require
teachers to maintain a
daily diary of topics
covered in class
Teachers are not
required to report how
they taught the topic
“State board prescribes syllabus
for Grade 1 and above. For pre-
primary we teach what is in the
textbook”
“The Principal gives me term-
wise targets and I break them
down into number of pages to
cover daily. I am free to teach in
the manner I think is right”
“After classes every day, I record
the topics taught for each
subject in a daily diary and
submit it to the Principal every
Monday”
50 © FSG |
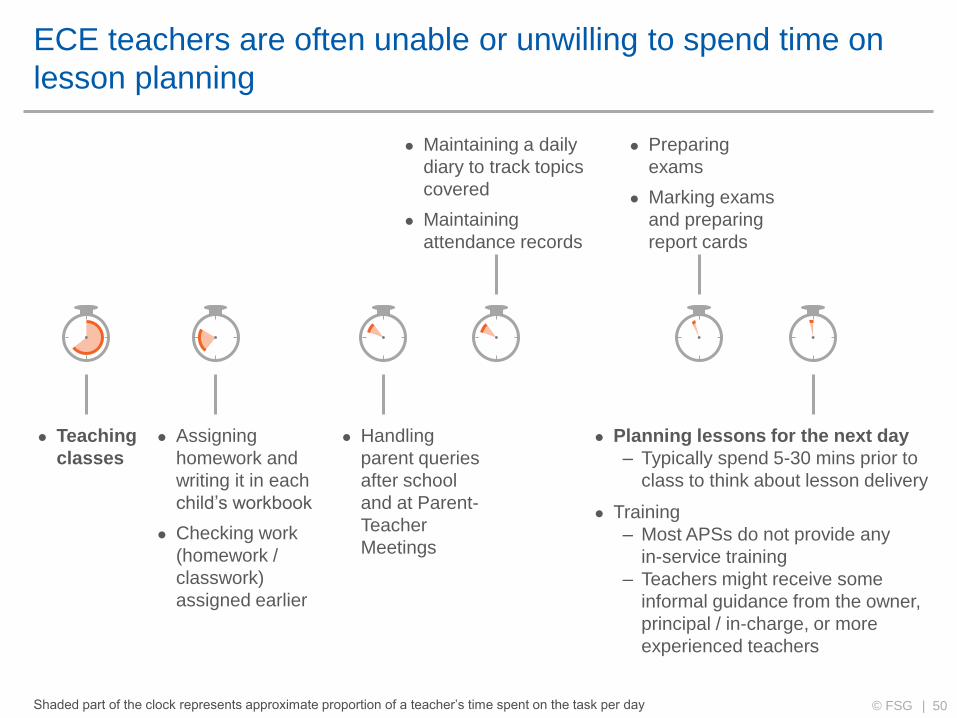
ECE teachers are often unable or unwilling to spend time on
lesson planning
Shaded part of the clock represents approximate proportion of a teacher’s time spent on the task per day
Teaching
classes
Handling
parent queries
after school
and at Parent-
Teacher
Meetings
Preparing
exams
Marking exams
and preparing
report cards
Planning lessons for the next day
– Typically spend 5-30 mins prior to
class to think about lesson delivery
Training
– Most APSs do not provide any
in-service training
– Teachers might receive some
informal guidance from the owner,
principal / in-charge, or more
experienced teachers
Maintaining a daily
diary to track topics
covered
Maintaining
attendance records
Assigning
homework and
writing it in each
child’s workbook
Checking work
(homework /
classwork)
assigned earlier

51 © FSG |
Summary: ECE and primary classes are setup and conducted in
a similar manner, although the ECE curriculum is more flexible
ECE classes are setup and conducted in a manner very similar to other classes : There are
fixed benches for seating; and a teacher-directed, rote learning approach to teaching
The curriculum and pedagogy for the ECE section are very flexible: The topics to be covered
for the year depend on the textbook chosen by the school; and teachers are given autonomy in how
they teach the topic
Teachers spend very little time planning lessons: Most of the teacher’s time is spent on teaching
the class, followed by tasks such as assigning and checking homework, marking attendance and
following up on due fees. Teachers typically spend 5-30 minutes planning for the next day’s lessons,
and almost no time is devoted to training

52 © FSG |
Contents
1 Scope and objectives of PIPE research on the APS
market in India
2 APS market in India
3 The APS business
4 Motivations of APS owner
5 Buying behavior of APS owner
6 ECE provision and pedagogy in an APS
7 Introduction to PIPE and FSG Inclusive Markets
8 Appendix
53 © FSG |
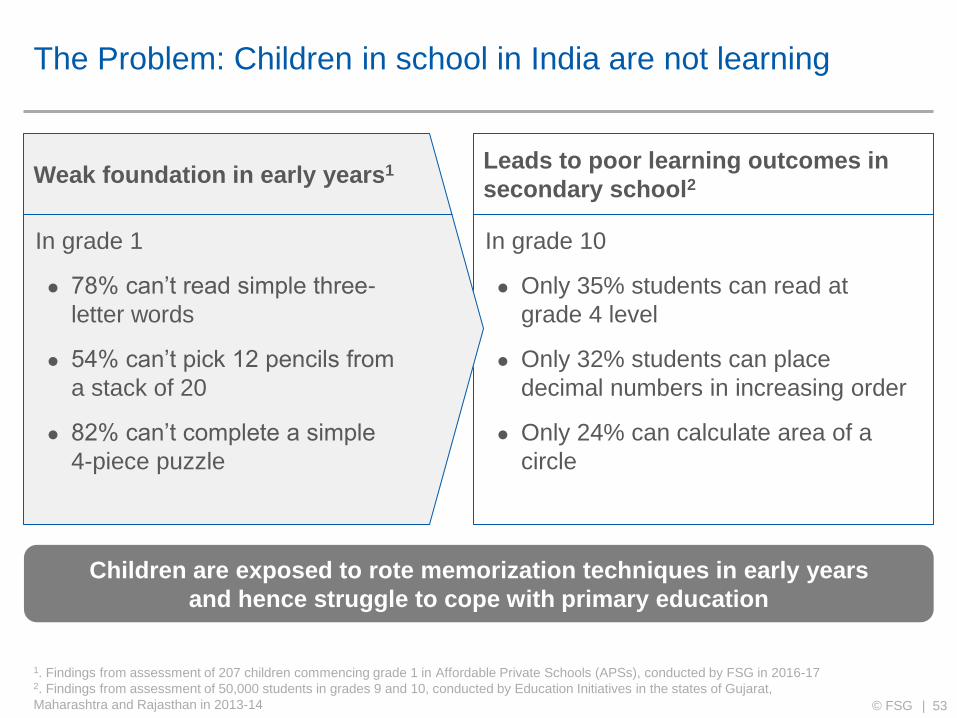
The Problem: Children in school in India are not learning
1. Findings from assessment of 207 children commencing grade 1 in Affordable Private Schools (APSs), conducted by FSG in 2016-17 2. Findings from assessment of 50,000 students in grades 9 and 10, conducted by Education Initiatives in the states of Gujarat,
Maharashtra and Rajasthan in 2013-14
In grade 10
Only 35% students can read at
grade 4 level
Only 32% students can place
decimal numbers in increasing order
Only 24% can calculate area of a
circle
Leads to poor learning outcomes in
secondary school2 Weak foundation in early years1
In grade 1
78% can’t read simple three-
letter words
54% can’t pick 12 pencils from
a stack of 20
82% can’t complete a simple
4-piece puzzle
Children are exposed to rote memorization techniques in early years
and hence struggle to cope with primary education

54 © FSG |
2
4
86% of children from urban, low-income families are exposed
to pedagogically inappropriate “rote” techniques
1. IRS 2014, The research selected households belonging to socioeconomic classes A3-D1 according to the New Consumer
Classification I 2- FSG research. Percentage of parents of 4 and 5 year olds enrolled in a private educational institution. Assumes that
those in non-APS private preprimary classes will transition on to grade one at an APS I 3-1- e.g., the teacher would stand in front of the
class and ask children to memorize “A for Apple, B for Bat, C for Cat ...”
Low-income families
aspire and are willing
to pay for “quality
education” for their
children
86% of children from
low-income
households in urban
India attend
affordable private
schools (APSs)2
1
Low-income families
constitute ~70% of
urban India1
APSs use
pedagogically in-
appropriate “rote”
teaching techniques 3
3

55 © FSG |
The Solution: Adopting activity based learning in early years
can provide the right educational foundation to succeed in life
1. J. Heckman and D. Masterov, The Productivity Argument for Investing in Young Children, Working Paper 5, Invest in Kids Working
Group, Committee for Economic Development. 2004I 2- M. Hohmann, D.P. Weikart, ‘Educating Young Children: Active Learning
Practices for Preschool and Child Care Programs’, Early Childhood Counts: Programming Resources for Early Childhood Care and
Development. The Consultative Group on ECCD. World Bank. 1999
Nobel laureate James Heckman
highlighted that return on investments
in early years are highest compared to
remedial programs later1
Activity based learning is the right
pedagogy2 in teaching children in the
early years and giving them a solid
foundation
Why focus on the early years?
Why focus on activity based
learning?
56 © FSG |
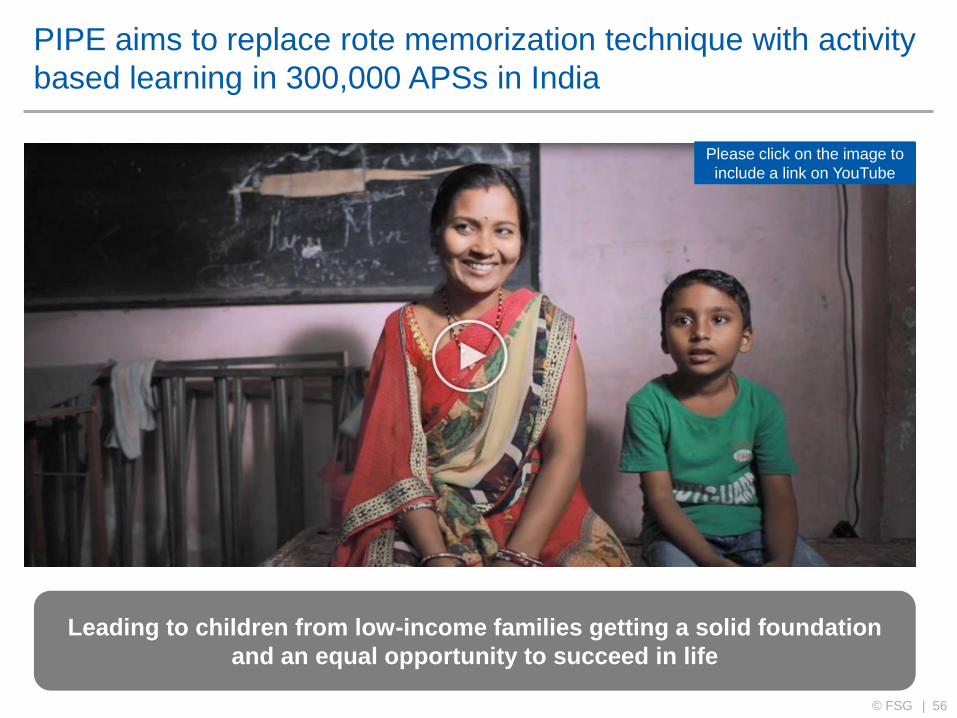
PIPE aims to replace rote memorization technique with activity
based learning in 300,000 APSs in India
Please click on the image to
include a link on YouTube
Leading to children from low-income families getting a solid foundation
and an equal opportunity to succeed in life
57 © FSG |
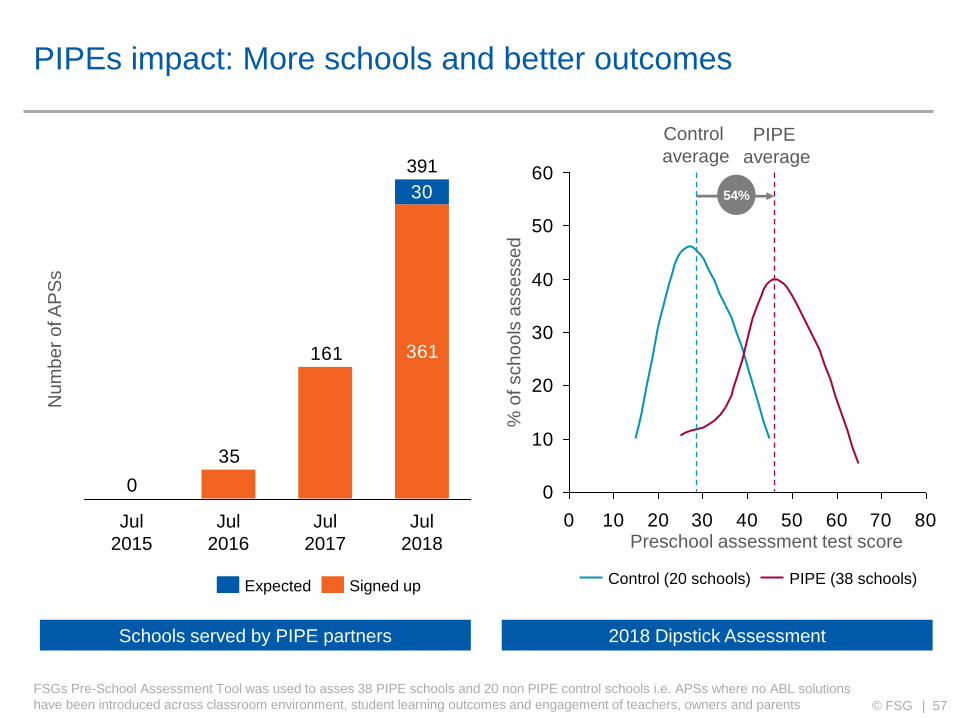
PIPEs impact: More schools and better outcomes
FSGs Pre-School Assessment Tool was used to asses 38 PIPE schools and 20 non PIPE control schools i.e. APSs where no ABL solutions
have been introduced across classroom environment, student learning outcomes and engagement of teachers, owners and parents
2018 Dipstick Assessment
0
10
20
30
40
50
60
0 10 20 30 40 50 60 70 80Preschool assessment test score
% o
f sch
oo
ls a
sse
sse
d
PIPE
average
Control
average
PIPE (38 schools) Control (20 schools)
54%
Schools served by PIPE partners
Nu
mb
er
of A
PS
s
161
35
361
30
0
Jul
2018
Jul
2016
Jul
2017
Jul
2015
391
Signed up Expected

58 © FSG |
Our efforts are supported by
To learn more about our work please visit www.fsg.org/pipe

59 © FSG |
Our team* brings together strategic, educational, and
operational experience and expertise
* The team shown here is representative of the PIPE team for 2018-19
Vikram Jain
Program Lead Leads the PIPE program
15 years of strategy, operations and
consulting experience
Worked with Monitor Inclusive Markets,
McKinsey and Deloitte
MBA, London Business School
Lakshmi Narayanan G
Field Team, Bangalore 7 years of work experience, with
extensive experience in the education
space in Bangalore
MA-Development, Azim Premji
University
Gauri Kirtane
Quality Team Over 10 years of experience in education
leadership, with a focus on teaching, learning and curriculum design
Most recently, Education Manager for more than 35 centers and 1200 students at the Akanksha Foundation
EdD, University of Pennsylvania
Sana Kazi
Program Team 6 years of consulting experience in the
education sector Worked with PwC, Center for Civil
Society and Goldman Sachs MPA, LSE
Sriramprasad Rangarajan
Partner Team 6 years of operations and consulting
experience in India and Africa
Launched an employability assessment
tool that has been commissioned on
30,000 +candidates
Worked with HCL, PwC and Athena
MSc Operations Research, LSE
Total team size: 14
Roles and responsibilities:
Partner team: Capacity building of partners, Best
practice development
Quality team: Monitoring in schools , Best practice
development
Program team: Dissemination and program
management
Field team: Monitoring in schools

60 © FSG |
FSG is a mission driven non-profit (501 c3) focused on Scale
Social Impact
We are well known for having
pioneered innovative
approaches
Low-income
housing
Catalytic Philanthropy Philanthropy that considers the big picture
Inclusive Markets Creating markets that work for everyone
Shared Value Creating business value and social value
Collective Impact Organizing around common goals
Early Childhood
Education
We use these approaches to
help global leaders create
impact and promote their
effective use
We leverage these approaches
to run initiatives that create
scale sustainable impact 100,000
Opportunities
Initiative

61 © FSG |
FSG Inclusive Markets (FSG IM) believes that markets can
and should benefit the poor
We believe that markets should be part of the portfolio of solutions for social change.
Our strength is in understanding how to make inclusive business models work, and how to get them to scale.
We create impact in various program areas by:
driving new thinking for the field, and
making change happen on the ground.
We are a “mission driven” and non-profit unit whose work is entirely public domain.

62 © FSG |
Contents
1 Scope and objectives of PIPE research on the APS
market in India
2 APS market in India
3 The APS business
4 Motivations of APS owner
5 Buying behavior of APS owner
6 ECE provision and pedagogy in an APS
7 Introduction to PIPE and FSG Inclusive Markets
8 Appendix

63 © FSG |
NCCS (New Consumer Classification System)
Items included in this list are – (1) electricity connection (2) ceiling fan (3) LPG stove (4) two-wheeler (5) color TV (6) refrigerator (7)
washing machine (8) personal computer/laptop (9) car/jeep/van (10) air conditioner (11) agricultural land
NCCS is used to classify households into socio-economic classes
The classification is based on two variables:
– Education level of the chief wage earner
– Number of consumer goods owned by the household from a predefined list of
11 durables1
There are 12 classes in the NCCS ranging from A1 to E3
– A1 being the most educated class with the most household goods
NCCS was launched in 2009 as an update to the previously used SEC (Socio-
Economic Classification) system
It was developed by Market Research Society of India (MRSI) and Media Research
Users Council (MRUC)
Definition
Background
64 © FSG |
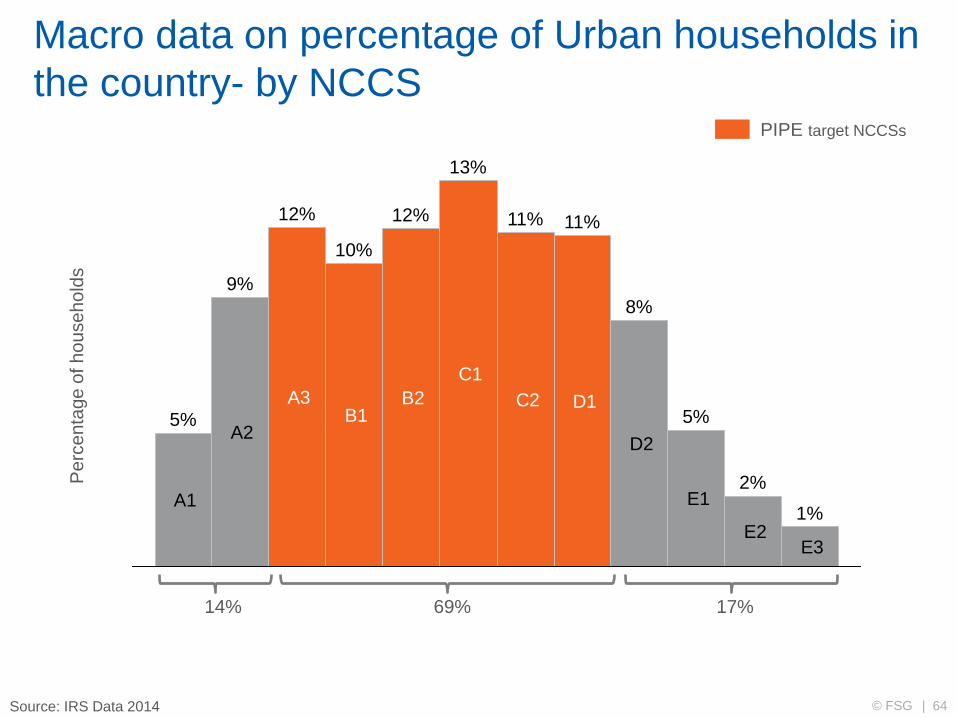
Macro data on percentage of Urban households in
the country- by NCCS
5%
11%
13%
11%
8%
2%
12%
1%
10%
5%
9%
12%
E3 E2
E1
D2
D1 C2
C1
B2 B1
A3
A2
A1
69% 14% 17%
Source: IRS Data 2014
Pe
rce
nta
ge
of h
ou
se
ho
lds
PIPE target NCCSs
65 © FSG |