Embed Size (px)
Citation preview
Understanding Teacher Retention and Mobility in Washington State
Final Report
Prepared for the Office of Superintendent of Public Instruction
Ana M. Elfers Margaret L. Plecki
Anna Van Windekens
University of Washington College of Education
Center for the Study of Teaching and Policy
January 2017
i
UnderstandingTeacherRetentionandMobilityinWashingtonState
TableofContentsExecutiveSummary………………………………………………………………………….…………….…ivI.BackgroundontheTeacherRetentionandMobility…………………………………………1
A. StudyContext…………………………………………………………………………………….1B. RelevantLiterature……………………………………………………………………….……1
II.ResearchApproachandMethods……………………………………………………………………4
A. ResearchQuestions……………………………………………………………………………4B. Methodology,DataSources,ProgrammingandAnalyses………………………4C. DefinitionofTermsandMethodologicalNotes……………………………………..5D. StudyLimitations……………………………………………………………………………….6E. ReportOrganization……………………………………………………………………………6
III.Findings…………………………………………………………………………………………………….….6
A. TrendsinStatewideTeacherCharacteristics…………………………………….…61) DemographicCharacteristicsofTeachers………………………………………62) VariationinTeacherPlacementbyRegionalDistributionandSchool
Context………………………………………………………………………………….…….133) TeachersNewtotheProfession………………………………………………….…15
B. TrendsinStatewideRetentionandMobilityofTeachers……………………..161) StatewideRetentionandMobilityTrendsAcrossFive‐YearTime
Periods………………………………………………………………………………….…….172) Year‐by‐YearRetentionandMobilityTrends………………………………...19
C. FactorsInfluencingTeacherRetentionandMobility……………………………231) TeacherExperience……………..…...…………………………………………….…….232) ExitersinRelationtoAge……..……………………………………………………….243) StatisticalModelsofRetentionandMobilityforAllTeachers
Statewide…………………………………………………………………………….………25 D. StatisticalModelsofRetentionandMobilityforBeginningTeachers…...32
1) SchoolCharacteristicsofBeginningTeachers…….…….…………………....332) StatisticalModelsofBeginningTeacherRetentionandMobility.……34
IV.ConclusionsandDiscussion……………………………………………………….…………….……41References…………………………………………………………………………………………………….…..44Appendices…………………………………………………………………………………….………………….48
ii
ListofTablesandChartsTablesTable1:CharacteristicsofWashingtonTeacherWorkforce:TrendDataTable2:PercentChangeinTeacherPopulationbyRace/Ethnicity,Select
WashingtonDistrictswithStudentEnrollmentsof10,000orMoreTable3:RegionalDistributionandCharacteristicsofWashingtonTeachers(2015‐
16)Table4:TrendDataforFirstandSecondYearTeachersTable5:CharacteristicsofAllBeginningTeachersStatewide:2010‐11to2015‐16Table6:StatewideTeacherRetentionandMobility:FiveYearTrendDataTable7:TeacherRetentionandMobilityinSelectWashingtonDistrictswithStudent
Enrollmentof10,000orMoreAfterFiveYears(2011‐12to2015‐16)Table8:StatewideBeginningTeacherRetention:Five‐YearTrendDataTable9:BeginningTeacherRetentionbyESD(FiveYearTrendData:2010‐11to
2014‐15)Table10:StatewideYear‐by‐YearTeacherRetentionandMobilityTrendDataTable11:StatewideBeginningTeacherYear‐by‐YearRetentionandMobilityTrend
DataTable12:StatewideTrendData:SummaryofTeacherExitersbyExperienceinFirst
10YearsTable13:StatewideTrendData:TeacherExitersAge55orOlderandAge60or
OlderTable14:StatewideRetentionandMobilityOutcomesforTwoFive‐YearTime
PeriodsTable15:SignificantPredictorsofTeacherExitOutcome:RelativeRiskRatiosTable16:SchoolGradeLevelDefinitionsandProportionsofTeachersbySchool
LevelsTable17:SignificantPredictorsofTeacherMobilityOutofDistrictOutcome: RelativeRiskRatiosTable18:SignificantPredictorsofTeacherMobilityWithinDistrictOutcome: RelativeRiskRatiosTable19:SchoolCharacteristicsofBeginningTeachersStatewidein2010‐11Table20:StatewideRetentionandMobilityOutcomesforBeginningTeachersfor
TwoFive‐YearTimePeriodsTable21:SignificantPredictorsofBeginningTeacherExitOutcome:RelativeRisk RatiosTable22:ProportionofBeginningTeachersbySchoolGradeLevelAssignmentTable23:SignificantPredictorsofBeginningTeacherMobilityOutofDistrict
Outcome:RelativeRiskRatiosTable24:SignificantPredictorsofBeginningTeacherMobilityWithinDistrict
Outcome:RelativeRiskRatios
iii
ChartsChart1:PercentStudentRace/EthnicityinWashingtonStatein2015‐16Chart2:PercentTeacherRace/EthnicityinWashingtonStatein2015‐16Chart3:WashingtonTeacherWorkforceAgeDistributionover20YearsChart4:WashingtonTeacherWorkforceExperienceDistributionover20YearsChart5:StatewideTeacherRetentionbyExperience:AfterFiveYears(2011‐12to
2015‐16)Chart6:TeacherExitersbyAgein2014‐15AppendicesAppendixA:DemographicCharacteristicsofWashingtonTeacherWorkforce:
2005/06to2014/15AppendixB:CharacteristicsofAllBeginningTeachersStatewidefrom2010‐11to
2015‐16AppendixC:StatewideTrendDataTeacherExitersbyExperienceinFirst10YearsAppendixD:MultinomiallogisticregressionSTATAoutputfortheFive‐YearPeriod 2010‐11to2014‐15
AppendixE:MultinomiallogisticregressionSTATAoutputfortheFive‐YearPeriod 2011‐12to2015‐16
AppendixF:Beginningteachers’multinomiallogisticregressionSTATAoutputfor theFive‐YearPeriod2010‐11to2014‐15
AppendixG:Beginningteachers’multinomiallogisticregressionSTATAoutputfor theFive‐YearPeriod2011‐12to2015‐16
iv
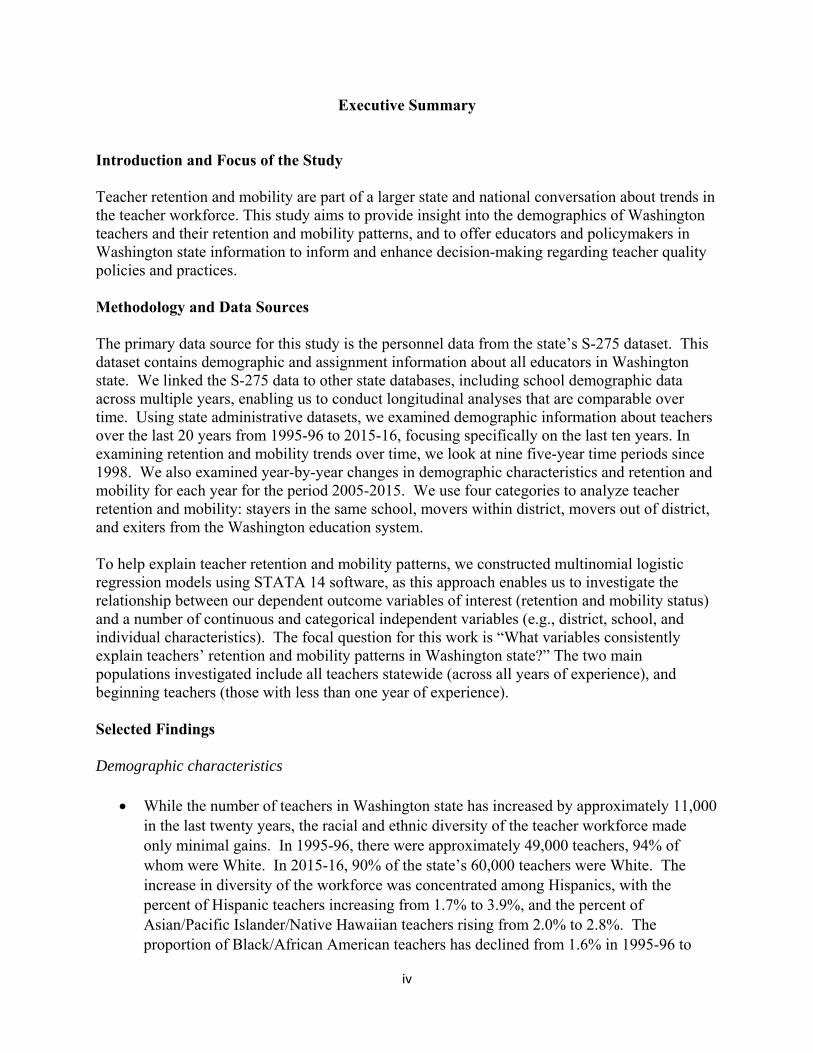
Executive Summary Introduction and Focus of the Study Teacher retention and mobility are part of a larger state and national conversation about trends in the teacher workforce. This study aims to provide insight into the demographics of Washington teachers and their retention and mobility patterns, and to offer educators and policymakers in Washington state information to inform and enhance decision-making regarding teacher quality policies and practices. Methodology and Data Sources The primary data source for this study is the personnel data from the state’s S-275 dataset. This dataset contains demographic and assignment information about all educators in Washington state. We linked the S-275 data to other state databases, including school demographic data across multiple years, enabling us to conduct longitudinal analyses that are comparable over time. Using state administrative datasets, we examined demographic information about teachers over the last 20 years from 1995-96 to 2015-16, focusing specifically on the last ten years. In examining retention and mobility trends over time, we look at nine five-year time periods since 1998. We also examined year-by-year changes in demographic characteristics and retention and mobility for each year for the period 2005-2015. We use four categories to analyze teacher retention and mobility: stayers in the same school, movers within district, movers out of district, and exiters from the Washington education system. To help explain teacher retention and mobility patterns, we constructed multinomial logistic regression models using STATA 14 software, as this approach enables us to investigate the relationship between our dependent outcome variables of interest (retention and mobility status) and a number of continuous and categorical independent variables (e.g., district, school, and individual characteristics). The focal question for this work is “What variables consistently explain teachers’ retention and mobility patterns in Washington state?” The two main populations investigated include all teachers statewide (across all years of experience), and beginning teachers (those with less than one year of experience). Selected Findings Demographic characteristics
While the number of teachers in Washington state has increased by approximately 11,000 in the last twenty years, the racial and ethnic diversity of the teacher workforce made only minimal gains. In 1995-96, there were approximately 49,000 teachers, 94% of whom were White. In 2015-16, 90% of the state’s 60,000 teachers were White. The increase in diversity of the workforce was concentrated among Hispanics, with the percent of Hispanic teachers increasing from 1.7% to 3.9%, and the percent of Asian/Pacific Islander/Native Hawaiian teachers rising from 2.0% to 2.8%. The proportion of Black/African American teachers has declined from 1.6% in 1995-96 to

v
1.2% in 2015-16. The proportion of Native American teachers also declined slightly from 0.8% to 0.7% in the last twenty years.
The proportion of teachers over the age of 50 continued to rise from 20% in 1995, until it peaked at 36% in 2011. Since then, the proportion of older teachers has gradually declined to 32% in 2015.
The number of teachers in their first and second year of experience has more than
doubled in the last six years (2010-11 to 2015-16). Statewide trends in retention and mobility across five-year time periods
Nearly 60% of Washington teachers are located in the same school after five years, and this retention rate has changed little in nearly 15 years. Of the remaining teachers, 14% move to other schools within their district and 7% relocate to another district within the state. Approximately 20% of teachers exit the workforce after five years, and many of these teachers are of retirement age.
While the statewide portrait reveals considerable stability, the rates of teacher retention and mobility for individual districts often vary considerably. In a sample of 10 districts with student enrollment above 10,000, the percent of teachers who stayed in their same schools after five years ranged from 45% to 62%.
Across 4 five-year time periods examined, the retention rate of beginning teachers (those with less than one year of experience), in the same school ranged between 42% and 47%. A higher proportion of beginning teachers move within and out of their districts, as compared to all teachers statewide. However, the rate of beginning teachers exiting the Washington workforce has declined in the most recent fiveyear period to a low of 21%, similar to all teachers statewide.
During the five-year period from 201011 to 201415, ESDs 112 and 123 had the highest rates of beginning teachers who stayed in their schools, while ESDs 171, 105, and 114 had the highest rates of beginning teachers who exited from the Washington education system.
Novice teachers (04 years of experience) and veteran teachers (25 or more years of
experience) stay in their schools at lower rates (47% and 48%, respectively), than midexperience teachers (514 years, 60%, and 1514 years, 64%). Veteran teachers have the highest rates of exiting (44%), compared with 20% of novices, and 13% and 19% of midexperience teachers.
Year-by-year retention and mobility trends (10 years, 2005-06 to 2015-16)
From one year to the next, on average 84% of all teachers statewide are retained in their same school, 7% move to another school within the district, and 2% change districts.
vi
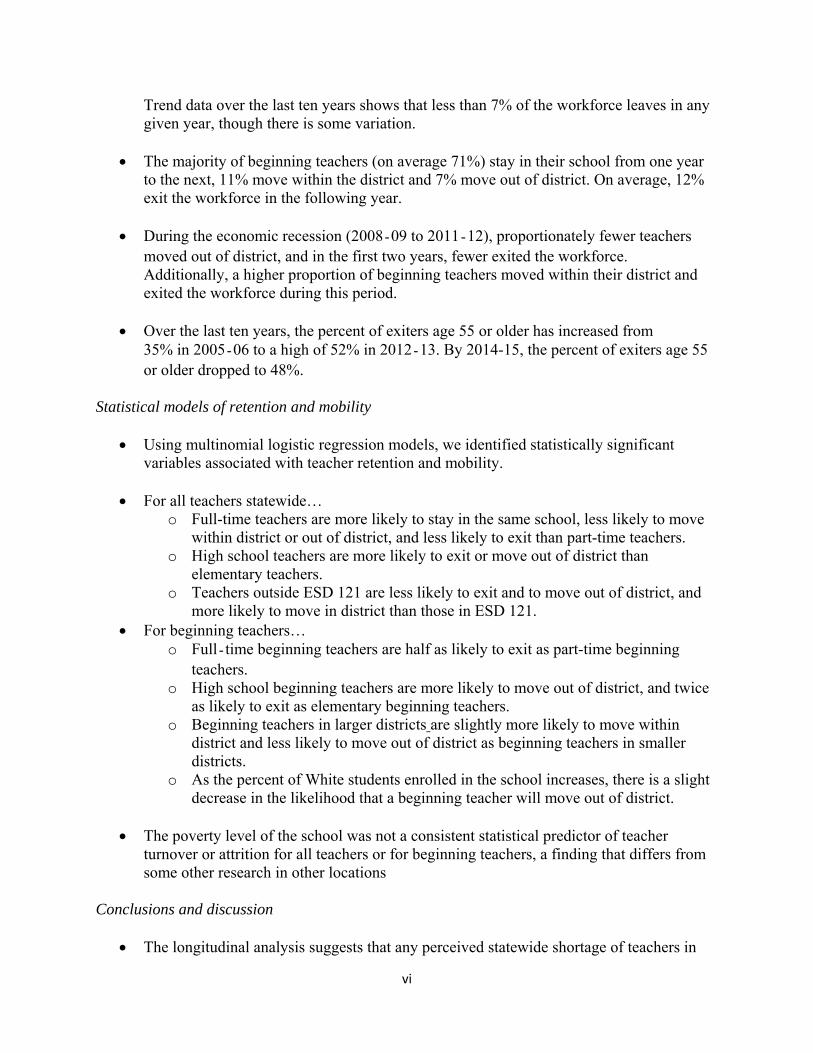
Trend data over the last ten years shows that less than 7% of the workforce leaves in any given year, though there is some variation.
The majority of beginning teachers (on average 71%) stay in their school from one year to the next, 11% move within the district and 7% move out of district. On average, 12% exit the workforce in the following year.
During the economic recession (200809 to 201112), proportionately fewer teachers moved out of district, and in the first two years, fewer exited the workforce. Additionally, a higher proportion of beginning teachers moved within their district and exited the workforce during this period.
Over the last ten years, the percent of exiters age 55 or older has increased from 35% in 200506 to a high of 52% in 201213. By 2014-15, the percent of exiters age 55 or older dropped to 48%.
Statistical models of retention and mobility
Using multinomial logistic regression models, we identified statistically significant variables associated with teacher retention and mobility.
For all teachers statewide… o Full-time teachers are more likely to stay in the same school, less likely to move
within district or out of district, and less likely to exit than part-time teachers. o High school teachers are more likely to exit or move out of district than
elementary teachers. o Teachers outside ESD 121 are less likely to exit and to move out of district, and
more likely to move in district than those in ESD 121. For beginning teachers…
o Fulltime beginning teachers are half as likely to exit as part-time beginning teachers.
o High school beginning teachers are more likely to move out of district, and twice as likely to exit as elementary beginning teachers.
o Beginning teachers in larger districts are slightly more likely to move within district and less likely to move out of district as beginning teachers in smaller districts.
o As the percent of White students enrolled in the school increases, there is a slight decrease in the likelihood that a beginning teacher will move out of district.
The poverty level of the school was not a consistent statistical predictor of teacher turnover or attrition for all teachers or for beginning teachers, a finding that differs from some other research in other locations
Conclusions and discussion
The longitudinal analysis suggests that any perceived statewide shortage of teachers in
vii
recent years is not due to recent changes in the statewide retention or attrition of teachers.
There is no evidence to support the “myth” that “half of all beginning teachers leave the profession within five years” in Washington state. In Washington state, on average over the past 20 years, one quarter of beginning teachers exit the state system, either permanently or temporarily after five years. In fact, the rate of beginning teachers exiting the Washington workforce has declined in the most recent five-year period to a point where it is similar to all teachers statewide.
Very little progress has been made in the past 20 years in improving the diversity of the teacher workforce. Of particular concern is the decrease in the proportion of Black/African-American teachers statewide. State policies aimed at improving teacher diversity certainly seem indicated.
Given the substantial increase in the proportion of new teachers in recent years, the need for efficient and effective teacher mentoring and support programs is more pronounced than it has been in the past.
Further investigation is needed to understand why full-time teachers and high school teachers have statistically significant differences in retention and mobility rates, as compared to all teachers and all beginning teachers.
State strategies need to be differentiated and targeted in ways that recognize the variation that exists in teacher retention and mobility rates.
Study Limitations and Unaddressed Questions
While this study provides a comprehensive and longitudinal analysis of teacher retention and mobility, including factors that may impact turnover rates, we do not examine some other related issues. First, we do not address the reasons why teachers choose to move to other schools or districts, or why they decide to leave the profession, either temporarily or permanently. Issues such as increased workload, quality of school and district leadership, support from parents and community, and personal and family factors are all known to influence teacher’s views about their careers. We also do not distinguish between teachers who have been involuntarily transferred. Additionally, we make no claims about the quality of the performance of teachers who stay in their schools, move to another school or district, or leave the profession.
This report also does not examine the extent to which the current supply of teachers is adequate to meet future staffing needs. Inquiry about the adequacy of the teacher “pipeline,” including the number, endorsements, and quality of prospective teachers is another important aspect of understanding workforce dynamics. Based on the findings in this study, inquiry into these questions is likely to yield further insight into policies that may enhance the retention and support of teachers.

1
I.BackgroundonTeacherRetentionandMobilityThepurposeofthisreportistoprovideeducatorsandpolicymakersinWashingtonstatewithaccurateinformationaboutstatewideteacherretentionandmobilityandtoinformandenhancedecisionmakingregardingteacherqualitypoliciesandpractices.Thisanalysisoffersasystematiclongitudinalapproachforexaminingtrendsinteacherretention,mobilityandattrition.Inthisreport,weexaminethecharacteristicsofteachersandlookatfactorsassociatedwiththeirretentionandmobility,includingteachers’backgroundcharacteristics,districtandstudentdemographicsandregionallocation.Wepayparticularattentiontotheretentionandmobilityofteachersnewtotheprofession.A. StudyContextTeacherretention,mobilityandattritionarepartoflargerstateandnationalconversationsaboutperceivedchangesintheteacherworkforce.Concernshavebeenraisedaboutapotentialshortageofteachersduetoapossibledecreaseinthesupplyofnewteachersenteringtheprofession,changesineducationpolicythatrequireadditionalstaff,andrumorsofmoreteachersleavingtheprofession,amongotherfactors.Whiletherehavebeenperennialshortagesofteachersinschoolsservingdisadvantagedstudents,andareassuchasspecialeducation,math,science,bilingualandEnglishlanguageeducation,theextenttowhichnewfluctuationsintheteacherworkforcearelocal,regionalornationalremainsunclear.Therearealsoconcernsaboutthepotentialimpactofteachermobilityontheequitabledistributionofteachersacrossschools.ThisstudyisanattempttoaddresssomeaspectsofthesequestionssurroundingthenatureoftheWashingtonteacherworkforce.B. RelevantLiteratureNationalstudiesoftheteacherworkforcehaveconcludedthatwhilethenumberofteachershasgrownwithincreasesinthestudentpopulation,overallteacherretentionandmobilityrateshaveremainedrelativelystableovertime(Goldring,Taie,&Riddles,2014;Luekens,Lyter,&Fox,2004;Marvel,et.al.,2006;NCES,2005).TheearliestSchoolsandStaffingSurvey(SASS)wasadministeredbytheNationalCenterforEducationStatisticsin1987‐88,andthemostrecentTeacherFollow‐upSurvey(TFS)in2012‐13.Ofpublicschoolteacherswhowereteachinginthe2011‐12schoolyear,84%remainedinthesameschool,8%movedtoadifferentschool,and8%lefttheprofessionduringthefollowingyear(Goldring,Taie,&Riddles,2014).Fewstudiespointtowidespreadnationalteachershortages.However,studieshavefoundissuesofparticularconcernrelatedtostaffinginschools.Forexample,therateofattritionfromtheteachingprofessionvariesbyteacher’sage,withyoungest
2
andoldestteachersleavingathigherrates.Themainreasonscitedbypublicschoolteachersforleavingtheworkforceincludedretirementandpregnancy/childrearing(Whitener,etal.,1997).AnotherNCESstudy,America’sTeachers:ProfileoftheProfession,reportthatthevastmajorityofthenation’steachersareexperiencedteacherswhocontinuetoteachfromyeartoyear(Henke,etal,1997).However,ithasbeenmoredifficultforschoolstofindfullyqualifiedteachersinsomefieldsthaninothers,suchasmathematics,scienceandspecialeducation(Cowan,Goldhaber,Hayes&Theobald,2016;Henke,etal.,1997;Podgursky,Ehlert,Lindsay,&Wan,2016).Researchershavealsonoteddifficultyinfindingfullyqualifiedteachersinschoolsservinglargerproportionsofstudentsinpoverty(Engel,Jacob&Curran,2014;Henke,etal.,1997).TheLearningPolicyInstituterecentlyreleasedareportinwhichtheysuggestthattoomanyteachersareleavingtheworkforce,andthiscouldresultinafutureshortage(Sutcher,Darling‐Hammond,&Carver‐Thomas,2016).UsingSASSandTFSdata,Ingersollhasexaminedteacherturnoverasafunctionoftheorganizationandmanagementofschoolsandconcludesthatmanyteachersleaveforreasonsotherthanretirement.Hedoesnotconcludethatteachershortagesarearesultofalackofqualifiedteachers,butrathertheresultofteachersmovingfromoneschooltoanother(7.2percent)orexitingtheprofessiontopursueotherjobs(6percent),therebycreatingasituationwhichhecallsa“revolvingdoor”(2001a,p.24).Evidencesuggeststhatwhenteachersmove,theyoftentransfertootherschoolswithintheirdistrict.Betweentheschoolyears2011‐2012,ananalysisofTFSdatafoundthatofamongthosewhotransferred,59%movedtoanotherschoolwithintheirdistrict,and38%movedtoaschoolinanotherdistrict(Goldring,Taie,&Riddles,2014).Thisintra‐districtmovementindicatesthatcertainschoolcharacteristics(suchasworkingconditionsofschools,thesocio‐economicstatusandethnicityofstudents)maymotivateteacherstomoveorleave,inadditiontothecommonly‐perceivedreasonsofretirementandchild‐rearing(Ingersoll,2001b;Luekens,Lyter&Fox,2004).Inparticular,thecompositionofaschool’sstudentbodywithregardtorace,ethnicity,andpoverty,hasbeenshowntoinfluenceteacherattritionandmobility(Guin,2004;Hanushek,Kain,&Rivkin,2001;Ingersoll,2001b;Kelly,2004;Lankford,Loeb&Wyckoff,2002;NCES,2005;Podgursky,Ehlert,Lindsay,&Wan,2016;Shen,1997).Whilethesefactorsmayposeparticularchallenges,otherstudieshavefoundthattheinfluenceofstudentdemographicsonreportedturnoverandhiringproblemsmaybereducedwhenfactoringincertainpositiveworkingconditions(Loeb&Darling‐Hammond,2005).Othershavenotedadeclineintheproportionofminorityteachersinsomecases,suggestingthatminorityteachers’careershavebeenlessstablethanthoseofWhiteteachers(AlbertShankerInstitute,2015;Ingersoll&May,2011).Teacherturnovercannegativelyaffectthecohesivenessandeffectivenessofschoolcommunitiesbydisruptingeducationalprogramsandprofessionalrelationshipsintendedtoimprovestudentlearning(Borman&Dowling,2008;Bryk,Lee&Smith,
3
1990;Ingersoll,2001b;Ronfeldt,Loeb,&Wyckoff,2013).Mostagreethatsomeattritionisnormalandthathealthyturnovercanpromoteinnovationinschools(Macdonald,1999).HarrisandAdams(2007),however,foundthatteachersleavetheprofessionataboutthesameratesassimilarprofessionssuchassocialworkandnursing,andthatteachersactuallyhadalowerturnoverratethantheaveragecollegegraduate.Oftenteachersleaveforpersonalreasons—thedesireforcareerchangeorfamilypressures—butmanyorganizationalconditionsarepotentiallypartofthestory.Accordingtoaseriesofnationalstudies,lackofcollegialandadministrativesupport,studentmisbehavioranddisinterest,insufficientsalary,lackofteacherautonomy,unreasonableteachingassignment,lackofprofessionaldevelopmentopportunities,andinadequateallocationoftime,allcontributetothedepartureofteachers(Boyd,etal.,2011;Burkhauser,2016;Ingersoll,2003;Johnson,Kraft,&Papay,2012;Kelly,2004;Luekens,Lyter&Fox,2004;NCES,2003).Teacherattritionishigherintheearlyyearsofteachingwhencomparedwithmid‐careerteachers(Goldring,Taie,&Riddles,2014;Murnane,Singer&Willet,1988,Lortie,1975;Shen,1997).InexaminingtheTFAdatafrom2011‐12,Goldring,TaieandRiddles(2014),foundthat7%ofteacherswithonetothreeyearsofexperienceleftthefollowingyear.Inthe1993BaccalaureateandBeyondLongitudinalStudy,Henke,Zahn&Carroll(2001)foundthat82percentofnoviceteacherswerestillteachingthreeyearslaterandnotethatnoneoftheotheroccupationalcategoriesexaminedprovedmorestablethanteachers.InastudyofnoviceteacherturnoverinfourMidweststates,TheobaldandLaine(2003)foundthatthepercentageofthosewholeftteachingduringthefirstfiveyearsvariedfrom20to32percent,dependingonthestate.Novicesalsoareconsiderablymorelikelytomovethanotherteachers(Goldring,Taie,&Riddles,2014;NCES,2005).InalongitudinalstudyofnewteachersinMassachusetts,JohnsonandBirkeland(2003)foundthatexperiencesattheschoolsitewerecentralininfluencingnewteachers’decisionstostayintheirschoolsandinteaching.Theyarguethatnoviceteachers’professionalsuccessandsatisfactionistiedtotheparticularschoolsiteandthatworkingconditionsfoundtosupporttheirteachingincludecollegialinteraction,opportunitiesforgrowth,appropriateassignments,adequateresourcesandschool‐widestructurestosupportstudentlearning.Theseissuesmaybeparticularlyacutefornewteachersinlow‐incomeschools(Johnsonetal.,2004).Othershavefoundthattheparticipationinacombinationofmentoringandgroupinductionprogramsmayreducebeginningteacherturnover(Ingersoll&Strong,2011;Smith&Ingersoll,2004),thoughthequalitativedistinctionsamongtheseprogramsandtheirrelativecost‐effectivenessarenotalwaysclear(Ingersoll&Kralik,2004).
4
II.ResearchApproachandMethodsA. ResearchQuestionsTheresearchquestionsaddressedinthisstudyofWashington’steacherworkforceincludethefollowing:
1. WhatarethedemographiccharacteristicsofteachersinWashingtonstate?Towhatextenthavethesedemographicschangedinrecentyearswithrespecttorace/ethnicity,gender,andeducationlevel?Towhatextentdodifferencesexistbetweenbeginningteachersandmoreexperiencedteachers?
2. Whataretheoverallretentionandmobilityratesforteachersoverthepastfiveyears?Havetheserateschangedincomparisontostateaveragesinprioryears?Ifso,inwhatspecificways?Inwhatways,ifatall,dothesechangescoincidewithmajorstatewideinitiatives?
3. Whatdifferences,ifany,existintheretentionandmobilityratesofbeginningteacherscomparedtoteacherswithmoreexperience?
4. Inwhatwaysdodifferencesinteacherretentionandmobilityratesexistby:(a)demographiccharacteristicsofteachers(b)regionofthestate,and(c)districtandschooldemographics(e.g.,size,poverty,studentdiversity)?
B. Methodology,DataSources,ProgrammingandAnalysesWeuseseveraldatasourcestoconductastatewideanalysisoftheretentionandmobilitypatternsofteachers.Theprimarydatasourceisthepersonneldatafromthestate’sS‐275dataset.ThisdatasetcontainsdemographicandassignmentinformationaboutalleducatorsinWashingtonstate.WelinktheS‐275datatootherstatedatabases,includingschoolanddistrictdemographicdatatoformaportraitofteacherretentionandmobility.Wehaveaccesstomultipleyearsofdata,enablingustoconductlongitudinalanalysesthatarecomparableovertime.Usingstateadministrativedatasets,weexamineddemographicinformationaboutteachersoverthelast20yearsfrom1995‐96to2015‐16,focusingspecificallyonthelasttenyears.Inexaminingretentionandmobilitytrendsovertime,welookatninefive‐yeartimeperiodssince1998.Wealsoexaminedyear‐by‐yearchangesindemographiccharacteristicsandretentionandmobilityforeachyearfortheperiod2005‐2015.Boththefive‐yearandyear‐by‐yearanalysesarecohort‐based.Thatis,weidentifyteachersinagivenyear,andthenexaminetheirassignmentintheworkforceinthesubsequentyear.Tohelpexplainteacherretentionandmobilitypatterns,weconstructedmultinomiallogisticregressionmodelsusingSTATA14software,asthisapproachenablesustoinvestigatetherelationshipbetweenourdependentoutcomevariablesofinterest(retentionandmobilitystatus)andanumberofcontinuousandcategoricalindependentvariables(e.g.,district,schoolandindividual

5
characteristics).Thefocalquestionforthisworkis“Whatvariablesconsistentlyexplainteachers’retentionandmobilitypatternsinWashingtonstate?”Thetwomainpopulationsinvestigatedincludeallteachersstatewide(acrossallyearsofexperience),andbeginningteachers(thosewithlessthanoneyearofexperience).C. DefinitionofTermsandMethodologicalNotesAspartofthisstudy,weprovideanalysesofbothfive‐yearandyear‐by‐yearretentionandmobilityratesforallteachersstatewideandforbeginningteachers.Forthepurposesofthisstudy,teacherretentionandmobilityincludesboththeextenttowhichteachersmovetootherschoolsandotherdistricts,aswellasleavethestateeducationsystem.Wedescribethecriteriafortheteachersincludedintheseanalysesasfollows:
Teachersweredefinedasthosepublicschoolteacherswhoseassignmentistheinstructionofpupilsinaclassroomsituationandwhohaveadesignationasanelementaryteacher,secondaryteacher,otherclassroomteacher,orelementaryspecialistteacher.1Otherteachersservinginspecialistroles(e.g.,readingresourcespecialist,librarymediaspecialist)werenotincludedinthestatewideanalyses.
BeginningTeachersweredefinedasthosepublicschoolteacherswithlessthan1yearofexperienceasreportedintheS‐275.
Inordertoexamineretentionandmobilitypatterns,teachersareplacedinoneoffourcategories:
“Stayers”–teachersassignedtothesameschool(s)intheinitialschoolyearandalsointhesubsequentyear.
“Moversin”–teacherswhomovedtootherschoolsinthesamedistrict,or
changedassignment(otherthanaclassroomteacher)withinthesamedistrict.
“Moversout”–teacherswhomovedtootherdistricts,eitherasaclassroom
teacherorinsomeotherrole.
“Exiters”–teacherswhoexitedtheWashingtoneducationsystem,eithertemporarilyorpermanently.2
1AsreportedbytheOfficeoftheSuperintendentofPublicInstruction,classroomteachersarecertificatedinstructionalstaffwithadutyrootdesignationof31,32,33or34.Teacherswhosefull‐timeequivalent(FTE)designationwaszerowereexcludedtheanalysis.2Exitersmayhaveretired,re‐enteredthesysteminsubsequentyears,leftWashingtontoteachinanotherstateorcompletelylefttheprofession.Itisnotpossibletodistinguishvoluntaryandinvoluntarydepartures.Itisnotpossibletodeterminewhetherteacherswholeftthestatecontinuedtobeemployedasteacherselsewhere.
6
D. StudyLimitationsWhilethisstudyprovidesacomprehensiveandlongitudinalanalysisofteacherretentionandmobility,includingfactorsthatmayimpactturnoverrates,wedonotexaminesomeotherrelatedissues.First,wedonotaddressthereasonswhyteacherschoosetomovetootherschoolsordistricts,orwhytheydecidetoleavetheprofession,eithertemporarilyorpermanently.Issuessuchasincreasedworkload,qualityofschoolanddistrictleadership,supportfromparentsandcommunity,andpersonalandfamilyfactorsareallknowntoinfluenceteacher’sviewsabouttheircareers.Wealsodonotdistinguishbetweenteacherswhochoosetomakeachangeintheirassignmentorlocation,andthosewhohavebeeninvoluntarilytransferred.Additionally,wemakenoclaimsaboutthequalityoftheperformanceofteacherswhostayintheirschools,movetoanotherschoolordistrict,orleavetheprofession.Thisreportalsodoesnotexaminetheextenttowhichthecurrentsupplyofteachersisadequatetomeetfuturestaffingneeds.Inquiryabouttheadequacyoftheteacher“pipeline,”includingthenumber,endorsements,andqualityofprospectiveteachersisanotherimportantaspectofunderstandingworkforcedynamics.Basedonthefindingsinthisstudy,inquiryintothesequestionsislikelytoyieldfurtherinsightintopoliciesthatmayenhancetheretentionandsupportofteachers.E. ReportOrganizationWebeginbyprovidingaportraitofthedemographiccharacteristicsofWashingtonteachersovertime.Weanalyzeteachers’five‐yearandyear‐by‐yearretentionandmobilityratesovermultipletimeperiods,anddiscussfactorsthatmayinfluencetheserates.Next,weusestatisticalmodelstoexplorepossiblefactorsrelatedtoteacherretentionandmobility,andconductseparateanalysesforallteachersstatewideandforallbeginningteachers.Thereportconcludeswithadiscussionofthefindingsandpossiblepolicyimplications.III.FindingsA. TrendsinStatewideTeacherCharacteristics
1) DemographicCharacteristicsofTeachers
Asstudentenrollmentshaveincreasedstatewideinrecentyears,sohavethenumberofteachersintheworkforce.Approximately60,000teachers3wereworkinginWashingtonduringthe2015‐16schoolyear,upfromapproximately49,000in
3CertificatedinstructionalstaffwithFTEdesignation>0inadutyrootof31,32,33or34intheS‐275.
7
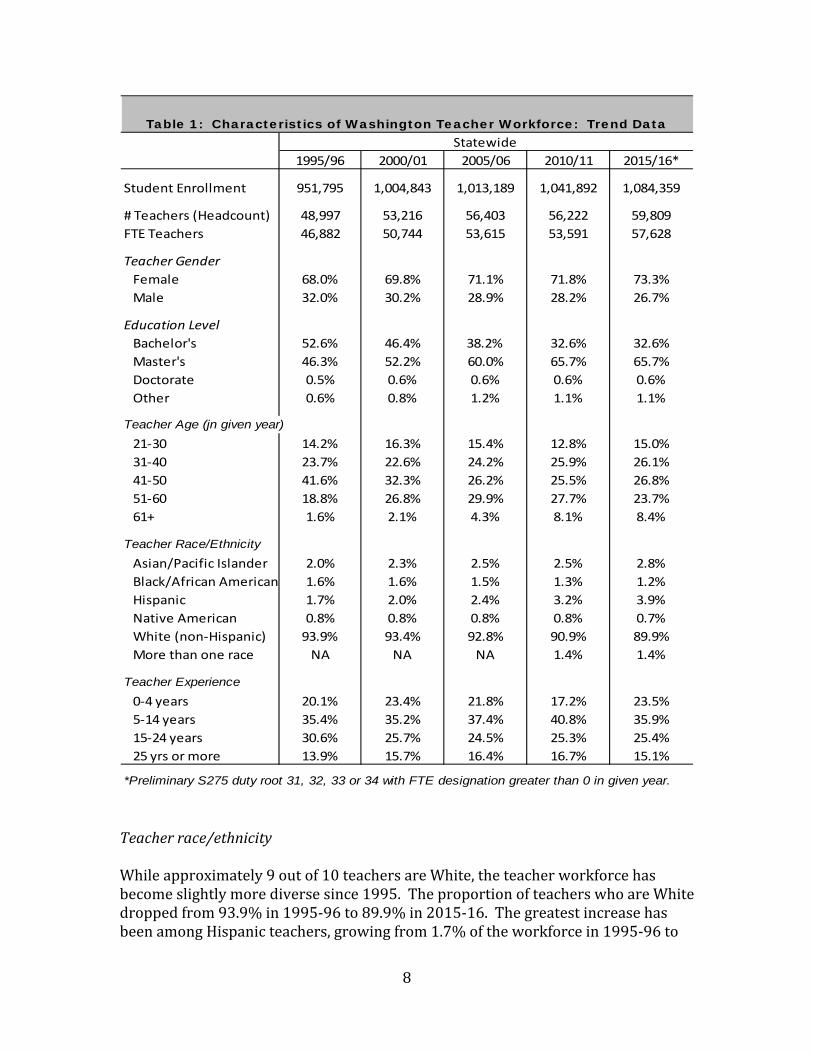
1995.Thefull‐timeequivalent(FTE)countofteachersemployedinthestatehasfluctuatedsomewhatoverthistimeperiodwithaslightdropreportedinthe2011‐12and2012‐13schoolyears.4ThemajorityofteachersinWashingtonareWhite(90%),astatisticthathaschangedbyonlyafewpercentagepointsduringthelasttwentyyears.TheexperiencelevelsofWashingtonteachershaveremainedfairlyconstant;approximatelytwo‐thirdsofteachershavebetween5and24yearsofexperience,andfewerthanaquarterhavelessthanfiveyearsofexperience(seeTable1,andAppendixA).Trendsoverthelasttwentyyearsdoshowgradualchangesintheworkforce.Overthetwenty‐yearperiod,thereisanagingoftheteacherworkforce.Ahigherproportionoftheworkforceisovertheageof50(32%comparedwith20%in1995).Aslightlyhigherproportionofteachersarewomenin2015‐16thantwentyyearsago(73%comparedwith68%),andasubstantiallyhigherproportionhaveamaster’sdegree(66%comparedwith46%).Tofurtherunderstandthesedescriptivestatistics,wediscusssomeofthem,suchasteacherrace/ethnicity,andageandexperience,ingreaterdetail.
4Formoreinformation,seeOSPI’sannual“SchoolDistrictPersonnelSummaryReports,”andAppendixAofthisreport.
8
1995/96 2000/01 2005/06 2010/11 2015/16*
Student Enrollment 951,795 1,004,843 1,013,189 1,041,892 1,084,359
# Teachers (Headcount) 48,997 53,216 56,403 56,222 59,809
FTE Teachers 46,882 50,744 53,615 53,591 57,628
Teacher Gender
Female 68.0% 69.8% 71.1% 71.8% 73.3%
Male 32.0% 30.2% 28.9% 28.2% 26.7%
Education Level
Bachelor's 52.6% 46.4% 38.2% 32.6% 32.6%
Master's 46.3% 52.2% 60.0% 65.7% 65.7%
Doctorate 0.5% 0.6% 0.6% 0.6% 0.6%
Other 0.6% 0.8% 1.2% 1.1% 1.1%
Teacher Age (jn given year)
21‐30 14.2% 16.3% 15.4% 12.8% 15.0%
31‐40 23.7% 22.6% 24.2% 25.9% 26.1%
41‐50 41.6% 32.3% 26.2% 25.5% 26.8%
51‐60 18.8% 26.8% 29.9% 27.7% 23.7%
61+ 1.6% 2.1% 4.3% 8.1% 8.4%
Teacher Race/Ethnicity
Asian/Pacific Islander 2.0% 2.3% 2.5% 2.5% 2.8%
Black/African American 1.6% 1.6% 1.5% 1.3% 1.2%
Hispanic 1.7% 2.0% 2.4% 3.2% 3.9%
Native American 0.8% 0.8% 0.8% 0.8% 0.7%
White (non‐Hispanic) 93.9% 93.4% 92.8% 90.9% 89.9%
More than one race NA NA NA 1.4% 1.4%
Teacher Experience
0‐4 years 20.1% 23.4% 21.8% 17.2% 23.5%
5‐14 years 35.4% 35.2% 37.4% 40.8% 35.9%
15‐24 years 30.6% 25.7% 24.5% 25.3% 25.4%
25 yrs or more 13.9% 15.7% 16.4% 16.7% 15.1%
*Preliminary S275 duty root 31, 32, 33 or 34 with FTE designation greater than 0 in given year.
Table 1: Characteristics of Washington Teacher Workforce: Trend DataStatewide
Teacherrace/ethnicityWhileapproximately9outof10teachersareWhite,theteacherworkforcehasbecomeslightlymorediversesince1995.TheproportionofteacherswhoareWhitedroppedfrom93.9%in1995‐96to89.9%in2015‐16.ThegreatestincreasehasbeenamongHispanicteachers,growingfrom1.7%oftheworkforcein1995‐96to
9
3.9%in2015‐16.TeacherswhoidentifyasAsian,NativeHawaiianorPacificIslanderhavealsoincreasedslightlyfrom2.0%to2.8%overthistwenty‐yearperiod.TheproportionofteacherswhoidentifyasNativeAmericanorBlack/AfricanAmericanhasdeclinedslightly.Theproportionofteachersidentifyingasmorethanoneracecomprised1.4%oftheworkforcein2015‐16andhasremainedunchangedsincethecategorywasaddedin2010.Whileitisimportanttounderstandstatewidecharacteristics,astatewideanalysismaymaskimportantdifferencesintheteacherworkforce.Inordertoexaminedifferencesinteachercharacteristicsacrosslargerdistricts,tensampledistrictswereselected.Thedistrictsreflectwidevariationinsocio‐economic,regionallocationandstudentcharacteristics,factorswhichmightinfluencethecompositionoftheteacherworkforce.Districtswithastudentenrollmentof10,000ormorewereselectedsothatdescriptivestatisticswouldnotbeundulyinfluencedbysmallnumbersofteacherswithinthecategoricalbreakouts.Thesetendistrictsareusedinseveralplacesinthereporttoillustratedifferencessometimesmaskedbystatewideaggregations.Table2showsdifferencesinthepercentagechangeintheteacherpopulationbyraceandethnicityfrom1995to2015inthesetendistricts.Thetablepresentsthetwotimeperiodsseparately(1995to2009,and2010to2015),inordertomoreaccuratelyreflectchangesfollowingnewfederalrequirementsforreportingteacherethnicityandrace.Whiletheoverallteacherworkforcehasslowlygrownmoreraciallyandethnicallydiverseinthelasttwentyyears,similartolargeurbandistrictsnationally(AlbertShankerInstitute,2015),Seattle,andtoalesserextentTacoma,havebothlostasubstantialproportionoftheirBlack/AfricanAmericanteachers.AscanbeseeninTable2,inSeattletheproportionofBlack/AfricanAmericanteachersdroppedby2.8percentagepointsfrom1995to2009,and1.6percentagepointsfrom2010to2015.Tacomasawdecreasesof0.5percentagepointsand1percentagepointintheproportionofBlack/AfricanAmericanteachersforthesametimeperiods.Since2010,theteacherworkforceinSeattle,SpokaneandHighlineproportionatelyhavebecomemoreWhite.Incontrast,bothYakimaandKennewickhaveshownsubstantialincreasestheproportionofHispanicteachers,andBellevuehasseenanincreaseamongAsian,NativeHawaiianorPacificIslanderteachersacrossbothtimeperiods.Table2providesdetailsforeachofthetenselecteddistricts.
10
White
Black/
African
American Hispanic
Asian
/Pacific
Islander
Native
American
White
(non‐
Hispanic)
Black/
African
American Hispanic
Asian
/Pacific
Islander
Native
American
Two or
More
Races
Statewide ‐1.6 ‐0.2 1.1 0.7 no change ‐1.0 ‐0.1 0.7 0.3 ‐0.1 no change
Seattle 3.1 ‐2.8 NC NC** ‐0.3 1.6 ‐1.6 0.5 NC ‐0.2 ‐0.3
Spokane ‐1.3 0.4 0.6 NC 0.3 0.8 0.1 ‐0.6 ‐0.3 ‐0.1 NC
Tacoma ‐2.6 ‐0.5 1.2 1.8 0.1 ‐1.4 ‐1.0 1.6 0.2 ‐0.1 0.7
Vancouver ‐2.8 0.3 2.2 0.4 ‐0.1 ‐0.7 ‐0.4 ‐0.1 0.6 ‐0.1 0.8
Bellevue ‐0.6 ‐1.3 ‐0.1 2.3 ‐0.3 ‐3.7 NC 1.9 2.3 ‐0.5 NC
Highline ‐3.5 0.6 1.2 1.9 ‐0.3 1.3 ‐0.1 0.5 0.1 0.1 ‐1.8
Kennewick ‐4.0 0.3 3.0 0.5 0.2 ‐1.2 0.2 1.6 NC NC ‐0.5
Yakima ‐4.9 ‐1.0 6.1 ‐0.1 ‐0.2 ‐1.9 ‐0.6 2.6 ‐0.2 ‐0.1 0.2
Bellingham ‐1.7 ‐0.1 0.3 0.9 0.7 ‐1.8 ‐0.2 1.1 NC 0.1 0.8
Central Kitsap ‐0.1 NC ‐0.3 0.6 ‐0.2 ‐0.3 ‐0.1 0.9 0.2 ‐0.5 ‐0.3
**NC stands for "No change"
From 1995‐96 to 2009‐10 (fifteen year period)*
Table 2: Percent Change in Teacher Population by Race/Ethnicity, From 1995 to 2009 and from 2010 to 2015:
2010‐11 to 2015‐16 (five year period)*
Select Washington Districts with Student Enrollment of 10,000 or More
* The two time periods are presented separately to more accurately reflect the addition of the "two or more races" category in 2010‐11.
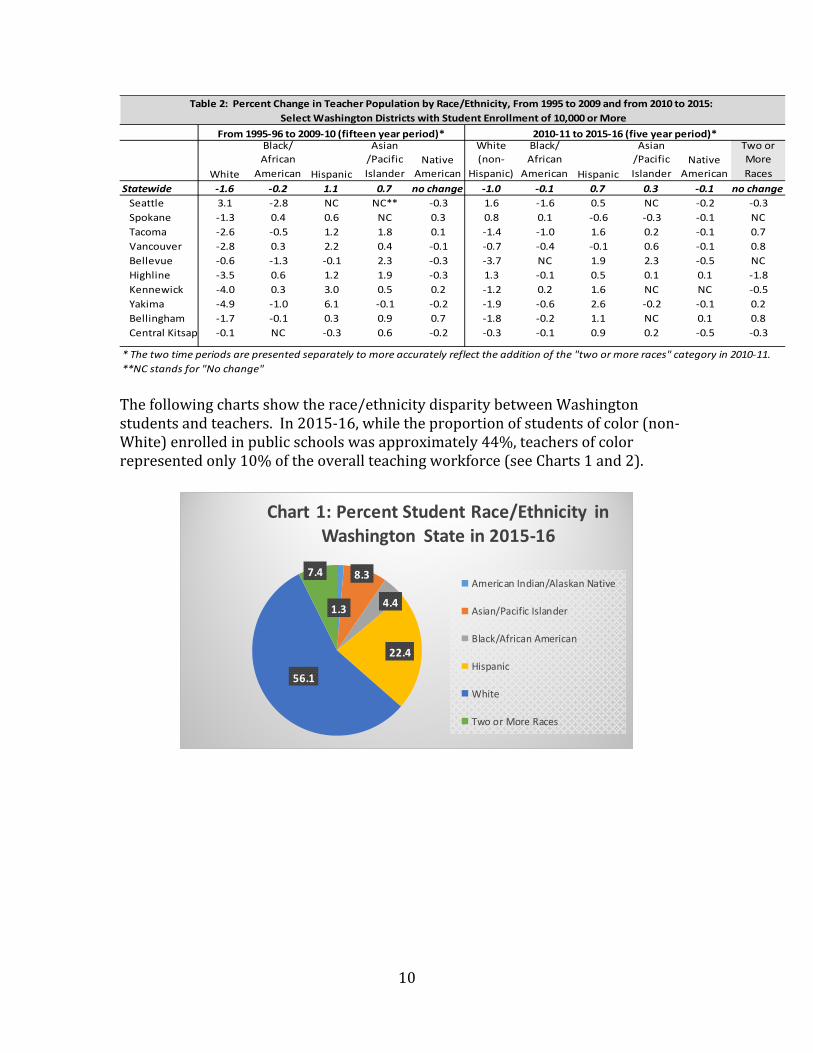
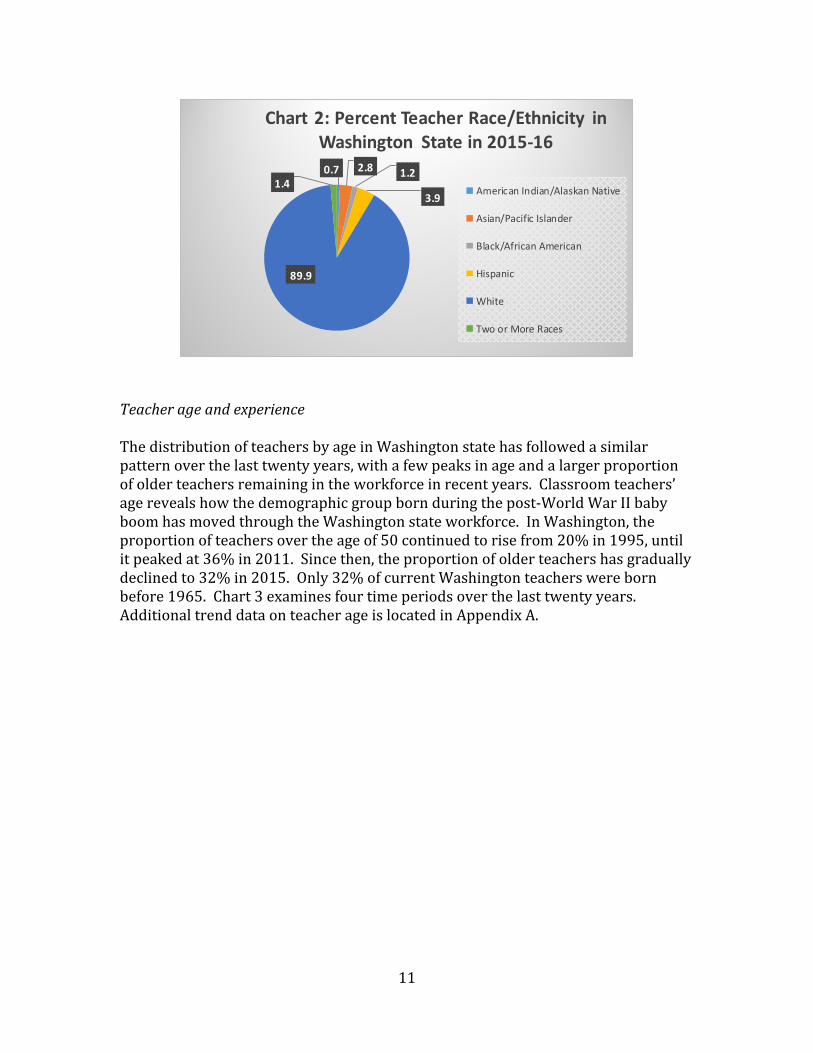
Thefollowingchartsshowtherace/ethnicitydisparitybetweenWashingtonstudentsandteachers.In2015‐16,whiletheproportionofstudentsofcolor(non‐White)enrolledinpublicschoolswasapproximately44%,teachersofcolorrepresentedonly10%oftheoverallteachingworkforce(seeCharts1and2).
1.3
8.3
4.4
22.4
56.1
7.4
Chart 1: Percent Student Race/Ethnicity in Washington State in 2015‐16
American Indian/Alaskan Native
Asian/Pacific Islander
Black/African American
Hispanic
White
Two or More Races
11
0.7 2.8 1.2
3.9
89.9
1.4
Chart 2: Percent Teacher Race/Ethnicity in Washington State in 2015‐16
American Indian/Alaskan Native
Asian/Pacific Islander
Black/African American
Hispanic
White
Two or More Races
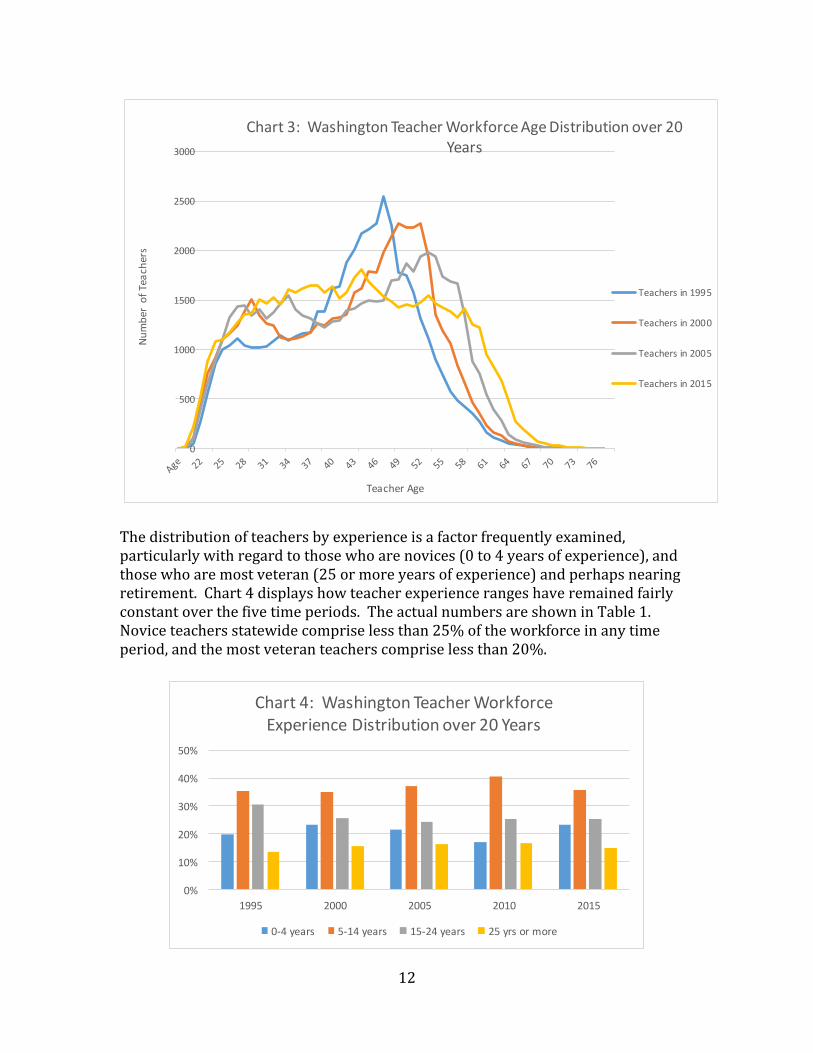
TeacherageandexperienceThedistributionofteachersbyageinWashingtonstatehasfollowedasimilarpatternoverthelasttwentyyears,withafewpeaksinageandalargerproportionofolderteachersremainingintheworkforceinrecentyears.Classroomteachers’agerevealshowthedemographicgroupbornduringthepost‐WorldWarIIbabyboomhasmovedthroughtheWashingtonstateworkforce.InWashington,theproportionofteachersovertheageof50continuedtorisefrom20%in1995,untilitpeakedat36%in2011.Sincethen,theproportionofolderteachershasgraduallydeclinedto32%in2015.Only32%ofcurrentWashingtonteacherswerebornbefore1965.Chart3examinesfourtimeperiodsoverthelasttwentyyears.AdditionaltrenddataonteacherageislocatedinAppendixA.
12
0
500
1000
1500
2000
2500
3000Number of Teach
ers
Teacher Age
Chart 3: Washington Teacher Workforce Age Distribution over 20 Years
Teachers in 1995
Teachers in 2000
Teachers in 2005
Teachers in 2015
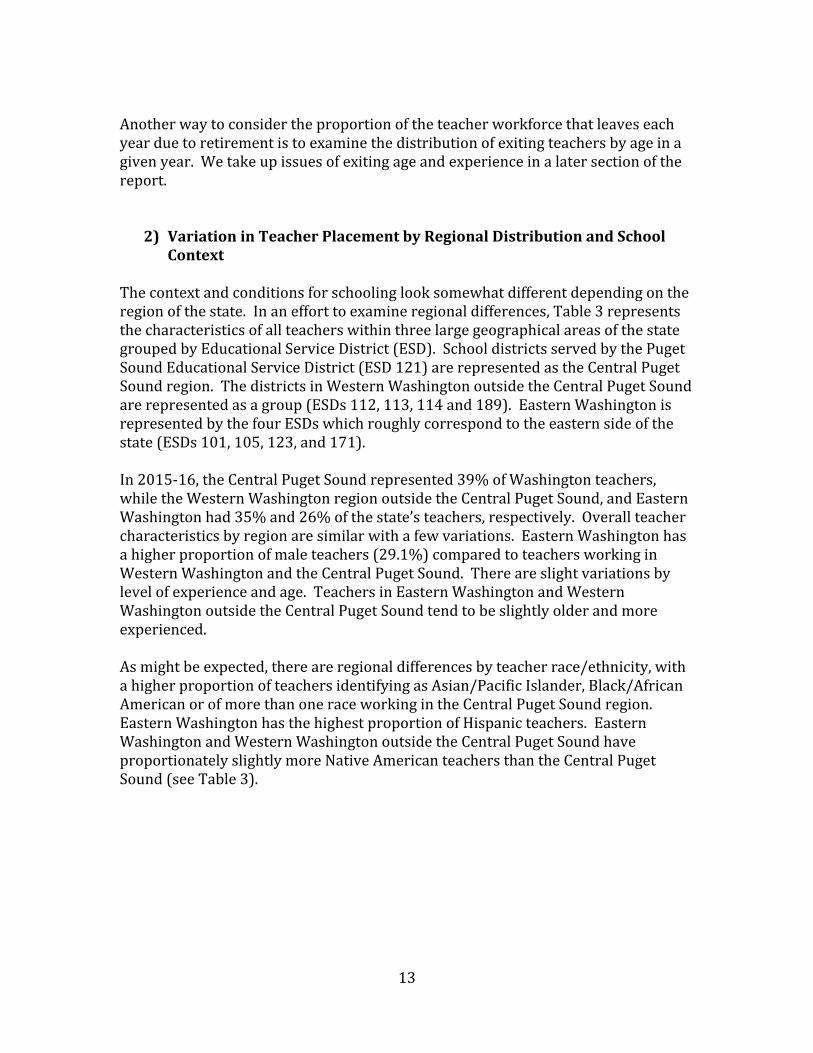
Thedistributionofteachersbyexperienceisafactorfrequentlyexamined,particularlywithregardtothosewhoarenovices(0to4yearsofexperience),andthosewhoaremostveteran(25ormoreyearsofexperience)andperhapsnearingretirement.Chart4displayshowteacherexperiencerangeshaveremainedfairlyconstantoverthefivetimeperiods.TheactualnumbersareshowninTable1.Noviceteachersstatewidecompriselessthan25%oftheworkforceinanytimeperiod,andthemostveteranteacherscompriselessthan20%.
0%
10%
20%
30%
40%
50%
1995 2000 2005 2010 2015
Chart 4: Washington Teacher Workforce Experience Distribution over 20 Years
0‐4 years 5‐14 years 15‐24 years 25 yrs or more
13
Anotherwaytoconsidertheproportionoftheteacherworkforcethatleaveseachyearduetoretirementistoexaminethedistributionofexitingteachersbyageinagivenyear.Wetakeupissuesofexitingageandexperienceinalatersectionofthereport.
2) VariationinTeacherPlacementbyRegionalDistributionandSchool
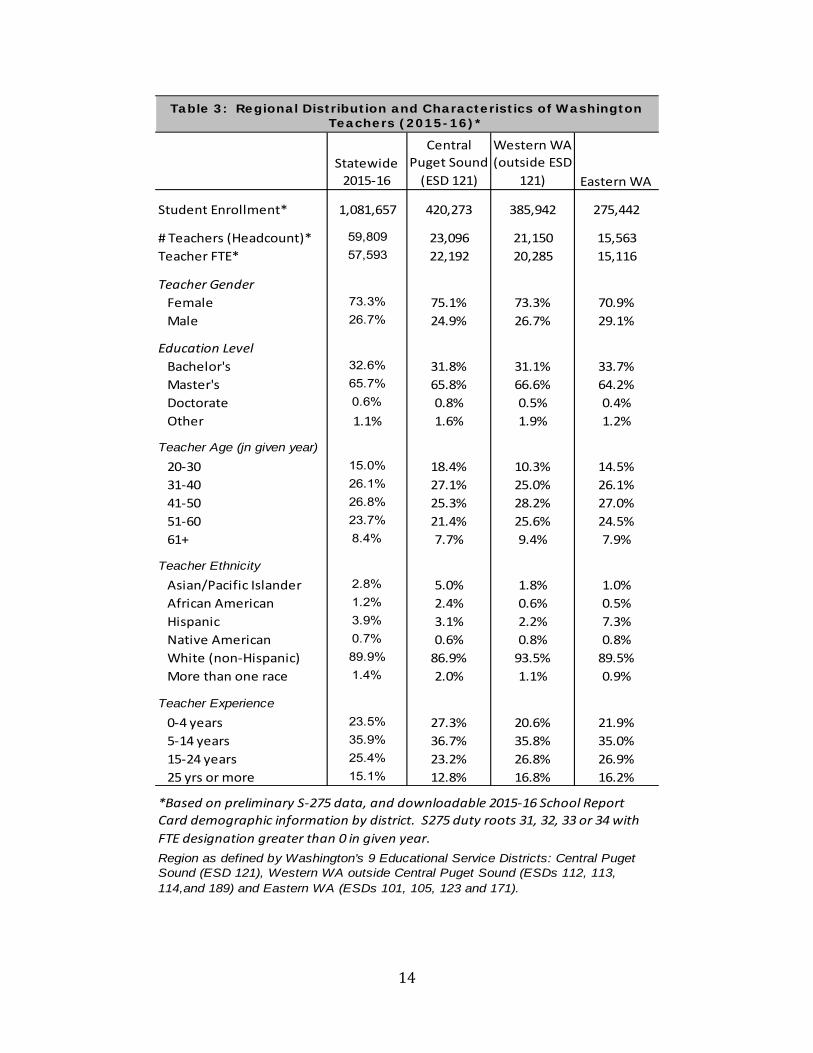
ContextThecontextandconditionsforschoolinglooksomewhatdifferentdependingontheregionofthestate.Inanefforttoexamineregionaldifferences,Table3representsthecharacteristicsofallteacherswithinthreelargegeographicalareasofthestategroupedbyEducationalServiceDistrict(ESD).SchooldistrictsservedbythePugetSoundEducationalServiceDistrict(ESD121)arerepresentedastheCentralPugetSoundregion.ThedistrictsinWesternWashingtonoutsidetheCentralPugetSoundarerepresentedasagroup(ESDs112,113,114and189).EasternWashingtonisrepresentedbythefourESDswhichroughlycorrespondtotheeasternsideofthestate(ESDs101,105,123,and171).In2015‐16,theCentralPugetSoundrepresented39%ofWashingtonteachers,whiletheWesternWashingtonregionoutsidetheCentralPugetSound,andEasternWashingtonhad35%and26%ofthestate’steachers,respectively.Overallteachercharacteristicsbyregionaresimilarwithafewvariations.EasternWashingtonhasahigherproportionofmaleteachers(29.1%)comparedtoteachersworkinginWesternWashingtonandtheCentralPugetSound.Thereareslightvariationsbylevelofexperienceandage.TeachersinEasternWashingtonandWesternWashingtonoutsidetheCentralPugetSoundtendtobeslightlyolderandmoreexperienced.Asmightbeexpected,thereareregionaldifferencesbyteacherrace/ethnicity,withahigherproportionofteachersidentifyingasAsian/PacificIslander,Black/AfricanAmericanorofmorethanoneraceworkingintheCentralPugetSoundregion.EasternWashingtonhasthehighestproportionofHispanicteachers.EasternWashingtonandWesternWashingtonoutsidetheCentralPugetSoundhaveproportionatelyslightlymoreNativeAmericanteachersthantheCentralPugetSound(seeTable3).
14
Statewide
2015‐16
Central
Puget Sound
(ESD 121)
Western WA
(outside ESD
121) Eastern WA
Student Enrollment* 1,081,657 420,273 385,942 275,442
# Teachers (Headcount)* 59,809 23,096 21,150 15,563
Teacher FTE* 57,593 22,192 20,285 15,116
Teacher Gender
Female 73.3% 75.1% 73.3% 70.9%
Male 26.7% 24.9% 26.7% 29.1%
Education Level
Bachelor's 32.6% 31.8% 31.1% 33.7%
Master's 65.7% 65.8% 66.6% 64.2%
Doctorate 0.6% 0.8% 0.5% 0.4%
Other 1.1% 1.6% 1.9% 1.2%
Teacher Age (jn given year)
20‐30 15.0% 18.4% 10.3% 14.5%
31‐40 26.1% 27.1% 25.0% 26.1%
41‐50 26.8% 25.3% 28.2% 27.0%
51‐60 23.7% 21.4% 25.6% 24.5%
61+ 8.4% 7.7% 9.4% 7.9%
Teacher Ethnicity
Asian/Pacific Islander 2.8% 5.0% 1.8% 1.0%
African American 1.2% 2.4% 0.6% 0.5%
Hispanic 3.9% 3.1% 2.2% 7.3%
Native American 0.7% 0.6% 0.8% 0.8%
White (non‐Hispanic) 89.9% 86.9% 93.5% 89.5%
More than one race 1.4% 2.0% 1.1% 0.9%
Teacher Experience
0‐4 years 23.5% 27.3% 20.6% 21.9%
5‐14 years 35.9% 36.7% 35.8% 35.0%
15‐24 years 25.4% 23.2% 26.8% 26.9%
25 yrs or more 15.1% 12.8% 16.8% 16.2%
Table 3: Regional Distribution and Characteristics of Washington Teachers (2015-16)*
Region as defined by Washington's 9 Educational Service Districts: Central Puget Sound (ESD 121), Western WA outside Central Puget Sound (ESDs 112, 113, 114,and 189) and Eastern WA (ESDs 101, 105, 123 and 171).
*Based on preliminary S‐275 data, and downloadable 2015‐16 School Report
Card demographic information by district. S275 duty roots 31, 32, 33 or 34 with
FTE designation greater than 0 in given year.
15
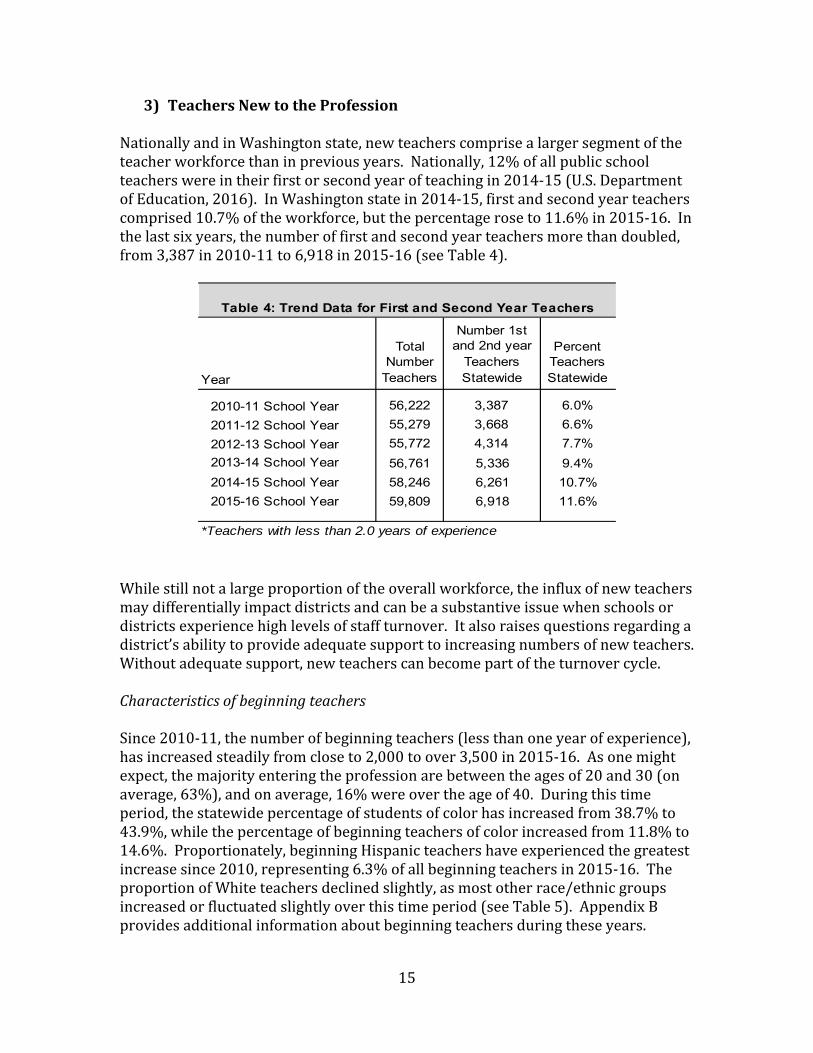
3) TeachersNewtotheProfessionNationallyandinWashingtonstate,newteacherscomprisealargersegmentoftheteacherworkforcethaninpreviousyears.Nationally,12%ofallpublicschoolteacherswereintheirfirstorsecondyearofteachingin2014‐15(U.S.DepartmentofEducation,2016).InWashingtonstatein2014‐15,firstandsecondyearteacherscomprised10.7%oftheworkforce,butthepercentageroseto11.6%in2015‐16.Inthelastsixyears,thenumberoffirstandsecondyearteachersmorethandoubled,from3,387in2010‐11to6,918in2015‐16(seeTable4).
Year
Total Number
Teachers
Number 1st and 2nd year
Teachers Statewide
Percent Teachers Statewide
2010-11 School Year 56,222 3,387 6.0%
2011-12 School Year 55,279 3,668 6.6%
2012-13 School Year 55,772 4,314 7.7%
2013-14 School Year 56,761 5,336 9.4%
2014-15 School Year 58,246 6,261 10.7%
2015-16 School Year 59,809 6,918 11.6%
*Teachers with less than 2.0 years of experience
Table 4: Trend Data for First and Second Year Teachers
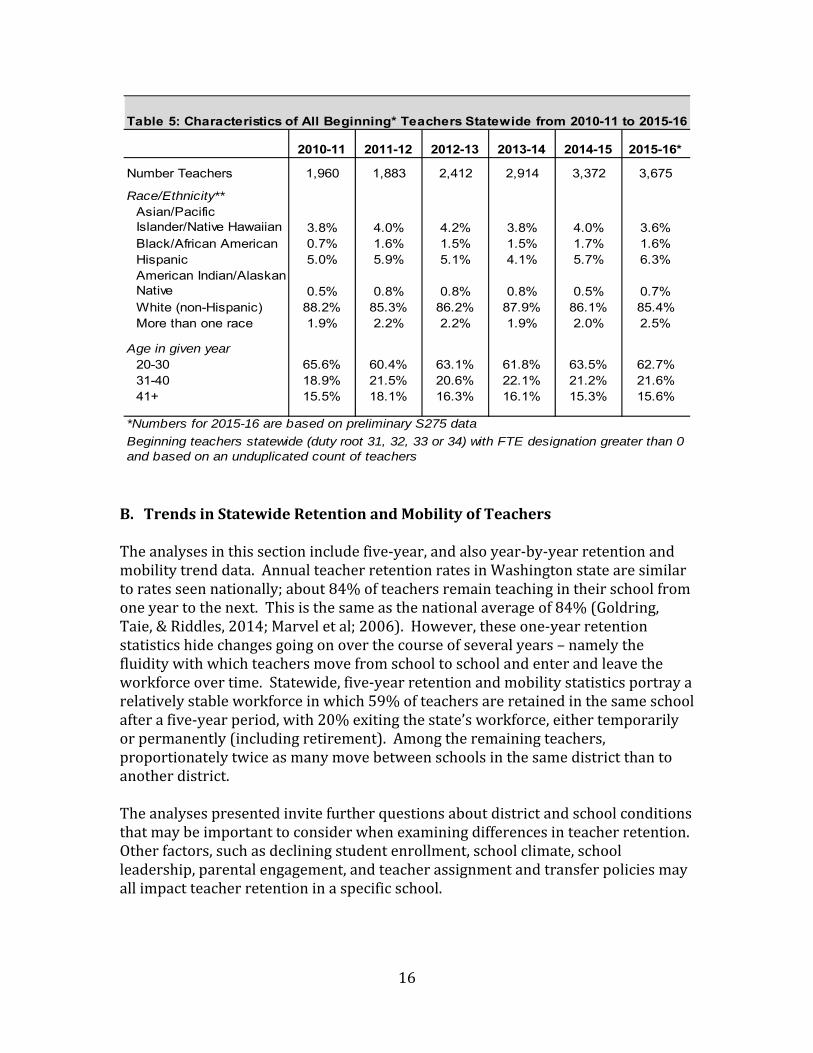
Whilestillnotalargeproportionoftheoverallworkforce,theinfluxofnewteachersmaydifferentiallyimpactdistrictsandcanbeasubstantiveissuewhenschoolsordistrictsexperiencehighlevelsofstaffturnover.Italsoraisesquestionsregardingadistrict’sabilitytoprovideadequatesupporttoincreasingnumbersofnewteachers.Withoutadequatesupport,newteacherscanbecomepartoftheturnovercycle.CharacteristicsofbeginningteachersSince2010‐11,thenumberofbeginningteachers(lessthanoneyearofexperience),hasincreasedsteadilyfromcloseto2,000toover3,500in2015‐16.Asonemightexpect,themajorityenteringtheprofessionarebetweentheagesof20and30(onaverage,63%),andonaverage,16%wereovertheageof40.Duringthistimeperiod,thestatewidepercentageofstudentsofcolorhasincreasedfrom38.7%to43.9%,whilethepercentageofbeginningteachersofcolorincreasedfrom11.8%to14.6%.Proportionately,beginningHispanicteachershaveexperiencedthegreatestincreasesince2010,representing6.3%ofallbeginningteachersin2015‐16.TheproportionofWhiteteachersdeclinedslightly,asmostotherrace/ethnicgroupsincreasedorfluctuatedslightlyoverthistimeperiod(seeTable5).AppendixBprovidesadditionalinformationaboutbeginningteachersduringtheseyears.
16
2010-11 2011-12 2012-13 2013-14 2014-15 2015-16*
Number Teachers 1,960 1,883 2,412 2,914 3,372 3,675
Race/Ethnicity**Asian/Pacific Islander/Native Hawaiian 3.8% 4.0% 4.2% 3.8% 4.0% 3.6%Black/African American 0.7% 1.6% 1.5% 1.5% 1.7% 1.6%Hispanic 5.0% 5.9% 5.1% 4.1% 5.7% 6.3%American Indian/Alaskan Native 0.5% 0.8% 0.8% 0.8% 0.5% 0.7%White (non-Hispanic) 88.2% 85.3% 86.2% 87.9% 86.1% 85.4%More than one race 1.9% 2.2% 2.2% 1.9% 2.0% 2.5%
Age in given year20-30 65.6% 60.4% 63.1% 61.8% 63.5% 62.7%31-40 18.9% 21.5% 20.6% 22.1% 21.2% 21.6%41+ 15.5% 18.1% 16.3% 16.1% 15.3% 15.6%
Table 5: Characteristics of All Beginning* Teachers Statewide from 2010-11 to 2015-16
*Numbers for 2015-16 are based on preliminary S275 data
Beginning teachers statewide (duty root 31, 32, 33 or 34) with FTE designation greater than 0 and based on an unduplicated count of teachers
B. TrendsinStatewideRetentionandMobilityofTeachers
Theanalysesinthissectionincludefive‐year,andalsoyear‐by‐yearretentionandmobilitytrenddata.AnnualteacherretentionratesinWashingtonstatearesimilartoratesseennationally;about84%ofteachersremainteachingintheirschoolfromoneyeartothenext.Thisisthesameasthenationalaverageof84%(Goldring,Taie,&Riddles,2014;Marveletal;2006).However,theseone‐yearretentionstatisticshidechangesgoingonoverthecourseofseveralyears–namelythefluiditywithwhichteachersmovefromschooltoschoolandenterandleavetheworkforceovertime.Statewide,five‐yearretentionandmobilitystatisticsportrayarelativelystableworkforceinwhich59%ofteachersareretainedinthesameschoolafterafive‐yearperiod,with20%exitingthestate’sworkforce,eithertemporarilyorpermanently(includingretirement).Amongtheremainingteachers,proportionatelytwiceasmanymovebetweenschoolsinthesamedistrictthantoanotherdistrict.Theanalysespresentedinvitefurtherquestionsaboutdistrictandschoolconditionsthatmaybeimportanttoconsiderwhenexaminingdifferencesinteacherretention.Otherfactors,suchasdecliningstudentenrollment,schoolclimate,schoolleadership,parentalengagement,andteacherassignmentandtransferpoliciesmayallimpactteacherretentioninaspecificschool.
17
1) StatewideRetentionandMobilityTrendsAcrossFive‐YearTimePeriods
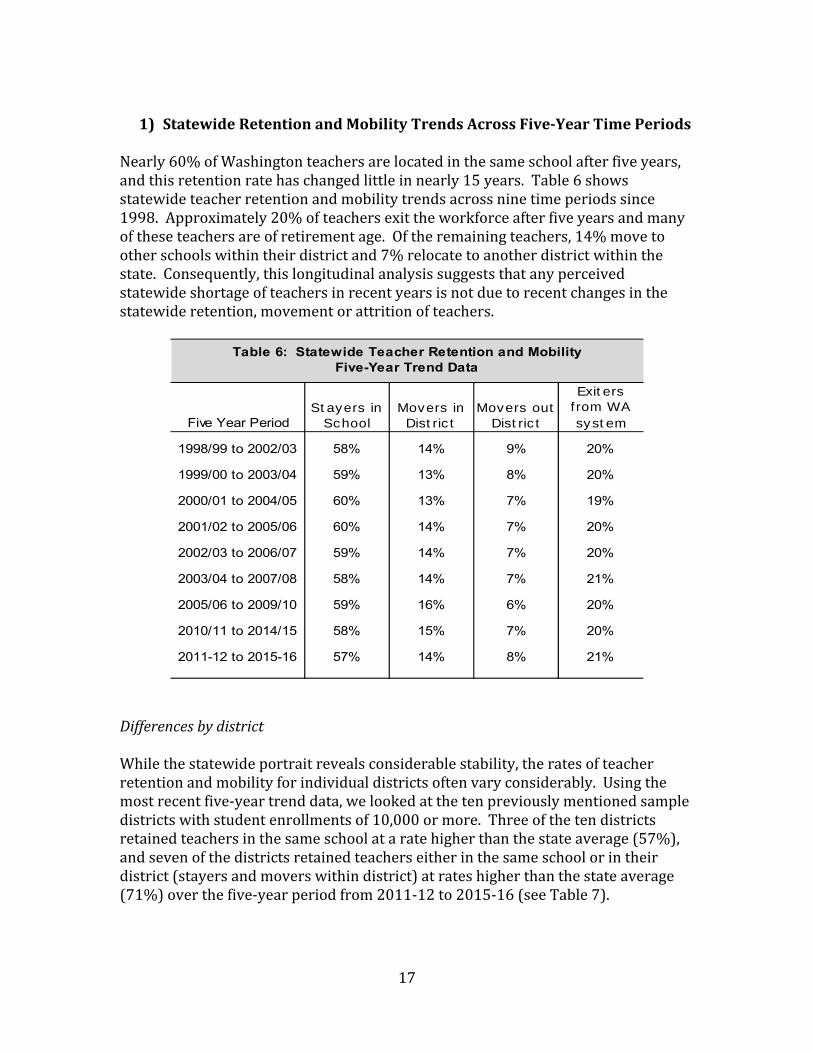
Nearly60%ofWashingtonteachersarelocatedinthesameschoolafterfiveyears,andthisretentionratehaschangedlittleinnearly15years.Table6showsstatewideteacherretentionandmobilitytrendsacrossninetimeperiodssince1998.Approximately20%ofteachersexittheworkforceafterfiveyearsandmanyoftheseteachersareofretirementage.Oftheremainingteachers,14%movetootherschoolswithintheirdistrictand7%relocatetoanotherdistrictwithinthestate.Consequently,thislongitudinalanalysissuggeststhatanyperceivedstatewideshortageofteachersinrecentyearsisnotduetorecentchangesinthestatewideretention,movementorattritionofteachers.
Five Year PeriodStayers in
SchoolMovers in District
Movers out District
Exiters from WA system
1998/99 to 2002/03 58% 14% 9% 20%
1999/00 to 2003/04 59% 13% 8% 20%
2000/01 to 2004/05 60% 13% 7% 19%
2001/02 to 2005/06 60% 14% 7% 20%
2002/03 to 2006/07 59% 14% 7% 20%
2003/04 to 2007/08 58% 14% 7% 21%
2005/06 to 2009/10 59% 16% 6% 20%
2010/11 to 2014/15 58% 15% 7% 20%
2011-12 to 2015-16 57% 14% 8% 21%
Table 6: Statewide Teacher Retention and Mobility Five-Year Trend Data
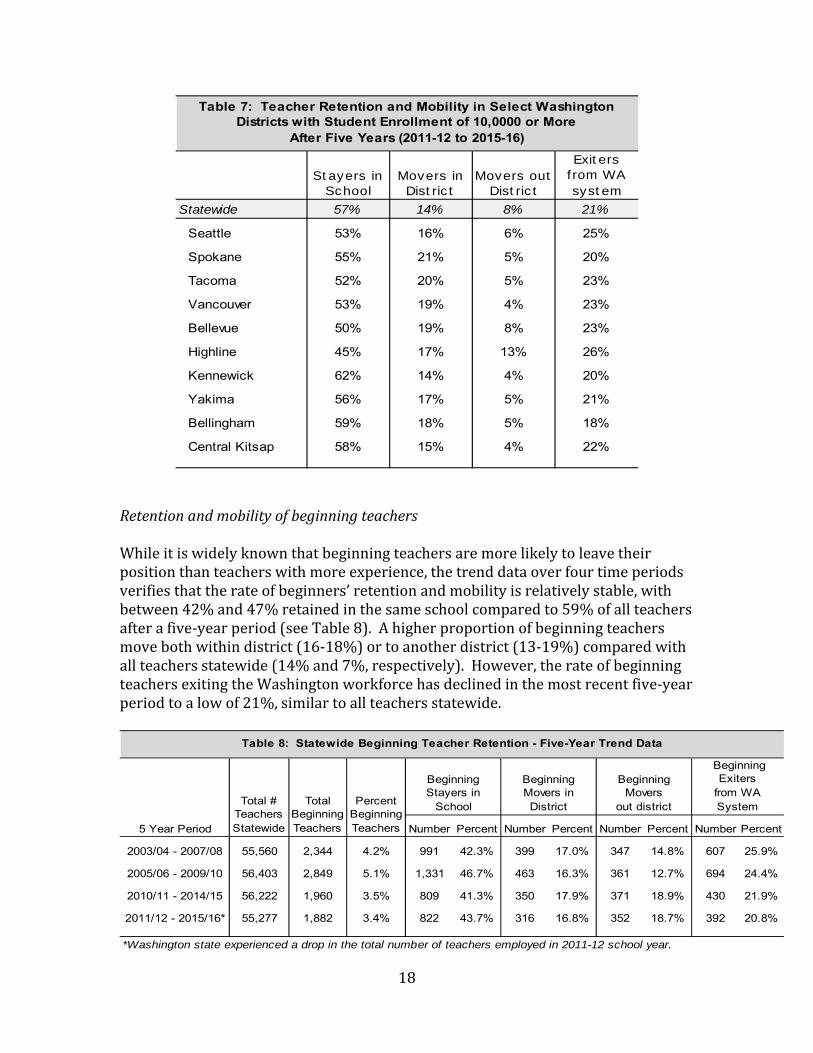
DifferencesbydistrictWhilethestatewideportraitrevealsconsiderablestability,theratesofteacherretentionandmobilityforindividualdistrictsoftenvaryconsiderably.Usingthemostrecentfive‐yeartrenddata,welookedatthetenpreviouslymentionedsampledistrictswithstudentenrollmentsof10,000ormore.Threeofthetendistrictsretainedteachersinthesameschoolataratehigherthanthestateaverage(57%),andsevenofthedistrictsretainedteacherseitherinthesameschoolorintheirdistrict(stayersandmoverswithindistrict)atrateshigherthanthestateaverage(71%)overthefive‐yearperiodfrom2011‐12to2015‐16(seeTable7).
18
Stayers in School
Movers in District
Movers out District
Exiters from WA system
Statewide 57% 14% 8% 21%
Seattle 53% 16% 6% 25%
Spokane 55% 21% 5% 20%
Tacoma 52% 20% 5% 23%
Vancouver 53% 19% 4% 23%
Bellevue 50% 19% 8% 23%
Highline 45% 17% 13% 26%
Kennewick 62% 14% 4% 20%
Yakima 56% 17% 5% 21%
Bellingham 59% 18% 5% 18%
Central Kitsap 58% 15% 4% 22%
Table 7: Teacher Retention and Mobility in Select Washington Districts with Student Enrollment of 10,0000 or More
After Five Years (2011-12 to 2015-16)
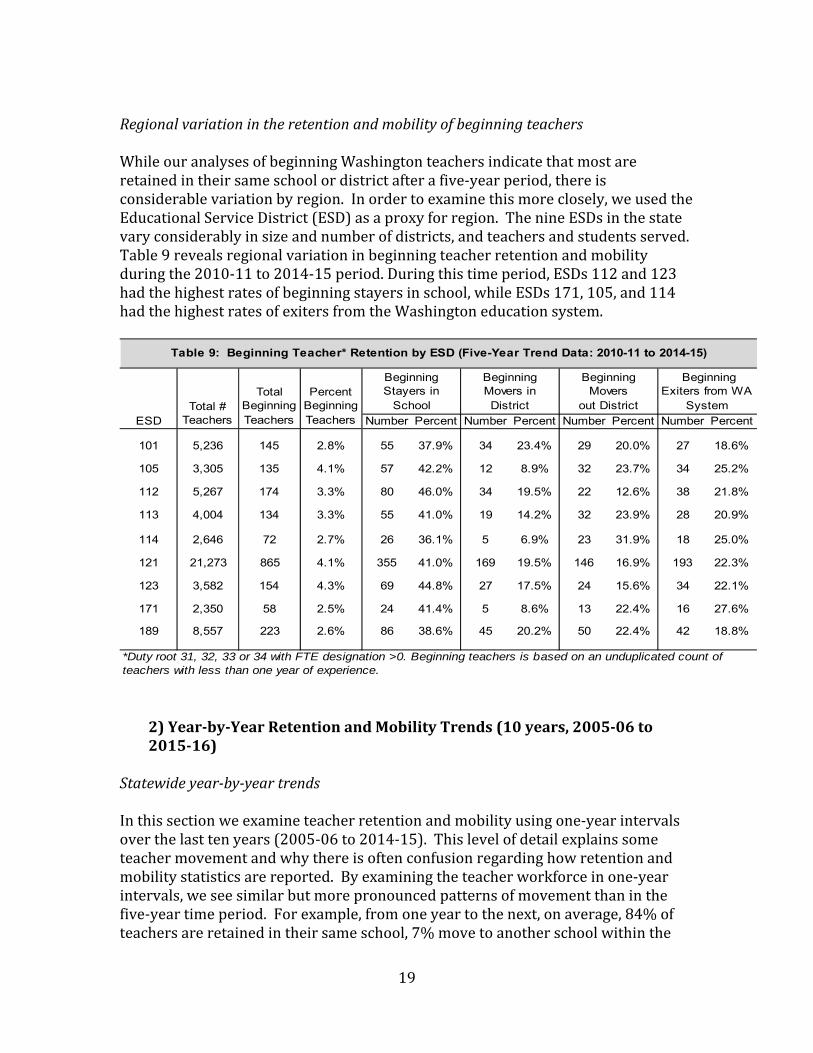
RetentionandmobilityofbeginningteachersWhileitiswidelyknownthatbeginningteachersaremorelikelytoleavetheirpositionthanteacherswithmoreexperience,thetrenddataoverfourtimeperiodsverifiesthattherateofbeginners’retentionandmobilityisrelativelystable,withbetween42%and47%retainedinthesameschoolcomparedto59%ofallteachersafterafive‐yearperiod(seeTable8).Ahigherproportionofbeginningteachersmovebothwithindistrict(16‐18%)ortoanotherdistrict(13‐19%)comparedwithallteachersstatewide(14%and7%,respectively).However,therateofbeginningteachersexitingtheWashingtonworkforcehasdeclinedinthemostrecentfive‐yearperiodtoalowof21%,similartoallteachersstatewide.
Number Percent Number Percent Number Percent Number Percent
2003/04 - 2007/08 55,560 2,344 4.2% 991 42.3% 399 17.0% 347 14.8% 607 25.9%
2005/06 - 2009/10 56,403 2,849 5.1% 1,331 46.7% 463 16.3% 361 12.7% 694 24.4%
2010/11 - 2014/15 56,222 1,960 3.5% 809 41.3% 350 17.9% 371 18.9% 430 21.9%
2011/12 - 2015/16* 55,277 1,882 3.4% 822 43.7% 316 16.8% 352 18.7% 392 20.8%
*Washington state experienced a drop in the total number of teachers employed in 2011-12 school year.
Table 8: Statewide Beginning Teacher Retention - Five-Year Trend Data
5 Year Period
Total # Teachers Statewide
Total Beginning Teachers
Percent Beginning Teachers
Beginning Stayers in
School
Beginning Movers in District
Beginning Movers
out district
Beginning Exiters
from WA System
19
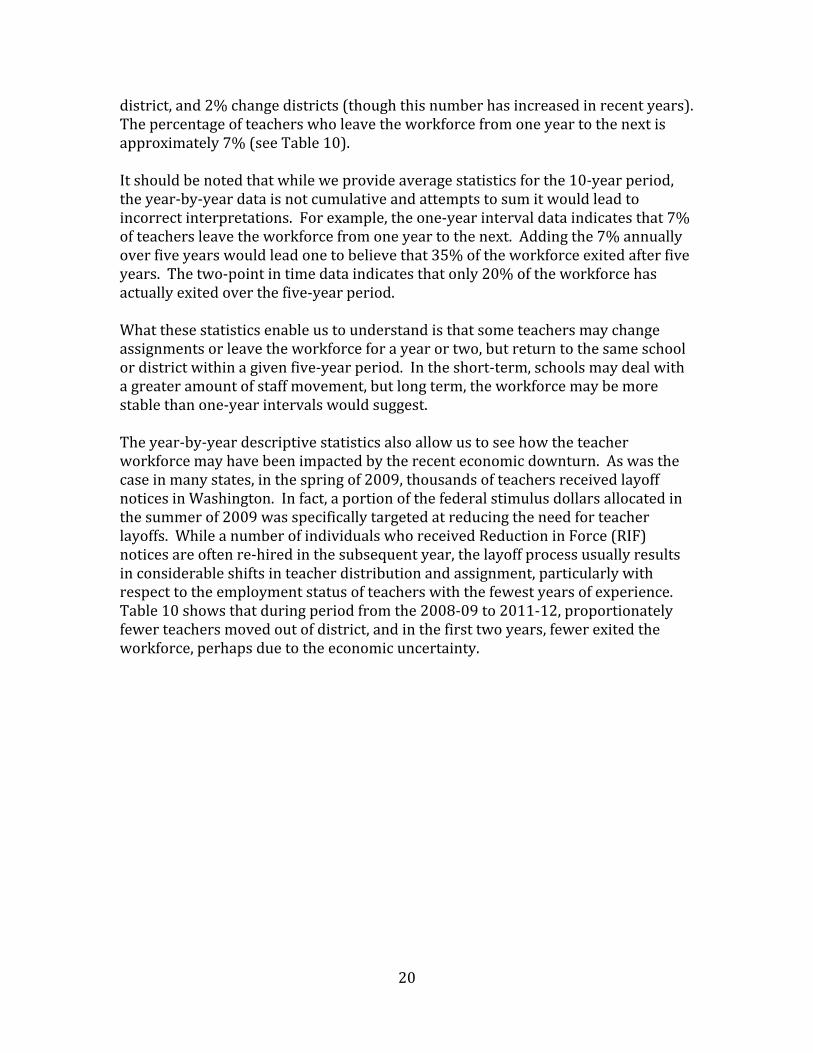
RegionalvariationintheretentionandmobilityofbeginningteachersWhileouranalysesofbeginningWashingtonteachersindicatethatmostareretainedintheirsameschoolordistrictafterafive‐yearperiod,thereisconsiderablevariationbyregion.Inordertoexaminethismoreclosely,weusedtheEducationalServiceDistrict(ESD)asaproxyforregion.ThenineESDsinthestatevaryconsiderablyinsizeandnumberofdistricts,andteachersandstudentsserved.Table9revealsregionalvariationinbeginningteacherretentionandmobilityduringthe2010‐11to2014‐15period.Duringthistimeperiod,ESDs112and123hadthehighestratesofbeginningstayersinschool,whileESDs171,105,and114hadthehighestratesofexitersfromtheWashingtoneducationsystem.
Number Percent Number Percent Number Percent Number Percent
101 5,236 145 2.8% 55 37.9% 34 23.4% 29 20.0% 27 18.6%
105 3,305 135 4.1% 57 42.2% 12 8.9% 32 23.7% 34 25.2%
112 5,267 174 3.3% 80 46.0% 34 19.5% 22 12.6% 38 21.8%
113 4,004 134 3.3% 55 41.0% 19 14.2% 32 23.9% 28 20.9%
114 2,646 72 2.7% 26 36.1% 5 6.9% 23 31.9% 18 25.0%
121 21,273 865 4.1% 355 41.0% 169 19.5% 146 16.9% 193 22.3%
123 3,582 154 4.3% 69 44.8% 27 17.5% 24 15.6% 34 22.1%
171 2,350 58 2.5% 24 41.4% 5 8.6% 13 22.4% 16 27.6%
189 8,557 223 2.6% 86 38.6% 45 20.2% 50 22.4% 42 18.8%
*Duty root 31, 32, 33 or 34 with FTE designation >0. Beginning teachers is based on an unduplicated count of teachers with less than one year of experience.
Table 9: Beginning Teacher* Retention by ESD (Five-Year Trend Data: 2010-11 to 2014-15)
ESDTotal #
Teachers
Total Beginning Teachers
Percent Beginning Teachers
Beginning Stayers in
School
Beginning Movers in District
Beginning Movers
out District
Beginning Exiters from WA
System
2)Year‐by‐YearRetentionandMobilityTrends(10years,2005‐06to2015‐16)
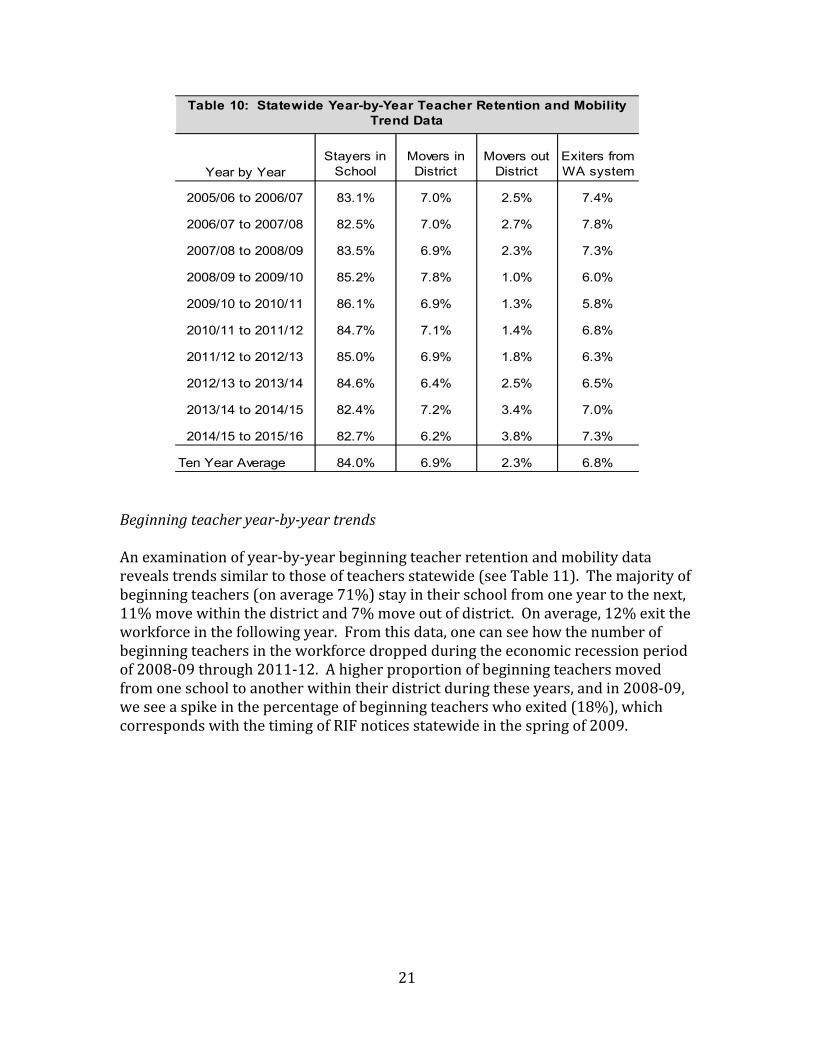
Statewideyear‐by‐yeartrendsInthissectionweexamineteacherretentionandmobilityusingone‐yearintervalsoverthelasttenyears(2005‐06to2014‐15).Thislevelofdetailexplainssometeachermovementandwhythereisoftenconfusionregardinghowretentionandmobilitystatisticsarereported.Byexaminingtheteacherworkforceinone‐yearintervals,weseesimilarbutmorepronouncedpatternsofmovementthaninthefive‐yeartimeperiod.Forexample,fromoneyeartothenext,onaverage,84%ofteachersareretainedintheirsameschool,7%movetoanotherschoolwithinthe
20
district,and2%changedistricts(thoughthisnumberhasincreasedinrecentyears).Thepercentageofteacherswholeavetheworkforcefromoneyeartothenextisapproximately7%(seeTable10).Itshouldbenotedthatwhileweprovideaveragestatisticsforthe10‐yearperiod,theyear‐by‐yeardataisnotcumulativeandattemptstosumitwouldleadtoincorrectinterpretations.Forexample,theone‐yearintervaldataindicatesthat7%ofteachersleavetheworkforcefromoneyeartothenext.Addingthe7%annuallyoverfiveyearswouldleadonetobelievethat35%oftheworkforceexitedafterfiveyears.Thetwo‐pointintimedataindicatesthatonly20%oftheworkforcehasactuallyexitedoverthefive‐yearperiod.Whatthesestatisticsenableustounderstandisthatsometeachersmaychangeassignmentsorleavetheworkforceforayearortwo,butreturntothesameschoolordistrictwithinagivenfive‐yearperiod.Intheshort‐term,schoolsmaydealwithagreateramountofstaffmovement,butlongterm,theworkforcemaybemorestablethanone‐yearintervalswouldsuggest.Theyear‐by‐yeardescriptivestatisticsalsoallowustoseehowtheteacherworkforcemayhavebeenimpactedbytherecenteconomicdownturn.Aswasthecaseinmanystates,inthespringof2009,thousandsofteachersreceivedlayoffnoticesinWashington.Infact,aportionofthefederalstimulusdollarsallocatedinthesummerof2009wasspecificallytargetedatreducingtheneedforteacherlayoffs.WhileanumberofindividualswhoreceivedReductioninForce(RIF)noticesareoftenre‐hiredinthesubsequentyear,thelayoffprocessusuallyresultsinconsiderableshiftsinteacherdistributionandassignment,particularlywithrespecttotheemploymentstatusofteacherswiththefewestyearsofexperience.Table10showsthatduringperiodfromthe2008‐09to2011‐12,proportionatelyfewerteachersmovedoutofdistrict,andinthefirsttwoyears,fewerexitedtheworkforce,perhapsduetotheeconomicuncertainty.
21
Year by YearStayers in
SchoolMovers in District
Movers out District
Exiters from WA system
2005/06 to 2006/07 83.1% 7.0% 2.5% 7.4%
2006/07 to 2007/08 82.5% 7.0% 2.7% 7.8%
2007/08 to 2008/09 83.5% 6.9% 2.3% 7.3%
2008/09 to 2009/10 85.2% 7.8% 1.0% 6.0%
2009/10 to 2010/11 86.1% 6.9% 1.3% 5.8%
2010/11 to 2011/12 84.7% 7.1% 1.4% 6.8%
2011/12 to 2012/13 85.0% 6.9% 1.8% 6.3%
2012/13 to 2013/14 84.6% 6.4% 2.5% 6.5%
2013/14 to 2014/15 82.4% 7.2% 3.4% 7.0%
2014/15 to 2015/16 82.7% 6.2% 3.8% 7.3%
Ten Year Average 84.0% 6.9% 2.3% 6.8%
Table 10: Statewide Year-by-Year Teacher Retention and Mobility Trend Data
Beginningteacheryear‐by‐yeartrendsAnexaminationofyear‐by‐yearbeginningteacherretentionandmobilitydatarevealstrendssimilartothoseofteachersstatewide(seeTable11).Themajorityofbeginningteachers(onaverage71%)stayintheirschoolfromoneyeartothenext,11%movewithinthedistrictand7%moveoutofdistrict.Onaverage,12%exittheworkforceinthefollowingyear.Fromthisdata,onecanseehowthenumberofbeginningteachersintheworkforcedroppedduringtheeconomicrecessionperiodof2008‐09through2011‐12.Ahigherproportionofbeginningteachersmovedfromoneschooltoanotherwithintheirdistrictduringtheseyears,andin2008‐09,weseeaspikeinthepercentageofbeginningteacherswhoexited(18%),whichcorrespondswiththetimingofRIFnoticesstatewideinthespringof2009.
22
# Beginning Teachers
Stayers in School
Movers in District
Movers out District
Exiters from WA system
2005/06 to 2006/07 2,841 72.2% 9.0% 6.8% 11.9%
2006/07 to 2007/08 2,835 69.6% 9.5% 6.7% 14.1%
2007/08 to 2008/09 2,725 67.2% 10.7% 5.7% 16.5%
2008/09 to 2009/10 2,460 64.6% 13.7% 3.9% 17.8%
2009/10 to 2010/11 1,309 67.8% 13.9% 7.0% 11.4%
2010/11 to 2011/12 1,959 67.4% 12.4% 7.2% 13.0%
2011/12 to 2012/13 1,883 72.3% 11.0% 6.5% 10.2%
2012/13 to 2013/14 2,411 76.3% 8.0% 7.4% 8.3%
2013/14 to 2014/15 2,914 73.3% 9.4% 9.0% 8.3%
2014/15 to 2015/16 3,372 74.9% 7.4% 8.7% 9.0%
Ten Year Average 2,471 70.5% 10.5% 6.9% 12.1%
Table 11: Statewide Beginning Teacher Year-by-Year Retention and Mobility Trend Data
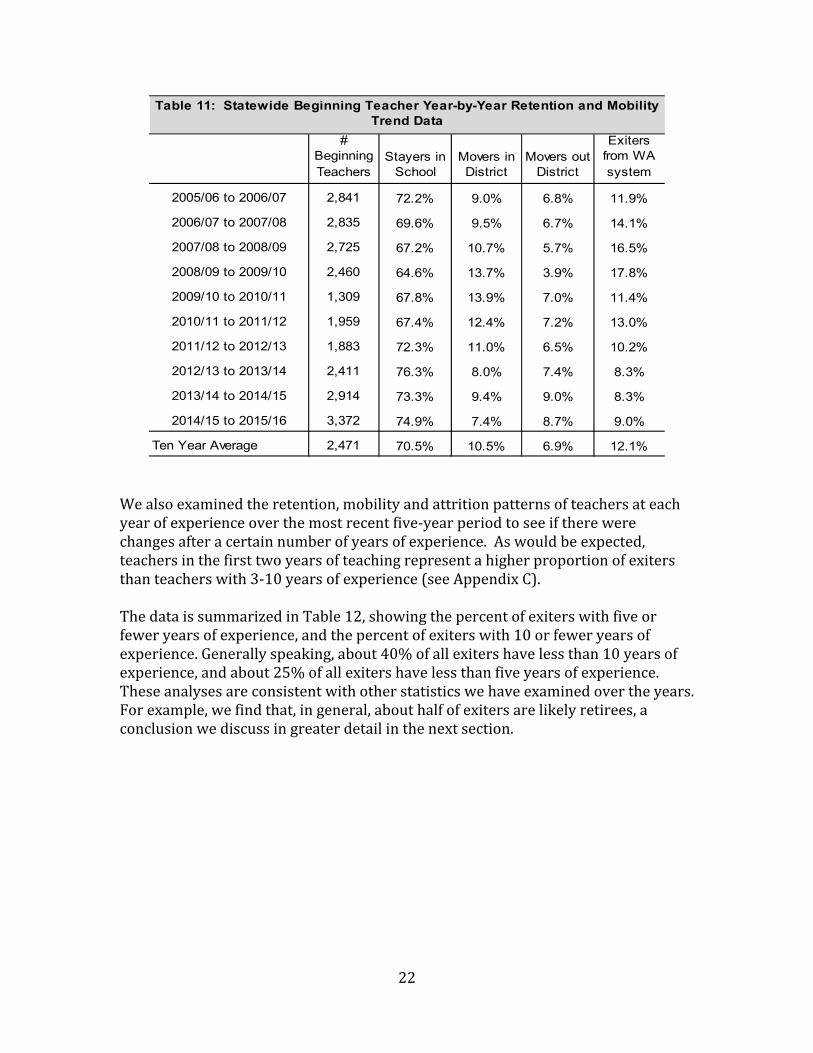
Wealsoexaminedtheretention,mobilityandattritionpatternsofteachersateachyearofexperienceoverthemostrecentfive‐yearperiodtoseeiftherewerechangesafteracertainnumberofyearsofexperience.Aswouldbeexpected,teachersinthefirsttwoyearsofteachingrepresentahigherproportionofexitersthanteacherswith3‐10yearsofexperience(seeAppendixC).ThedataissummarizedinTable12,showingthepercentofexiterswithfiveorfeweryearsofexperience,andthepercentofexiterswith10orfeweryearsofexperience.Generallyspeaking,about40%ofallexitershavelessthan10yearsofexperience,andabout25%ofallexitershavelessthanfiveyearsofexperience.Theseanalysesareconsistentwithotherstatisticswehaveexaminedovertheyears.Forexample,wefindthat,ingeneral,abouthalfofexitersarelikelyretirees,aconclusionwediscussingreaterdetailinthenextsection.
23
Number Percent Number Percent Number Percent Number Percent Number Percent
All Exiters
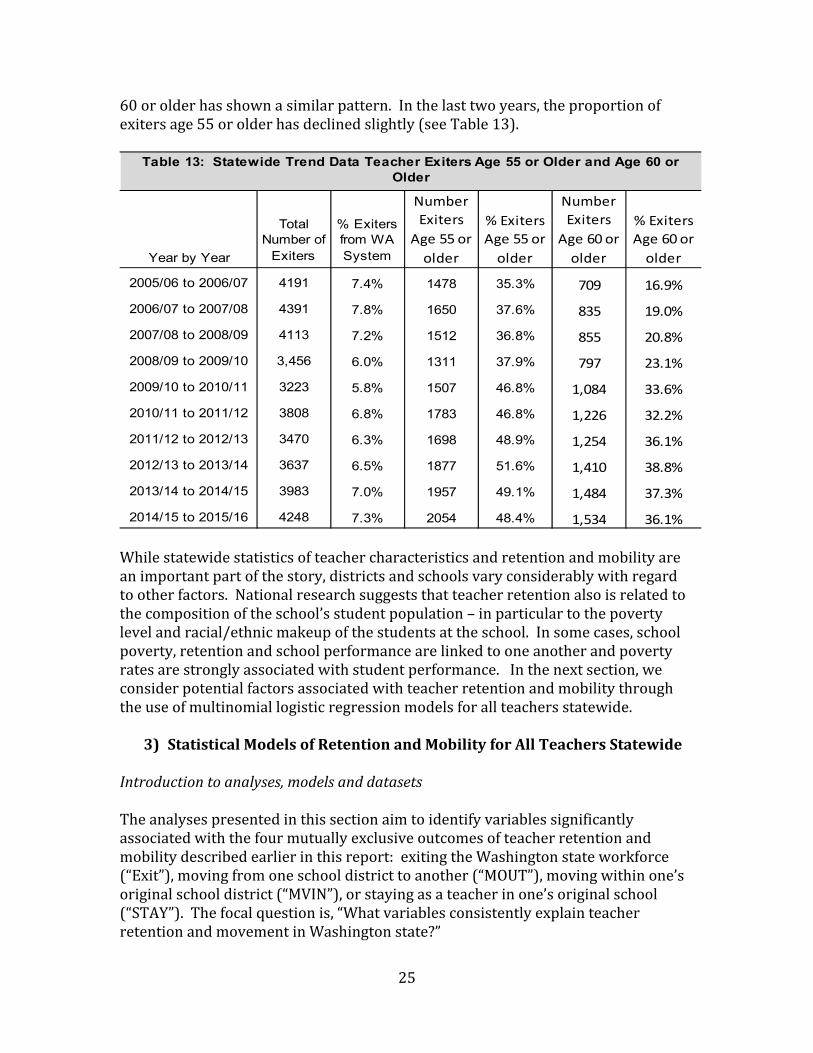
Statewide 3808 6.8% 3470 6.3% 3637 6.5% 3983 7.0% 4248 7.3%% Teachers exiting with 5 or fewer years of experience 1036 27.2% 845 24.4% 790 21.7% 891 22.4% 1109 26.1%% Teachers exiting with 10 or fewer years of experience 1689 44.4% 1454 41.9% 1418 39.0% 1563 39.2% 1815 42.7%
Table 12: Statewide Trend Data: Summary of Teacher Exiters by Experience in First 10 Years
2014/15 to
2015/16
2010/11 to
2011/12
2011/12 to
2012/13
2012/13 to
2013/14
2013/14 to
2014/15
C. FactorsInfluencingTeacherRetentionandMobility
1) TeacherExperience
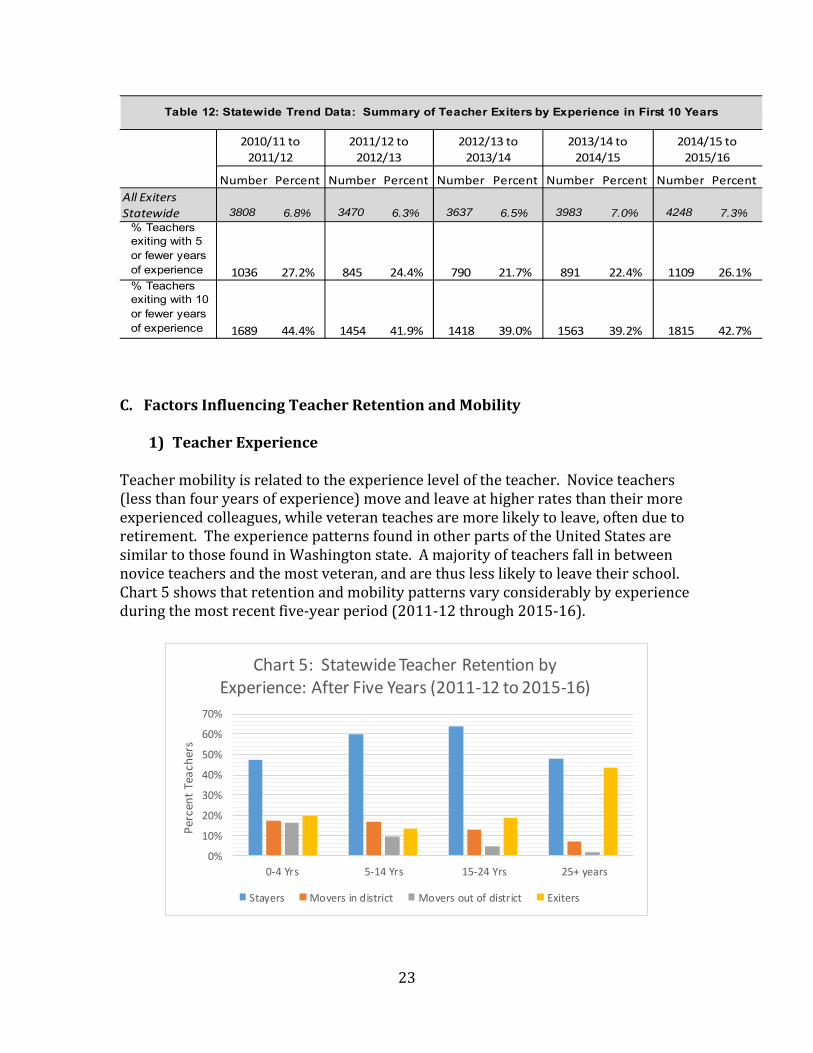
Teachermobilityisrelatedtotheexperienceleveloftheteacher.Noviceteachers(lessthanfouryearsofexperience)moveandleaveathigherratesthantheirmoreexperiencedcolleagues,whileveteranteachesaremorelikelytoleave,oftenduetoretirement.TheexperiencepatternsfoundinotherpartsoftheUnitedStatesaresimilartothosefoundinWashingtonstate.Amajorityofteachersfallinbetweennoviceteachersandthemostveteran,andarethuslesslikelytoleavetheirschool.Chart5showsthatretentionandmobilitypatternsvaryconsiderablybyexperienceduringthemostrecentfive‐yearperiod(2011‐12through2015‐16).
0%
10%
20%
30%
40%
50%
60%
70%
0‐4 Yrs 5‐14 Yrs 15‐24 Yrs 25+ years
Percent Teach
ers
Chart 5: Statewide Teacher Retention by Experience: After Five Years (2011‐12 to 2015‐16)
Stayers Movers in district Movers out of district Exiters
24
Noviceteachers(0‐4yearsofexperience)andveteranteachers(25ormoreyearsofexperience)stayintheirschoolsatlowerrates(47%and48%,respectively),thanmid‐experienceteachers(5‐14years,60%,and15‐14years,64%).Veteranteachershavethehighestratesofexiting(44%),comparedwith20%ofnovices,and13%and19%ofmid‐experienceteachers.Understandingtheoverallexperienceandagedistributionofastate’sworkforcehelpstoaccountforpatternsofteacherretentionwhilesignalingparticularaspectsthatmaymeritacloserlook.
2) ExitersinRelationtoAge
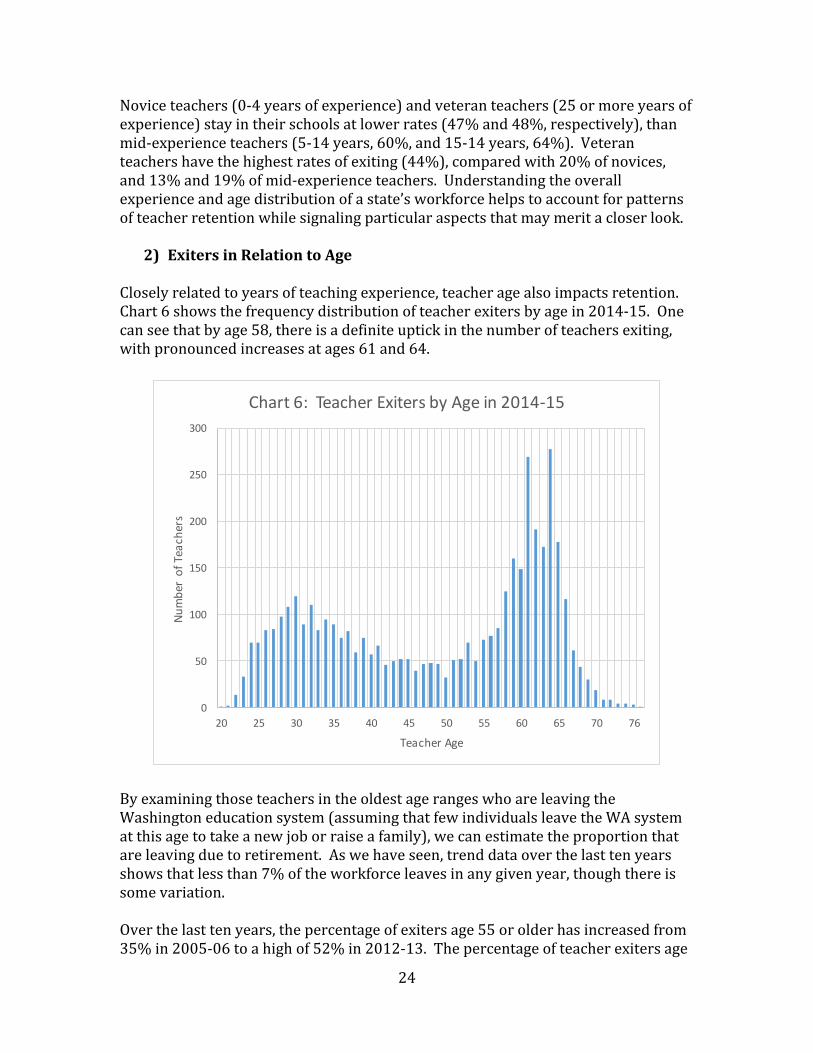
Closelyrelatedtoyearsofteachingexperience,teacheragealsoimpactsretention.Chart6showsthefrequencydistributionofteacherexitersbyagein2014‐15.Onecanseethatbyage58,thereisadefiniteuptickinthenumberofteachersexiting,withpronouncedincreasesatages61and64.
0
50
100
150
200
250
300
20 25 30 35 40 45 50 55 60 65 70 76
Number of Teach
ers
Teacher Age
Chart 6: Teacher Exiters by Age in 2014‐15
ByexaminingthoseteachersintheoldestagerangeswhoareleavingtheWashingtoneducationsystem(assumingthatfewindividualsleavetheWAsystematthisagetotakeanewjoborraiseafamily),wecanestimatetheproportionthatareleavingduetoretirement.Aswehaveseen,trenddataoverthelasttenyearsshowsthatlessthan7%oftheworkforceleavesinanygivenyear,thoughthereissomevariation.Overthelasttenyears,thepercentageofexitersage55orolderhasincreasedfrom35%in2005‐06toahighof52%in2012‐13.Thepercentageofteacherexitersage
25
60orolderhasshownasimilarpattern.Inthelasttwoyears,theproportionofexitersage55orolderhasdeclinedslightly(seeTable13).
Year by Year
Total Number of
Exiters
% Exiters from WA System
Number
Exiters
Age 55 or
older
% Exiters
Age 55 or
older
Number
Exiters
Age 60 or
older
% Exiters
Age 60 or
older
2005/06 to 2006/07 4191 7.4% 1478 35.3% 709 16.9%
2006/07 to 2007/08 4391 7.8% 1650 37.6% 835 19.0%
2007/08 to 2008/09 4113 7.2% 1512 36.8% 855 20.8%
2008/09 to 2009/10 3,456 6.0% 1311 37.9% 797 23.1%
2009/10 to 2010/11 3223 5.8% 1507 46.8% 1,084 33.6%
2010/11 to 2011/12 3808 6.8% 1783 46.8% 1,226 32.2%
2011/12 to 2012/13 3470 6.3% 1698 48.9% 1,254 36.1%
2012/13 to 2013/14 3637 6.5% 1877 51.6% 1,410 38.8%
2013/14 to 2014/15 3983 7.0% 1957 49.1% 1,484 37.3%
2014/15 to 2015/16 4248 7.3% 2054 48.4% 1,534 36.1%
Table 13: Statewide Trend Data Teacher Exiters Age 55 or Older and Age 60 or Older
Whilestatewidestatisticsofteachercharacteristicsandretentionandmobilityareanimportantpartofthestory,districtsandschoolsvaryconsiderablywithregardtootherfactors.Nationalresearchsuggeststhatteacherretentionalsoisrelatedtothecompositionoftheschool’sstudentpopulation–inparticulartothepovertylevelandracial/ethnicmakeupofthestudentsattheschool.Insomecases,schoolpoverty,retentionandschoolperformancearelinkedtooneanotherandpovertyratesarestronglyassociatedwithstudentperformance.Inthenextsection,weconsiderpotentialfactorsassociatedwithteacherretentionandmobilitythroughtheuseofmultinomiallogisticregressionmodelsforallteachersstatewide.
3) StatisticalModelsofRetentionandMobilityforAllTeachersStatewideIntroductiontoanalyses,modelsanddatasetsTheanalysespresentedinthissectionaimtoidentifyvariablessignificantlyassociatedwiththefourmutuallyexclusiveoutcomesofteacherretentionandmobilitydescribedearlierinthisreport:exitingtheWashingtonstateworkforce(“Exit”),movingfromoneschooldistricttoanother(“MOUT”),movingwithinone’soriginalschooldistrict(“MVIN”),orstayingasateacherinone’soriginalschool(“STAY”).Thefocalquestionis,“WhatvariablesconsistentlyexplainteacherretentionandmovementinWashingtonstate?”
26
WeconstructedmultinomiallogisticregressionmodelsusingSTATA14.1softwaretoinvestigatetherelationshipbetweenourdependentnominaloutcomevariablesofinterest(e.g.,exiting,movingoutofdistrict,movingwithindistrict,orstaying)andanumberofcontinuousandcategoricalindependentvariables.Theindependentvariablesincludeddistrict,school,andindividuallevelcharacteristics,suchasstudentenrollmentatthedistrictlevel,thepercentageofstudentsinpovertyattheschoollevel,andfull‐timeteachingstatusattheindividuallevel.ThevariablesusedintheseanalysesarelocatedinAppendicesDthroughG.Thetwomainpopulationsinvestigatedincludeallteachers(acrossallyearsofexperience),andbeginningteachers(thosewithlessthan1yearofteachingexperience).5WeusedthreedistinctdatasetstoinvestigatetheretentionandmobilityofteachersinWashingtonacrosstime.The2010‐11to2014‐15dataset(N=56,222),consistedofallteachersstatewideduringthe2010‐11academicyear,whoseretentionandmobilityoutcomesareanalyzedfiveyearslater,inthe2014‐15academicyear.Amorerecentfive‐yeardatasetfor2011‐12to2015‐16(N=55,277),consistedofallteachersstatewideduringthe2011‐12academicyear,whoseretentionandmobilityoutcomesareanalyzedfiveyearslater,inthe2015‐16academicyear.AnalysisofallteachersstatewidebyretentionandmobilityoutcomesWefirstpresentfindingsfortheentiresampleofallteachers(acrossallyearsofexperience),notingconsistentpatternsthatemergedfrombothdatasets.ThecompletemultinomiallogisticregressionSTATAoutputforthe2010‐11to2014‐15datasetcanbefoundinAppendixD,whileAppendixEpresentsoutputforthe2011‐12to2105‐16timeframe.ExitersfromtheWAteacherworkforceThefirstgroupdiscussedisteacherswhoexitfromtheWashingtonworkforce.Astheanalysesrunweremultinomiallogisticregressions,eachoutcomeiscomparedtoareferencegroup.Stayinginthesameschoolfiveyearslater(stayer)wasselectedasthereferencegroupsincethisoutcomerepresentsthemajorityofteachersinourdatasets.SeeTable14forthedescriptivestatisticsonteachersfrombothfive‐yeartimeperiods.
5Withbeginningteachers,wewereespeciallyinterestedinnotonlywhichvariableshelpedtoexplainretentionandmobilityoutcomesmoregenerally,butalsowhetherthestate’sBeginningEducatorandSupportTeamprogram(BEST)meantasaninductionsupportfornewteachers,hadasignificanteffectontheobservedoutcomes.AnalysisofretentionandmobilityoutcomesfortheBESTprogramarepresentedinaseparatereport.

27
Five-Year Period Number Percent Number Percent Number Percent Number Percent
2010/11 to 2014/15 56,200 32,723 58.2% 8269 14.7% 3708 6.6% 11500 20.5%
2011-12 to 2015-16 55,277 31,455 56.9% 7834 14.2% 4489 8.1% 11499 20.8%
Table 14: Statewide Retention and Mobility Outcomes for Two Five-Year Time Periods
Stayers in SchoolTotal
NumberMovers in District
Movers out District
Exiters from WA system
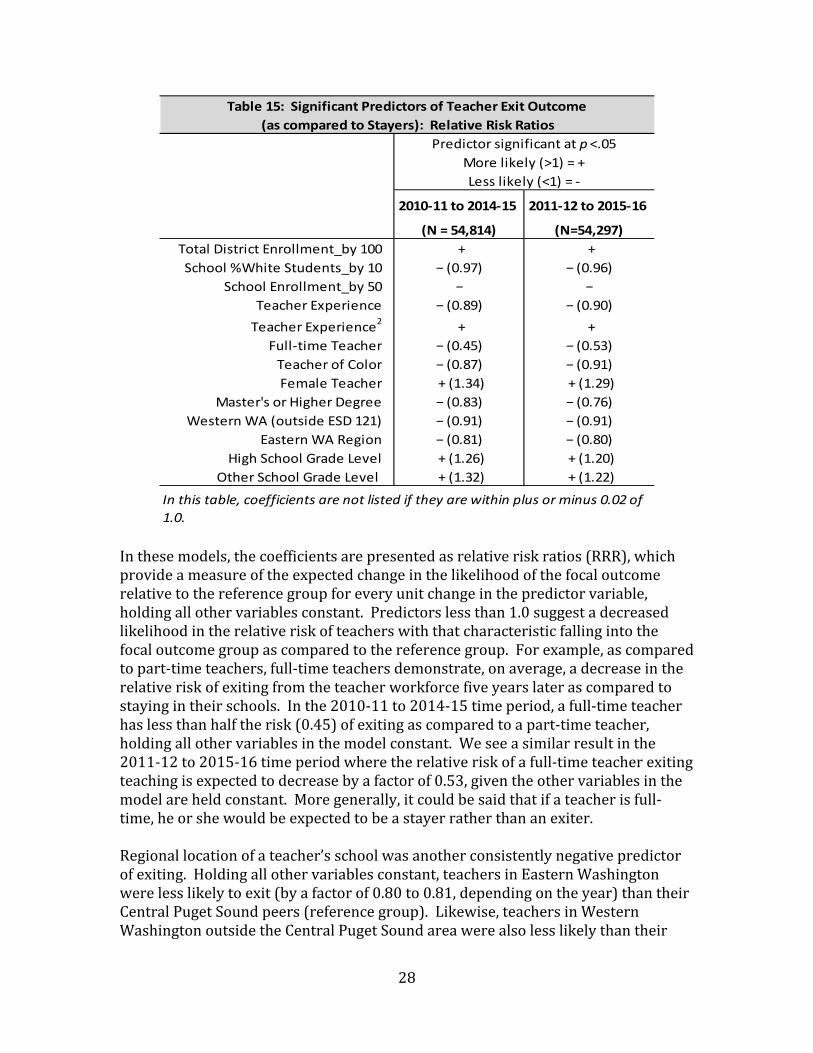
AsseeninTable15,mostindependentvariablesincludedinthemodelwereidentifiedassignificantpredictorsoftheExitoutcome(p<.05)inbothofthefive‐yeartimeperiods,indicatingtheirindividualcontributionstothemodelsaboveandbeyondtheotherincludedmeasuresofdistrict,school,andindividuallevelcharacteristics.Somemodelsincludeyearsofteacherexperience,aswellassquaredyearsofexperience,toreflectthenonlinearrelationshipofexperiencewithmobilityoutcomes.Forexample,asillustratedinChart6,likelihoodsofexitingarehigherneartheendsoftheage/experiencerange.Includingsquaredyearsofexperienceallowsustomodelthistypeofnonlinearity.Unlessotherwisenoted,onlystatisticallysignificantpredictorsthatexhibitconsistentpatternsacrossbothfive‐yeartimeperiodswillbediscussed.However,noteverysignificant,consistentpredictorwillbediscussed.Itishopedthatbypresentinganumberofdetailedexamples,thereaderwillbepositionedtoapplythesameinterpretationprocesstoothervariablesofinterest.
28
2010‐11 to 2014‐15 2011‐12 to 2015‐16
(N = 54,814) (N=54,297)
Total District Enrollment_by 100 .+ .+
School %White Students_by 10 − (0.97) − (0.96)
School Enrollment_by 50 − −
Teacher Experience − (0.89) − (0.90)
Teacher Experience2
.+ .+
Full‐time Teacher − (0.45) − (0.53)
Teacher of Color − (0.87) − (0.91)
Female Teacher .+ (1.34) .+ (1.29)
Master's or Higher Degree − (0.83) − (0.76)
Western WA (outside ESD 121) − (0.91) − (0.91)
Eastern WA Region − (0.81) − (0.80)
High School Grade Level .+ (1.26) .+ (1.20)
Other School Grade Level .+ (1.32) .+ (1.22)
In this table, coefficients are not listed if they are within plus or minus 0.02 of
1.0.
Table 15: Significant Predictors of Teacher Exit Outcome
(as compared to Stayers): Relative Risk Ratios
Predictor significant at p <.05
More likely (>1) = +
Less likely (<1) = ‐
Inthesemodels,thecoefficientsarepresentedasrelativeriskratios(RRR),whichprovideameasureoftheexpectedchangeinthelikelihoodofthefocaloutcomerelativetothereferencegroupforeveryunitchangeinthepredictorvariable,holdingallothervariablesconstant.Predictorslessthan1.0suggestadecreasedlikelihoodintherelativeriskofteacherswiththatcharacteristicfallingintothefocaloutcomegroupascomparedtothereferencegroup.Forexample,ascomparedtopart‐timeteachers,full‐timeteachersdemonstrate,onaverage,adecreaseintherelativeriskofexitingfromtheteacherworkforcefiveyearslaterascomparedtostayingintheirschools.Inthe2010‐11to2014‐15timeperiod,afull‐timeteacherhaslessthanhalftherisk(0.45)ofexitingascomparedtoapart‐timeteacher,holdingallothervariablesinthemodelconstant.Weseeasimilarresultinthe2011‐12to2015‐16timeperiodwheretherelativeriskofafull‐timeteacherexitingteachingisexpectedtodecreasebyafactorof0.53,giventheothervariablesinthemodelareheldconstant.Moregenerally,itcouldbesaidthatifateacherisfull‐time,heorshewouldbeexpectedtobeastayerratherthananexiter.Regionallocationofateacher’sschoolwasanotherconsistentlynegativepredictorofexiting.Holdingallothervariablesconstant,teachersinEasternWashingtonwerelesslikelytoexit(byafactorof0.80to0.81,dependingontheyear)thantheirCentralPugetSoundpeers(referencegroup).Likewise,teachersinWesternWashingtonoutsidetheCentralPugetSoundareawerealsolesslikelythantheir
29
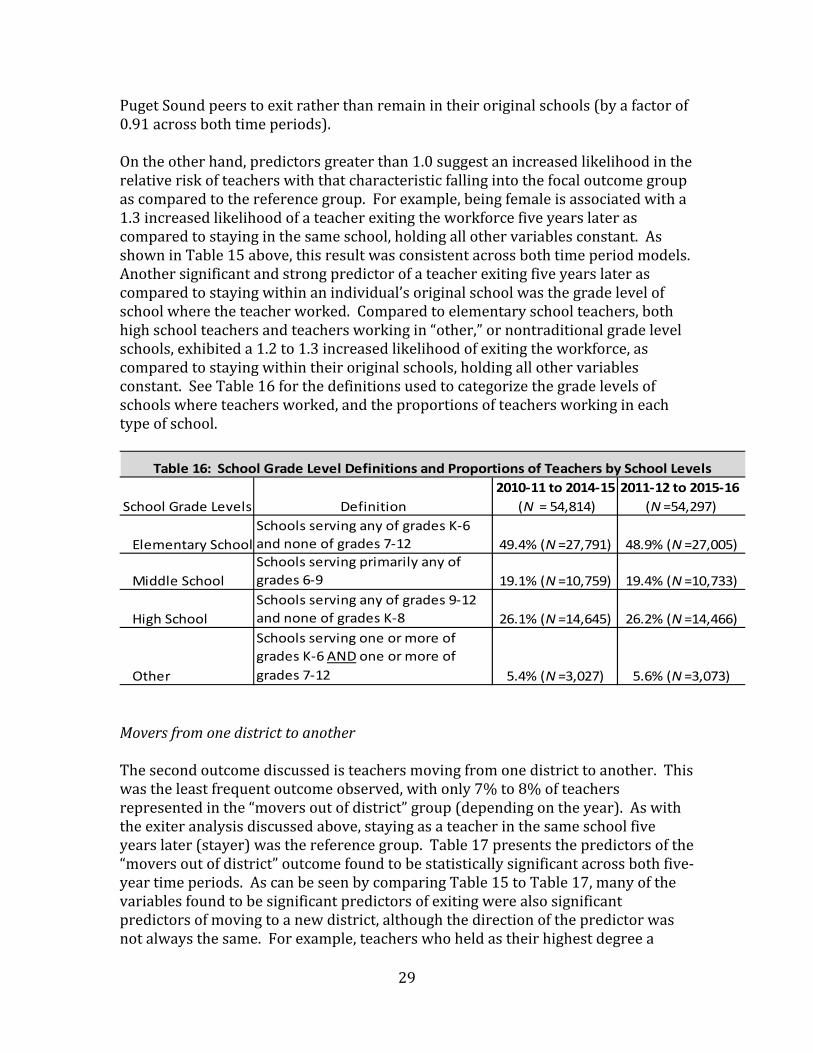
PugetSoundpeerstoexitratherthanremainintheiroriginalschools(byafactorof0.91acrossbothtimeperiods).Ontheotherhand,predictorsgreaterthan1.0suggestanincreasedlikelihoodintherelativeriskofteacherswiththatcharacteristicfallingintothefocaloutcomegroupascomparedtothereferencegroup.Forexample,beingfemaleisassociatedwitha1.3increasedlikelihoodofateacherexitingtheworkforcefiveyearslaterascomparedtostayinginthesameschool,holdingallothervariablesconstant.AsshowninTable15above,thisresultwasconsistentacrossbothtimeperiodmodels.Anothersignificantandstrongpredictorofateacherexitingfiveyearslaterascomparedtostayingwithinanindividual’soriginalschoolwasthegradelevelofschoolwheretheteacherworked.Comparedtoelementaryschoolteachers,bothhighschoolteachersandteachersworkingin“other,”ornontraditionalgradelevelschools,exhibiteda1.2to1.3increasedlikelihoodofexitingtheworkforce,ascomparedtostayingwithintheiroriginalschools,holdingallothervariablesconstant.SeeTable16forthedefinitionsusedtocategorizethegradelevelsofschoolswhereteachersworked,andtheproportionsofteachersworkingineachtypeofschool.
2010‐11 to 2014‐15 2011‐12 to 2015‐16
School Grade Levels Definition (N = 54,814) (N =54,297)
Elementary School
Schools serving any of grades K‐6
and none of grades 7‐12 49.4% (N =27,791) 48.9% (N =27,005)
Middle School
Schools serving primarily any of
grades 6‐9 19.1% (N =10,759) 19.4% (N =10,733)
High School
Schools serving any of grades 9‐12
and none of grades K‐8 26.1% (N =14,645) 26.2% (N =14,466)
Other
Schools serving one or more of
grades K‐6 AND one or more of
grades 7‐12 5.4% (N =3,027) 5.6% (N =3,073)
Table 16: School Grade Level Definitions and Proportions of Teachers by School Levels
MoversfromonedistricttoanotherThesecondoutcomediscussedisteachersmovingfromonedistricttoanother.Thiswastheleastfrequentoutcomeobserved,withonly7%to8%ofteachersrepresentedinthe“moversoutofdistrict”group(dependingontheyear).Aswiththeexiteranalysisdiscussedabove,stayingasateacherinthesameschoolfiveyearslater(stayer)wasthereferencegroup.Table17presentsthepredictorsofthe“moversoutofdistrict”outcomefoundtobestatisticallysignificantacrossbothfive‐yeartimeperiods.AscanbeseenbycomparingTable15toTable17,manyofthevariablesfoundtobesignificantpredictorsofexitingwerealsosignificantpredictorsofmovingtoanewdistrict,althoughthedirectionofthepredictorwasnotalwaysthesame.Forexample,teacherswhoheldastheirhighestdegreea
30
master’sorabovewerelesslikelytoexitthantostayascomparedtotheirpeersholdingabachelor’sdegree(coefficientsof‐0.83and‐0.76,dependingontheyear).However,thesesameteacherswithadvanceddegreesweremorelikelytomovetoateachingpositioninadifferentschooldistrictascomparedtotheirpeerswithbachelor’sdegrees(coefficientsof1.24and1.26,dependingontheyear).Ontheotherhand,certainpredictorswerefoundtohaveaneffectononeoutcomebutnottheother.Forinstance,holdingallothervariablesconstant,beingateacherofcolor(approximately10%ofthestatewideteacherworkforce),ascomparedtobeingaWhiteteacher,wasassociatedwithadecreasedlikelihoodofexitingtheteachingworkforce(coefficientsof‐0.87and‐0.91,dependingontheyear).Therewasnosuchobservedeffectofteacherrace/ethnicityonmovingtoanewschooldistrict.Likewise,whilebeingfemalewasasignificantpredictorofexiting(coefficientof1.3regardlessofyear),genderofteacherwasfoundnottomatterwhenitcametothelikelihoodofmovingtoanewdistrict.Similartotheresultsoftheexitermodelpresentedabove,full‐timeteacherstatuswasassociatedwithadecreasedlikelihoodofmovingoutofone’soriginaldistrict(coefficientsof‐0.63and‐0.80,dependingontheyear),indicatingthatfull‐timeteachersweremorelikelytoremainintheiroriginalschools.Regionwasalsoasignificantpredictor,withteachersinWesternWashingtonoutsidetheCentralPugetSoundandEasternWashingtonlesslikelytomoveoutoftheirdistrictsthantheirCentralPugetSoundcounterparts(coefficientsrangingfrom‐0.63to‐0.72,dependingontheyearandregion).Finally,weseeanemergingpatternbetweenthegradeleveloftheschoolwhereteachersworkandretentionandmobilityoutcomes.Highergrades(middleandhighschools)and“other”configurationsofschoolsareassociatedwithmuchhigherlikelihoodsofmovementoutofone’soriginalschool(coefficientsrangingfrom1.24to2.26,dependingontheyearandgradelevelofschool).
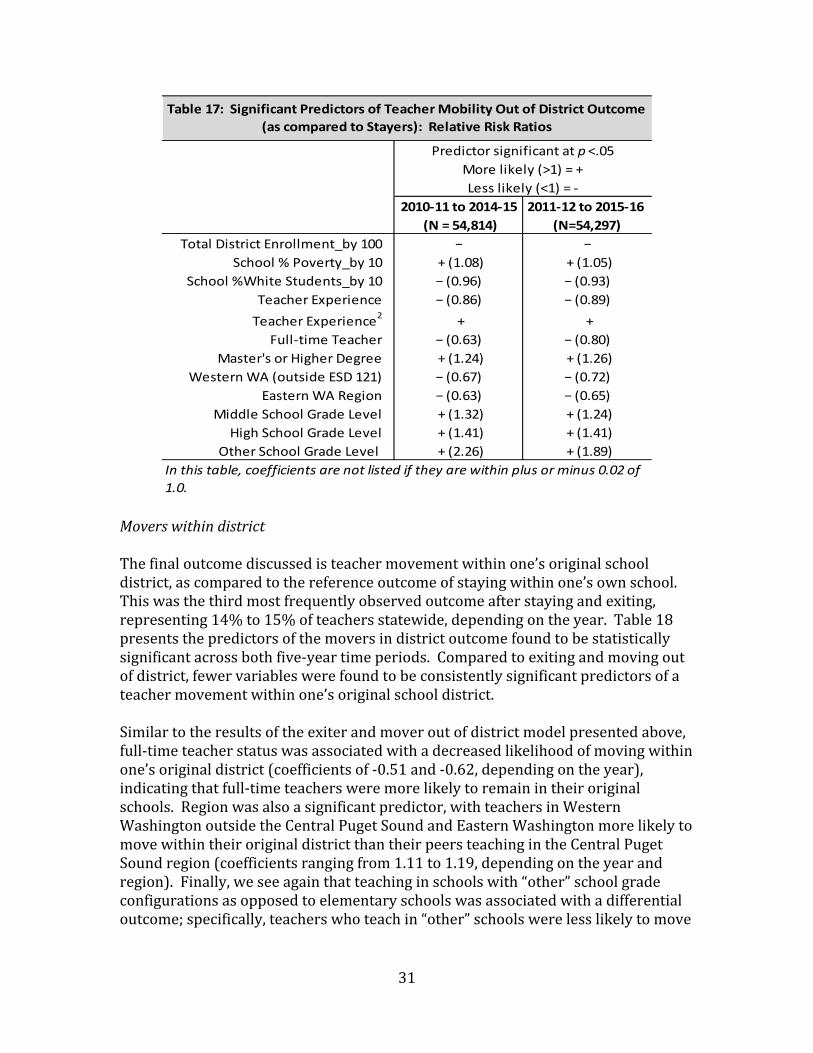
31
2010‐11 to 2014‐15 2011‐12 to 2015‐16
(N = 54,814) (N=54,297)
Total District Enrollment_by 100 − −
School % Poverty_by 10 .+ (1.08) .+ (1.05)
School %White Students_by 10 − (0.96) − (0.93)
Teacher Experience − (0.86) − (0.89)
Teacher Experience2
.+ .+
Full‐time Teacher − (0.63) − (0.80)
Master's or Higher Degree .+ (1.24) .+ (1.26)
Western WA (outside ESD 121) − (0.67) − (0.72)
Eastern WA Region − (0.63) − (0.65)
Middle School Grade Level .+ (1.32) .+ (1.24)
High School Grade Level .+ (1.41) .+ (1.41)
Other School Grade Level .+ (2.26) .+ (1.89)
Table 17: Significant Predictors of Teacher Mobility Out of District Outcome
(as compared to Stayers): Relative Risk Ratios
In this table, coefficients are not listed if they are within plus or minus 0.02 of
1.0.
Predictor significant at p <.05
More likely (>1) = +
Less likely (<1) = ‐
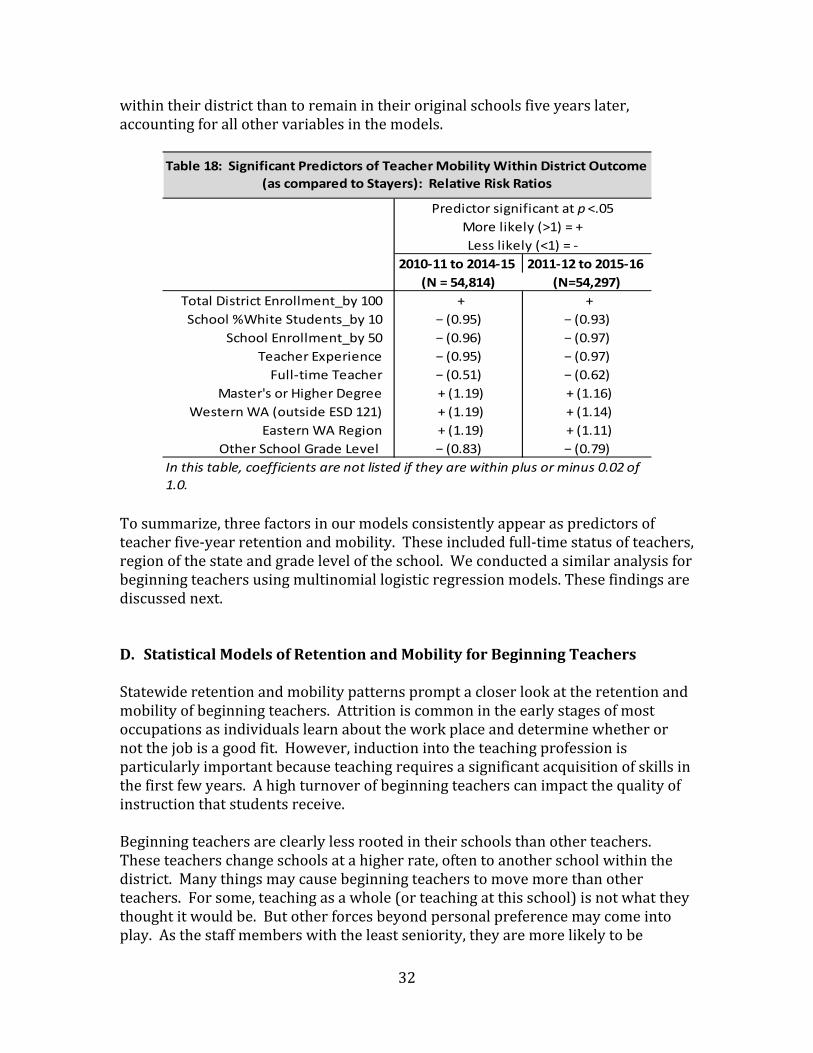
MoverswithindistrictThefinaloutcomediscussedisteachermovementwithinone’soriginalschooldistrict,ascomparedtothereferenceoutcomeofstayingwithinone’sownschool.Thiswasthethirdmostfrequentlyobservedoutcomeafterstayingandexiting,representing14%to15%ofteachersstatewide,dependingontheyear.Table18presentsthepredictorsofthemoversindistrictoutcomefoundtobestatisticallysignificantacrossbothfive‐yeartimeperiods.Comparedtoexitingandmovingoutofdistrict,fewervariableswerefoundtobeconsistentlysignificantpredictorsofateachermovementwithinone’soriginalschooldistrict.Similartotheresultsoftheexiterandmoveroutofdistrictmodelpresentedabove,full‐timeteacherstatuswasassociatedwithadecreasedlikelihoodofmovingwithinone’soriginaldistrict(coefficientsof‐0.51and‐0.62,dependingontheyear),indicatingthatfull‐timeteachersweremorelikelytoremainintheiroriginalschools.Regionwasalsoasignificantpredictor,withteachersinWesternWashingtonoutsidetheCentralPugetSoundandEasternWashingtonmorelikelytomovewithintheiroriginaldistrictthantheirpeersteachingintheCentralPugetSoundregion(coefficientsrangingfrom1.11to1.19,dependingontheyearandregion).Finally,weseeagainthatteachinginschoolswith“other”schoolgradeconfigurationsasopposedtoelementaryschoolswasassociatedwithadifferentialoutcome;specifically,teacherswhoteachin“other”schoolswerelesslikelytomove
32
withintheirdistrictthantoremainintheiroriginalschoolsfiveyearslater,accountingforallothervariablesinthemodels.
2010‐11 to 2014‐15 2011‐12 to 2015‐16
(N = 54,814) (N=54,297)
Total District Enrollment_by 100 .+ .+
School %White Students_by 10 − (0.95) − (0.93)
School Enrollment_by 50 − (0.96) − (0.97)
Teacher Experience − (0.95) − (0.97)
Full‐time Teacher − (0.51) − (0.62)
Master's or Higher Degree .+ (1.19) .+ (1.16)
Western WA (outside ESD 121) .+ (1.19) .+ (1.14)
Eastern WA Region .+ (1.19) .+ (1.11)
Other School Grade Level − (0.83) − (0.79)
In this table, coefficients are not listed if they are within plus or minus 0.02 of
1.0.
Table 18: Significant Predictors of Teacher Mobility Within District Outcome
(as compared to Stayers): Relative Risk Ratios
Predictor significant at p<.05
More likely (>1) = +
Less likely (<1) = ‐
Tosummarize,threefactorsinourmodelsconsistentlyappearaspredictorsofteacherfive‐yearretentionandmobility.Theseincludedfull‐timestatusofteachers,regionofthestateandgradeleveloftheschool.Weconductedasimilaranalysisforbeginningteachersusingmultinomiallogisticregressionmodels.Thesefindingsarediscussednext.D. StatisticalModelsofRetentionandMobilityforBeginningTeachers
Statewideretentionandmobilitypatternspromptacloserlookattheretentionandmobilityofbeginningteachers.Attritioniscommonintheearlystagesofmostoccupationsasindividualslearnabouttheworkplaceanddeterminewhetherornotthejobisagoodfit.However,inductionintotheteachingprofessionisparticularlyimportantbecauseteachingrequiresasignificantacquisitionofskillsinthefirstfewyears.Ahighturnoverofbeginningteacherscanimpactthequalityofinstructionthatstudentsreceive.Beginningteachersareclearlylessrootedintheirschoolsthanotherteachers.Theseteacherschangeschoolsatahigherrate,oftentoanotherschoolwithinthedistrict.Manythingsmaycausebeginningteacherstomovemorethanotherteachers.Forsome,teachingasawhole(orteachingatthisschool)isnotwhattheythoughtitwouldbe.Butotherforcesbeyondpersonalpreferencemaycomeintoplay.Asthestaffmemberswiththeleastseniority,theyaremorelikelytobe
33
impactedbyareductioninforce,changesinenrollmentorschoolordistrictorganizationalchanges.
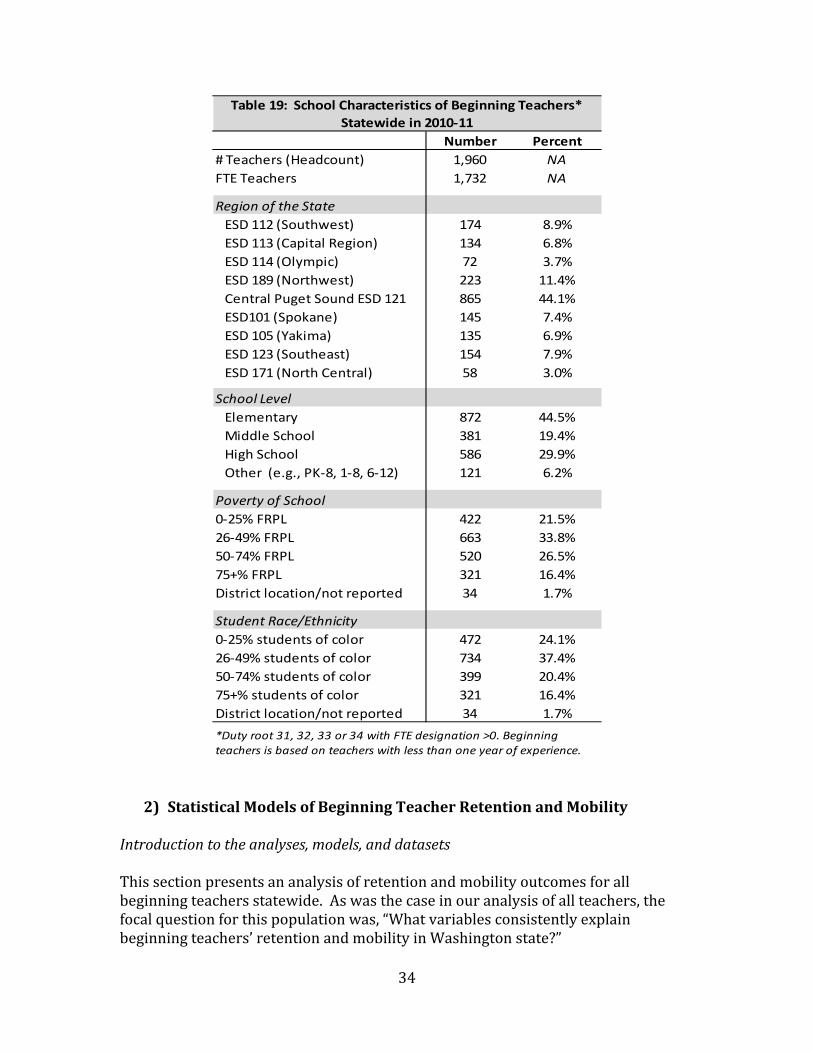
1) SchoolCharacteristicsofBeginningTeachersInordertounderstandthevariablesusedinthestatisticalmodelsforbeginningteachers,weincludeadescriptivelookattheirschoolcharacteristicsin2010‐11.Table19showsthatthelargestproportionofbeginningteacherswerelocatedintheCentralPugetSoundregion(44%),and45%workedattheelementaryschoollevel.Forty‐threepercentofbeginningteachersworkedinschoolswithpovertyratesof50%ormore.Earlierinthisreport,wepresenttheregionalvariationinretentionandmobilityratesofbeginningteachers(seeTable9).Thestatisticalmodelstakeintoaccountregional,district,school,andindividualleveldifferences.
34
Number Percent
# Teachers (Headcount) 1,960 NA
FTE Teachers 1,732 NA
Region of the State
ESD 112 (Southwest) 174 8.9%
ESD 113 (Capital Region) 134 6.8%
ESD 114 (Olympic) 72 3.7%
ESD 189 (Northwest) 223 11.4%
Central Puget Sound ESD 121 865 44.1%
ESD101 (Spokane) 145 7.4%
ESD 105 (Yakima) 135 6.9%
ESD 123 (Southeast) 154 7.9%
ESD 171 (North Central) 58 3.0%
School Level
Elementary 872 44.5%
Middle School 381 19.4%
High School 586 29.9%
Other (e.g., PK‐8, 1‐8, 6‐12) 121 6.2%
Poverty of School
0‐25% FRPL 422 21.5%
26‐49% FRPL 663 33.8%
50‐74% FRPL 520 26.5%
75+% FRPL 321 16.4%
District location/not reported 34 1.7%
Student Race/Ethnicity
0‐25% students of color 472 24.1%
26‐49% students of color 734 37.4%
50‐74% students of color 399 20.4%
75+% students of color 321 16.4%
District location/not reported 34 1.7%
*Duty root 31, 32, 33 or 34 with FTE designation >0. Beginning teachers is based on teachers with less than one year of experience.
Table 19: School Characteristics of Beginning Teachers*
Statewide in 2010‐11
2) StatisticalModelsofBeginningTeacherRetentionandMobility
Introductiontotheanalyses,models,anddatasetsThissectionpresentsananalysisofretentionandmobilityoutcomesforallbeginningteachersstatewide.Aswasthecaseinouranalysisofallteachers,thefocalquestionforthispopulationwas,“Whatvariablesconsistentlyexplainbeginningteachers’retentionandmobilityinWashingtonstate?”
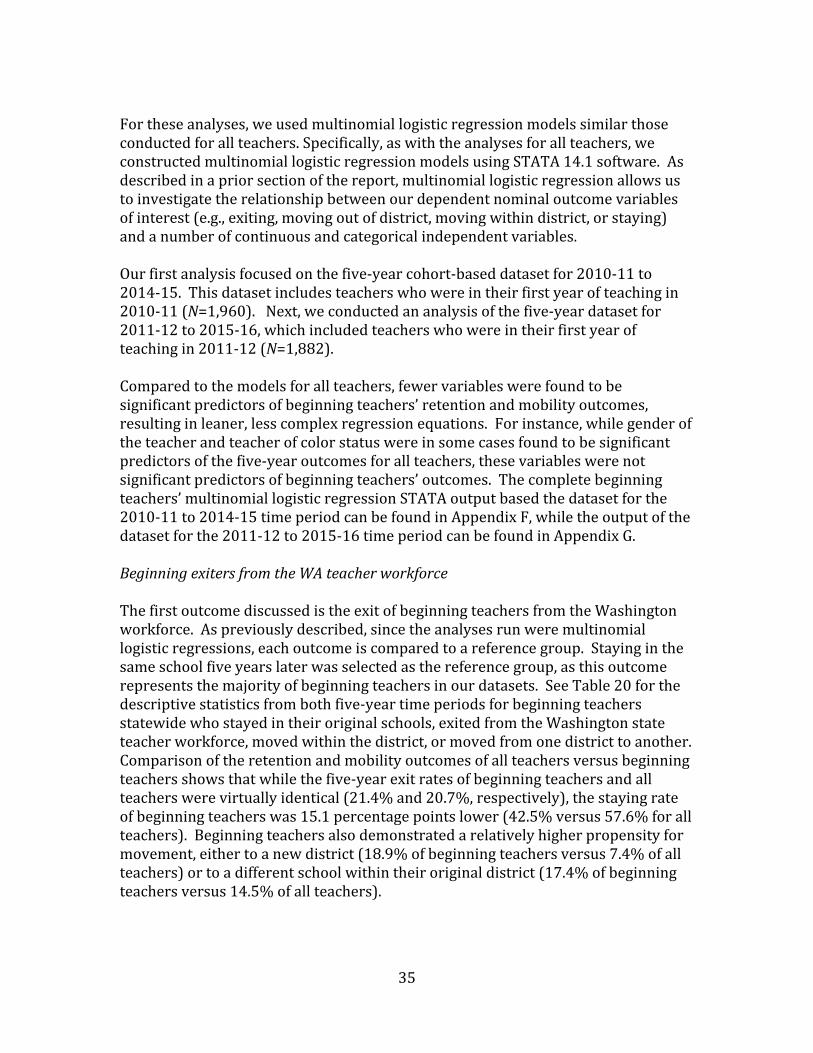
35
Fortheseanalyses,weusedmultinomiallogisticregressionmodelssimilarthoseconductedforallteachers.Specifically,aswiththeanalysesforallteachers,weconstructedmultinomiallogisticregressionmodelsusingSTATA14.1software.Asdescribedinapriorsectionofthereport,multinomiallogisticregressionallowsustoinvestigatetherelationshipbetweenourdependentnominaloutcomevariablesofinterest(e.g.,exiting,movingoutofdistrict,movingwithindistrict,orstaying)andanumberofcontinuousandcategoricalindependentvariables.Ourfirstanalysisfocusedonthefive‐yearcohort‐baseddatasetfor2010‐11to2014‐15.Thisdatasetincludesteacherswhowereintheirfirstyearofteachingin2010‐11(N=1,960).Next,weconductedananalysisofthefive‐yeardatasetfor2011‐12to2015‐16,whichincludedteacherswhowereintheirfirstyearofteachingin2011‐12(N=1,882).Comparedtothemodelsforallteachers,fewervariableswerefoundtobesignificantpredictorsofbeginningteachers’retentionandmobilityoutcomes,resultinginleaner,lesscomplexregressionequations.Forinstance,whilegenderoftheteacherandteacherofcolorstatuswereinsomecasesfoundtobesignificantpredictorsofthefive‐yearoutcomesforallteachers,thesevariableswerenotsignificantpredictorsofbeginningteachers’outcomes.Thecompletebeginningteachers’multinomiallogisticregressionSTATAoutputbasedthedatasetforthe2010‐11to2014‐15timeperiodcanbefoundinAppendixF,whiletheoutputofthedatasetforthe2011‐12to2015‐16timeperiodcanbefoundinAppendixG.BeginningexitersfromtheWAteacherworkforceThefirstoutcomediscussedistheexitofbeginningteachersfromtheWashingtonworkforce.Aspreviouslydescribed,sincetheanalysesrunweremultinomiallogisticregressions,eachoutcomeiscomparedtoareferencegroup.Stayinginthesameschoolfiveyearslaterwasselectedasthereferencegroup,asthisoutcomerepresentsthemajorityofbeginningteachersinourdatasets.SeeTable20forthedescriptivestatisticsfrombothfive‐yeartimeperiodsforbeginningteachersstatewidewhostayedintheiroriginalschools,exitedfromtheWashingtonstateteacherworkforce,movedwithinthedistrict,ormovedfromonedistricttoanother.Comparisonoftheretentionandmobilityoutcomesofallteachersversusbeginningteachersshowsthatwhilethefive‐yearexitratesofbeginningteachersandallteacherswerevirtuallyidentical(21.4%and20.7%,respectively),thestayingrateofbeginningteacherswas15.1percentagepointslower(42.5%versus57.6%forallteachers).Beginningteachersalsodemonstratedarelativelyhigherpropensityformovement,eithertoanewdistrict(18.9%ofbeginningteachersversus7.4%ofallteachers)ortoadifferentschoolwithintheiroriginaldistrict(17.4%ofbeginningteachersversus14.5%ofallteachers).
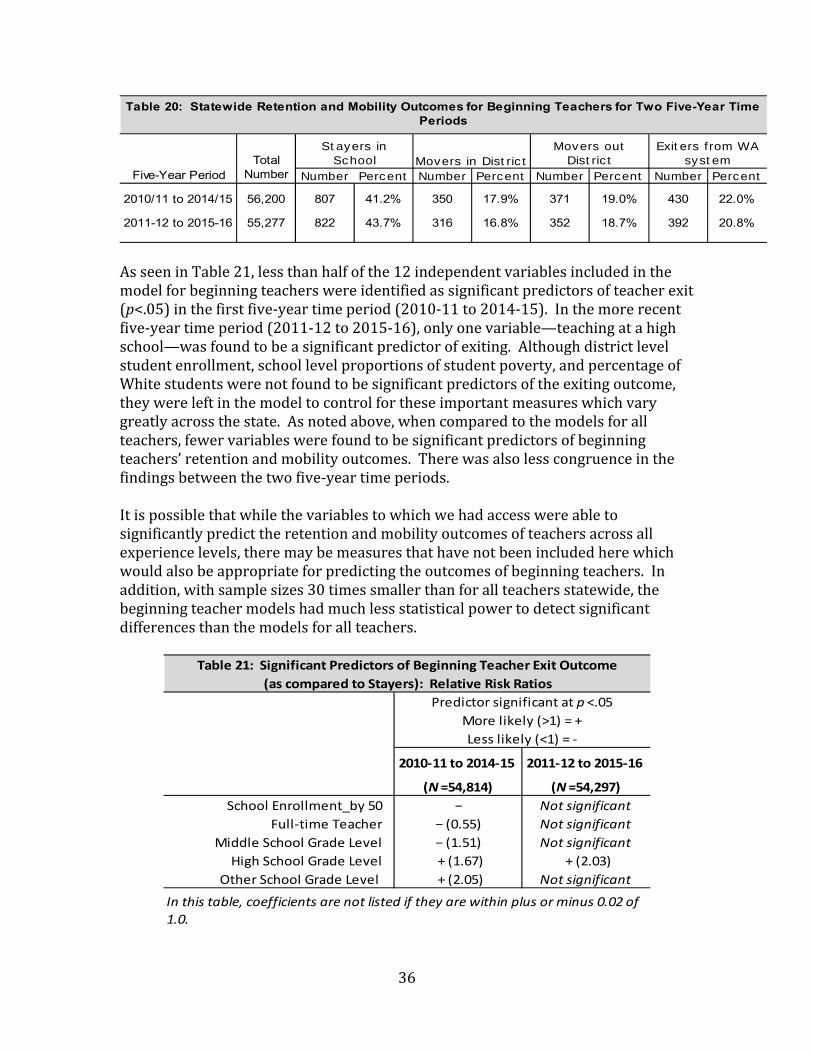
36
Five-Year Period Number Percent Number Percent Number Percent Number Percent
2010/11 to 2014/15 56,200 807 41.2% 350 17.9% 371 19.0% 430 22.0%
2011-12 to 2015-16 55,277 822 43.7% 316 16.8% 352 18.7% 392 20.8%
Table 20: Statewide Retention and Mobility Outcomes for Beginning Teachers for Two Five-Year Time Periods
Total Number
Stayers in School Movers in District
Movers out District
Exiters from WA system
AsseeninTable21,lessthanhalfofthe12independentvariablesincludedinthemodelforbeginningteacherswereidentifiedassignificantpredictorsofteacherexit(p<.05)inthefirstfive‐yeartimeperiod(2010‐11to2014‐15).Inthemorerecentfive‐yeartimeperiod(2011‐12to2015‐16),onlyonevariable—teachingatahighschool—wasfoundtobeasignificantpredictorofexiting.Althoughdistrictlevelstudentenrollment,schoollevelproportionsofstudentpoverty,andpercentageofWhitestudentswerenotfoundtobesignificantpredictorsoftheexitingoutcome,theywereleftinthemodeltocontrolfortheseimportantmeasureswhichvarygreatlyacrossthestate.Asnotedabove,whencomparedtothemodelsforallteachers,fewervariableswerefoundtobesignificantpredictorsofbeginningteachers’retentionandmobilityoutcomes.Therewasalsolesscongruenceinthefindingsbetweenthetwofive‐yeartimeperiods.Itispossiblethatwhilethevariablestowhichwehadaccesswereabletosignificantlypredicttheretentionandmobilityoutcomesofteachersacrossallexperiencelevels,theremaybemeasuresthathavenotbeenincludedherewhichwouldalsobeappropriateforpredictingtheoutcomesofbeginningteachers.Inaddition,withsamplesizes30timessmallerthanforallteachersstatewide,thebeginningteachermodelshadmuchlessstatisticalpowertodetectsignificantdifferencesthanthemodelsforallteachers.
2010‐11 to 2014‐15 2011‐12 to 2015‐16
(N=54,814) (N=54,297)
School Enrollment_by 50 − Not significant
Full‐time Teacher − (0.55) Not significant
Middle School Grade Level − (1.51) Not significant
High School Grade Level .+ (1.67) .+ (2.03)
Other School Grade Level .+ (2.05) Not significant
In this table, coefficients are not listed if they are within plus or minus 0.02 of
1.0.
Table 21: Significant Predictors of Beginning Teacher Exit Outcome
(as compared to Stayers): Relative Risk Ratios
Predictor significant at p <.05
More likely (>1) = +
Less likely (<1) = ‐
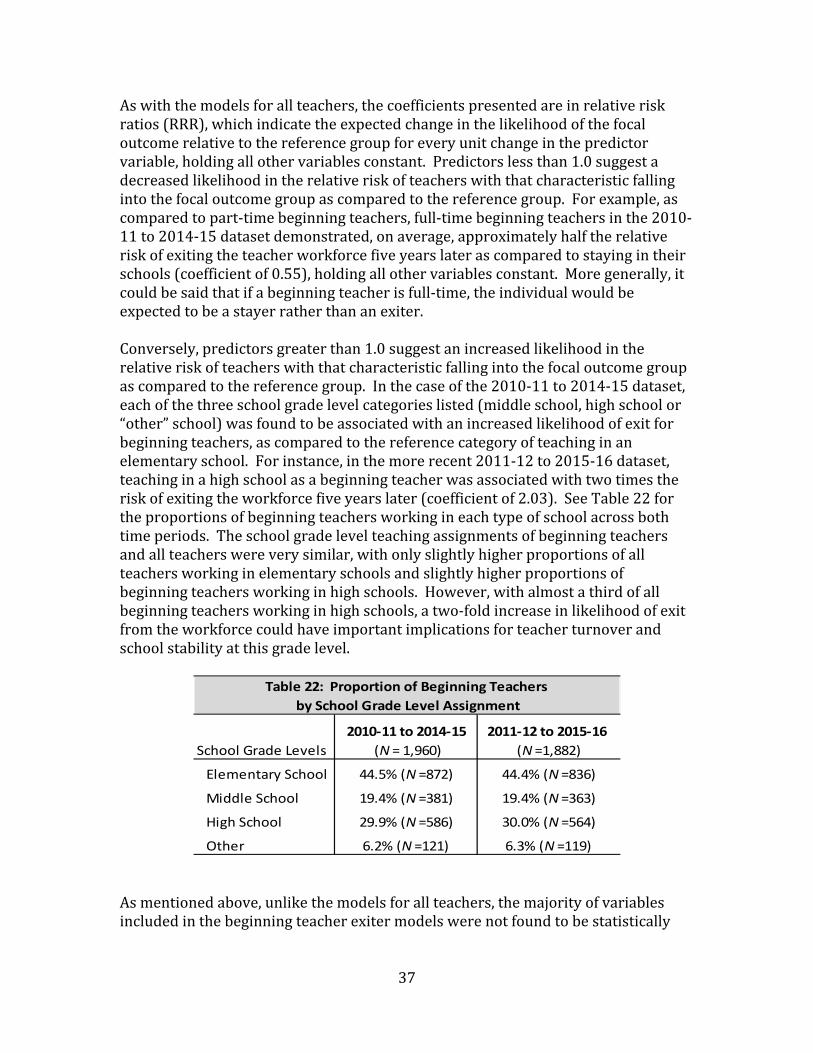
37
Aswiththemodelsforallteachers,thecoefficientspresentedareinrelativeriskratios(RRR),whichindicatetheexpectedchangeinthelikelihoodofthefocaloutcomerelativetothereferencegroupforeveryunitchangeinthepredictorvariable,holdingallothervariablesconstant.Predictorslessthan1.0suggestadecreasedlikelihoodintherelativeriskofteacherswiththatcharacteristicfallingintothefocaloutcomegroupascomparedtothereferencegroup.Forexample,ascomparedtopart‐timebeginningteachers,full‐timebeginningteachersinthe2010‐11to2014‐15datasetdemonstrated,onaverage,approximatelyhalftherelativeriskofexitingtheteacherworkforcefiveyearslaterascomparedtostayingintheirschools(coefficientof0.55),holdingallothervariablesconstant.Moregenerally,itcouldbesaidthatifabeginningteacherisfull‐time,theindividualwouldbeexpectedtobeastayerratherthananexiter.Conversely,predictorsgreaterthan1.0suggestanincreasedlikelihoodintherelativeriskofteacherswiththatcharacteristicfallingintothefocaloutcomegroupascomparedtothereferencegroup.Inthecaseofthe2010‐11to2014‐15dataset,eachofthethreeschoolgradelevelcategorieslisted(middleschool,highschoolor“other”school)wasfoundtobeassociatedwithanincreasedlikelihoodofexitforbeginningteachers,ascomparedtothereferencecategoryofteachinginanelementaryschool.Forinstance,inthemorerecent2011‐12to2015‐16dataset,teachinginahighschoolasabeginningteacherwasassociatedwithtwotimestheriskofexitingtheworkforcefiveyearslater(coefficientof2.03).SeeTable22fortheproportionsofbeginningteachersworkingineachtypeofschoolacrossbothtimeperiods.Theschoolgradelevelteachingassignmentsofbeginningteachersandallteacherswereverysimilar,withonlyslightlyhigherproportionsofallteachersworkinginelementaryschoolsandslightlyhigherproportionsofbeginningteachersworkinginhighschools.However,withalmostathirdofallbeginningteachersworkinginhighschools,atwo‐foldincreaseinlikelihoodofexitfromtheworkforcecouldhaveimportantimplicationsforteacherturnoverandschoolstabilityatthisgradelevel.
2010‐11 to 2014‐15 2011‐12 to 2015‐16
School Grade Levels (N = 1,960) (N =1,882)
Elementary School 44.5% (N =872) 44.4% (N =836)
Middle School 19.4% (N =381) 19.4% (N =363)
High School 29.9% (N =586) 30.0% (N =564)
Other 6.2% (N =121) 6.3% (N =119)
Table 22: Proportion of Beginning Teachers
by School Grade Level Assignment
Asmentionedabove,unlikethemodelsforallteachers,themajorityofvariablesincludedinthebeginningteacherexitermodelswerenotfoundtobestatistically
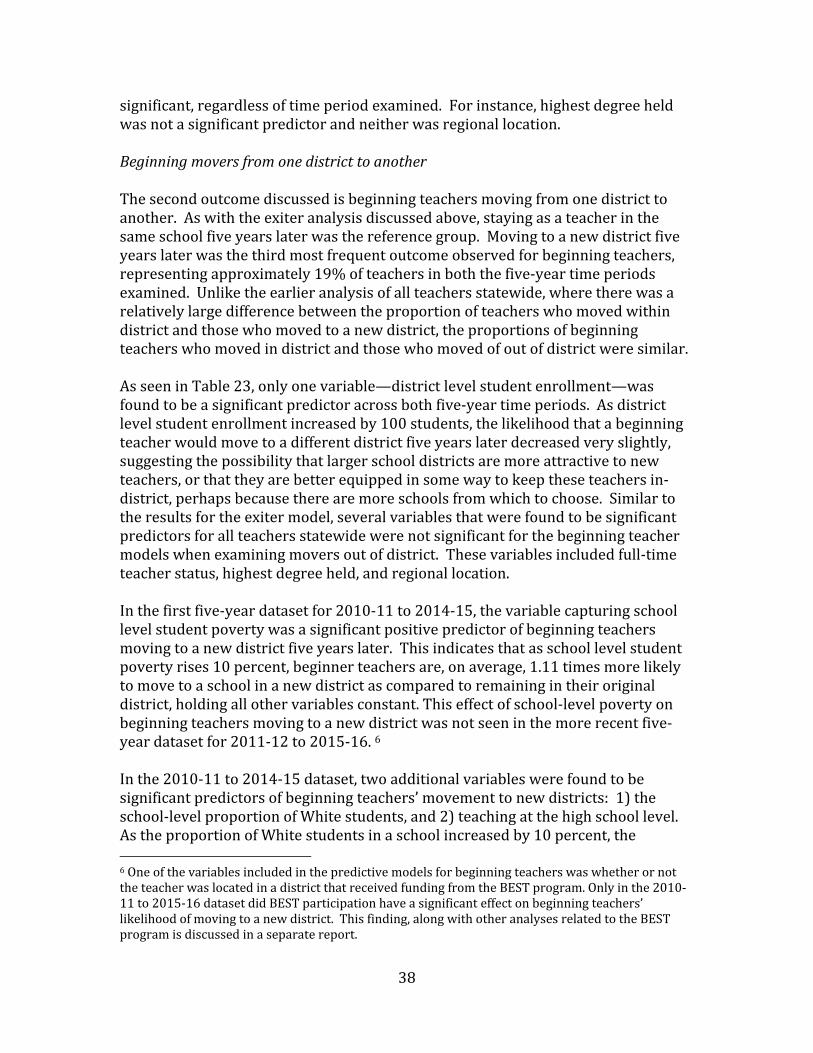
38
significant,regardlessoftimeperiodexamined.Forinstance,highestdegreeheldwasnotasignificantpredictorandneitherwasregionallocation.BeginningmoversfromonedistricttoanotherThesecondoutcomediscussedisbeginningteachersmovingfromonedistricttoanother.Aswiththeexiteranalysisdiscussedabove,stayingasateacherinthesameschoolfiveyearslaterwasthereferencegroup.Movingtoanewdistrictfiveyearslaterwasthethirdmostfrequentoutcomeobservedforbeginningteachers,representingapproximately19%ofteachersinboththefive‐yeartimeperiodsexamined.Unliketheearlieranalysisofallteachersstatewide,wheretherewasarelativelylargedifferencebetweentheproportionofteacherswhomovedwithindistrictandthosewhomovedtoanewdistrict,theproportionsofbeginningteacherswhomovedindistrictandthosewhomovedofoutofdistrictweresimilar.AsseeninTable23,onlyonevariable—districtlevelstudentenrollment—wasfoundtobeasignificantpredictoracrossbothfive‐yeartimeperiods.Asdistrictlevelstudentenrollmentincreasedby100students,thelikelihoodthatabeginningteacherwouldmovetoadifferentdistrictfiveyearslaterdecreasedveryslightly,suggestingthepossibilitythatlargerschooldistrictsaremoreattractivetonewteachers,orthattheyarebetterequippedinsomewaytokeeptheseteachersin‐district,perhapsbecausetherearemoreschoolsfromwhichtochoose.Similartotheresultsfortheexitermodel,severalvariablesthatwerefoundtobesignificantpredictorsforallteachersstatewidewerenotsignificantforthebeginningteachermodelswhenexaminingmoversoutofdistrict.Thesevariablesincludedfull‐timeteacherstatus,highestdegreeheld,andregionallocation.Inthefirstfive‐yeardatasetfor2010‐11to2014‐15,thevariablecapturingschoollevelstudentpovertywasasignificantpositivepredictorofbeginningteachersmovingtoanewdistrictfiveyearslater.Thisindicatesthatasschoollevelstudentpovertyrises10percent,beginnerteachersare,onaverage,1.11timesmorelikelytomovetoaschoolinanewdistrictascomparedtoremainingintheiroriginaldistrict,holdingallothervariablesconstant.Thiseffectofschool‐levelpovertyonbeginningteachersmovingtoanewdistrictwasnotseeninthemorerecentfive‐yeardatasetfor2011‐12to2015‐16.6Inthe2010‐11to2014‐15dataset,twoadditionalvariableswerefoundtobesignificantpredictorsofbeginningteachers’movementtonewdistricts:1)theschool‐levelproportionofWhitestudents,and2)teachingatthehighschoollevel.AstheproportionofWhitestudentsinaschoolincreasedby10percent,the6OneofthevariablesincludedinthepredictivemodelsforbeginningteacherswaswhetherornottheteacherwaslocatedinadistrictthatreceivedfundingfromtheBESTprogram.Onlyinthe2010‐11to2015‐16datasetdidBESTparticipationhaveasignificanteffectonbeginningteachers’likelihoodofmovingtoanewdistrict.Thisfinding,alongwithotheranalysesrelatedtotheBESTprogramisdiscussedinaseparatereport.
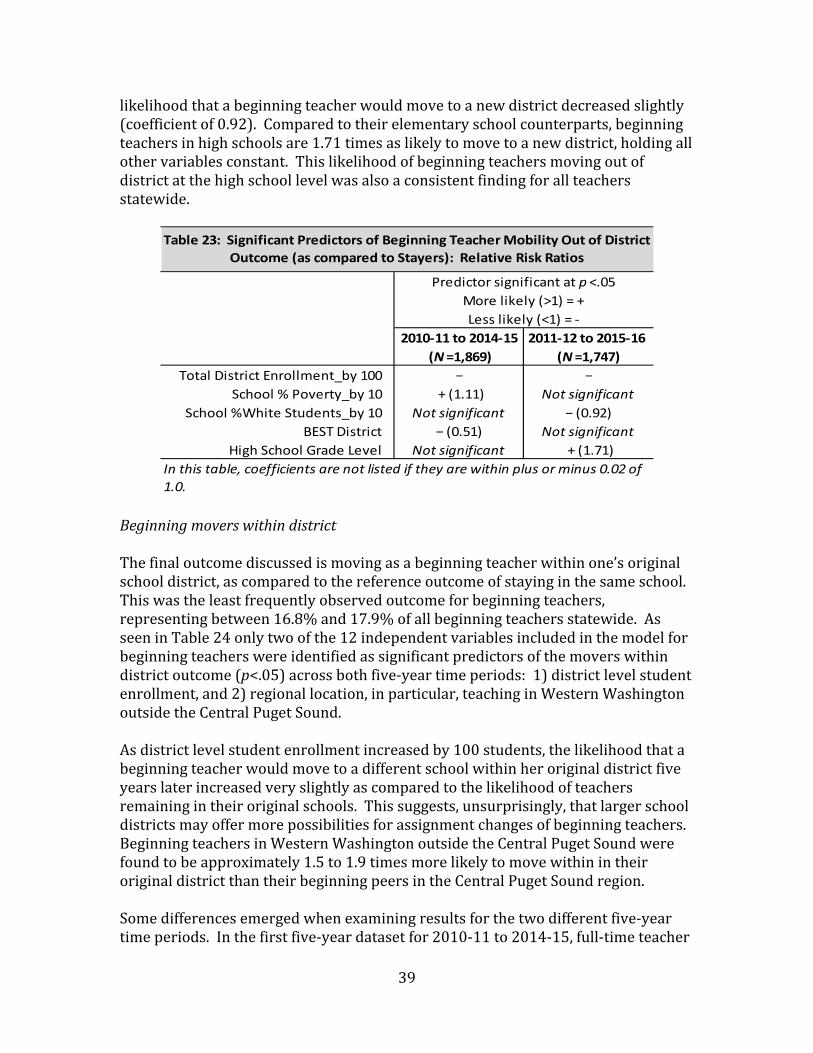
39
likelihoodthatabeginningteacherwouldmovetoanewdistrictdecreasedslightly(coefficientof0.92).Comparedtotheirelementaryschoolcounterparts,beginningteachersinhighschoolsare1.71timesaslikelytomovetoanewdistrict,holdingallothervariablesconstant.Thislikelihoodofbeginningteachersmovingoutofdistrictatthehighschoollevelwasalsoaconsistentfindingforallteachersstatewide.
2010‐11 to 2014‐15 2011‐12 to 2015‐16
(N=1,869) (N=1,747)
Total District Enrollment_by 100 − −
School % Poverty_by 10 .+ (1.11) Not significant
School %White Students_by 10 Not significant − (0.92)
BEST District − (0.51) Not significant
High School Grade Level Not significant .+ (1.71)
Table 23: Significant Predictors of Beginning Teacher Mobility Out of District
Outcome (as compared to Stayers): Relative Risk Ratios
Predictor significant at p <.05
More likely (>1) = +
Less likely (<1) = ‐
In this table, coefficients are not listed if they are within plus or minus 0.02 of
1.0. BeginningmoverswithindistrictThefinaloutcomediscussedismovingasabeginningteacherwithinone’soriginalschooldistrict,ascomparedtothereferenceoutcomeofstayinginthesameschool.Thiswastheleastfrequentlyobservedoutcomeforbeginningteachers,representingbetween16.8%and17.9%ofallbeginningteachersstatewide.AsseeninTable24onlytwoofthe12independentvariablesincludedinthemodelforbeginningteacherswereidentifiedassignificantpredictorsofthemoverswithindistrictoutcome(p<.05)acrossbothfive‐yeartimeperiods:1)districtlevelstudentenrollment,and2)regionallocation,inparticular,teachinginWesternWashingtonoutsidetheCentralPugetSound.Asdistrictlevelstudentenrollmentincreasedby100students,thelikelihoodthatabeginningteacherwouldmovetoadifferentschoolwithinheroriginaldistrictfiveyearslaterincreasedveryslightlyascomparedtothelikelihoodofteachersremainingintheiroriginalschools.Thissuggests,unsurprisingly,thatlargerschooldistrictsmayoffermorepossibilitiesforassignmentchangesofbeginningteachers.BeginningteachersinWesternWashingtonoutsidetheCentralPugetSoundwerefoundtobeapproximately1.5to1.9timesmorelikelytomovewithinintheiroriginaldistrictthantheirbeginningpeersintheCentralPugetSoundregion.Somedifferencesemergedwhenexaminingresultsforthetwodifferentfive‐yeartimeperiods.Inthefirstfive‐yeardatasetfor2010‐11to2014‐15,full‐timeteacher
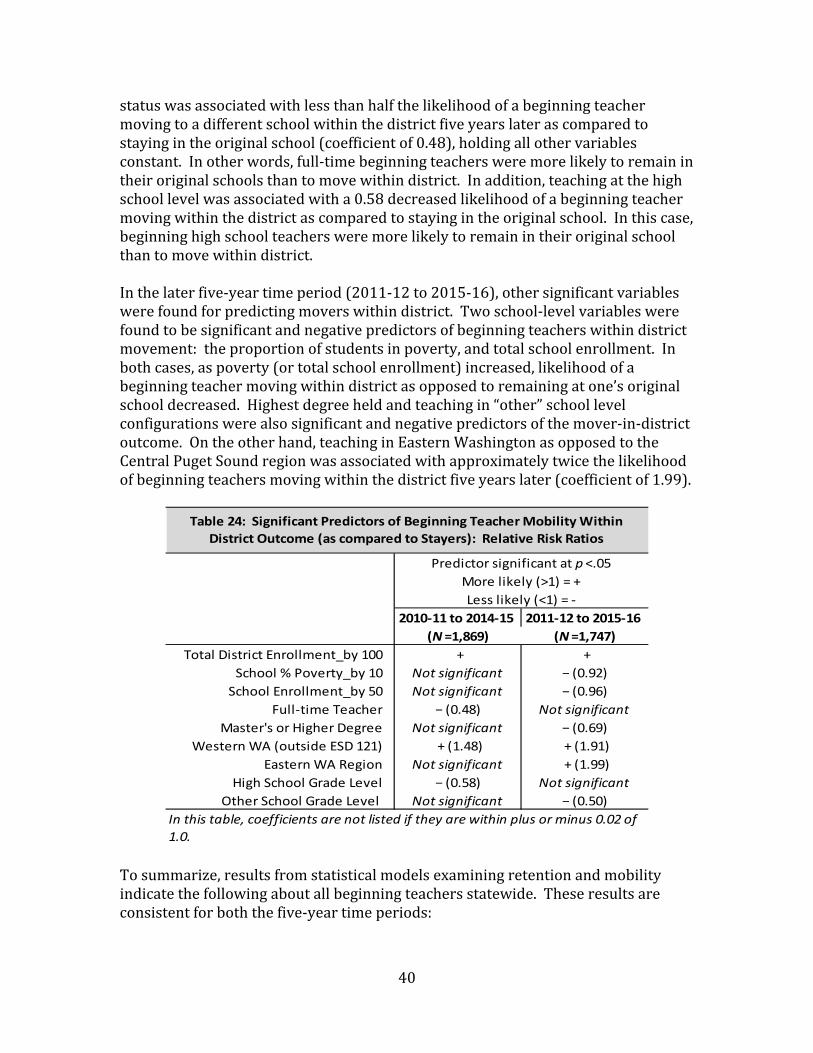
40
statuswasassociatedwithlessthanhalfthelikelihoodofabeginningteachermovingtoadifferentschoolwithinthedistrictfiveyearslaterascomparedtostayingintheoriginalschool(coefficientof0.48),holdingallothervariablesconstant.Inotherwords,full‐timebeginningteachersweremorelikelytoremainintheiroriginalschoolsthantomovewithindistrict.Inaddition,teachingatthehighschoollevelwasassociatedwitha0.58decreasedlikelihoodofabeginningteachermovingwithinthedistrictascomparedtostayingintheoriginalschool.Inthiscase,beginninghighschoolteachersweremorelikelytoremainintheiroriginalschoolthantomovewithindistrict.Inthelaterfive‐yeartimeperiod(2011‐12to2015‐16),othersignificantvariableswerefoundforpredictingmoverswithindistrict.Twoschool‐levelvariableswerefoundtobesignificantandnegativepredictorsofbeginningteacherswithindistrictmovement:theproportionofstudentsinpoverty,andtotalschoolenrollment.Inbothcases,aspoverty(ortotalschoolenrollment)increased,likelihoodofabeginningteachermovingwithindistrictasopposedtoremainingatone’soriginalschooldecreased.Highestdegreeheldandteachingin“other”schoollevelconfigurationswerealsosignificantandnegativepredictorsofthemover‐in‐districtoutcome.Ontheotherhand,teachinginEasternWashingtonasopposedtotheCentralPugetSoundregionwasassociatedwithapproximatelytwicethelikelihoodofbeginningteachersmovingwithinthedistrictfiveyearslater(coefficientof1.99).
2010‐11 to 2014‐15 2011‐12 to 2015‐16
(N=1,869) (N=1,747)
Total District Enrollment_by 100 .+ .+
School % Poverty_by 10 Not significant − (0.92)
School Enrollment_by 50 Not significant − (0.96)
Full‐time Teacher − (0.48) Not significant
Master's or Higher Degree Not significant − (0.69)
Western WA (outside ESD 121) .+ (1.48) .+ (1.91)
Eastern WA Region Not significant .+ (1.99)
High School Grade Level − (0.58) Not significant
Other School Grade Level Not significant − (0.50)
Table 24: Significant Predictors of Beginning Teacher Mobility Within
District Outcome (as compared to Stayers): Relative Risk Ratios
Predictor significant at p <.05
More likely (>1) = +
Less likely (<1) = ‐
In this table, coefficients are not listed if they are within plus or minus 0.02 of
1.0.
Tosummarize,resultsfromstatisticalmodelsexaminingretentionandmobilityindicatethefollowingaboutallbeginningteachersstatewide.Theseresultsareconsistentforboththefive‐yeartimeperiods:
41
Full‐timebeginningteachersarehalfaslikelytoexit,buthighschoolbeginningteachersaretwiceaslikelytoexit(ascomparedtostayinginthesameschool).
Highschoolbeginningteachersaremorelikelytomoveoutofdistrictas
comparedtoelementarybeginningteachers.Beginningteachersindistrictswithlargerstudentenrollmentareslightlylesslikelytomoveoutofdistrict.AsthepercentofWhitestudentsenrolledintheschoolincreases,thereisaslightdecreaseinthelikelihoodthatabeginningteacherwillmoveoutofdistrict.
Beginningteachersinlargerenrollmentdistrictsareslightlymorelikelyto
movewithindistrict,whilebeginningteachersinWesternWashingtonoutsideESD121aremorelikelytomoveindistrictascomparedtobeginningteachersinESD121.
IV.ConclusionsandDiscussionTheresultsofthisstudyillustratethecomplexitiesinvolvedinunderstandingteacherretentionandmobility.Asisthecasethroughoutthenation,itisimportanttorecognizethatteachermobilityisasimportantafactorasteacherattrition.Thatis,insomeways,whenateacherleavesaschool,theschoolcanbenegativelyimpacted,nomatterwhethertheteacherlefttogotoanotherschoolinthesamedistrict,toanotherdistrict,orcompletelylefttheprofession.Whilethestatewideportraitofteachersrevealssubstantialconsistencyinturnoverratesovertime,therearewaysinwhichsignificantvariationexists.Differencesexistbyindividualteachercharacteristics,andbyschoolanddistrictcontexts.Forexample,theagingoftheteacherworkforcecancreateadditionaldemandfornewteachers,resultinginashiftintheexperiencelevelsofteachersandpromptinganincreasedneedformentoringandsupportofnovices.Additionally,regionalanddistrictdifferencesexist,andvariationoccursevenamongschoolswithinthesamedistrict.Forexample,wefindthatthegradelevelinwhichateacherworks(e.g.,elementaryvssecondary)andwhetherateacherisfull‐timeorpart‐timeconsistentlyimpactretentionandmobility.Differencesinteacherturnoveralsoexistbylevelofteachingexperience,withbeginningteachersbeinglessrootedintheirschools.Policychangescanalsoimpacttheneedforteachersinnumerousways.Forexample,aclasssizereductionpolicycanincreasetheneedforadditionalteachers,whileeconomicforcespromptingareductionintheworkforcecanimpactthemovementandturnoverofteachers,especiallyforthosenewtotheprofession.Newrequirementsforteachercertificationandteacherevaluationcanalsoimpactteachers’viewsaboutremainingintheprofession.Changesintheleveloffiscaland
42
professionalsupportthatteachersreceive,alongwithchangingworkingconditionsinschoolscanalsoinfluenceteacherturnover.Giventhevarietyoffactorsinfluencingastate’sabilitytoattract,retain,andsupportteacherswhopositivelyimpactstudentlearning,policyresponsesneedtobeinformedbydataandcraftedtoaddressvariationsthatexist.Thedatafromthisstudysuggestsseveralpolicyimplications.Inrecentyears,therehasbeensubstantialdiscussionaboutaperceivedteachershortage,includingreportsofdifficultiesinfindingwell‐qualifiedteacherstofillvacancies.Whilewedonotdoubtthattherearedifficultiesincertainsubjectandspecialtyareasandinparticularregionsordistricts,ourlongitudinalanalysissuggeststhatanyperceivedstatewideshortageofteachersinrecentyearsisnotduetorecentchangesinthestatewideretentionorattritionofteachers.Thisimpliesthatstatestrategiesneedtobedifferentiatedandtargetedinwaysthatrecognizethevariationthatexists.Thereisalsoa“myth”whichhascirculatedwidelyinnationalconversationsthat“halfofallbeginningteachersleavetheprofessionwithinfiveyears.”Wefindnoevidencetosupportthatclaim.Onthecontrary,wefindthatinWashingtonstate,onaverageoverthepast20years,onequarterofbeginningteachersexitthestatesystem,eitherpermanentlyortemporarilyafterfiveyears.Infact,therateofbeginningteachersexitingtheWashingtonworkforcehasdeclinedinthemostrecentfive‐yearperiodtoapointwhereitissimilartoallteachersstatewide.Onestatewidechallengethisstudydididentifywasthelackofracialandethnicdiversityintheteachingworkforce.Thisisasignificantproblemthroughoutthestate.Verylittleprogresshasbeenmadeinthepast20yearsinimprovingthediversityoftheteacherworkforce.Whilesomedistrictshaveincreasedthediversityoftheirteachers,therearedistrictsthathaveseenanactualdecreaseintheproportionofteachersofcoloroverthepast20years.OfparticularconcernisthedecreaseintheproportionofBlack/African‐Americanteachersstatewide.Statepoliciesaimedatimprovingteacherdiversitycertainlyseemindicated.AnotherstatewideissuearticulatedbythisstudyistheincreaseintheproportionofnewteachersinWashingtonstate.Thenumberoffirstandsecondyearteachershasmorethandoubledsince2010‐11.Thissuggeststhattheneedforefficientandeffectiveteachermentoringandsupportprogramsismorepronouncedthanithasbeeninthepast.Thefindingsfromstatisticalmodelsdescribedinthisstudypromptsomeadditionalquestionsforconsiderationbystateandlocalpolicymakers.First,forallteachersstatewide,thereisarelationshipbetweenfull‐timestatusandretention.Full‐timeteachersaremorelikelytostayinthesameschool,lesslikelytomovewithindistrictoroutofdistrict,andlesslikelytoexit.Thus,furtherinvestigationintothereasonswhythisisthecasewouldbeaworthyendeavor.Similarly,furtherinquiryintowhyhighschoolteachersaremorelikelytoexitormoveoutofdistrictorhowsubjectarea(e.g.,math,science,ELL)mayberelatedtoexitingisalsoindicated.Itis
43
importanttonotethatthepovertyleveloftheschoolwasnotaconsistentlysignificantpredictorofteacherturnover.Finally,policiesaimedataddressingteacherretentionshouldtakeintoaccounttheregionalvariationthatexists.Forexample,teachersinEasternWashingtonandthoseinWesternWashingtonoutsidetheCentralPugetSoundarelesslikelytoexit.However,itisalsoimportanttonotethatcertainregionsofthestateorcertaindistrictsmayhavemoredifficultyattractingteachers,whichisanissueworthyoffurtherinvestigation.Whilethisstudyprovidesacomprehensiveandlongitudinalanalysisofteacherretentionandmobility,includingfactorsthatmayimpactturnoverrates,wedonotexaminesomeotherrelatedissues.Basedonthefindingsinthisstudy,itisclearthatfurtherinquiryisneededtohelpdeterminewhyteachersmakeparticularcareerdecisions,howschoolworkingconditionsandleadershipimpactcareerchoices,andhowtheadequacyandqualityoftheteacherpreparationpipelinecaninfluenceteacherretentionandmobility.
44
ReferencesAlbertShankerInstitute(2015).ThestateofteacherdiversityinAmericaneducation.
Washington,DC:Author.Borman,G.,&Dowling,N.(2008).Teacherattritionandretention:Ameta‐analytic
andnarrativereviewoftheresearch.ReviewofEducationalResearch,78(3),367‐409.
Boyd,D.J.,Grossman,P.L.,Ing,M.,Lankford,H.,Loeb,S.,&Wyckoff,J.(2011).The
influenceofschooladministratorsonteacherretentiondecisions.AmericanEducationalResearchJournal,48,303–333.
Burkhauser,S.(2016).Howmuchdoschoolprincipalsmatterwhenitcomesto
teacherworkingconditions.EducationalEvaluationandPolicyAnalysis,onlinefirst,DOI:10.3102/0162373716668028,0:1‐21.
Byrk,A.S.,Lee,V.E.,&Smith,J.B.(1990).Highschoolorganizationanditseffectonteachersandstudents:Aninterpretivesummaryoftheresearch.InW.J.Clune&J.F.Witte(Eds.),ChoiceandcontrolinAmericaneducation:Volume1.TheTheoryofchoiceandcontrolinAmericaneducation.Philadelphia:FalmerPress.
Cowan,J.,Goldhaber,D.,Hayes,K.,&Theobald,R.(2016).Missingelementsinthediscussionofteachershortages.EducationalResearcher,45(8),460‐462.
Engel,M.,Jacob,B.,andCurran,C.(2014).Newevidenceonteacherlaborsupply.
AmericanEducationalResearchJournal,51(1),36‐72.Goldring,R.,Taie,S.,&Riddles,M.(2014).TeacherAttritionandMobility:Results
fromthe2012‐13TeacherFollow‐upSurvey(NCES2014‐077).U.S.DepartmentofEducation.Washington,DC:NationalCenterforEducationStatistics.
Guin,K.(2004).Chronicteacherturnoverinurbanelementaryschools.Education
PolicyAnalysisArchives,12(24).RetrievedFebruary13,2005,fromhttp://epaa.asu.edu/epaa/v12n42/
Hanushek,E.A.,Kain,J.F.,&Rivkin,S.G.(2001).WhyPublicSchoolsLoseTeachers.Cambridge,MA:NationalBureauofEconomicResearch.
Harris.D.N.&Adams,S.J.(2007).Understandingthelevelandcausesofteacherturnover:Acomparisonwithotherprofessions.EconomicsofEducationReview,26,325‐337.
45
Henke,R.R.,Choy,S.P.,Chen,X.,Geis,S.,Alt,M.N.,&Broughman,S.P.(1997).America’sTeachers:ProfileofaProfession.WashingtonDC:U.S.DepartmentofEducation,NationalCenterforEducationStatistics.
Henke,R.R.,Zahn,L.&Carroll,C.D.(2001).Attritionofnewteachersamongrecentcollegegraduates:Comparingoccupationalstabilityamong1992‐93graduateswhotaughtandthosewhoworkedinotheroccupations(StatisticalAnalysisReportNCES2001‐189).Washington,DC:U.S.DepartmentofEducation,NationalCenterforEducationStatistics.
Ingersoll,R.M.(2001a).Teacherturnover,teachershortages,andtheorganizationof
schools.Seattle,WA:CenterfortheStudyofTeachingandPolicy.
Ingersoll,R.M.(2001b).Teacherturnoverandteachershortages:Anorganizationalanalysis.AmericanEducationalResearchJournal,38(3),499‐534.
Ingersoll,R.M.(2003).Whocontrolsteachers’work?:PowerandaccountabilityinAmerica’sschools.Cambridge,MA:HarvardUniversityPress.
Ingersoll,R.M.&May,H.(2011).Recruitment,retention,andtheminorityteachershortage.Philadelphia,PA:ConsortiumforPolicyResearch,UniversityofPennsylvaniaandCenterforEducationalResearchintheInterestofUnderservedStudents,UniversityofCalifornia,SantaCruz.
Ingersoll,R.,&Strong,M.(2011).Theimpactofinductionandmentoringprograms
forbeginningteachers:Acriticalreviewoftheresearch.ReviewofEducationalResearch,81(2),201‐233.
Ingersoll,R.,&Kralik,J.M.(2004).Theimpactofmentoringonteacherretention:
Whattheresearchsays.ResearchReview,EducationCommissionoftheStates,1‐23.RetrievedonFebruary13,2005,fromwww.ecs.org/clearinghouse/50/36/5036.htm
Johnson,S.,&Birkeland,S.(2003).Pursuinga“senseofsuccess”:Newteachers
explaintheircareerdecisions.AmericanEducationalResearchJournal,40(3),581‐617.
Johnson,S.M.,Kraft,M.A.,&Papay,J.P.(2012).Howcontextmattersinhigh‐need
schools:Theeffectsofteachers’workingconditionsontheirprofessionalsatisfactionandtheirstudents’achievement.TeachersCollegeRecord,114(10),1‐39.
Johnson,S.M.,Kardos,S.M.,Kauffman,D.,Liu,E.,&Donaldson,M.L.(2004).The
supportgap:newteachers’earlyexperiencesinhigh‐incomeandlow‐income
46
schools.EducationPolicyAnalysisArchives,12(61).RetrievedOctober28,2004fromhttp://epaa.asu.edu/epaa/v12n61/.
Kelly,S.(2004).Aneventhistoryanalysisofteacherattrition:Salary,teacher
tracking,andsociallydisadvantagedschools.TheJournalofExperimentalEducation,72(3),195‐220.
Lankford,H.,Loeb,S.&Wycoff,J.(2002).Teachersortingandtheplightofurban
schools:Adescriptiveanalysis.EducationalEvaluationandPolicyAnalysis,24(1),37‐62.
Loeb,S.&Darling‐Hammond,L.(2005).HowteachingconditionspredictteacherturnoverinCaliforniaschools.PeabodyJournalofEducation.80(3),44‐70.
Lortie,D.C.(1975).Schoolteacher:ASociologicalStudy.Chicago:UniversityofChicagoPress.
Luekens,M.T.,Lyter,D.M.&Fox,E.E.(2004).TeacherAttritionandMobility:ResultsfromtheTeacherFollowupSurvey,2000‐01(NCES2004‐301).U.S.DepartmentofEducation,NationalCenterforEducationalStatistics.Washington,DC:U.S.GovernmentPrintingOffice.
Macdonald,D.(1999).Teacherattrition:Areviewofliterature.TeachingandTeacherEducation,15,835‐848.
Marvel,J.,Lyter,D.M.,Petrola,P.,Strizek,G.A.&Morton,B.A.(2006).Teacherattritionandmobility:Resultsfromthe2004‐05TeacherFollowupSurvey(NCES2007=307).U.S.DepartmentofEducation,NationalCenterforEducationStatistics.Washington,DC:U.S.GovernmentPrintingOffice.
Murnane,R.,Singer,J.D.,&Willett,J.B.(1988).TheCareerPathsofTeachers:Implicationsforteachersupplyandmethodologicallessonsforresearch.EducationalResearcher,17(6),22‐30.
NationalCenterforEducationStatistics(NCES).(2003).TeacherAttritionandMobility:ResultsfromtheTeacherFollow‐upSurvey,2000‐01.Jessup,MD:U.S.DepartmentofEducation.
NationalCenterforEducationStatistics(NCES).(2005).TheConditionofEducation
2005,NCES2005‐094,WashingtonDC:U.S.GovernmentPrintingOffice.
Podgursky,M.,Ehlert,M.,Lindsay,J.,&Wan,Y.(2016).AnexaminationofthemovementofeducatorswithinandacrossthreeMidwestRegionstates.
Ronfeldt,M.,Loeb,S.,&Wyckoff,J.(2013).Howteacherturnoverharmsstudentachievement.AmericanEducationalResearchJournal,50(4),4–36.
47
Shen,J.(1997).Teacherretentionandattritioninpublicschools:EvidencefromSASS91.TheJournalofEducationalResearch,91(2),81‐88.
Smith,T.M.,&Ingersoll,R.M.(2004).Whataretheeffectsofinductionandmentoringonbeginningteacherturnover?AmericanEducationalResearchJournal,41(3),681‐714.
Sutcher,L.,Darling‐Hammond,L.,Carver‐Thomas,D.(2016).Acomingcrisisinthe
supply,demand,andshortagesintheUW.PaloAlto,CA:LearningPolicyInstitute.
Theobald,N.D.,&Laine,S.W.M.(2003).Theimpactofteacherturnoveronteacher
quality:Findingsfromfourstates.InM.L.Plecki&D.H.Monk(Eds.),SchoolFinanceandTeacherQuality:ExploringtheConnections(pp.33‐54).Larchmont,NY:EyeonEducation.
U.S.DepartmentofEducation(2016).Thestateofracialdiversityintheeducatorworkforce.PolicyandProgramStudiesService,OfficeofPlanning,EvaluationandPolicyDevelopment.Washington,DC:Author.
Whitener,S.D.,Gruber,K.J.,Lynch,H.,Tingos,K.,&Perona,M.(1997).Characteristicsofstayers,movers,andleavers:Resultsfromtheteacherfollow‐upsurvey:1994‐95.Washington,DC:U.S.DepartmentofEducation,NationalCenterforEducationStatistics.
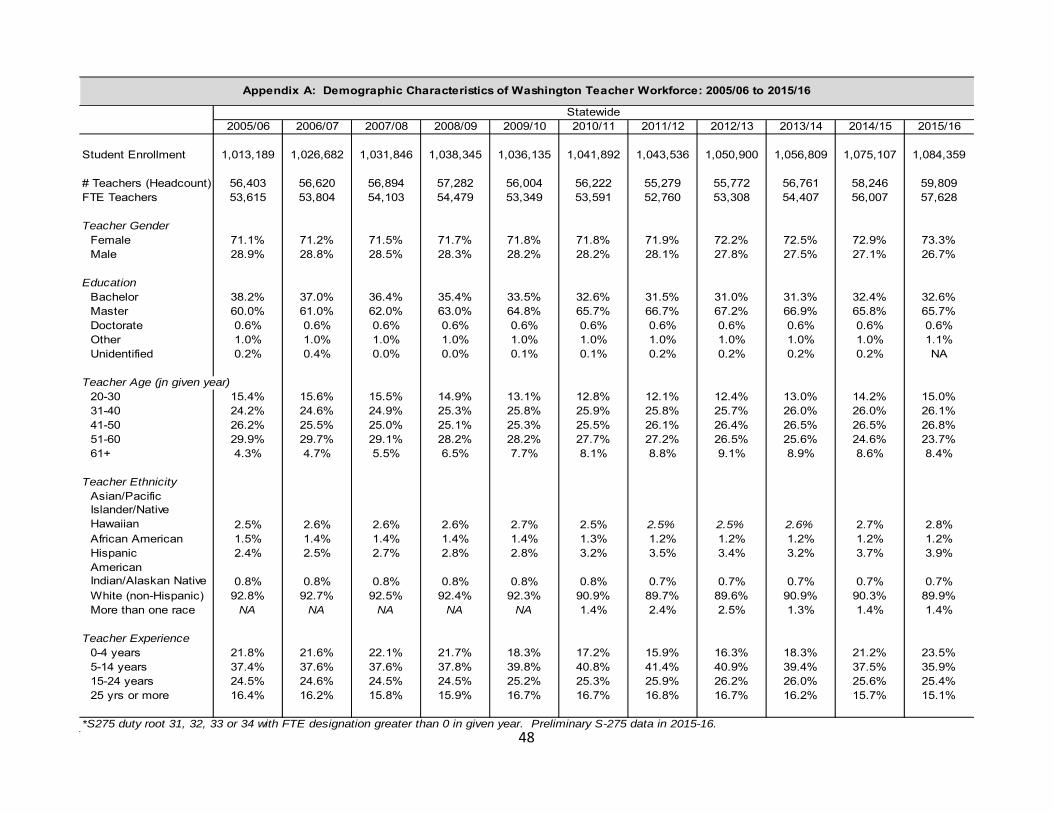
48
2005/06 2006/07 2007/08 2008/09 2009/10 2010/11 2011/12 2012/13 2013/14 2014/15 2015/16
Student Enrollment 1,013,189 1,026,682 1,031,846 1,038,345 1,036,135 1,041,892 1,043,536 1,050,900 1,056,809 1,075,107 1,084,359
# Teachers (Headcount) 56,403 56,620 56,894 57,282 56,004 56,222 55,279 55,772 56,761 58,246 59,809FTE Teachers 53,615 53,804 54,103 54,479 53,349 53,591 52,760 53,308 54,407 56,007 57,628
Teacher GenderFemale 71.1% 71.2% 71.5% 71.7% 71.8% 71.8% 71.9% 72.2% 72.5% 72.9% 73.3%Male 28.9% 28.8% 28.5% 28.3% 28.2% 28.2% 28.1% 27.8% 27.5% 27.1% 26.7%
EducationBachelor 38.2% 37.0% 36.4% 35.4% 33.5% 32.6% 31.5% 31.0% 31.3% 32.4% 32.6%Master 60.0% 61.0% 62.0% 63.0% 64.8% 65.7% 66.7% 67.2% 66.9% 65.8% 65.7%Doctorate 0.6% 0.6% 0.6% 0.6% 0.6% 0.6% 0.6% 0.6% 0.6% 0.6% 0.6%Other 1.0% 1.0% 1.0% 1.0% 1.0% 1.0% 1.0% 1.0% 1.0% 1.0% 1.1%Unidentified 0.2% 0.4% 0.0% 0.0% 0.1% 0.1% 0.2% 0.2% 0.2% 0.2% NA
Teacher Age (jn given year)20-30 15.4% 15.6% 15.5% 14.9% 13.1% 12.8% 12.1% 12.4% 13.0% 14.2% 15.0%31-40 24.2% 24.6% 24.9% 25.3% 25.8% 25.9% 25.8% 25.7% 26.0% 26.0% 26.1%41-50 26.2% 25.5% 25.0% 25.1% 25.3% 25.5% 26.1% 26.4% 26.5% 26.5% 26.8%51-60 29.9% 29.7% 29.1% 28.2% 28.2% 27.7% 27.2% 26.5% 25.6% 24.6% 23.7%61+ 4.3% 4.7% 5.5% 6.5% 7.7% 8.1% 8.8% 9.1% 8.9% 8.6% 8.4%
Teacher EthnicityAsian/Pacific Islander/Native Hawaiian 2.5% 2.6% 2.6% 2.6% 2.7% 2.5% 2.5% 2.5% 2.6% 2.7% 2.8%African American 1.5% 1.4% 1.4% 1.4% 1.4% 1.3% 1.2% 1.2% 1.2% 1.2% 1.2%Hispanic 2.4% 2.5% 2.7% 2.8% 2.8% 3.2% 3.5% 3.4% 3.2% 3.7% 3.9%American Indian/Alaskan Native 0.8% 0.8% 0.8% 0.8% 0.8% 0.8% 0.7% 0.7% 0.7% 0.7% 0.7%White (non-Hispanic) 92.8% 92.7% 92.5% 92.4% 92.3% 90.9% 89.7% 89.6% 90.9% 90.3% 89.9%More than one race NA NA NA NA NA 1.4% 2.4% 2.5% 1.3% 1.4% 1.4%
Teacher Experience0-4 years 21.8% 21.6% 22.1% 21.7% 18.3% 17.2% 15.9% 16.3% 18.3% 21.2% 23.5%5-14 years 37.4% 37.6% 37.6% 37.8% 39.8% 40.8% 41.4% 40.9% 39.4% 37.5% 35.9%15-24 years 24.5% 24.6% 24.5% 24.5% 25.2% 25.3% 25.9% 26.2% 26.0% 25.6% 25.4%25 yrs or more 16.4% 16.2% 15.8% 15.9% 16.7% 16.7% 16.8% 16.7% 16.2% 15.7% 15.1%
*S275 duty root 31, 32, 33 or 34 with FTE designation greater than 0 in given year. Preliminary S-275 data in 2015-16.
Statewide
Appendix A: Demographic Characteristics of Washington Teacher Workforce: 2005/06 to 2015/16
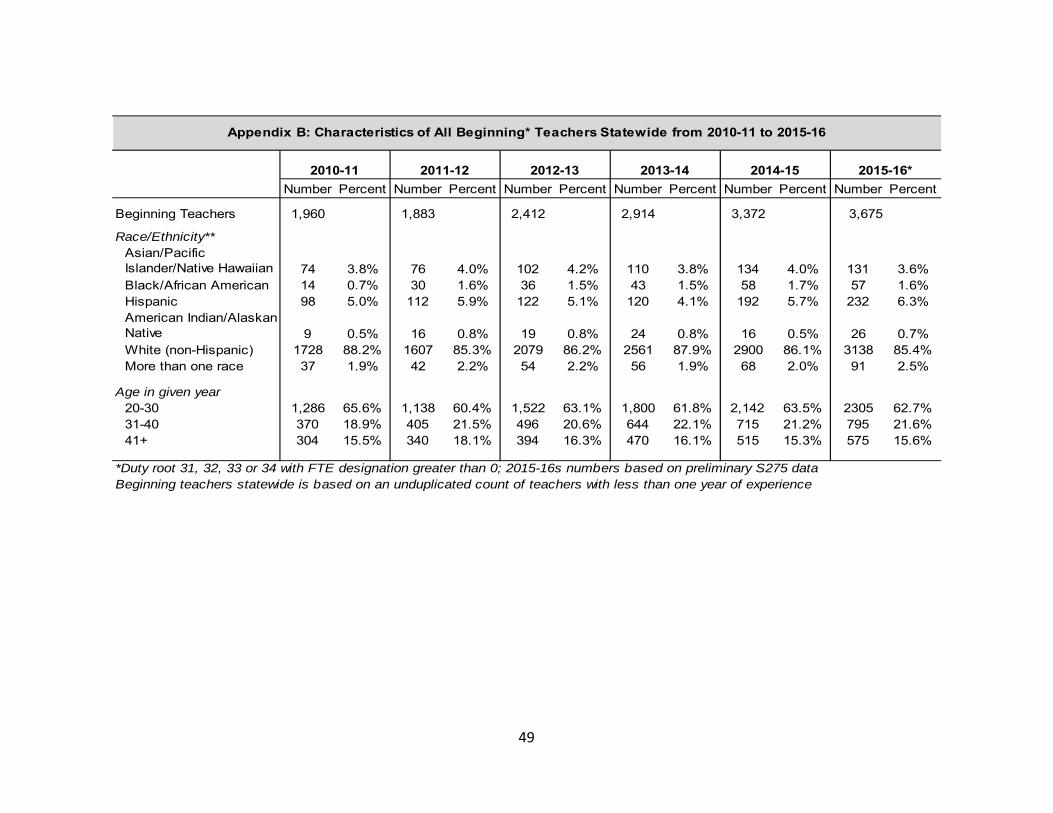
49
Number Percent Number Percent Number Percent Number Percent Number Percent Number Percent
Beginning Teachers 1,960 1,883 2,412 2,914 3,372 3,675
Race/Ethnicity**Asian/Pacific Islander/Native Hawaiian 74 3.8% 76 4.0% 102 4.2% 110 3.8% 134 4.0% 131 3.6%Black/African American 14 0.7% 30 1.6% 36 1.5% 43 1.5% 58 1.7% 57 1.6%Hispanic 98 5.0% 112 5.9% 122 5.1% 120 4.1% 192 5.7% 232 6.3%American Indian/Alaskan Native 9 0.5% 16 0.8% 19 0.8% 24 0.8% 16 0.5% 26 0.7%White (non-Hispanic) 1728 88.2% 1607 85.3% 2079 86.2% 2561 87.9% 2900 86.1% 3138 85.4%More than one race 37 1.9% 42 2.2% 54 2.2% 56 1.9% 68 2.0% 91 2.5%
Age in given year20-30 1,286 65.6% 1,138 60.4% 1,522 63.1% 1,800 61.8% 2,142 63.5% 2305 62.7%31-40 370 18.9% 405 21.5% 496 20.6% 644 22.1% 715 21.2% 795 21.6%41+ 304 15.5% 340 18.1% 394 16.3% 470 16.1% 515 15.3% 575 15.6%
*Duty root 31, 32, 33 or 34 with FTE designation greater than 0; 2015-16s numbers based on preliminary S275 dataBeginning teachers statewide is based on an unduplicated count of teachers with less than one year of experience
Appendix B: Characteristics of All Beginning* Teachers Statewide from 2010-11 to 2015-16
2010-11 2011-12 2012-13 2013-14 2014-15 2015-16*
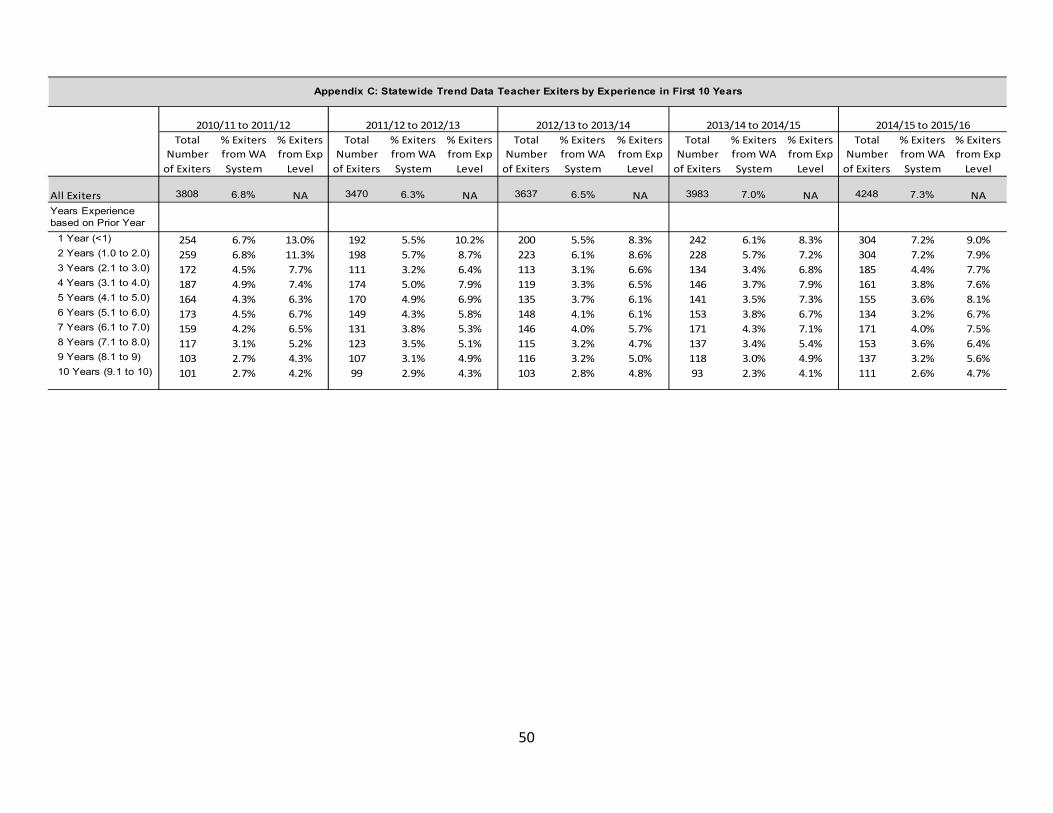
50
Total
Number
of Exiters
% Exiters
from WA
System
% Exiters
from Exp
Level
Total
Number
of Exiters
% Exiters
from WA
System
% Exiters
from Exp
Level
Total
Number
of Exiters
% Exiters
from WA
System
% Exiters
from Exp
Level
Total
Number
of Exiters
% Exiters
from WA
System
% Exiters
from Exp
Level
Total
Number
of Exiters
% Exiters
from WA
System
% Exiters
from Exp
Level
All Exiters 3808 6.8% NA 3470 6.3% NA 3637 6.5% NA 3983 7.0% NA 4248 7.3% NA
Years Experience based on Prior Year
1 Year (<1) 254 6.7% 13.0% 192 5.5% 10.2% 200 5.5% 8.3% 242 6.1% 8.3% 304 7.2% 9.0%2 Years (1.0 to 2.0) 259 6.8% 11.3% 198 5.7% 8.7% 223 6.1% 8.6% 228 5.7% 7.2% 304 7.2% 7.9%3 Years (2.1 to 3.0) 172 4.5% 7.7% 111 3.2% 6.4% 113 3.1% 6.6% 134 3.4% 6.8% 185 4.4% 7.7%4 Years (3.1 to 4.0) 187 4.9% 7.4% 174 5.0% 7.9% 119 3.3% 6.5% 146 3.7% 7.9% 161 3.8% 7.6%5 Years (4.1 to 5.0) 164 4.3% 6.3% 170 4.9% 6.9% 135 3.7% 6.1% 141 3.5% 7.3% 155 3.6% 8.1%6 Years (5.1 to 6.0) 173 4.5% 6.7% 149 4.3% 5.8% 148 4.1% 6.1% 153 3.8% 6.7% 134 3.2% 6.7%7 Years (6.1 to 7.0) 159 4.2% 6.5% 131 3.8% 5.3% 146 4.0% 5.7% 171 4.3% 7.1% 171 4.0% 7.5%8 Years (7.1 to 8.0) 117 3.1% 5.2% 123 3.5% 5.1% 115 3.2% 4.7% 137 3.4% 5.4% 153 3.6% 6.4%9 Years (8.1 to 9) 103 2.7% 4.3% 107 3.1% 4.9% 116 3.2% 5.0% 118 3.0% 4.9% 137 3.2% 5.6%10 Years (9.1 to 10) 101 2.7% 4.2% 99 2.9% 4.3% 103 2.8% 4.8% 93 2.3% 4.1% 111 2.6% 4.7%
2012/13 to 2013/14 2013/14 to 2014/152010/11 to 2011/12 2011/12 to 2012/13
Appendix C: Statewide Trend Data Teacher Exiters by Experience in First 10 Years
2014/15 to 2015/16
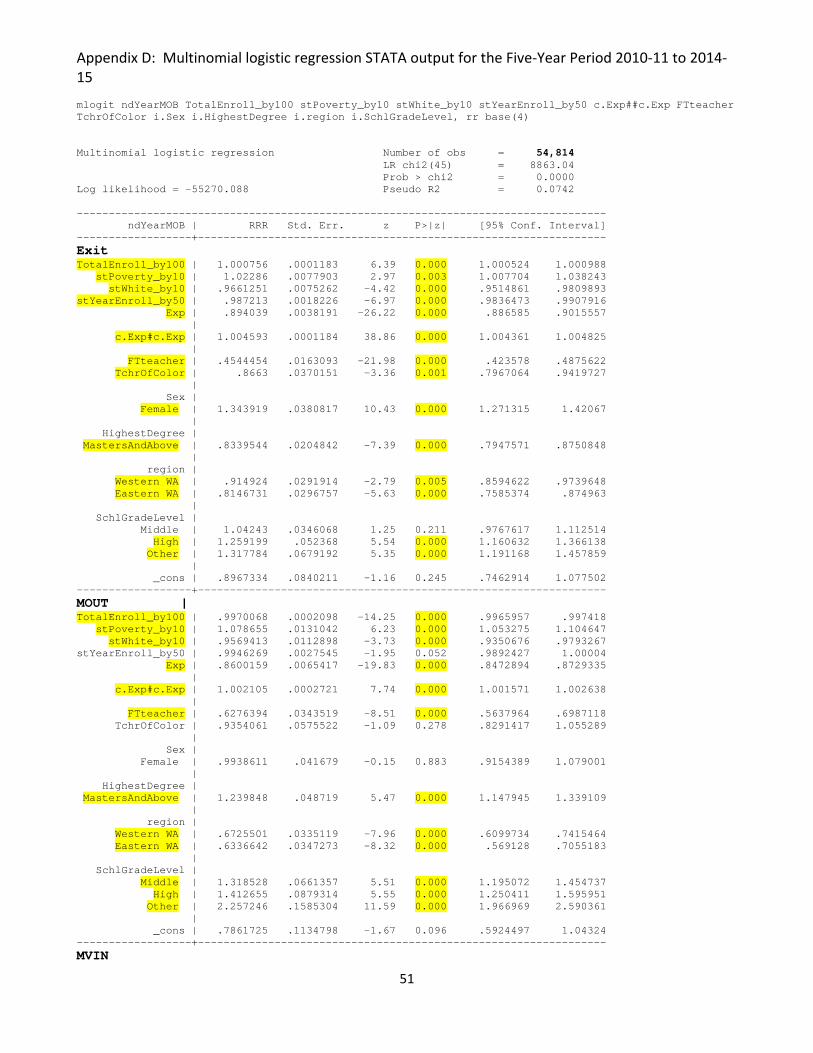
51
Appendix D: Multinomial logistic regression STATA output for the Five‐Year Period 2010‐11 to 2014‐15 mlogit ndYearMOB TotalEnroll_by100 stPoverty_by10 stWhite_by10 stYearEnroll_by50 c.Exp##c.Exp FTteacher TchrOfColor i.Sex i.HighestDegree i.region i.SchlGradeLevel, rr base(4) Multinomial logistic regression Number of obs = 54,814 LR chi2(45) = 8863.04 Prob > chi2 = 0.0000 Log likelihood = -55270.088 Pseudo R2 = 0.0742 ----------------------------------------------------------------------------------- ndYearMOB | RRR Std. Err. z P>|z| [95% Conf. Interval] ------------------+---------------------------------------------------------------- Exit TotalEnroll_by100 | 1.000756 .0001183 6.39 0.000 1.000524 1.000988 stPoverty_by10 | 1.02286 .0077903 2.97 0.003 1.007704 1.038243 stWhite_by10 | .9661251 .0075262 -4.42 0.000 .9514861 .9809893 stYearEnroll_by50 | .987213 .0018226 -6.97 0.000 .9836473 .9907916 Exp | .894039 .0038191 -26.22 0.000 .886585 .9015557 | c.Exp#c.Exp | 1.004593 .0001184 38.86 0.000 1.004361 1.004825 | FTteacher | .4544454 .0163093 -21.98 0.000 .423578 .4875622 TchrOfColor | .8663 .0370151 -3.36 0.001 .7967064 .9419727 | Sex | Female | 1.343919 .0380817 10.43 0.000 1.271315 1.42067 | HighestDegree | MastersAndAbove | .8339544 .0204842 -7.39 0.000 .7947571 .8750848 | region | Western WA | .914924 .0291914 -2.79 0.005 .8594622 .9739648 Eastern WA | .8146731 .0296757 -5.63 0.000 .7585374 .874963 | SchlGradeLevel | Middle | 1.04243 .0346068 1.25 0.211 .9767617 1.112514 High | 1.259199 .052368 5.54 0.000 1.160632 1.366138 Other | 1.317784 .0679192 5.35 0.000 1.191168 1.457859 | _cons | .8967334 .0840211 -1.16 0.245 .7462914 1.077502 ------------------+---------------------------------------------------------------- MOUT | TotalEnroll_by100 | .9970068 .0002098 -14.25 0.000 .9965957 .997418 stPoverty_by10 | 1.078655 .0131042 6.23 0.000 1.053275 1.104647 stWhite_by10 | .9569413 .0112898 -3.73 0.000 .9350676 .9793267 stYearEnroll_by50 | .9946269 .0027545 -1.95 0.052 .9892427 1.00004 Exp | .8600159 .0065417 -19.83 0.000 .8472894 .8729335 | c.Exp#c.Exp | 1.002105 .0002721 7.74 0.000 1.001571 1.002638 | FTteacher | .6276394 .0343519 -8.51 0.000 .5637964 .6987118 TchrOfColor | .9354061 .0575522 -1.09 0.278 .8291417 1.055289 | Sex | Female | .9938611 .041679 -0.15 0.883 .9154389 1.079001 | HighestDegree | MastersAndAbove | 1.239848 .048719 5.47 0.000 1.147945 1.339109 | region | Western WA | .6725501 .0335119 -7.96 0.000 .6099734 .7415464 Eastern WA | .6336642 .0347273 -8.32 0.000 .569128 .7055183 | SchlGradeLevel | Middle | 1.318528 .0661357 5.51 0.000 1.195072 1.454737 High | 1.412655 .0879314 5.55 0.000 1.250411 1.595951 Other | 2.257246 .1585304 11.59 0.000 1.966969 2.590361 | _cons | .7861725 .1134798 -1.67 0.096 .5924497 1.04324 ------------------+---------------------------------------------------------------- MVIN
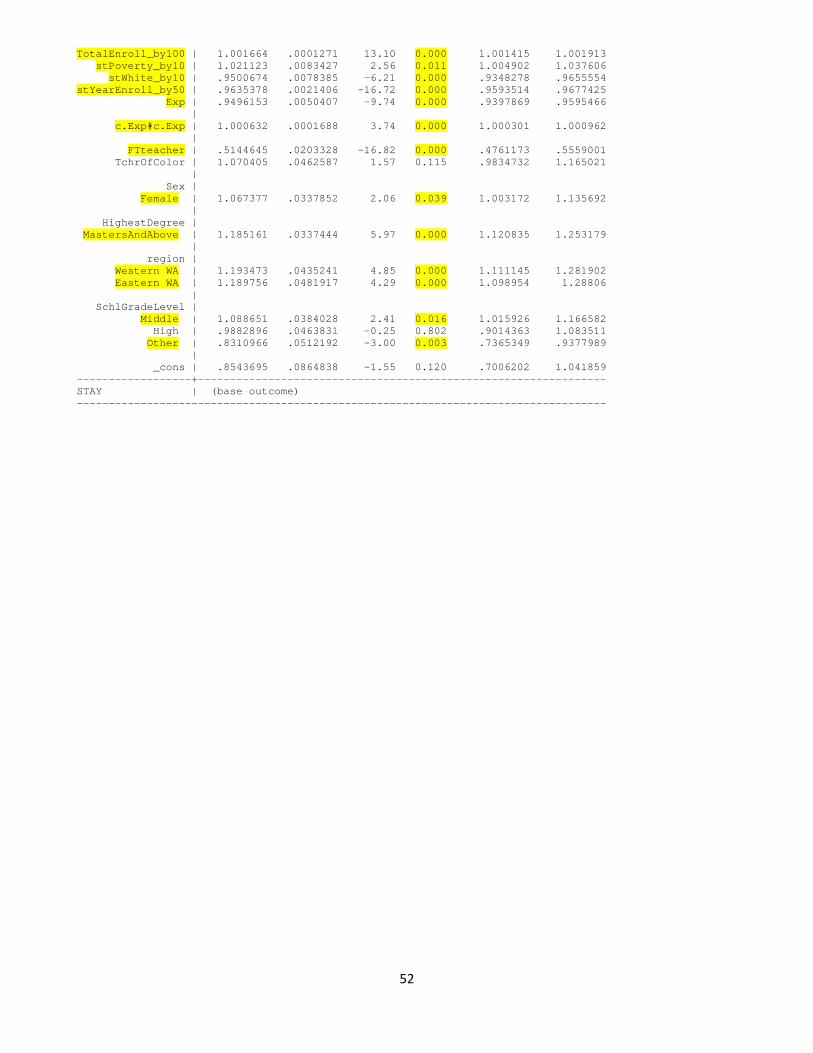
52
TotalEnroll_by100 | 1.001664 .0001271 13.10 0.000 1.001415 1.001913 stPoverty_by10 | 1.021123 .0083427 2.56 0.011 1.004902 1.037606 stWhite_by10 | .9500674 .0078385 -6.21 0.000 .9348278 .9655554 stYearEnroll_by50 | .9635378 .0021406 -16.72 0.000 .9593514 .9677425 Exp | .9496153 .0050407 -9.74 0.000 .9397869 .9595466 | c.Exp#c.Exp | 1.000632 .0001688 3.74 0.000 1.000301 1.000962 | FTteacher | .5144645 .0203328 -16.82 0.000 .4761173 .5559001 TchrOfColor | 1.070405 .0462587 1.57 0.115 .9834732 1.165021 | Sex | Female | 1.067377 .0337852 2.06 0.039 1.003172 1.135692 | HighestDegree | MastersAndAbove | 1.185161 .0337444 5.97 0.000 1.120835 1.253179 | region | Western WA | 1.193473 .0435241 4.85 0.000 1.111145 1.281902 Eastern WA | 1.189756 .0481917 4.29 0.000 1.098954 1.28806 | SchlGradeLevel | Middle | 1.088651 .0384028 2.41 0.016 1.015926 1.166582 High | .9882896 .0463831 -0.25 0.802 .9014363 1.083511 Other | .8310966 .0512192 -3.00 0.003 .7365349 .9377989 | _cons | .8543695 .0864838 -1.55 0.120 .7006202 1.041859 ------------------+---------------------------------------------------------------- STAY | (base outcome) -----------------------------------------------------------------------------------
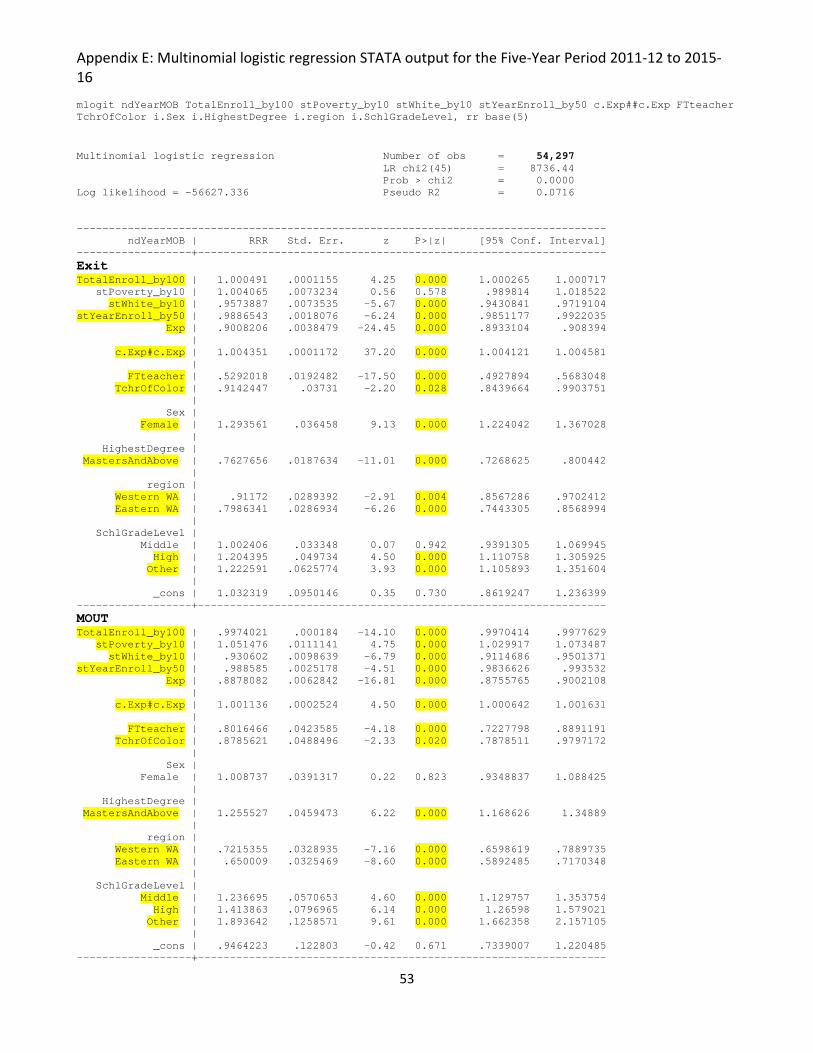
53
Appendix E: Multinomial logistic regression STATA output for the Five‐Year Period 2011‐12 to 2015‐16 mlogit ndYearMOB TotalEnroll_by100 stPoverty_by10 stWhite_by10 stYearEnroll_by50 c.Exp##c.Exp FTteacher TchrOfColor i.Sex i.HighestDegree i.region i.SchlGradeLevel, rr base(5) Multinomial logistic regression Number of obs = 54,297 LR chi2(45) = 8736.44 Prob > chi2 = 0.0000 Log likelihood = -56627.336 Pseudo R2 = 0.0716 ----------------------------------------------------------------------------------- ndYearMOB | RRR Std. Err. z P>|z| [95% Conf. Interval] ------------------+---------------------------------------------------------------- Exit TotalEnroll_by100 | 1.000491 .0001155 4.25 0.000 1.000265 1.000717 stPoverty_by10 | 1.004065 .0073234 0.56 0.578 .989814 1.018522 stWhite_by10 | .9573887 .0073535 -5.67 0.000 .9430841 .9719104 stYearEnroll_by50 | .9886543 .0018076 -6.24 0.000 .9851177 .9922035 Exp | .9008206 .0038479 -24.45 0.000 .8933104 .908394 | c.Exp#c.Exp | 1.004351 .0001172 37.20 0.000 1.004121 1.004581 | FTteacher | .5292018 .0192482 -17.50 0.000 .4927894 .5683048 TchrOfColor | .9142447 .03731 -2.20 0.028 .8439664 .9903751 | Sex | Female | 1.293561 .036458 9.13 0.000 1.224042 1.367028 | HighestDegree | MastersAndAbove | .7627656 .0187634 -11.01 0.000 .7268625 .800442 | region | Western WA | .91172 .0289392 -2.91 0.004 .8567286 .9702412 Eastern WA | .7986341 .0286934 -6.26 0.000 .7443305 .8568994 | SchlGradeLevel | Middle | 1.002406 .033348 0.07 0.942 .9391305 1.069945 High | 1.204395 .049734 4.50 0.000 1.110758 1.305925 Other | 1.222591 .0625774 3.93 0.000 1.105893 1.351604 | _cons | 1.032319 .0950146 0.35 0.730 .8619247 1.236399 ------------------+---------------------------------------------------------------- MOUT TotalEnroll_by100 | .9974021 .000184 -14.10 0.000 .9970414 .9977629 stPoverty_by10 | 1.051476 .0111141 4.75 0.000 1.029917 1.073487 stWhite_by10 | .930602 .0098639 -6.79 0.000 .9114686 .9501371 stYearEnroll_by50 | .988585 .0025178 -4.51 0.000 .9836626 .993532 Exp | .8878082 .0062842 -16.81 0.000 .8755765 .9002108 | c.Exp#c.Exp | 1.001136 .0002524 4.50 0.000 1.000642 1.001631 | FTteacher | .8016466 .0423585 -4.18 0.000 .7227798 .8891191 TchrOfColor | .8785621 .0488496 -2.33 0.020 .7878511 .9797172 | Sex | Female | 1.008737 .0391317 0.22 0.823 .9348837 1.088425 | HighestDegree | MastersAndAbove | 1.255527 .0459473 6.22 0.000 1.168626 1.34889 | region | Western WA | .7215355 .0328935 -7.16 0.000 .6598619 .7889735 Eastern WA | .650009 .0325469 -8.60 0.000 .5892485 .7170348 | SchlGradeLevel | Middle | 1.236695 .0570653 4.60 0.000 1.129757 1.353754 High | 1.413863 .0796965 6.14 0.000 1.26598 1.579021 Other | 1.893642 .1258571 9.61 0.000 1.662358 2.157105 | _cons | .9464223 .122803 -0.42 0.671 .7339007 1.220485 ------------------+----------------------------------------------------------------
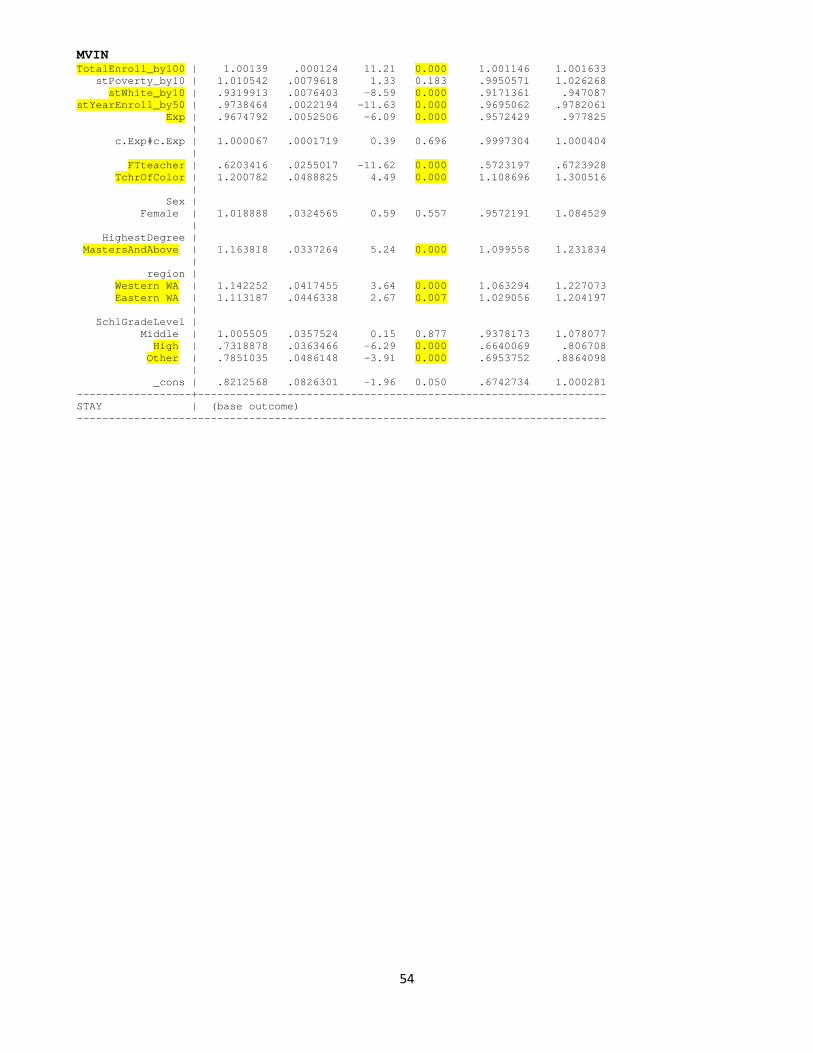
54
MVIN TotalEnroll_by100 | 1.00139 .000124 11.21 0.000 1.001146 1.001633 stPoverty_by10 | 1.010542 .0079618 1.33 0.183 .9950571 1.026268 stWhite_by10 | .9319913 .0076403 -8.59 0.000 .9171361 .947087 stYearEnroll_by50 | .9738464 .0022194 -11.63 0.000 .9695062 .9782061 Exp | .9674792 .0052506 -6.09 0.000 .9572429 .977825 | c.Exp#c.Exp | 1.000067 .0001719 0.39 0.696 .9997304 1.000404 | FTteacher | .6203416 .0255017 -11.62 0.000 .5723197 .6723928 TchrOfColor | 1.200782 .0488825 4.49 0.000 1.108696 1.300516 | Sex | Female | 1.018888 .0324565 0.59 0.557 .9572191 1.084529 | HighestDegree | MastersAndAbove | 1.163818 .0337264 5.24 0.000 1.099558 1.231834 | region | Western WA | 1.142252 .0417455 3.64 0.000 1.063294 1.227073 Eastern WA | 1.113187 .0446338 2.67 0.007 1.029056 1.204197 | SchlGradeLevel | Middle | 1.005505 .0357524 0.15 0.877 .9378173 1.078077 High | .7318878 .0363466 -6.29 0.000 .6640069 .806708 Other | .7851035 .0486148 -3.91 0.000 .6953752 .8864098 | _cons | .8212568 .0826301 -1.96 0.050 .6742734 1.000281 ------------------+---------------------------------------------------------------- STAY | (base outcome) -----------------------------------------------------------------------------------
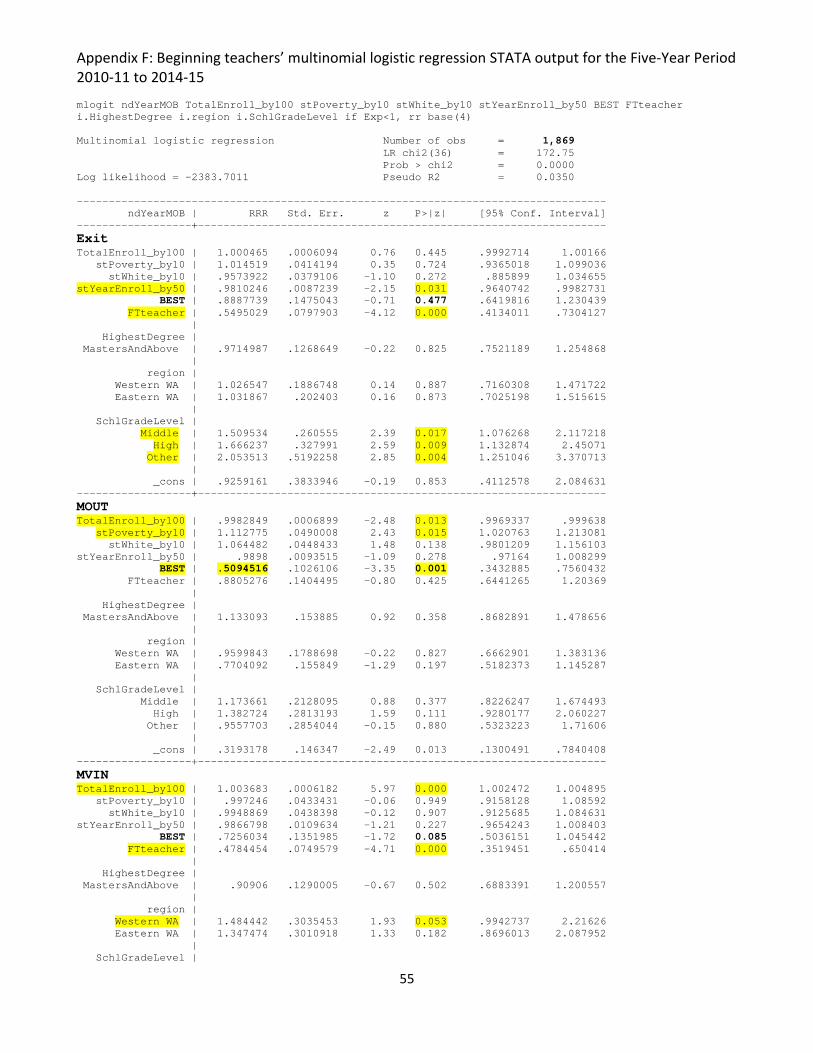
55
Appendix F: Beginning teachers’ multinomial logistic regression STATA output for the Five‐Year Period 2010‐11 to 2014‐15 mlogit ndYearMOB TotalEnroll_by100 stPoverty_by10 stWhite_by10 stYearEnroll_by50 BEST FTteacher i.HighestDegree i.region i.SchlGradeLevel if Exp<1, rr base(4) Multinomial logistic regression Number of obs = 1,869 LR chi2(36) = 172.75 Prob > chi2 = 0.0000 Log likelihood = -2383.7011 Pseudo R2 = 0.0350 ----------------------------------------------------------------------------------- ndYearMOB | RRR Std. Err. z P>|z| [95% Conf. Interval] ------------------+---------------------------------------------------------------- Exit TotalEnroll_by100 | 1.000465 .0006094 0.76 0.445 .9992714 1.00166 stPoverty_by10 | 1.014519 .0414194 0.35 0.724 .9365018 1.099036 stWhite_by10 | .9573922 .0379106 -1.10 0.272 .885899 1.034655 stYearEnroll_by50 | .9810246 .0087239 -2.15 0.031 .9640742 .9982731 BEST | .8887739 .1475043 -0.71 0.477 .6419816 1.230439 FTteacher | .5495029 .0797903 -4.12 0.000 .4134011 .7304127 | HighestDegree | MastersAndAbove | .9714987 .1268649 -0.22 0.825 .7521189 1.254868 | region | Western WA | 1.026547 .1886748 0.14 0.887 .7160308 1.471722 Eastern WA | 1.031867 .202403 0.16 0.873 .7025198 1.515615 | SchlGradeLevel | Middle | 1.509534 .260555 2.39 0.017 1.076268 2.117218 High | 1.666237 .327991 2.59 0.009 1.132874 2.45071 Other | 2.053513 .5192258 2.85 0.004 1.251046 3.370713 | _cons | .9259161 .3833946 -0.19 0.853 .4112578 2.084631 ------------------+---------------------------------------------------------------- MOUT TotalEnroll_by100 | .9982849 .0006899 -2.48 0.013 .9969337 .999638 stPoverty_by10 | 1.112775 .0490008 2.43 0.015 1.020763 1.213081 stWhite_by10 | 1.064482 .0448433 1.48 0.138 .9801209 1.156103 stYearEnroll_by50 | .9898 .0093515 -1.09 0.278 .97164 1.008299 BEST | .5094516 .1026106 -3.35 0.001 .3432885 .7560432 FTteacher | .8805276 .1404495 -0.80 0.425 .6441265 1.20369 | HighestDegree | MastersAndAbove | 1.133093 .153885 0.92 0.358 .8682891 1.478656 | region | Western WA | .9599843 .1788698 -0.22 0.827 .6662901 1.383136 Eastern WA | .7704092 .155849 -1.29 0.197 .5182373 1.145287 | SchlGradeLevel | Middle | 1.173661 .2128095 0.88 0.377 .8226247 1.674493 High | 1.382724 .2813193 1.59 0.111 .9280177 2.060227 Other | .9557703 .2854044 -0.15 0.880 .5323223 1.71606 | _cons | .3193178 .146347 -2.49 0.013 .1300491 .7840408 ------------------+---------------------------------------------------------------- MVIN TotalEnroll_by100 | 1.003683 .0006182 5.97 0.000 1.002472 1.004895 stPoverty_by10 | .997246 .0433431 -0.06 0.949 .9158128 1.08592 stWhite_by10 | .9948869 .0438398 -0.12 0.907 .9125685 1.084631 stYearEnroll_by50 | .9866798 .0109634 -1.21 0.227 .9654243 1.008403 BEST | .7256034 .1351985 -1.72 0.085 .5036151 1.045442 FTteacher | .4784454 .0749579 -4.71 0.000 .3519451 .650414 | HighestDegree | MastersAndAbove | .90906 .1290005 -0.67 0.502 .6883391 1.200557 | region | Western WA | 1.484442 .3035453 1.93 0.053 .9942737 2.21626 Eastern WA | 1.347474 .3010918 1.33 0.182 .8696013 2.087952 | SchlGradeLevel |
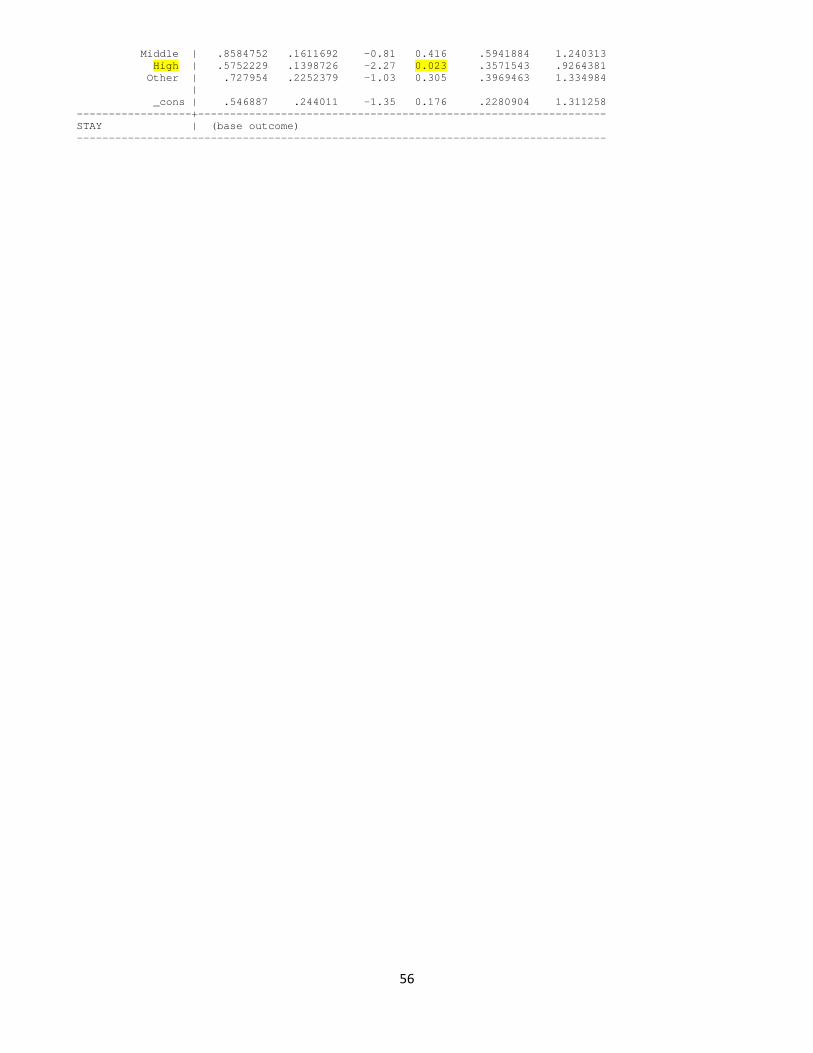
56
Middle | .8584752 .1611692 -0.81 0.416 .5941884 1.240313 High | .5752229 .1398726 -2.27 0.023 .3571543 .9264381 Other | .727954 .2252379 -1.03 0.305 .3969463 1.334984 | _cons | .546887 .244011 -1.35 0.176 .2280904 1.311258 ------------------+---------------------------------------------------------------- STAY | (base outcome) -----------------------------------------------------------------------------------
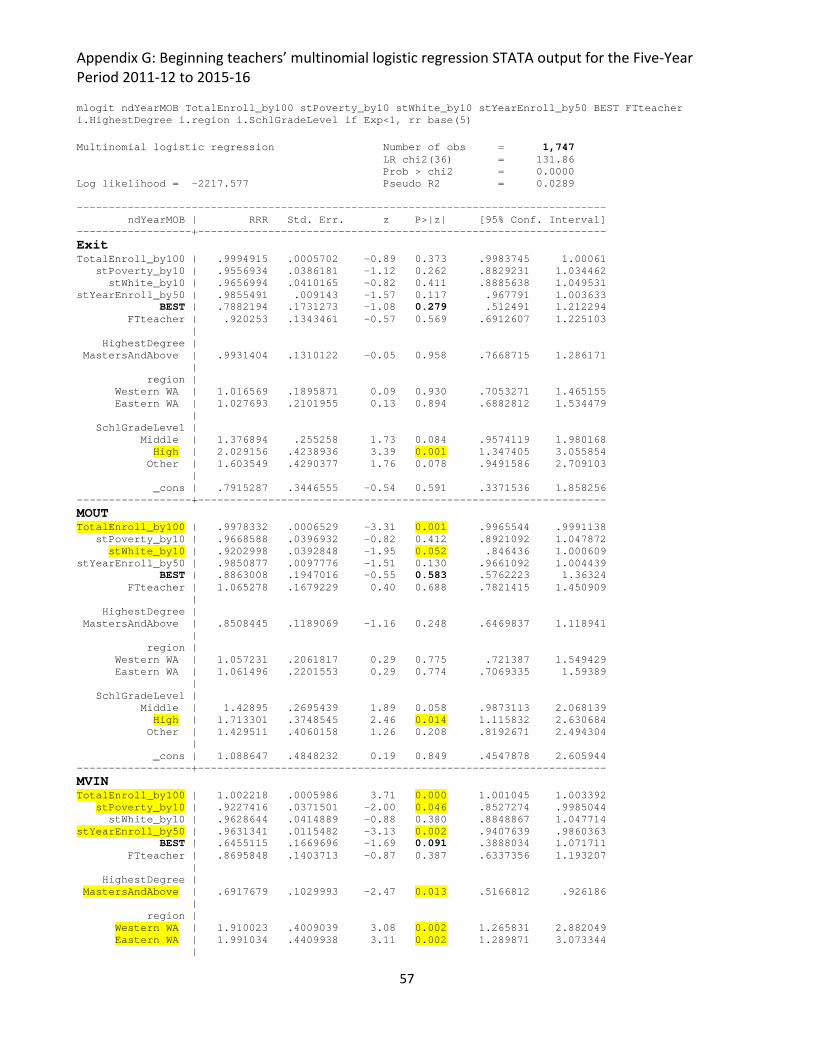
57
Appendix G: Beginning teachers’ multinomial logistic regression STATA output for the Five‐Year Period 2011‐12 to 2015‐16
mlogit ndYearMOB TotalEnroll_by100 stPoverty_by10 stWhite_by10 stYearEnroll_by50 BEST FTteacher i.HighestDegree i.region i.SchlGradeLevel if Exp<1, rr base(5)
Multinomial logistic regression Number of obs = 1,747 LR chi2(36) = 131.86 Prob > chi2 = 0.0000 Log likelihood = -2217.577 Pseudo R2 = 0.0289 ----------------------------------------------------------------------------------- ndYearMOB | RRR Std. Err. z P>|z| [95% Conf. Interval] ------------------+---------------------------------------------------------------- Exit TotalEnroll_by100 | .9994915 .0005702 -0.89 0.373 .9983745 1.00061 stPoverty_by10 | .9556934 .0386181 -1.12 0.262 .8829231 1.034462 stWhite_by10 | .9656994 .0410165 -0.82 0.411 .8885638 1.049531 stYearEnroll_by50 | .9855491 .009143 -1.57 0.117 .967791 1.003633 BEST | .7882194 .1731273 -1.08 0.279 .512491 1.212294 FTteacher | .920253 .1343461 -0.57 0.569 .6912607 1.225103 | HighestDegree | MastersAndAbove | .9931404 .1310122 -0.05 0.958 .7668715 1.286171 | region | Western WA | 1.016569 .1895871 0.09 0.930 .7053271 1.465155 Eastern WA | 1.027693 .2101955 0.13 0.894 .6882812 1.534479 | SchlGradeLevel | Middle | 1.376894 .255258 1.73 0.084 .9574119 1.980168 High | 2.029156 .4238936 3.39 0.001 1.347405 3.055854 Other | 1.603549 .4290377 1.76 0.078 .9491586 2.709103 | _cons | .7915287 .3446555 -0.54 0.591 .3371536 1.858256 ------------------+---------------------------------------------------------------- MOUT TotalEnroll_by100 | .9978332 .0006529 -3.31 0.001 .9965544 .9991138 stPoverty_by10 | .9668588 .0396932 -0.82 0.412 .8921092 1.047872 stWhite_by10 | .9202998 .0392848 -1.95 0.052 .846436 1.000609 stYearEnroll_by50 | .9850877 .0097776 -1.51 0.130 .9661092 1.004439 BEST | .8863008 .1947016 -0.55 0.583 .5762223 1.36324 FTteacher | 1.065278 .1679229 0.40 0.688 .7821415 1.450909 | HighestDegree | MastersAndAbove | .8508445 .1189069 -1.16 0.248 .6469837 1.118941 | region | Western WA | 1.057231 .2061817 0.29 0.775 .721387 1.549429 Eastern WA | 1.061496 .2201553 0.29 0.774 .7069335 1.59389 | SchlGradeLevel | Middle | 1.42895 .2695439 1.89 0.058 .9873113 2.068139 High | 1.713301 .3748545 2.46 0.014 1.115832 2.630684 Other | 1.429511 .4060158 1.26 0.208 .8192671 2.494304 | _cons | 1.088647 .4848232 0.19 0.849 .4547878 2.605944 ------------------+---------------------------------------------------------------- MVIN TotalEnroll_by100 | 1.002218 .0005986 3.71 0.000 1.001045 1.003392 stPoverty_by10 | .9227416 .0371501 -2.00 0.046 .8527274 .9985044 stWhite_by10 | .9628644 .0414889 -0.88 0.380 .8848867 1.047714 stYearEnroll_by50 | .9631341 .0115482 -3.13 0.002 .9407639 .9860363 BEST | .6455115 .1669696 -1.69 0.091 .3888034 1.071711 FTteacher | .8695848 .1403713 -0.87 0.387 .6337356 1.193207 | HighestDegree | MastersAndAbove | .6917679 .1029993 -2.47 0.013 .5166812 .926186 | region | Western WA | 1.910023 .4009039 3.08 0.002 1.265831 2.882049 Eastern WA | 1.991034 .4409938 3.11 0.002 1.289871 3.073344 |
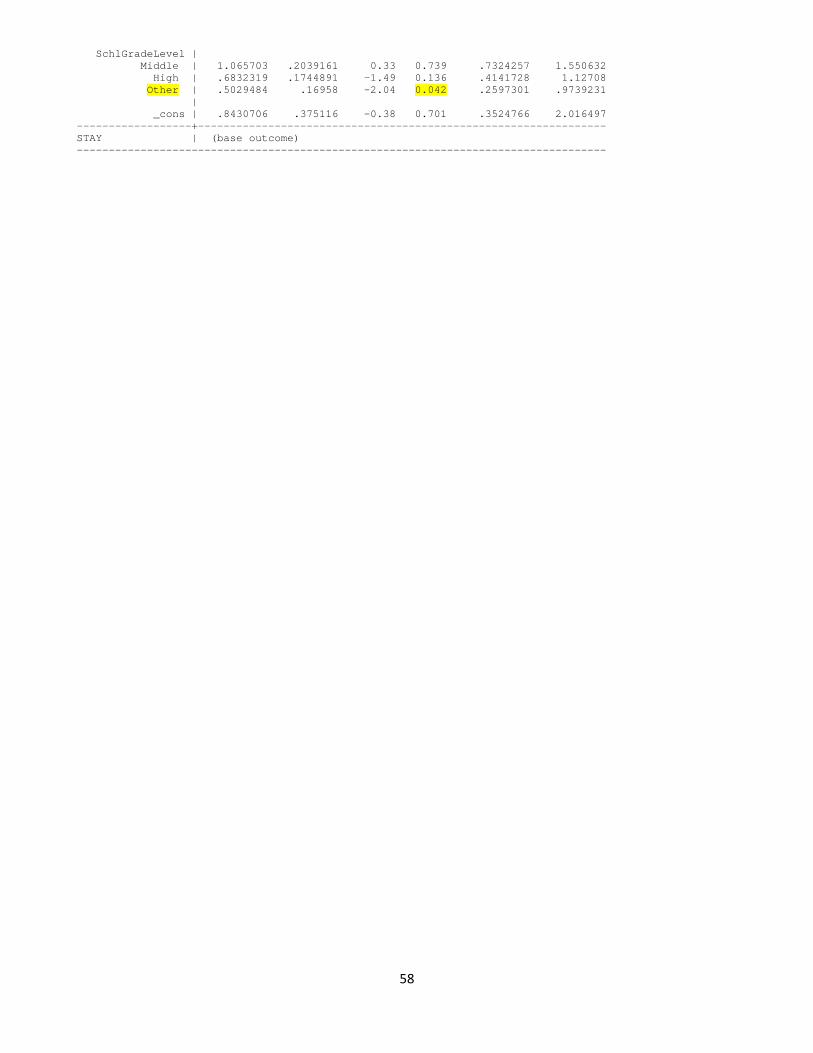
58
SchlGradeLevel | Middle | 1.065703 .2039161 0.33 0.739 .7324257 1.550632 High | .6832319 .1744891 -1.49 0.136 .4141728 1.12708 Other | .5029484 .16958 -2.04 0.042 .2597301 .9739231 | _cons | .8430706 .375116 -0.38 0.701 .3524766 2.016497 ------------------+---------------------------------------------------------------- STAY | (base outcome) -----------------------------------------------------------------------------------