Embed Size (px)
Citation preview
Understanding Searchers’ Perception of Task Difficulty: Relationships with Task Type
Jingjing Liu1, Chang Liu2, Xiaojun Yuan3, Nicholas J. Belkin2 1 Department of Information and Library Science, Southern Connecticut State University
2 School of Communication and Information, Rutgers University 3 College of Computing and Information, University at Albany, State University of New York [email protected], [email protected], [email protected], [email protected]
ABSTRACT We report findings that help us better understand the difficulty of tasks which involve information seeking, retrieving, gathering, and use. We examined the data gathered from two interactive information retrieval user studies on how users’ perception of task difficulty changes before and after searching for information to solve tasks, and how the difficulty of tasks relates with users’ background, previous experience with the tasks, and knowledge of the task topics, etc. The two studies employed carefully designed tasks with different types along several dimensions: task structure (subtasks being dependent upon or parallel with each other), task goal in quality (being specific or amorphous), and naming (being named or unnamed). It was found that while in some types of tasks, users’ perceptions of task difficulty did not change before and after working on the tasks, in others, this did, either increasing or decreasing. Specifically, in the dependent-structured task, this did not change. In the parallel-structured or specific/named task, it decreased. In the amorphous/unnamed task, it increased. We also found that users’ background factors do not normally correlate with their perceived task difficulty, or perceived difficulty change. In addition to helping understand the dynamic and complex nature of task difficulty, our findings have implications for system design that can provide assistance to users with their search and task solving strategies.
Keywords Task difficulty, expected difficulty, reflected difficulty, task type.
INTRODUCTION Current search engines do a good job in returning answers with easy and simple tasks, e.g., “when is the poster submission deadline for ASIS&T 2011 conference?” One can simply type in Google (http://www.google.com) the keywords “ASIST 2011 poster deadline” and find the answer from the snippet of the top ranked search result. However, search systems do not do as well with somewhat difficult tasks, e.g., “collect information that is helpful to make a 2-week tour plan in October this year to some good tour sites in China.” The task being not specific but
amorphous in goal, the complex nature of the task, as well as the user’s lack of knowledge with China, etc., could all be factors that make the task difficult. Better search systems are needed that can help people more easily locate useful information and more effectively solve such difficult tasks. It is fundamental to first understand task difficulty, based on which systems can be designed or improved, that can provide assistance to the users to help solve tasks, or to reduce the degree of difficulty that users perceive.
Li & Belkin (2008) define task difficulty as a subjective perception assessed by task doers. It could be formed in both pre- and post-task (Kim, 2006). Task difficulty has been found to be a significant factor influencing users’ search behaviors and search performance. In difficult tasks, users are more likely to visit more web pages (Gwizdka & Spence, 2006; Kim, 2006; Liu et al., 2010), issue more queries (Aula, Khan, & Guan, 2010; Kim, 2006; Liu et al., 2010), and spend longer total time (Aula, Khan, & Guan, 2010; Liu et al., 2010) and first dwell time (Liu et al., 2010) on search result pages. These findings on the relationships between users’ search behaviors and task difficulty suggest that it is possible to predict the difficulty level of a task from the users’ search behaviors. Further, researchers have found that the relationships between search behaviors and task difficulty vary in different types of tasks such as in factual, interpretive, and exploratory (Kim, 2006), or in fact-finding and information gathering (Liu et al., 2010).
Even though a system can predict, from observing the users’ behaviors, that they are having difficulty with their search, the system cannot help users overcome the difficulty unless it has a further understanding of the nature of task difficulty. The following research questions need to be answered: 1) Does a user’s perception of the level of task difficulty change along the search and task solving process? 2) Does this change of difficulty perception vary in different task types? 3) What could be the possible factors that lead to this change? 4) What can systems do to reduce task difficulty?
LITERATURE REVIEW As an important factor determining task performance, task difficulty, as well as a closely related concept, task complexity, has attracted significant attention in interactive information retrieval (IIR). We discuss here work related to ours in both of these areas.
Copyright is held by the author/owner(s). ASIST 2011, October 9–13, 2011, New Orleans, LA, USA.

Many efforts have been spent on exploring the effect of task complexity on information task performance and/or users behaviors. Byström and her colleagues (e.g., Byström & Järvelin, 1995; Byström, 2002) conducted a series of studies analyzing the effect of task complexity on human information behaviors. In their research, task complexity was defined from the worker’s point of view based on “a priori determinability of, or uncertainty about, task outcomes, process, and information requirements” (Byström & Järvelin, 1995, p. 194). They found that as people’s task complexity increased, they needed more types and more sources of information, needed more domain information and more problem solving information, were less likely to predict the types of information they need, and were more dependent upon experts to provide useful information. Vakkari (1999) outlined a model showing the relationships of factors determining task performance, including task complexity (following Byström and colleagues’ definition), problem structure, prior knowledge, and information actions. His main argument was that information activities are systematically connected to task complexity and the structure of the problem at hand. In their study examining the impact of task complexity on the utility of implicit relevance feedback (IRF), as opposed to explicit relevance feedback (ERF), White, Ruthven and Jose (2005) used an objective way to define complexity by operationalizing it into measurable variables including the number of potential information sources and type of information required to complete a task. Results indicate that for more complex tasks, participants preferred IRF, but for less complex tasks, they preferred ERF. Li and Belkin (2008) argued that task complexity can be both objective and subjective, with subjective task complexity assessed by task performers, and objective task complexity defined by the number of activities involved in a “work task” (Ingwersen & Järvelin, 2005) or the number of information sources involved in a “search task.” Following their definition, studies have found that in tasks with higher objective task complexity, users searched more systems, issued more queries, viewed more pages, and spent longer time completing the task (Li & Belkin, 2010; Liu et al., 2010). Task complexity is sometimes used in an interchangeable sense with task difficulty, such as in Bell & Ruthven (2004). They explored the nature of task complexity (difficulty), basically following Byström and colleagues’ definition, in terms of whether users could recognize task complexity and how it affected search success and satisfaction. They pointed out that task complexity is a dynamic entity, and that system evaluation should use tasks with appropriate complexity levels. Some other researchers looked at task difficulty. In their comprehensive task classification scheme, Li and Belkin (2008) defined task difficulty as a subjective perception assessed by task doers. Cole et al. (2010) operationalized it as anticipated task difficulty. Similarly, Kim (2006) defined
task difficulty as task performers’ perception of the complexity of a task. Many studies measured task difficulty using users’ self-reported perception of how difficult a task is through questionnaires. With this measurement, Gwizdka and Spence (2006) performed a web study to investigate the relationship between task difficulty and search behavior operationalized as the number of the unique web pages visited, the time spent on each page, the degree of deviation from the optimal path and the degree of the navigation path’s linearity. Their results demonstrated that these four measures were good predictors of subjective task difficulty. It was found that objective task complexity has an impact on the relative importance of those predictors and on the subjective perception of task difficulty. However, the only task type was information-finding. Kim (2006) reported a close relationship between task difficulty and searching interaction. For different task types, the relationship varies. In particular, the correlation results of task difficulty and some behavioral variables indicate that post-task difficulty was significantly associated with task completion time, and the numbers of queries and documents viewed in factual tasks; user behaviors were significantly correlated with pre-task difficulty in exploratory tasks; but most correlations were not significant in interpretive tasks. Therefore, post-task difficulty is a good indicator for factual task only. Liu, Gwizdka, Liu, and Belkin (2010) also reported how behavioral predictors of task difficulty vary across different task types, including single-fact finding, multiple-fact finding and multiple-piece information gathering tasks. In single-fact finding tasks, participants’ total dwell time and first dwell time on unique content pages were significantly longer in difficult tasks than in easy tasks. This relationship was not supported in other tasks. Also in the same task type, participants’ total dwell time and first dwell time on unique SERPs did not differ between difficult and easy tasks. However, in other task types, participants spent longer dwell time on SERPs in difficult tasks than in easier tasks.
Aula, Khan, and Guan (2010) conducted a large-scale study (179 participants with each completing an average of 22.3 tasks of varying task difficulty) to observe user web search behavior. They used closed informational tasks to which there is a single, unambiguous answer. They defined a task as difficult if a user failed it. Their results indicate that participants tended to issue more diverse queries, and spend longer total time on the search result page and used advanced operators more in completing difficult tasks than easier tasks. As in Gwizdka and Spence (2006), the single task type limits the generalization of results of is study.
Some other researchers looked at system assistance, which is closely related to task difficulty. Jansen (2006) evaluated the effectiveness of automated assistance using complex searching tasks (the tasks used by TREC1). A system with
1 http://trec.nist.gov/

Figure 1. A theoretical model of user perception of task difficulty and affecting factors
pattern-based searching assistance was compared to a system with assistance provided at every point in the whole search process. Results indicate that in 70% of the cases, participants on the system with the pattern-based searching assistance performed better than those on the other system. It further indicates that appropriate assistance can improve user performance in dealing with complex tasks. With the similar intention of exploring ways of helping users find needed information, Xie and Cool (2009) did a study to identify different types of help-seeking situations and different types of factors that may be related to such situations. Three tasks were used; that is: an exploring task, a task requiring searching for specific information, and a task requiring searching for information with a variety of characteristics. It was found that task type and task complexity had an impact on whether participants need to overcome help-seeking situations. Also, the help-seeking situation “inability to select appropriate terms” was highly related to the task type and task complexity, particularly when users have to look for specific information. These studies made important steps on investigating how to provide enough and appropriate help for users with complex tasks. Nevertheless, previous studies have rarely examined users’ perceptions of the tasks’ difficulty after they have finished the task in comparison with before working on it.
A THEORETICAL MODEL The above literature review shows that task complexity and/or difficulty has significant relations with a number of other factors: task performance, search behaviors, knowledge background, relevance judgment, etc. We are specifically interested in users’ perception of task difficulty, both before and after working with a task, as well as how these perceptions relate with other factors, such as users’ background, task type, user behaviors, etc. We propose a model showing the above-mentioned relations (Figure 1).
There are five sets of components in the model, which are about 1) task completion, 2) task difficulty, 3) user background, 4) user interaction with the system and all the behaviors in the process, and 5) task features.
For the task that drives one to seek information, the task doer will eventually finish working with it, no matter how successful it is. This is the first component in the model (marked as number “1” in Figure 1), which provides an ending point to the task.
The second set of components (marked as “2” in Figure 1) is about the task doer’s perception of task difficulty. Before working on a task, although it is not always explicitly expressed, the task doer usually has an estimate of the task’s difficulty, which is the expected task difficulty. After working on the task, he/she has another perception on the task’s difficulty, which is the reflected. The importance of the two types of task difficulty is that it is likely that the task doer’s perception of task difficulty changes after working on the task, and this will inevitably affect their satisfaction with the IR system in which they seek information.
The third set of components (marked as “3” in Figure 1) is the task-doer’s background, including both pre-task and post-task. This is similar to the “prior knowledge” in Vakkari’s (1999) model that shows the relations between task complexity, problem structure, knowledge, and information actions, however, our model considers more variables than just “prior knowledge”. In our model, the pre-task background, such as pre-task topic knowledge, previous experience with the type of task, etc., could affect their expected task difficulty. The post-task background, including one’s post-task topic knowledge, will likely affect, together with pre-task background factors, the task doer’s post-task perception of task difficulty.
!
!"#$!%&'()$*+,-"!#$%&'()*!*+,-.%/0%1!#$%23,4)!%5#%$3%+6%1!%'67!!
.*"/0/&"(1-2332'+4/51
!"#$!%&'()$*+,-"!#,)'&'()*!*+,-.%/0%1!%'67!!
6&"(1'*784#/2*,!!
6&"(13#&/+$#"1
!"#$1%#9&:2*$"1;2,/#$&'/2*,1<2/91"5"/#7=1
!
.$#0/&"(1-2332'+4/51
>1?1
@1
A1
B1
?1
@1

The fourth set of components (marked as “4” in Figure 1) is the task doer, i.e., the information system user’s behaviors, which is demonstrated through interacting with the search system. This is similar to the “information actions” in Vakkari’s (1999) model. These can include users’ queries used to search in the system, documents (web pages, etc.) opened, viewed, and/or retained, time spent on reading documents, etc. Task difficulty will affect such behaviors, and such behaviors could be indicators of task difficulty. Previous studies (e.g., Gwizdka & Spence, 2006; Liu et al., 2010) have looked at predicting task difficulty based on behavioral evidence. While it is an important research area, it is not the focus of the current paper.
The fifth set of components (marked as “5” in Figure 1) is about task features. This is similar to the “problem structure” in Vakkari’s (1999) model. Task features, including different types of tasks, have been found to affect users’ behaviors and difficulty perception (e.g., Kim, 2006; Liu et al., 2010). Therefore, it is an important aspect to include in our model and current examination.
METHOD
Study 1 Data came from a 3-session lab experiment designed to examine information system users’ behavioral and performance changes along the way of searching for information to solve a task.
Experimental design In this experiment, the 3 sessions were treated as 3 stages. The design was 2*2 factorial with two between-subjects factors (Table 1). One was task type, with two levels: parallel or dependent. The other was search system, with two levels: query suggestion (QS) or non-query suggestion (NQS). The two tasks and the system conditions are described in more detail below.
System condition One aspect of the study as a whole was aimed at exploring whether query terms extracted from useful pages in previous sessions were helpful for the users in their current search, and to this end, two versions of the search system were designed. One version (NQS) is the regular IE window, and the other (QS) offered query term suggestions based on previous sessions, on the left frame of screen, the right being the regular IE window. Since this is a within-subject factor, it is not likely that it affects the task differences that are between-subjects and so this factor is not considered further in this paper.
Table 1. Study 1 experimental design
System version System condition Task Session
(stage 1) Session (stage 2)
Session (stage 3)
1 Dependent NQS NQS NQS 2 Parallel NQS NQS NQS 3 Dependent NQS QS QS 4 Parallel NQS QS QS
Tasks Tasks were designed to mimic journalists’ assignments since they could be relatively easily set as realistic tasks in different domains. Among the many dimensions of task types, this study focused on task structure, i.e., the inter-subtask relation, varying them while keeping other facets in the comprehensive task classification scheme proposed by Li & Belkin (2008) as constant as possible. This makes it reasonable to attribute the task difference to this single factor of task structure. Two tasks types were used in the study: one parallel and one dependent. They both had three sub-tasks, each of which was worked on by the participant during one separate session, for three sessions in total.
The tasks asked the participants to write a three-section feature story on hybrid cars for a newspaper, and to finish and submit each article section at the end of each experiment session. At the end of the 3rd session, they were asked to integrate the 3 sections into one article. In the dependent task (DT), the three sub-tasks were: 1) collect information on what manufacturers have hybrid cars; 2) select three models that you will mainly focus on in this feature story; and 3) compare the pros and cons of three models of hybrid cars. In the parallel task (PT), the three sub-tasks were finding information and writing a report on three models of cars from auto manufacturers renown for good warranties and fair maintenance costs: 1) Honda Civic hybrid; 2) Nissan Altima hybrid, and 3) Toyota Camry hybrid. It was hypothesized that the sub-tasks in the parallel task were independent of one another, but that in the dependent task there would be perceived to be at least some notional order. To maintain consistency, sub-task orders in task description in both tasks were rotated and users were allowed to choose whatever order of sub-task performance they preferred.
In each session, participants were allowed to work up to 40 minutes to write and submit their reports. They were allowed to search freely on the Web for resources in report writing. For logging purpose, users were allowed to keep only one Internet Explorer (IE) window open and use back and forward buttons to move between web pages.
Participants The study recruited 24 undergraduate Journalism/Media Studies students (21 female, 3 male) via email to the student mailing list at the Journalism/Media Studies undergraduate program in the authors’ school. Their mean age was 20.4 years. They self reported to have an average of 8.4 years of online searching experience, and rated their levels of expertise with searching as slightly above average (M=5.38) (1=novice, 7=expert). Each of them came 3 times within a 2-week period based on their schedule. Each was assigned randomly to a task/system condition. Each obtained $30 payment upon finishing all 3 sessions, with an incentive (informed before experiment) of an additional $20 for the top 6 who submitted the most detailed reports to encourage them to take a serious manner in the study.
Procedures Participants came individually to a usability lab to take part in the experiment. Upon arrival in the first session, they completed a consent form and a background questionnaire eliciting their demographic information and search experience. They were then given the general work task to be finished in the whole experiment. A pre-session task questionnaire followed to collect their familiarity with the general task topic, previous experience with the type of task, and the expected task difficulty. Then they were asked to pick one sub-task to work with in the current session. A pre-session sub-task questionnaire followed to collect their familiarity with the sub-task topic. Then they worked with the subtask: searching for useful sources and writing reports. After report submission, participants went through an evaluation process in which they were asked to rate on a 7-point scale each document that they had viewed, in the order of viewing them in the actual search process, with respect to its usefulness to the overall task. A post-session sub-task questionnaire and a post-session general task questionnaire were then administered to elicit user perceptions on the difficulty of the task and sub-task, as well as their satisfaction with their reports. This ended the first session.
In the 2nd and the 3rd sessions, participants went through the same processes except for the consent form and background questionnaire, as well as an instruction step on using query suggestion features for those assigned with the QS version system. In the 3rd session, after the post-session general task questionnaire, an exit interview asked them to reflect their overall knowledge gain (rating on a 7-point scale) and to comment on the whole experiment.
Data collection The experiment was conducted using a two-monitor workstation: the main monitor was an eye-tracker in which the users searched and worked on writing their reports; the 2nd monitor was a regular monitor sitting beside the search monitor, which displayed the online questionnaires and the task and sub-task descriptions. Users’ eye movements were captured but are not reported here. Logging software Morae (http://www.techsmith.com/morae.asp) was used to record all the user-system interactions (such as mouse and keyboard activities, window display) in the main monitor.
Study 2
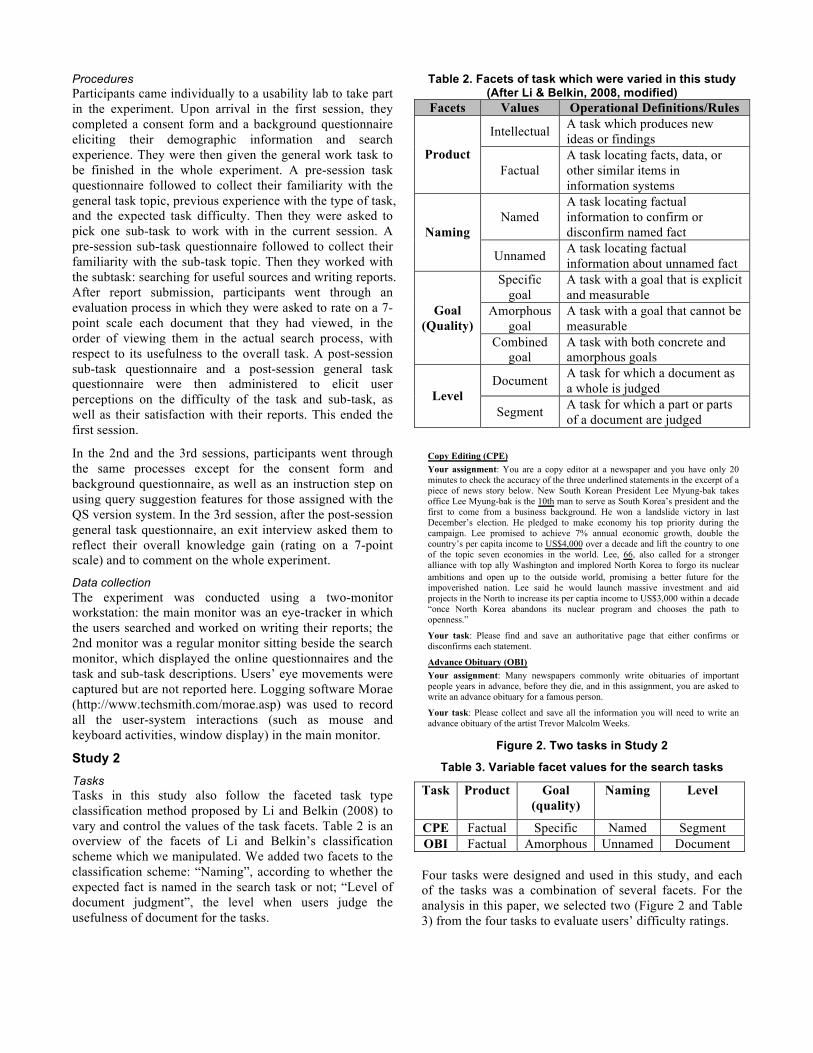
Tasks Tasks in this study also follow the faceted task type classification method proposed by Li and Belkin (2008) to vary and control the values of the task facets. Table 2 is an overview of the facets of Li and Belkin’s classification scheme which we manipulated. We added two facets to the classification scheme: “Naming”, according to whether the expected fact is named in the search task or not; “Level of document judgment”, the level when users judge the usefulness of document for the tasks.
Table 2. Facets of task which were varied in this study (After Li & Belkin, 2008, modified)
Facets Values Operational Definitions/Rules
Intellectual A task which produces new ideas or findings
Product Factual
A task locating facts, data, or other similar items in information systems
Named A task locating factual information to confirm or disconfirm named fact Naming
Unnamed A task locating factual information about unnamed fact
Specific goal
A task with a goal that is explicit and measurable
Amorphous goal
A task with a goal that cannot be measurable
Goal (Quality)
Combined goal
A task with both concrete and amorphous goals
Document A task for which a document as a whole is judged Level
Segment A task for which a part or parts of a document are judged
Figure 2. Two tasks in Study 2
Table 3. Variable facet values for the search tasks
Task Product Goal (quality)
Naming Level
CPE Factual Specific Named Segment OBI Factual Amorphous Unnamed Document Four tasks were designed and used in this study, and each of the tasks was a combination of several facets. For the analysis in this paper, we selected two (Figure 2 and Table 3) from the four tasks to evaluate users’ difficulty ratings.
!Copy Editing (CPE) Your assignment: You are a copy editor at a newspaper and you have only 20 minutes to check the accuracy of the three underlined statements in the excerpt of a piece of news story below. New South Korean President Lee Myung-bak takes office Lee Myung-bak is the 10th man to serve as South Korea’s president and the first to come from a business background. He won a landslide victory in last December’s election. He pledged to make economy his top priority during the campaign. Lee promised to achieve 7% annual economic growth, double the country’s per capita income to US$4,000 over a decade and lift the country to one of the topic seven economies in the world. Lee, 66, also called for a stronger alliance with top ally Washington and implored North Korea to forgo its nuclear ambitions and open up to the outside world, promising a better future for the impoverished nation. Lee said he would launch massive investment and aid projects in the North to increase its per captia income to US$3,000 within a decade “once North Korea abandons its nuclear program and chooses the path to openness.”
Your task: Please find and save an authoritative page that either confirms or disconfirms each statement.
Advance Obituary (OBI) Your assignment: Many newspapers commonly write obituaries of important people years in advance, before they die, and in this assignment, you are asked to write an advance obituary for a famous person.
Your task: Please collect and save all the information you will need to write an advance obituary of the artist Trevor Malcolm Weeks.
!
The two tasks were selected for the following reasons. First,the two tasks have some common characteristics, whichmade them comparable. For example, both of these twotasks were "Factual" tasks since they required users toidentify factual information and did not require "Intellectual"information. In addition, both of these two tasks requiredusers to collect important information about a particularperson: ePE is about a Korean president and OBI is aboutan artist. Secondly, these two tasks were different in threeother facets: Goal (quality); Naming; Level of documentjudgment. The Level of document judgment was found toaffect users' dwell time spent on documents (Liu et al.,2010), but is less likely to affect the task's difficulty ingeneral. Nevertheless, it is reasonable to assume that theother two facets could influence the task difficulty. Forexample, a task with "Specific" goals and "Named" factmay provide a lot more specific information about theexpected information than another task with "Amorphous"goals and "Unnamed" fact, making it easier to accomplish.
ParticipantsThirty-two participants (26 female, 6 male) were recruitedfrom undergraduate JournalismlMedia Studies students(same school as in Study 1, but only a couple of themparticipated in both studies). They were between 18 and 27years old. They rated their computing and search skills highand reported an average search experience of 8.85 yearsusing a range of different browsers (IE, Firefox, Safari, et.).They were generally positive about their average successduring online search. As in Study 1, participants wereinformed in advance that their payment for participation inthe experiment would be $20.00, and that the 8 who savedthe best set of pages for all four tasks, as judged by anexternal expert, would receive an additional $20.00.
ProceduresParticipants came individually to a usability lab to take partin the experiment. Upon their arrival, they first completed abackground questionnaire about their demographicinformation and search experience. Each participant wasgiven a tutorial as a warm-up task and were then asked towork on 4 tasks, in the assigned order balanced for allparticipants. Participants were asked to search using IE 6.0on the computer in our lab and they were free to goanywhere on the Web to search for information and wereasked to continue the search until they had gathered enoughinformation to accomplish the task. In each task, they wereasked to save content pages that were useful for them toaccomplish the assignments, or delete saved pages thatwere found to be not useful later. When participantsdecided they found and saved enough information objectsfor purposes of the task, they were then asked to evaluatethe usefulness of the information objects they saved, orsaved and then deleted, through replaying the search usingthe screen capture program.
Before working on each task, participants were asked tocomplete a pre-task questionnaire about their familiaritywith the general task topic, previous experience with the
type of assignment, and the expected task difficulty. Afterthe task, participants were asked to complete a post-taskquestionnaire about their perceptions of the difficulty of thetask and their success in gathering information for the task.
Data collectionThis was the same as that in Study 1.
RESULTS
From Study 1
Difficulty comparison between the two tasksIn order to have an idea of the difficulty level of each of thetwo tasks, we first looked individually at the pre-task andpost-task difficulties of the two tasks and compared each ofthem between two tasks. The distribution of task difficultybeing not normal, the non-parametric Mann-Whitney U testwas used to compare the difficulty of the two general tasks.Results (Table 4) show no significant difference in users'ratings for the two tasks either before or after they workedon them. This was reasonable given that both tasks were inthe same domain, with the same general requirements.
Table 4. Pre- and post-task difficulty ratings in two tasksDifficulty Mean (standard deviation) Mann-
type DT PT Whitney U(P)Pre-task 2.83 (1.34) 2.58 (0.90) 61.5 (0.551)Post-task 2.92 (1.31) 2.08 (0.90) 43.5 (0.101)
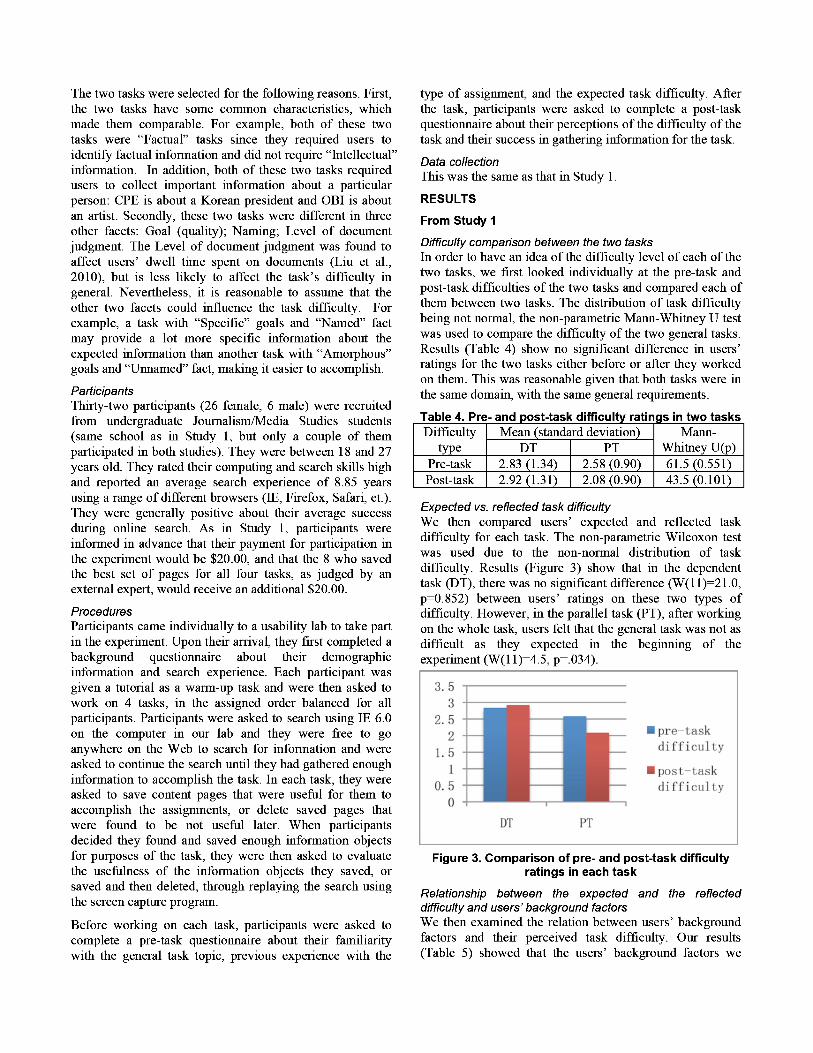
Expected vs. reflected task difficultyWe then compared users' expected and reflected taskdifficulty for each task. The non-parametric Wilcoxon testwas used due to the non-normal distribution of taskdifficulty. Results (Figure 3) show that in the dependenttask (DT), there was no significant difference (W(1l)=21.0,p=0.852) between users' ratings on these two types ofdifficulty. However, in the parallel task (PT), after workingon the whole task, users felt that the general task was not asdifficult as they expected in the beginning of theexperiment (W(II)=4.5, p=.034).
Figure 3. Comparison of pre- and post-task difficultyratings in each task
Relationship between the expected and the reflecteddifficulty and users' background factorsWe then examined the relation between users' backgroundfactors and their perceived task difficulty. Our results(Table 5) showed that the users' background factors we

investigated showed significant correlation with users’ perception of task difficulty only on a few occasions, and in these cases, the patterns for the different tasks were different. Pre-task difficulty was found to be correlated only with the perceived successfulness in gathering information, and since the later was elicited post-task, it was not likely to affect users’ expected difficulty before the task. Post-task difficulty had a negative correlation with pre-task topic familiarity only in the parallel task, and it has a positive correlation with previous experience with the type of task only in the dependent variable.
Table 5. Pearson correlation between task difficulty and other factors
Pre-task difficulty Post-task difficulty DT PT DT PT Pre-task topic
familiarity -.21 (.51)
-.51 (.087)
-.11 (.74)
-.68 (.015)
Previous experience
-.23 (.48)
-.52 (.083)
.62 (.031)
-.27 (.405)
Post-task topic familiarity
-.12 (.72)
-.16 (.61)
.03 (.93)
-.31 (.335)
Successful in gathering
information
-.61 (.034)
-.42 (.17)
.58 (.051)
-.20 (.534)
Task accomplishment
-.66 (.020)
-.29 (.36)
-.53 (.08)
-.10 (.77)
Relationship between the perceived task difficulty change and users’ background factors We then compared the change of users’ perceived task difficulty, i.e., the differences between the post-task and the pre-task difficulty ratings. In each task, users were categorized into groups according to their changes in post-task difficulty being greater/equal/less than their pre-task difficulty. The three groups of users were compared in aspects of their pre-task topic familiarity, previous experience.
Table 6. Dependent task: Comparison of background factors among three groups
Post< pre
Post = pre
Post > pre
Kruskal-Wallis H (p)
N 5 3 4 12 Pre-task topic
familiarity (mean (SD)) 2.20
(1.30) 3.00
(1.00) 2.00
(0.82) 1.593 (.451)
Previous experience (mean (SD))
3.20 (1.48)
2.33 (1.16)
4.75 (0.96)
5.582 (.061)
Post-task topic familiarity (mean(SD))
4.00 (0)
4.33 (0.58)
4.25 (0.50)
1.650 (.438)
Successful in gathering information (mean(SD))
4.80 (0.45)
6.33 (0.58)
5.00 (1.41)
5.705 (.058)
Task accomplishment (mean(SD))
4.60 (0.89)
6.67 (0.58)
5.00 (1.41)
5.509 (.064)
Knowledge gain 5.40 (0.89)
6.33 (0.58)
5.75 (0.96)
2.716 (.257)
Table 7. Parallel task: Comparison of background factors among three groups
Post< pre
Post=pre
Post> pre
Kruskal-Wallis H(p)
N 7 4 1 12 Pre-task topic familiarity
(mean (SD)) 3.43
(1.62) 3.00
(2.45) 2.00 (na)*
.594 (.743)
Previous experience (mean (SD))
2.71 (1.60)
3.75 (1.71)
4.00 (na)*
1.226 (.542)
Post-task topic familiarity (mean(SD))
4.57 (1.62)
4.00 (1.41)
4.00 (na)*
.565 (.754)
Successful in gathering information (mean(SD))
5.00 (1.41)
5.50 (0.58)
6.00 (na)*
1.342 (.511)
Task accomplishment (mean(SD))
4.71 (1.25)
5.50 (0.58)
5.00 (na)*
2.266 (.322)
Knowledge gain 5.29 (1.11)
5.25 (0.50)
7.00 (na)*
2.309 (.315)
* N=1 in this group, so its standard deviation was not computed. In summary of the effect of user background on task difficulty, our investigations of the relations between user background factors and perceived task difficulty (both the expected and the reflected) detected significant correlations in only few cases (Table 5), and our investigation of relations between user background factors and perceived difficulty change (Tables 6 & 7) found that the examined background variables did not show any significant differences among user groups whose perceived task difficulty was reduced, unchanged, and increased. Together, these results indicate that the examined user background variables were not important factors influencing users’ perceived task difficulty and task difficulty change. Since task structure is the only main difference between the two tasks, it seems fairly safe to say that this task feature affected users’ perceived difficulty change.
From Study 2
Difficulty comparison between CPE and OBI Similar to Study 1, we first looked individually at the pre-task and post-task difficulties of CPE and OBI, and compared each of them between the two tasks. Since the distributions of these two measures in the dataset were not normally distributed, independent 2-group Mann-Whitney U Test was used to compare the difficulty of the two tasks.
Table 8. Comparison of pre- and post-task difficulty ratings between the two tasks
Mean (standard deviation) Difficulty type CPE OBI
Man-Whitney U(p)
Pre-task 3.13(1.43) 3.25(1.27) 485.5(0.72)
Post-task 2.31(1.28) 5.25(1.37) 78(<.001)
Results (Table 8) show no significant difference in user ratings for the two tasks before they worked on the tasks, while OBI was rated to be significantly more difficult than CPE after users worked on it (U(31)=78, p<.001). In other

words, the two tasks were rated at the similar difficulty level before task, but OBI was rated to be more difficult than CPE after task completion.
Expected vs. reflected task difficulty in each task It is necessary to assess why the two tasks with similar pre-task difficulty showed significant difference after users worked on them. In this part, we compared the difference between the expected (pre-task) and the reflected (post-task) difficulty in each task.
Figure 4. Comparison of pre- and post-task difficulty
ratings in each task
Dependent 2-group Wilcoxon Signed Rank Test was used to compare the pre-task difficulty with post-task difficulty in the two tasks. Results (Figure 4) show that in CPE, the post-task difficulty was significantly lower than the pre-task difficulty (W(31)=228, p=.02); while in OBI, the post-task difficulty was significantly higher than the pre-task difficulty (W(31)=26, p<0.001).
The relationship between task difficulty and users’ background factors The above results showed that users rated CPE and OBI at similar difficulty level before searching, but after working on them, users found the task was actually much easier than they expected in CPE, but the task was actually much more difficult than they expected in OBI. Again we examined the relationship between task difficulty and other users’ background factors.
The correlation analysis (Table 9) showed that users’ pre-task difficulty ratings in both CPE and OBI were significantly negatively related to their previous experience, but not significantly correlated with any other factors. In particular, the less previous experience the user had before searching, the more difficulty they expected for the searching task. On the other hand, in both tasks, users’ post-task difficulty rating was only significantly negatively related to their post-task success rating, and none of the other factors were significantly related. In particular, the higher the post-task difficulty, the less successful they felt about task accomplishment. These results are reasonable but they are not very helpful in explaining the difference in the difficulty rating change from pre-task to post-task in the two tasks.
Table 9. Pearson correlation between Pre-/ and post-task difficulty with other factors
Pre-task difficulty Post-task difficulty CPE OBI CPE OBI
Pre-task topic familiarity
-0.59 (0.56)
-1.97 (0.06)
0.41 (0.68)
0.91 (0.37)
Previous experience
2.97 (0.005)
3.46 (0.001)
0.10 (0.93)
0.23 (0.82)
Post-task difficulty
0.85 (0.40)
0.41 (0.69)
0.85 (0.40)
0.41 (0.69)
Successful in information gathering
0.08 (0.93)
0.34 (0.73)
4.41 (<0.001)
7.01 (<.001)
Relationship between the perceived task difficulty change and users’ background factors Then we compared the change in users’ perceived task difficulty, i.e., the differences between the post-task and the pre-task difficulty ratings. Like what was done in Study 1, in both CPE and OBI in Study 2, we had three groups of users according to whether their change in post-difficulty was higher/equal/lower than their pre-task difficulty, and we then compared users’ pre-task familiarity and previous experience among these three groups.
Table 10. CPE: Comparison of background factors among three groups Post<
pre Post=pre
Post> pre
Kruskal-Wallis H(p)
N 19 8 5 32 pre-task topic familiarity (mean(SD))
3.16 (2.11)
2.50 (1.51)
2.60 (2.61)
0.71 (0.70)
Previous experience (mean(SD))
3.26 (1.59)
3.25 (1.58)
4.20 (1.30)
1.54 (0.46)
Successful in gathering information (mean(SD))
6.37 (1.16)
6.38 (0.52)
5.20 (1.30)
4.82 (0.09)
Table 11. OBI: Comparison of background factors among three groups Post
< pre Post=pre
Post > pre
Kruskal-Wallis H(p)
N 3 4 25 32 pre-task topic familiarity (mean(SD))
2.33 (2.31)
3.00 (1.63)
2.44 (1.73)
0.73 (0.69)
Previous experience (mean(SD))
2.0 (1.00)
3.0 (1.83)
2.8 (1.73)
0.57 (0.75)
Successful in gathering information (mean(SD))
6.33 (0.58)
4.75 (0.50)
3.60 (1.58)
8.66 (0.01)
The Kruskal-Wallis tests results (Tables 10 and 11) show that there were no significant differences among these three groups in either CPE or OBI on their pre-task familiarity and previous experience. In the OBI task, the three groups were significantly different among each other on the successful rating in gathering information after searching. In particular, users whose reflected difficulty was higher than their expected difficulty had the lowest rating in their

success in gathering information, while users whose reflected difficulty was lower than their expected difficulty had the highest rating in their success in gathering information. Such results are reasonable but they do not help explain the difference of difficulty change between the two tasks.
Therefore, neither the pre-task familiarity nor previous experience had a significant effect on users’ difficulty ratings, pre-task difficulty, post-task difficulty or the change from pre- to post- difficulty ratings. Meanwhile, the characteristics of the tasks seem to be important factors that affected users’ perceived difficulty and the change in users’ difficulty rating before and after search. Even though the two tasks had similar pre-task difficulty ratings, the task with Specific goal and Named fact, CPE, was much easier than was expected, while the task with Amorphous goal and Unnamed fact, OBI, was much more difficult than was expected. In addition, from the experimenters’ observations of users’ search process during these two tasks, users had been taking much of their time in disambiguating the artist that the OBI task required them to search for, since there were multiple people with that name on the Web, and this artist was not as famous as the Korean President in the CPE task. Therefore, the results demonstrate that task features, including task facets and task topic ambiguity, were the most influential factors on post-task difficulty and the change of post-task difficulty with pre-task difficulty.
DISCUSSION Our results in the two different studies demonstrate similar patterns in some aspects, which are discussed below.
Expected difficulty vs. reflected difficulty Our results show that before and after working with a task, users’ perception of its difficulty does not always stay unchanged. Instead, the reflected difficulty could change dramatically, either increase (e.g., in OBI of study 2) or decrease (e.g., in the parallel task of study 1 and CPE of study 2), in comparison with the expected difficulty. These results demonstrate that the estimation of a task’s difficulty level before working with it is likely to be inaccurate, and the expected difficulty should not be used to assess the task’s real difficulty. This finding is reasonable considering that the pre-task estimation of task difficulty is based just upon one’s interpretation of how much cognitive effort will be needed to accomplish the task, given one’s background knowledge and understanding of the task and of task accomplishment at that moment. If the user does not have full comprehension of the task and its topic, without interacting with the search system and learning through searching for the information, the estimation could certainly be limited in accuracy.
The effect of user background on perceived task difficulty As Vakkari (1999) outlines, users’ prior knowledge relates to task complexity. Also as we speculate in our model (Figure 1), one may think that the perceived (pre- and/or post-) task difficulty is affected by one’s background, including the knowledge before and/or after working with
the task, previous experience with the type of task, satisfaction with information gathering, perception of task accomplishment, and so on. Surprisingly, our two studies showed that the perceived task difficulty is rarely correlated with the above-mentioned factors about the user’s background, whether the task’s actual difficulty level was high (e.g., OBI) or low (e.g., CPE, or tasks in study 1). This meant that in the examined task types, users’ perceived task difficulty is not affected by the examined user background factors. However, it will remain undecided if, and how, user’s background affects task difficulty perception until further exploration about other task types and more background factor(s) are investigated. Further studies could look at factors such as users’ knowledge about the search task domain (instead of the topic examined in this study), computer expertise, number of years in web searching, and confidence in web searching, etc.
The effect of user background on perceived task difficulty change Our results did not show evidence that user’s background variables as examined in our studies were influencing factors of the perceived difficulty change before and after working on a task. More surprisingly, the change in perceived task difficulty was not correlated with perceived knowledge change before and after the task, either. Further effort is needed to examine the relationship between perceived difficulty change and user’s background factors.
The effect of task features Although we studied only two tasks in each of our two studies, they were carefully designed along certain task type dimensions, and the two tasks in each study are comparable in the only task facet(s) that they differ. Our studies found that the three task facets (i.e., task Structure, the Quality of task Goal, and Naming) affected users’ perceived difficulty change. In particular, the parallel task structure may decrease users’ reflected task difficulty, as does the specific and named task (CPE), while on the other hand, the amorphous and unnamed task (OBI) may increase user’s reflected task difficulty. The finding that task type plays role in perceived task difficulty is in accord with Vakkari’s (1999) model, in that there is a connection between problem structure and task complexity. We believe using the faceted task classification method to characterize search task types can extend the generality of the result of our study. Future studies could examine other task facets for their effects on perceived task difficulty change.
Implications for system design Our findings have several implications for IR system design. First, the user’s perception of a task’s difficulty level could change along the way of searching for information to solve the task. In order for systems to be able to provide help to users when they have difficulty, systems should be able to monitor this change along users’ search process through observing users’ behaviors such as time spent on pages, number of queries issued (e.g., Aula, Khan, & Guan, 2010; Liu et al., 2010).

Second, systems could be designed to provide assistance for users in solving difficult tasks, not only by returning better results for queries and suggesting queries based on semantic meaning, but also by offering suggestions in their task solving strategies. For example, decomposing a task into several parallel sub-tasks rather than dependent sub-tasks could lead users to find the task less difficult; systems could make query suggestions that help the users to solve a general task through parallel sub-tasks. Also, trying to make users’ tasks more specific and unambiguous could possibly reduce users’ perception of task difficulty. In addition to suggesting queries or query terms that help reduce user queries’ ambiguity to get better (more relevant or useful) search results, systems could also improve their search result page display to make the results less ambiguous to the users, by ways such as grouping results of the same category together, etc. This could help the users more easily gain a better understanding of the search results, especially when they spread across various aspects.
Third, the above-mentioned change of the user’s perception of a task’s difficulty can be different in different task types. Therefore, it would help systems provide the right ways of assistance if they are able to detect users’ task type through monitoring users’ behaviors (e.g., Liu et al., 2010).
Limitations and future studies Our research has limitations in terms of the number of task types and tasks, and the non-naturalistic lab experiment itself. Despite these limitations, we believe our research made a crucial step toward understanding better about users, user search behaviors, and provides meaningful advice for IIR system design.
It has been mentioned above in our discussion that future studies could look at more task type facets and more user background factors in order to gain a more comprehensive understanding about the effects of task type and user background on users’ perception of task difficulty, as well as the perception changes before and after tasks. As Xie and Cool (2009) proposed, different types of tasks and different task requirements need different types of assistance. More studies are needed to help researchers understand more about the relationship between these factors in order to provide appropriate help for users.
CONCLUSION Task difficulty requires in-depth understanding in order to build systems that can help users when they have difficult tasks to solve. We conducted analyses of users’ ratings on the difficulty levels of several types of tasks in two studies. Our results of the two studies showed that user’s perceived task difficulty could change in different ways, or not change, before and after users worked on their tasks. Therefore, the estimate of a task’s difficulty level before working on it is likely to be inaccurate. Also, surprisingly, both studies showed that the expected and the reflected difficulty were rarely correlated with the users’ background, including pre-task topic familiarity, previous experience, post-task topic
familiarity, satisfaction with information gathering, and perception of task accomplishment and neither was the perceived difficulty change. In addition, it seems that the perceived difficulty change before and after users’ worked on the task is affected by task types. Our findings are helpful for IR system design in providing assistance to users and reducing their perceived task difficulty.
ACKNOWLEDGMENTS This research was sponsored by IMLS grant LG#06-07-0105-07. We thank the reviewers for their insightful comments.
REFERENCES Aula, A., Khan, R. & Guan, Z. (2010). How does search behavior
change as search becomes more difficult? Proceedings of CHI ‘10, 35-44.
Bell, D. & Ruthven, I. (2004). Searcher's sssessments of task complexity for Web searching. Advances in information retrieval. Proceedings of ECIR ‘04, 57-71.
Byström, K. (2002). Information and information sources in tasks of varying complexity. Journal of the American Society for Information Science and Technology, 53(7), 581-591.
Byström, K., & Järvelin, K. (1995). Task complexity affects information seeking and use. Information Processing and Management, 31(2), 191-213.
Cole, M. J., Zhang, X., Liu, J., Liu, C., Belkin, N. J., Bierig, R., and Gwizdka, J. (2010). Are self-assessments reliable indicators of topic knowledge? Proceedings of ASIS&T ‘10.
Gwizdka, J., Spence, I. (2006). What can searching behavior tell us about the difficulty of information tasks? A study of Web navigation. Proceedings of ASIS&T ‘06.
Ingwersen, P. & Järvelin, K. (2005). The turn: Integration of information seeking and retrieval in context. Springer-Verlag New York, Inc. Secaucus, NJ, USA.
Jansen, B. J. (2006). Using temporal patterns of interactions to design effective automated searching assistance systems. Communications of the ACM, 49(4), 72-74.
Kim, J. (2006). Task difficulty as a predictor and indicator of web searching interaction. Proceedings of CHI ‘06, 959-964.
Li, Y. & Belkin, N.J. (2008). A faceted approach to conceptualizing tasks in information seeking. Information Processing & Management, 44, 1822-1837.
Li, Y. & Belkin, N. J. (2010). An exploration of the relationships between work task and interactive information search behavior. Journal of the American Society for Information Science and Technology, 61(9), 1771-1789.
Liu, J., Gwizdka, J., Liu C., & Belkin, N.J. (2010). Predicting task difficulty for different task types. Proceedings of ASIS&T ‘10.
Liu, J., Cole, M.J., Liu, C., Bierig, R., Gwizdka, J., Belkin, N. J., Zhang, J., & Zhang, X. (2010). Search behaviors in different task types. Proceedings of JCDL ‘10, 69-78.
Varkkari, P. (1999). Task complexity, problem structure and information actions. Information Processing & Management, 35(6), 819-837.
Xie, I. & Cool, C. (2009). Understanding Help-Seeking within the context of searching digital libraries. Journal of the American Society for Information Science and Technology, 60(3), 477-494.