Embed Size (px)
Citation preview
QlikView Hardware Sizing II:Understanding QlikView Hardware
Sizing
Version 1.0 – DraftDate 15 Oct 2008 Author DEH, CFG, HBE
Contents
........................................................................................................................................................................... 1
.......................................................................................................................................................................... 2
Introduction ....................................................................................................................................................... 3
Perfect scaling on multi-processor, multi-core hardware ................................................................................ 4
The Impact of Best Practices on Hardware Sizing ............................................................................................. 5
Machine Characteristics that Impact QlikView Performance ........................................................................... 5
RAM ............................................................................................................................................................... 6
Processor ....................................................................................................................................................... 7
Hard Disk Space ............................................................................................................................................. 8
Hard Disk Speed ............................................................................................................................................ 8
Consumption of Hardware Resources in a QlikView Environment ............................................................... 9
Refreshing a document ............................................................................................................................... 13
End User Activity within the QlikView Document ....................................................................................... 14
Conclusions ...................................................................................................................................................... 15
Page 2 of 15
IntroductionThe objective of this paper is to explore the factors that impact hardware requirements for deploying QlikView to your users, together with its companion papers (QlikView Hardware Sizing III: Administering a QlikView Hardware Sizing Exercise and QlikView Hardware Sizing IV: QlikView Hardware Sizing Worksheet) it provides the knowledge of what impacts QlikView performance and details the steps necessary to perform a hardware sizing exercise to help answer questions such as:
• “Exactly how much of this specific dataset can I analyze on a server with these given characteristics?”
• “How many concurrent users will this specific the server serving this specific QlikView application support?”
• “If I want to support X number of users analyzing X amount of data from this specific dataset what type of server will I need?”
The goal of QlikView hardware sizing is to answer these questions and more. In short it is to guarantee the performance of a given QlikView installation by ensuring that adequate hardware resources are available to QlikView as required by the amount of data to be analyzed, the characteristics of the data to be analyzed, the type of analysis preformed and number of the users to be supported.
Page 3 of 15
Perfect scaling on multi-processor, multi-core hardwareQlikView is designed to make full use of the underlying server hardware and to make full use of the speed of memory which is 1000’s times faster than to run against a hard disk. The combination of fast processors and access to large memory space is a very important ingredient which underpins QlikView’s performance.
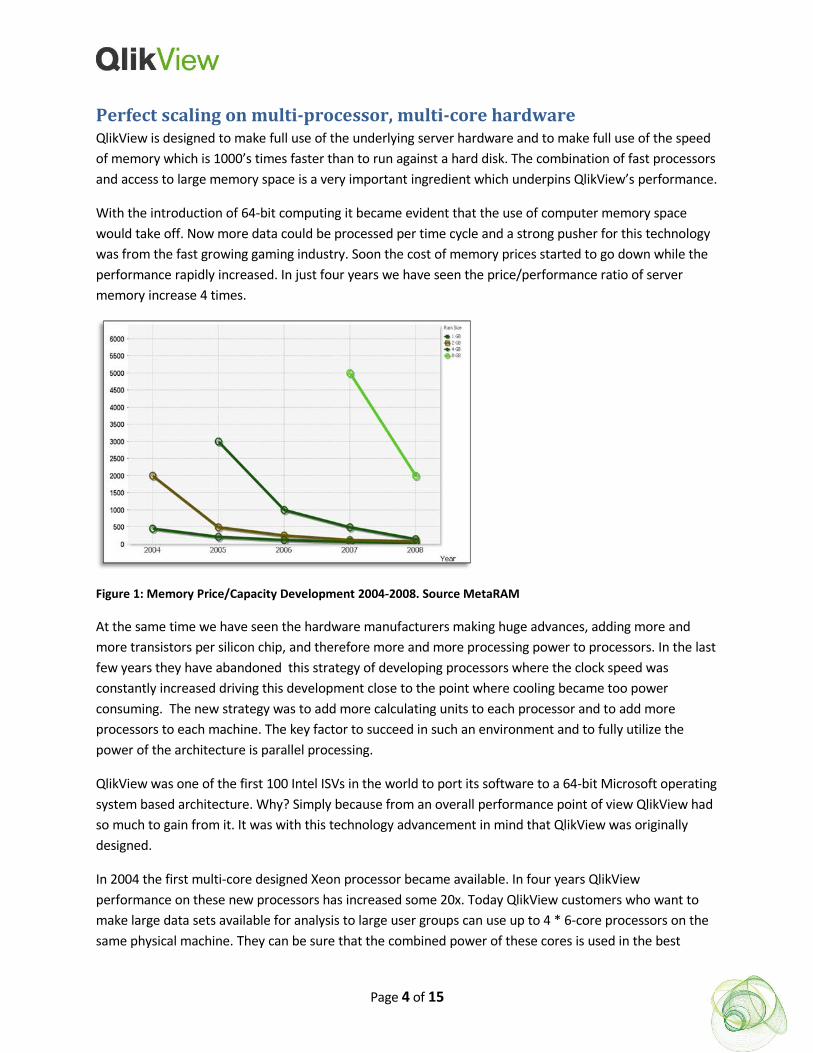
With the introduction of 64-bit computing it became evident that the use of computer memory space would take off. Now more data could be processed per time cycle and a strong pusher for this technology was from the fast growing gaming industry. Soon the cost of memory prices started to go down while the performance rapidly increased. In just four years we have seen the price/performance ratio of server memory increase 4 times.
Figure 1: Memory Price/Capacity Development 2004-2008. Source MetaRAM
At the same time we have seen the hardware manufacturers making huge advances, adding more and more transistors per silicon chip, and therefore more and more processing power to processors. In the last few years they have abandoned this strategy of developing processors where the clock speed was constantly increased driving this development close to the point where cooling became too power consuming. The new strategy was to add more calculating units to each processor and to add more processors to each machine. The key factor to succeed in such an environment and to fully utilize the power of the architecture is parallel processing.
QlikView was one of the first 100 Intel ISVs in the world to port its software to a 64-bit Microsoft operating system based architecture. Why? Simply because from an overall performance point of view QlikView had so much to gain from it. It was with this technology advancement in mind that QlikView was originally designed.
In 2004 the first multi-core designed Xeon processor became available. In four years QlikView performance on these new processors has increased some 20x. Today QlikView customers who want to make large data sets available for analysis to large user groups can use up to 4 * 6-core processors on the same physical machine. They can be sure that the combined power of these cores is used in the best
Page 4 of 15
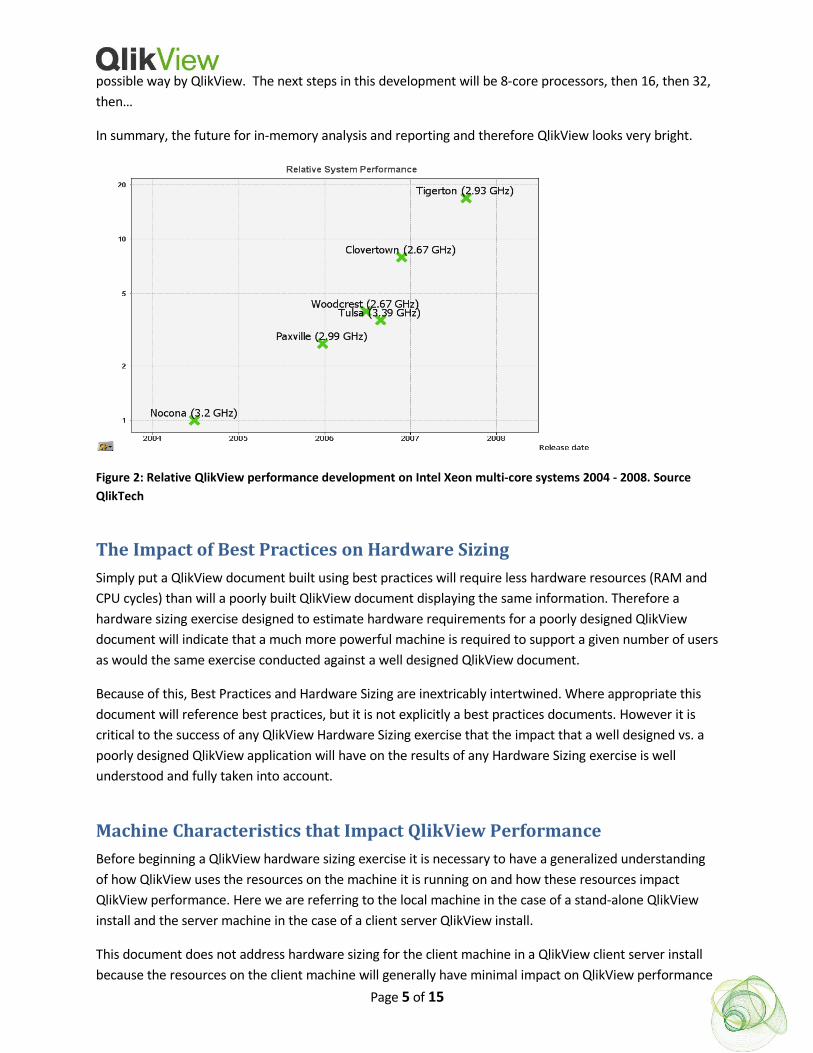
possible way by QlikView. The next steps in this development will be 8-core processors, then 16, then 32, then…
In summary, the future for in-memory analysis and reporting and therefore QlikView looks very bright.
Figure 2: Relative QlikView performance development on Intel Xeon multi-core systems 2004 - 2008. Source QlikTech
The Impact of Best Practices on Hardware SizingSimply put a QlikView document built using best practices will require less hardware resources (RAM and CPU cycles) than will a poorly built QlikView document displaying the same information. Therefore a hardware sizing exercise designed to estimate hardware requirements for a poorly designed QlikView document will indicate that a much more powerful machine is required to support a given number of users as would the same exercise conducted against a well designed QlikView document.
Because of this, Best Practices and Hardware Sizing are inextricably intertwined. Where appropriate this document will reference best practices, but it is not explicitly a best practices documents. However it is critical to the success of any QlikView Hardware Sizing exercise that the impact that a well designed vs. a poorly designed QlikView application will have on the results of any Hardware Sizing exercise is well understood and fully taken into account.
Machine Characteristics that Impact QlikView PerformanceBefore beginning a QlikView hardware sizing exercise it is necessary to have a generalized understanding of how QlikView uses the resources on the machine it is running on and how these resources impact QlikView performance. Here we are referring to the local machine in the case of a stand-alone QlikView install and the server machine in the case of a client server QlikView install.
This document does not address hardware sizing for the client machine in a QlikView client server install because the resources on the client machine will generally have minimal impact on QlikView performance
Page 5 of 15
in a client server configuration. For client hardware sizing please see the minimum hardware requirements for clients in the QlikView Server Reference Manual.
RAM
Main memory RAM is the primary storage location for all data to be analyzed by QlikView.
How QlikView uses RAM
QlikView uses RAM to store the unaggregated dataset to be analyzed as well as the aggregated data and session state for each user viewing a QlikView document.
QlikView is a snapshot based technology. The snapshot is refreshed through a process known as reloading a QlikView document. When a QlikView document is reloaded QlikView will establish connectivity to the datasource (or datasources) to be analyzed and extract all the unaggregated granular data from the data source and then compresses this data as described below. The unaggregated compressed dataset is then saved off for persistent storage as a .QVW file.
At the beginning of an analytic session QlikView will load a QlikView document from persistent disk based storage (i.e. a QVW file from hard disk) and place the entire dataset into RAM. During an analytic session QlikView will not make a call out to the database or access any other disk based data repository. It will only rely on the dataset present in RAM. This is what gives QlikView the unlimited flexibility and near instantaneous response times (all data is aggregated right there in RAM). But, of course, to take advantage of the benefits QlikView provides all data to be analyzed must fit in RAM.
Impact of too little RAM available
Like all Microsoft Windows applications QlikView is dependent on Windows to allocate RAM for QlikView to use. QlikView Server will attempt to reserve RAM when it starts based on the ‘Working Set Limits’ set in the QlikView Server Management Console. If at any time RAM becomes scarce Windows may, at its discretion, swap some of QlikView’s memory from physical RAM to Virtual Memory (i.e. use the hard disk based cache to in place of RAM).
When QlikView is allocated Virtual Memory it will be many orders of magnitude slower than when using 100% RAM. This is always an undesirable condition in QlikView and at best will provide an extremely slow experience for the end users and will often be perceived as an error condition by end users.
At some point, if memory usage increases, even the hard disk space allocated for caching virtual memory will run out and eventually QlikView will encounter a true ‘out of memory’ error.
It is critical to realize that the process described above holds true for every Windows based application and is not unique to QlikView. When planning to deploy IIS as a web server or Oracle as a database platform the exact same hardware sizing process must be undergone to ensure the desired performance. If you provision an Oracle database on a machine with too little physical RAM and then run too many queries against too much data, the exact same issues will arise (i.e. dramatic slowdown when using virtual memory follow eventually by an out of memory error). The same would be true of IIS supporting too many web connections running too much server based active content.
Page 6 of 15
In this respect hardware sizing is nothing new at all in some respect must be conducted for every machine (laptop, desktop or server) provisioned across the entire enterprise. But because with QlikView the amount of RAM available will dictate the amount of data that can be analyzed (and thus ultimately the value of the QlikView solution) the hardware sizing process is typically one of the first activities in a QlikView deployment, but is certainly no more important than hardware sizing for any other Window’s based software application.
Processor
QlikView leverages the processor to dynamically create aggregations as needed in real time resulting in a fast, flexible, and intuitive experience for end users.
How QlikView uses the Processor
It is important to realize that the data stored in RAM is the unaggregated granular data. Typically no preaggregation is preformed in the data reloading / script execution process. When the user interface requires aggregates (e.g. to show a chart object or to recalculate after a selection is made) the aggregation is done in real time. This requires processing power from the CPU.
Impact of not enough processing power
The primary symptom of a lack of CPU processing power is to wait for charts to recalculate. Under normal conditions chart recalculation take place (for all intents and purposes) instantaneously. However with truly massive datasets (hundreds of millions of records), and without a corresponding increase in processing power, the time to calculate charts can become noticeable.
It is testament to the game changing nature of QlikView’s in memory technology that it is possible to hear an end user complain about the six seconds it takes for QlikView to aggregate their 1,000,000,000+ (one billion+) record dataset when the same query run against a real time query tool or reporting tool would have taken hours if not days.
Nonetheless, if at any time QlikView performance is judged to slow it is addressed by adding processing power. Quite simply QlikView scales almost perfectly with the addition of more cores and more CPUs. If a given Query takes six seconds to run against a single core CPU (of a given speed), then the same query will take 3 seconds to run against a dual core CPU (of the same speed). 1.5 seconds against a quad core CPU. 0.75 seconds against two quad core CPUs, etc.
Page 7 of 15
Hard Disk Space
Hard Disk Space is rarely if ever a consideration when hardware sizing for QlikView.
How QlikView uses Hard Disk Space
QlikView does not use hard disk space when performing analysis (other than possibly using virtual memory which we want to avoid). QlikView files (.QVW) are written to disk for persistent storage but as they are highly compressed and designed to be loaded into RAM the hard drive space required is not terribly significant.
Impact of too little Hard Disk Space
Adequate disk space to persistently store all planned .QVW files should be provided for.
Hard Disk Speed
Hard Disk Speed will only come into play when loading a .QVW file from persistent storage on disk into RAM. As such it is a relatively minor hardware sizing topic when compared to RAM and Processing Power.
How QlikView uses Hard Disk Speed
Loading a .QVW file from persistent storage on disk into RAM only happens when an end user initiates an analytical session against that file and that file is not still in the cache on the QlikView server. QlikView provides several options for managing the document cache on the server so this is highly configurable.
Impact of Hard Disk Speed
When first requesting a file that is not already loaded on the server, there will be a small delay while the file is loaded from hard disk. This delay can range from unnoticeable for small files to several seconds or longer for very large files. This only happens once at the beginning of the analytical session and once the data is in RAM then the analysis proceeds without delay. Once this user is finished with this file it will typically stay cached in RAM (depending on how the caching settings are configured) so that there will be no delay for the next user.
Page 8 of 15
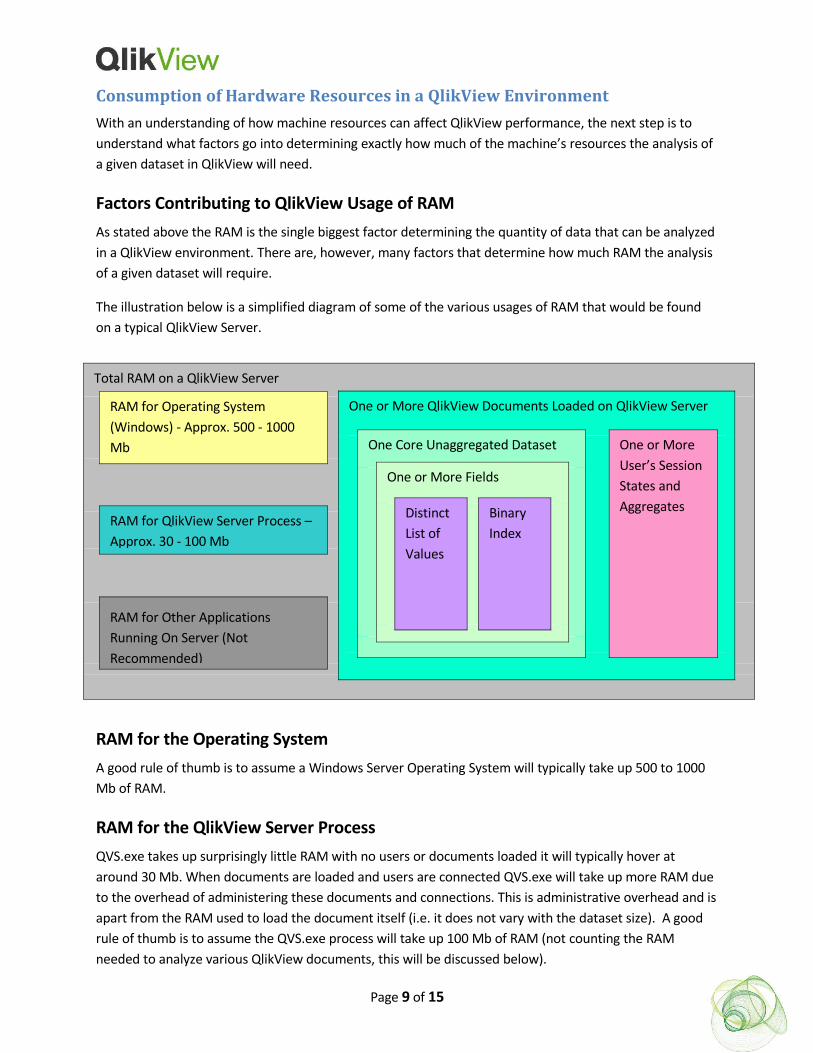
Consumption of Hardware Resources in a QlikView Environment
With an understanding of how machine resources can affect QlikView performance, the next step is to understand what factors go into determining exactly how much of the machine’s resources the analysis of a given dataset in QlikView will need.
Factors Contributing to QlikView Usage of RAM
As stated above the RAM is the single biggest factor determining the quantity of data that can be analyzed in a QlikView environment. There are, however, many factors that determine how much RAM the analysis of a given dataset will require.
The illustration below is a simplified diagram of some of the various usages of RAM that would be found on a typical QlikView Server.
RAM for the Operating System
A good rule of thumb is to assume a Windows Server Operating System will typically take up 500 to 1000 Mb of RAM.
RAM for the QlikView Server Process
QVS.exe takes up surprisingly little RAM with no users or documents loaded it will typically hover at around 30 Mb. When documents are loaded and users are connected QVS.exe will take up more RAM due to the overhead of administering these documents and connections. This is administrative overhead and is apart from the RAM used to load the document itself (i.e. it does not vary with the dataset size). A good rule of thumb is to assume the QVS.exe process will take up 100 Mb of RAM (not counting the RAM needed to analyze various QlikView documents, this will be discussed below).
Page 9 of 15
Total RAM on a QlikView Server
One or More QlikView Documents Loaded on QlikView Server
One Core Unaggregated Dataset
One or More Fields
Distinct List of Values
Binary Index
One or More User’s Session States and Aggregates
RAM for Operating System (Windows) - Approx. 500 - 1000 Mb
RAM for Other Applications Running On Server (Not Recommended)
RAM for QlikView Server Process – Approx. 30 - 100 Mb
RAM for Other Applications Running on the Server
Running other applications on the same box as the QlikView Server is never recommended. As a general rule the goal is to maximize the amount of RAM that will be available to analyze data in QlikView and running other applications on the same server is contrary to this goal.
One possible exception to this is the running of a web server (either QlikView’s HTTP server or Microsoft IIS) on the same machine as the QlikView server purely for convenience. In this scenario the web server should be tasked only with serving QlikView content and not be tasked with running intranet or external web content.
Loading the Core Unaggregated Dataset
The core unaggregated data set is extracted and compressed during the QlikView Reload Process. When a file is to be analyzed this core dataset must be loaded into RAM. This dataset is loaded a single time and is not duplicated for multiple users concurrently accessing and analyzing a single document.
It is important to note that it is the characteristics of the data as it is loaded into QlikView that is important not the characteristics of the data as it exists in the original source database. QlikView script offers an extremely robust ETL capability that can either increase or decrease the memory required depending on the characteristics of the final dataset produced by the ETL process and ultimately loaded into QlikView.
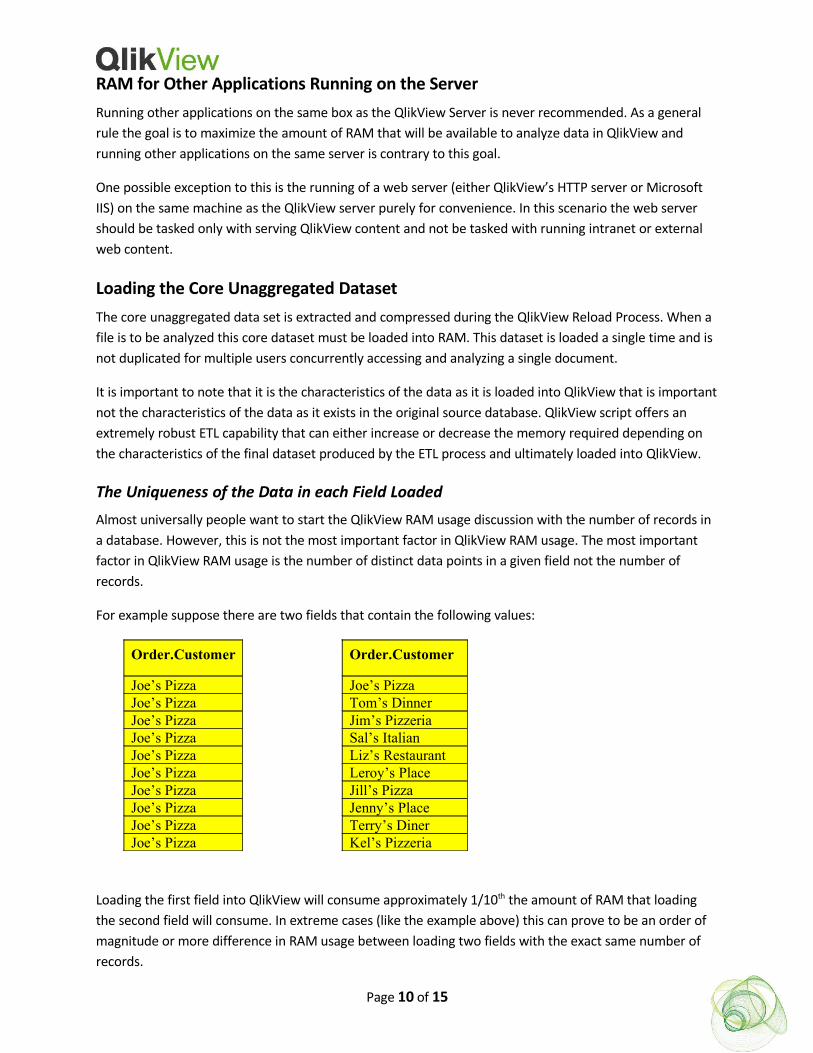
The Uniqueness of the Data in each Field Loaded
Almost universally people want to start the QlikView RAM usage discussion with the number of records in a database. However, this is not the most important factor in QlikView RAM usage. The most important factor in QlikView RAM usage is the number of distinct data points in a given field not the number of records.
For example suppose there are two fields that contain the following values:
Order.Customer Order.Customer
Joe’s Pizza Joe’s PizzaJoe’s Pizza Tom’s DinnerJoe’s Pizza Jim’s PizzeriaJoe’s Pizza Sal’s ItalianJoe’s Pizza Liz’s RestaurantJoe’s Pizza Leroy’s PlaceJoe’s Pizza Jill’s PizzaJoe’s Pizza Jenny’s PlaceJoe’s Pizza Terry’s DinerJoe’s Pizza Kel’s Pizzeria
Loading the first field into QlikView will consume approximately 1/10th the amount of RAM that loading the second field will consume. In extreme cases (like the example above) this can prove to be an order of magnitude or more difference in RAM usage between loading two fields with the exact same number of records.
Page 10 of 15
This pattern of RAM usage is due to the fact that when QlikView is compressing the data during the reload process QlikView stores the each distinct data point once only and does not store duplicate values.
The Length of Data in each Field Loaded
“Joe’s Pizza” will take up less RAM than will the text “This is a very, very, very long text field that will probably take up a fair amount of RAM to load into QlikView” will. This is done record by record. It does not matter if the Order.Customer field referenced in the example above is defined as a long text field (e.g. VARCHAR(200) or something similar) or short (VARCHAR(15) or similar), just enough space is used to load the actual text appearing in each individual record.
The Number of Records in each Field Loaded
Just storing distinct values as described above is not the whole story though. If QlikView is storing the distinct value only once it still must maintain the relationship back to the original instances. Looking at the first field in the example above, if QlikView stores “Joe’s Pizza” just once it still needs to store a reference back to the original ten records. This is done by means of storing a binary index for each field. Additional RAM is taken up to store this binary index. The more records in the field (regardless of uniqueness) the lager this index will be. The index is normally quite small but with large numbers of records and large numbers of fields and tables the effect can add up.
In reality there are several types of indexes used by QlikView (e.g. relating records within a table, relating two tables together, etc.) but for simplicity’s sake they are all being addressed together here. Regardless of the type of index the simple rule remains; the larger the number of records, the larger the indexes required to support analysis.
The number of Fields Loaded
Each fields being loaded will take up RAM as described above. All things being equal, it will take more RAM to load a dataset containing 400 fields than it will to load a dataset containing 4 fields.
The Number of Datasets Loaded
Each QlikView Document (.QVW file) represents a discrete dataset. Loading a document loads that document’s dataset into RAM. Concurrently analyzing multiple documents means concurrently loading multiple datasets into RAM.
The User Session States and Aggregates and UI Drawing
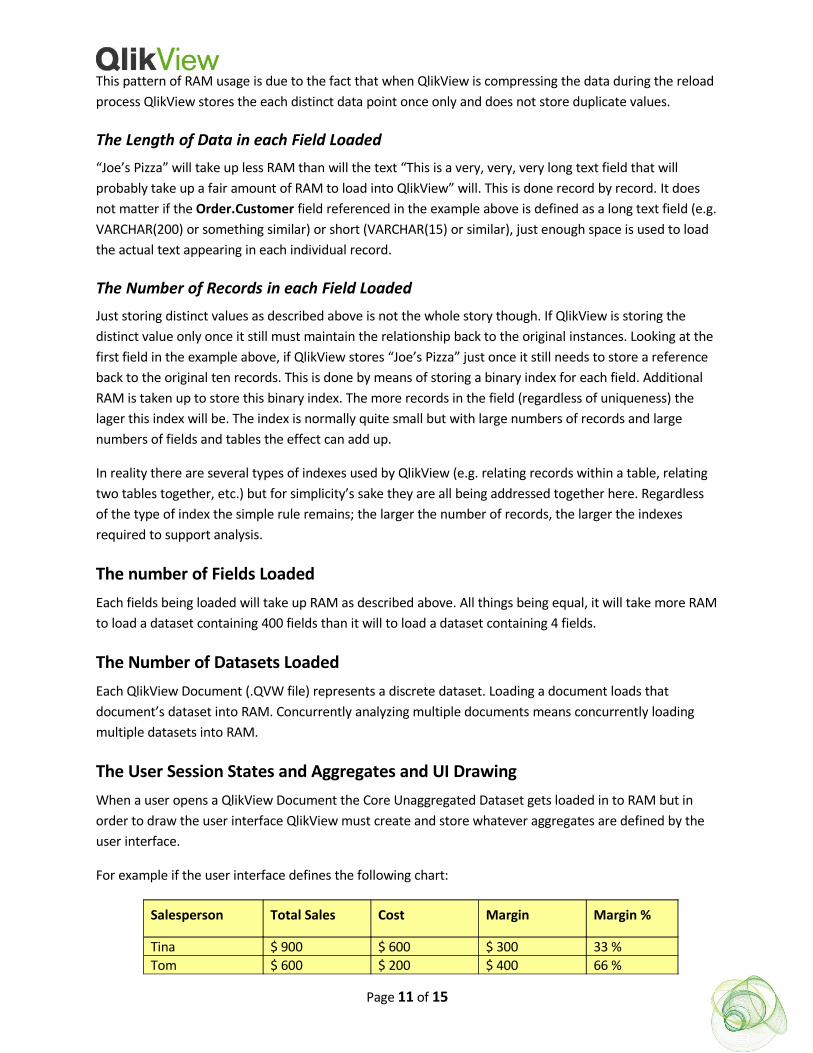
When a user opens a QlikView Document the Core Unaggregated Dataset gets loaded in to RAM but in order to draw the user interface QlikView must create and store whatever aggregates are defined by the user interface.
For example if the user interface defines the following chart:
Salesperson Total Sales Cost Margin Margin %
Tina $ 900 $ 600 $ 300 33 %Tom $ 600 $ 200 $ 400 66 %
Page 11 of 15
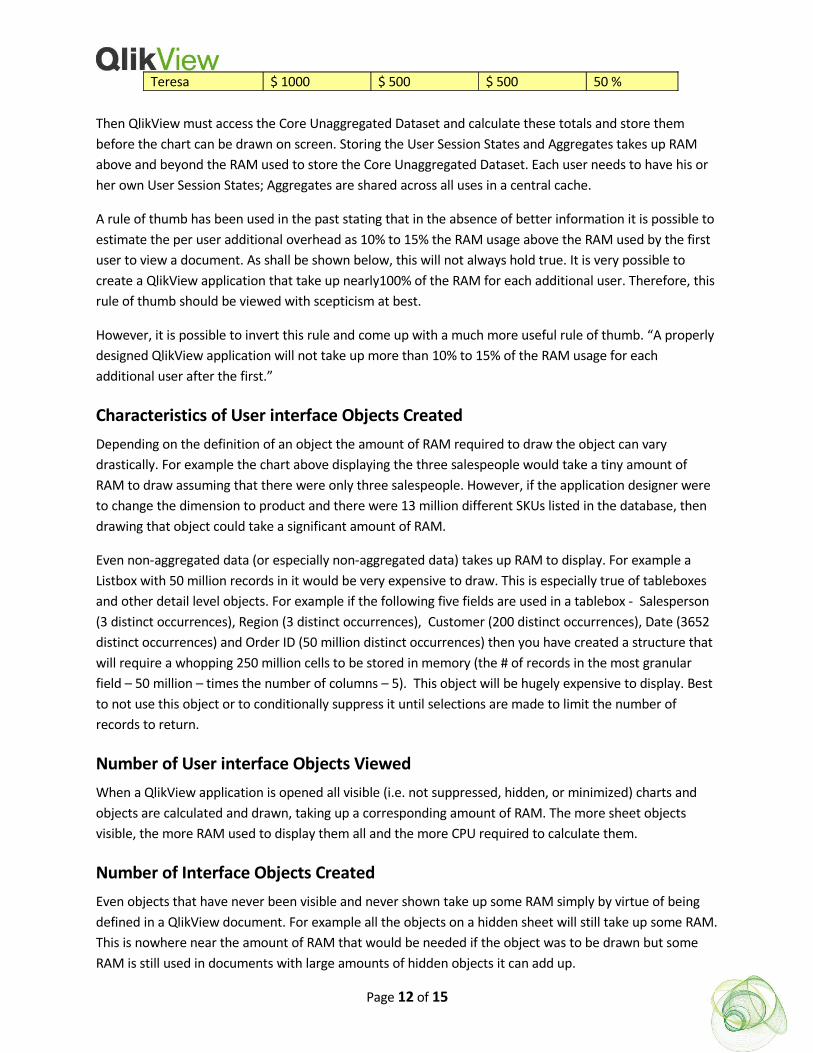
Teresa $ 1000 $ 500 $ 500 50 %
Then QlikView must access the Core Unaggregated Dataset and calculate these totals and store them before the chart can be drawn on screen. Storing the User Session States and Aggregates takes up RAM above and beyond the RAM used to store the Core Unaggregated Dataset. Each user needs to have his or her own User Session States; Aggregates are shared across all uses in a central cache.
A rule of thumb has been used in the past stating that in the absence of better information it is possible to estimate the per user additional overhead as 10% to 15% the RAM usage above the RAM used by the first user to view a document. As shall be shown below, this will not always hold true. It is very possible to create a QlikView application that take up nearly100% of the RAM for each additional user. Therefore, this rule of thumb should be viewed with scepticism at best.
However, it is possible to invert this rule and come up with a much more useful rule of thumb. “A properly designed QlikView application will not take up more than 10% to 15% of the RAM usage for each additional user after the first.”
Characteristics of User interface Objects Created
Depending on the definition of an object the amount of RAM required to draw the object can vary drastically. For example the chart above displaying the three salespeople would take a tiny amount of RAM to draw assuming that there were only three salespeople. However, if the application designer were to change the dimension to product and there were 13 million different SKUs listed in the database, then drawing that object could take a significant amount of RAM.
Even non-aggregated data (or especially non-aggregated data) takes up RAM to display. For example a Listbox with 50 million records in it would be very expensive to draw. This is especially true of tableboxes and other detail level objects. For example if the following five fields are used in a tablebox - Salesperson (3 distinct occurrences), Region (3 distinct occurrences), Customer (200 distinct occurrences), Date (3652 distinct occurrences) and Order ID (50 million distinct occurrences) then you have created a structure that will require a whopping 250 million cells to be stored in memory (the # of records in the most granular field – 50 million – times the number of columns – 5). This object will be hugely expensive to display. Best to not use this object or to conditionally suppress it until selections are made to limit the number of records to return.
Number of User interface Objects Viewed
When a QlikView application is opened all visible (i.e. not suppressed, hidden, or minimized) charts and objects are calculated and drawn, taking up a corresponding amount of RAM. The more sheet objects visible, the more RAM used to display them all and the more CPU required to calculate them.
Number of Interface Objects Created
Even objects that have never been visible and never shown take up some RAM simply by virtue of being defined in a QlikView document. For example all the objects on a hidden sheet will still take up some RAM. This is nowhere near the amount of RAM that would be needed if the object was to be drawn but some RAM is still used in documents with large amounts of hidden objects it can add up.
Page 12 of 15
Cached Aggregations
Once an object has been viewed the aggregates are cached in case they are needed again. This will improve performance for chart calculation time at the cost of RAM to cache this information. The caching of data is also done by selection state so that the representation of the same chart with different sets of selections is cached as different selections are made within the document. Unlike the RAM used to draw user interface objects, RAM used to store Cached aggregations can be shared between users so multiple users viewing the same charts in the same selection state can take advantage of the same cache.
Number of concurrent users viewing a single document
Because each user’s Session State and Aggregates (with the exception of cached aggregates described above) are stored on a per user basis and because each user’s screen is rendered individually, the more users that are concurrently analyzing a given document the more RAM will be needed on the QlikView Server. As stated above a good rule of thumb is that a well designed QlikView document will not require more than 10% to 15% more RAM to view for each user after the first. Of course there can be special circumstances where the user interface design will dictate a greater percentage but that decision should be known in advance and a conscious decision made to accept the trade-off in higher RAM usage required by the special requirements of that particular user interface design.
Refreshing a document
Refreshing a document on a QlikView server is a special case. The QlikView server itself is designed to do one thing and one thing only; provide client server connectivity supporting the analysis of a QlikView document. QVS.exe has no built in reload functionality. That job belongs to the QlikView Publisher product. When QlikView Publisher refreshes a document it does take up RAM but this is a process outside of QlikView Server and as such should fall into the category of RAM Usage by Applications Other Than QlikView Server- Never Recommended. In general the recommendation is to run QlikView Publisher on another machine separate from the QlikView Server.
That being said, for smaller installations where a document is only ever refreshed at night and there is a clear window of time at night when no users will be accessing the QlikView Server, then it is possible to run QlikView Publisher and Server on the same machine. It is simply a matter of knowing benefits and risks of this approach and making a conscious decision to accept the tradeoffs involved. A detailed study of the RAM required by QlikView Publisher to refresh a given document is beyond the scope of this document.
Note that QlikView Publisher Standard Edition can only be deployed on the same server a QlikView Server due to license constraints. In these circumstances consideration should be given to the resource impact of reloading QlikView applications.
Processor Usage
Aside from RAM the next most important physical characteristic of a machine hosting a QlikView server is the number and speed of the processors. As described above QlikView Server takes full advantage of all of the processors/cores available and scales very nearly linearly with the addition of new processors/cores.
Page 13 of 15
Expressions in the User Interface
All expressions defined in the user interface (as opposed to being defined in the script) are calculated in real time as the user is viewing the QlikView document. CPU cycles are needed to process these expressions. With Massive data volumes this can cause a noticeable delay when calculating the user interface.
Chart Object Expressions
Chart object expressions typically calculate over every record in the Core Unaggregated Dataset (or more correctly, over every record in the Core Unaggregated Dataset that is not currently excluded by the current selections in the QlikView Document). As such they can require a number of CPU cycles to compute. At normal data volumes these calculations happen so fast as to be unnoticeable but with truly massive datasets (hundreds of millions of rows) and/or with underpowered processors these calculations can take a noticeable amount of time to calculate.
Not all expressions are created equal when it comes to the horsepower required to calculate them. For example:
Sum(If ProductType = ‘O’ or ProductCategory = ‘X’,
If (CustomerType = ‘Retail’, RetailPrice, WholesalePrice),DiscountPrice))
)
Would be quite expensive to calculate in the user interface and with huge volumes of data could be slow. In this case one recommendation would be to pay the price during the script reload and create the calculated price in the script. In that case the expression in the user interface would simply be something like…
Sum(CalculatedPrice)
This would take much less processing power to calculate.
Other Expressions
While expressions inside of chart objects are the most common, QlikView offers the ability to use calculated expressions in many other places as well. Calculated chart and column names, calculated text in text objects, calculated sort orders, calculated colours in charts and many other expressions can all drain CPU cycles as they are calculated. It is in no way wrong to use these, and in many cases there is no noticeable time taken for these to calculate, but it is always important to keep in mind the potential cost of doing so especially when working against massive datasets.
End User Activity within the QlikView Document
What exactly an end user is doing within a document directly affects the overall CPU usage. If a user opens a document and makes one click per five minutes the CPU usage profile will look drastically different than if the same user opened the document and executed one click every five seconds. (One click per five
Page 14 of 15
seconds is an unreasonably high number. A more accurate click profile might be two to five clicks a few second apart followed by one or more minutes of inactivity, repeating this sequence multiple times to simulate a user session).
Number of end users concurrently viewing documents
Of course the number of users concurrently analyzing a QlikView document will drive the number of clicks up and therefore create a correspondingly higher level of CPU activity.
ConclusionsIt should be apparent from the above discussion that no single simple formula exists to definitively answer QlikView Hardware Sizing questions. It should be equally apparent why that should be so. While in theory it would be possible to come up with various formulae and estimations to take into account all of the above criteria it would be a long, laborious and error prone process and the end result would be a wild approximation at best.
Well, then where does that leave an individual responsible for QlikView Hardware Sizing?
Luckily there is a simple and elegant answer to this question – empirical testing. In a fraction of the time, it is possible to determine (or very nearly where test result extrapolation is employed) the hardware sizing requirements of any given QlikView document.
The steps for setting up and administering a successful QlikView Hardware Sizing test are detailed in a separate companion document to this one.
Page 15 of 15