Embed Size (px)
Citation preview

Understanding Pre-Diabetes: Its Diagnosis, Management & Cardiovascular Risk Implication
Yehuda Handelsman, MD, FACP, FACE, FNLAMedical Director & Principal Investigator
Metabolic Institute of America
Amway Grand Plaza Hotel, Grand Rapids, MI, Saturday, 10/6/12 Yehuda Handelsman, M.D., F.A.C.P., F.A.C.E., F.N.L.A
Michigan AACE Annual Meeting October 5-7, 2012
Yehuda Handelsman, MD, FACP, FACE, FNLA
Medical Director & Principal investigator
Metabolic Institute of America
IP-President
American Association of Clinical Endocrinologists
Program Chair & Director
10 World Congress on Insulin Resistance Diabetes & CVDNovember 1-3, 2012, Los Angeles, CA
Solo practice
Endocrinology, Diabetes & Metabolism
Tarzana, California

Handelsman DisclosuresSpeaker’s Bureau- Amylin, Astra Zeneca, BI, BMS, DSI, GSK, Novo-
Nordisk, Santarus
Consultant - Amylin, Amarin, DSI, Gilead, Halozyme, liposcience, Merck, Novo-Nordisk, Sanofi, ResMed, Santarus
Research grant- BI, DSI, Conjuchem, GSK, Lexicon, Merck, Novo Nordisk, Sanofi, Takeda, Xoma, Tolrex
IP-President- American Association of Clinical Endocrinologists
Associate Editor- Journal of Diabetes
Dr Handelsman & his immediate family do not have ownership interest & or stocks of any Pharmaceutical or device company.
Should this lecture include investigational products and non approved FDA treatments & medications’ indication, it would be identified appropriately.

Ht 5’8”, Wt 212 lb
• BMI 32.5
• Triglycerides 166
• HDL-C (mg/dL) 38
• LDL-C 127
• BP 133/≥87
• A1C 5.9
• Fasting glucose 98
• 2hr post 75gr glu 148
Dean 42 y o male, Married 2 kids, systems Analyst. Mother- HTN, DM 2,
Father- CVD
Comment: No individual component is recommended for treatment

Source: Behavioral Risk Factor Surveillance System, CDC.
2000
Obesity Trends* Among U.S. AdultsBRFSS, 1990, 2000, 2010
(*BMI ≥≥≥≥30, or about 30 lbs. overweight for 5’4” person)
2010
1990
No Data <10% 10%–14% 15%–19% 20%–24% 25%–29% ≥30%
One in six United States youths is now overweight.
Mann CC. Science. 2005;307(5716):1716-1717.

Energy intake
Ingestion of:
Proteins
Fats
Carbohydrates
Energy expenditure
Physical activity
Diet-induced thermogenesis
Basal metabolic rate
Body weight
Increase Decrease
Energy Homeostasis

Average Weight (lbs) of 5’8” Men in
the United States From 1857-1991W
eig
ht
(lb
s)
Years
175
170
165
160
155
150
145
140
Centers for Disease Control and Prevention. MMWR Morb Mortal Wkly Rep. 2004;53(4):80-82. Copyright © 2004 United States Centers for Disease Control.
United States Trends in Caloric Intake: NHANES
0
500
1000
1500
2000
2500
3000
kc
als Men
Women

After a two year visit to the United States, Michelangelo’s David is returning to Italy<..
Statue Returns to Italy
His proud sponsors in the USA were:

Technology Progress and the Obesity Epidemic
Adapted from Badman MK, et al. Science. 2005;307(5717):1909-1914.
GI tract
Adipose tissue
Pancreatic islets
Hypothalamus
Hindbrain
CCK
Adiponectin
Insulin
Amylin
Leptin
OXM
Ghrelin
GLP-1
PYY3-36
GIPPP
ResistinVisfatin
Vagal afferents
Multi-Hormonal Control of Body Weight: Role Of Fat-, Gut-, and Islet-Derived Signals

Complex Regulation of Weight and Energy
Central signals
Inhibitalpha-MSH
CRH/UCN
GLP-1
CART
NE
5-HT
Food intakeGut and liver
Pancreas
Autonomicnervoussystem
Energy expenditure
Adipose tissue
Adapted from Campfield LA, et al. Science. 1998;280(5368):1383-1387. Porte D Jr, et al. Diabetologia. 1998;41(8):863-881.
Adrenal cortex
Energy balance
and adipose stores
Meal size
Adrenal steroids
Leptin
Amylin
insulin
External factorsFood availability,
Palatability
Adiponectin
• Ghrelin
• GLP-1
• CCK
• VagusAff
ere
nt
sig
nals
Effe
ren
t sig
nals
NPY
AGRP
galanin
endocanna
orexin-A
Ddynorphin
Stimulate
Overweight
Data are from 1 million men and women (average age, 57 years) followed for 16 years who never smoked and had no history of disease at enrollment.
Normal Weight Obese
Rela
tive R
isk o
f C
ard
iovascula
r D
isease M
ort
alit
y
0.6
3.0
2.62.21.81.41.0
>18 25 30 >40
BMI, kg/m2
Women
Men
Adapted from Calle EE, et al. N Engl J Med. 1999;341:1097-1105.
Overweight and Obesity Increase the Risk of Cardiovascular Disease Mortality

Pulmonary disease
abnormal function
obstructive sleep apnea
hypoventilation syndromeNonalcoholic fatty liver disease
steatosis
steatohepatitis
cirrhosis
Coronary heart disease
Diabetes
Dyslipidemia
Hypertension
Gynecologic abnormalities
abnormal menses
infertility
polycystic ovarian syndromeOsteoarthritis
Skin
Gall bladder diseaseCancer
breast, uterus, cervix
colon, esophagus, pancreas
kidney, prostate
Phlebitis
venous stasisGout
Idiopathic intracranial hypertension
Stroke
Cataracts
Severe pancreatitis
Medical Complications of Obesity
Reaven, 1988
− Several risk factors (eg. dyslipidemia, hypertension, and hyperglycemia) commonly clustered together
− Clustering of risk factors was called Syndrome X
− Recognized Syndrome X as a risk factor for cardiovascular disease
− Postulated that the underlying pathophysiologic mechanism was insulin resistance
Syndrome X

Reaven, 2005Definition and Dietary Approaches to Treatment
Although the majority of insulin-resistant individuals are able to maintain the level of compensatory hyperinsulinemia needed to prevent the development of a significant degree of hyperglycemia, the combination of insulin resistance and hyperinsulinemia greatly increases the likelihood of developing a cluster of closely related abnormalities and the resultant clinical diagnoses that can beconsidered to make up the insulin resistance syndrome
The Insulin Resistance Syndrome
NCEP ATP III/AHA 2001/2005
Metabolic Syndrome- Diagnosis: 3 of 5
Risk factor Defining level (AHA 2005)
• Abdominal obesity (in) Waist:
Men >40
Women >35
• Triglycerides (mg/dL) ≥150 (or Med)
• HDL-C (mg/dL)
Men <40 (or Med)
Women <50
• BP (mm Hg) ≥130/≥85 (or Med)
• Fasting glucose (mg/dL) ≥110 (100)NCEP ATP III. JAMA. 2001;285:2486-97. (Circulation September 2005)

Type 2 diabetes and glycemic disorders
Dyslipidemia
– Low HDL
– Small, dense LDL
– Hypertriglyceridemia
Hypertension
Endothelial dysfunction/inflammation (hsCRP)
Impaired thrombolysis
↑↑↑↑ PAI-1
Ath
ero
scle
rosis
Insulin
resistance
Glucotoxicity
Lipotoxicity
↓↓↓↓ Adiponectin
Courtesy of Selwyn AP, Weissman PN.
Clinical Manifestations of Insulin Resistance
Adiposetissue
↑ IL-6
↓ Adiponectin
↑ Leptin
↑ TNFα
↑ Adipsin(Complement D)
↑ Plasminogenactivator inhibitor-1
(PAI-1)
↑ Resistin
↑ FFA
↑ Insulin
↑ Angiotensinogen
↑ Lipoprotein lipase
↑ Lactate
Inflammation
Type2 diabetes
Hypertension
Atherogenicdyslipidemia
Thrombosis
Atherosclerosis
Lyon CJ, Law RE, Hsueh WA. Endocrinology 2003;144:2195-200.
Trayhurn P, Wood IS. Br J Nutr 2004;92:347-55.
Eckel RH, Grundy SM, Zimmet PZ. Lancet. 2005;365:1415-28.
Adverse Cardiometabolic Effects of Products
of Adipocytes
↑ CRP
0
CRP by No. of Metabolic Disorders(Dyslipidemia, Upper Body Adiposity, HTN, Insulin
Resistance): IRAS (Insulin Resist. Athero. Study)
Festa A et al. Circulation. 2000;102:42–47.
Number of Metabolic Disorders (Nondiabetic)
1 2 3 4
(Suggests increasing levels of CRP are feature of metabolic syndrome)
0.0
0.2
0.4
0.6
0.8
1.0
1.2
1.4
1.6
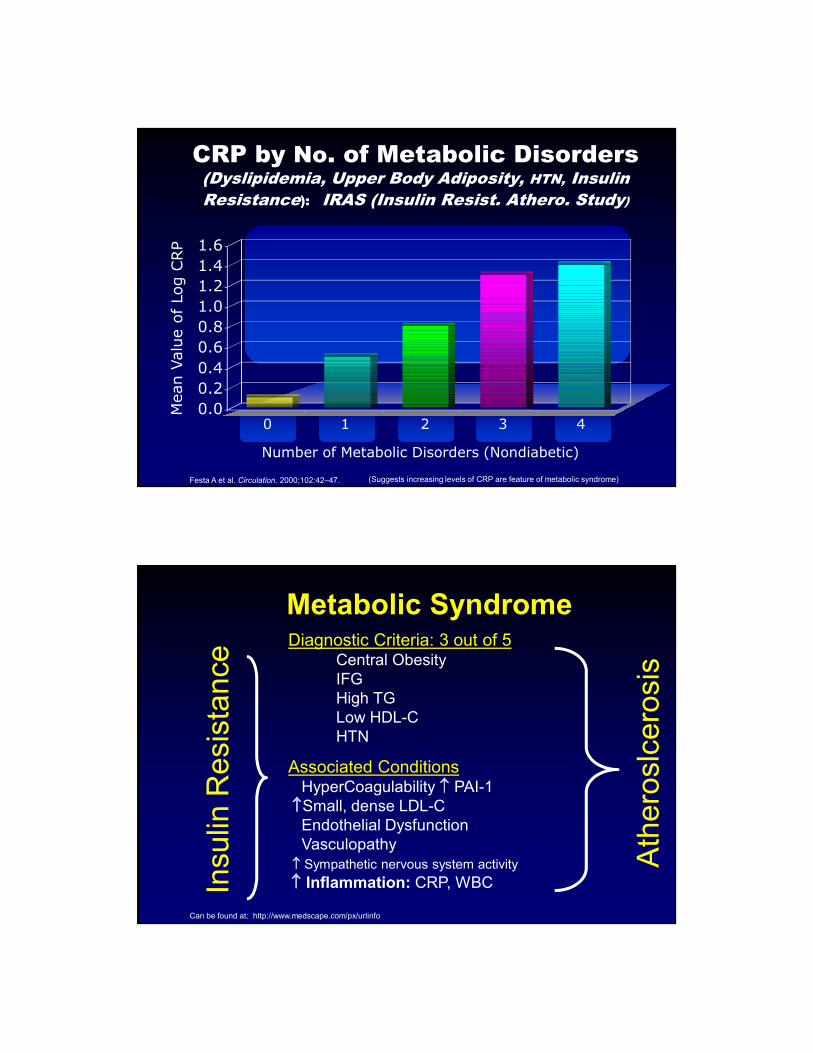
Diagnostic Criteria: 3 out of 5Central Obesity
IFG
High TG
Low HDL-C
HTN
Associated ConditionsHyperCoagulability ↑↑↑↑ PAI-1
↑↑↑↑Small, dense LDL-C
Endothelial Dysfunction
Vasculopathy
↑↑↑↑ Sympathetic nervous system activity
↑↑↑↑ Inflammation: CRP, WBCInsu
lin R
esis
tan
ce
Ath
ero
slc
ero
sis
Metabolic Syndrome
Can be found at: http://www.medscape.com/px/urlinfo

Central obesity
Sedentary lifestyle
↓↓↓↓ Physical activity
Increasing age
Genetic factorsFamily History
Population groups
Impaired glucosehomeostasis
Abnormal FFA,VLDL and HDLmetabolism+ visceral fat deposition
Abnormal vascularSMC, medial and endothelial function
Hemostaticabnormalities
Vascularinflammation
Impaired glucose toleranceIGT - IFG
High TGLow HDL
Atherosclerosis
Hypertension
Insulin Resistance
Insulin Resistance
Metabolic- Insulin Resistance- Syndrome
Diabetes
Stroke
PVD
CAD
NASH
PCOS
Hyperuricemia
Metabolic and Vascular
abnormalities
Metabolic and Vascular
abnormalities
Clinical
consequences
Clinical
consequences
Factors Contributing
to Insulin Resistance
Factors Contributing
to Insulin Resistance
Kendall DM and Harmel AP. Am J Manag Care 2002; 8:S635–S653.
Relation of Degree of Insulin Resistance to the Metabolic Syndrome
0
2
4
6
8
10
12
14
16
18
0 1 2 3 4 5
Number of Components of Metabolic Syndrome
HO
MA Insulin R
esis
tance Index
Solymoss et al. Am J Cardiol 2004;93:159-164

Clinical Syndromes Associated
with Insulin Resistance/Hyperinsulinemia
Pediatrics
Non Alcoholic Fatty Liver Disease (NAFLD/NASH)
Polycystic Ovarian Syndrome (PCOS)
Skin
Brain
Certain cancers
Sleep/breathing Disorders
Coagulation
Dyslipidemia
Essential Hypertension
Chronic Kidney Disease
Cardiovascular Disease
Congestive Heart Failure
Type 2 Diabetes mellitus
Insulin Resistance Sleep & BreatingDisturbances are Associated with • ↑ Obesity
• ↑ BP
• ↑ triglycerides, ↓ HDL
• ↑ inflammatory cytokines
• ↑ glucose intolerance
• Stimulation if the HPA axis (3,4)
• ↑ SNS activity (5, 6)3. Vgontzas, AN et al. Clin Endocrin. 51:205-215, 1999
4. Vgontzas, AN et al. JCEM. 86:1387-3794, 2001
5. Somers, VK et al..J Clin Invest. 96:1897-1904, 1995
6. Leunberger, U. j Applied Physiol. 79:581-588, 1995

Coronary Atherosclerosis In Youth Is Linked To Obesity and Insulin Resistance
Fatty StreaksMen: Age 15-24
BMI (kg/m2)
> 3025-30< 25
Raised LesionsMen: Age 15-24
0-2 2-4 4-6 6-8 8-10 10+
Adiposity Index Category HDL
mg/dL
Glycohemoglobin
%
Smoking prevalence
HTN prevalence
BMI, kg/m2 <25 55.0+0.8 6.4+0.03 47.9+1.8 12.6+0.9
25-30 53.1+1.1 6.6+0.05 41.3+2.5 11.3+1.2
>30 51.3+1.5 6.8+0.06 30.9+3.1 15.5+1.8
Adapted from: McGill Jr. et al. (PDAY) Circulation. 2002;105:2712-2718
Aortic Strips
Insulin resistance increases risk of chronic kidney disease (CKD)N = 6453 without diabetes
Odds ratio (highest vs
lowest quartiles*)
Chen J et al. J Am Soc Nephrol. 2003;14:469-77.
*Multivariate adjustedCKD = GFR <60 mL/min per 1.73 m2
HOMA-IR = Homeostasis model assessment of insulin resistance
P = 0.001
P = 0.008

Hypertension and Insulin Resistance
� Nondiabetic patients
(n=13, 47 y) with essential HTN (151/94
mm Hg) vs normotensive men (n=26)
matched for age and BMI
� Insulin sensitivity reduced, but output
increased
|
150
|
0
|
30
|
60
|
90
|
120
|
180
I I I I I I
T
T T TT
T
12—10.5—
9—7.5—6—
4.5—3—
-
--
--
--
--
--
-
Normotensives
Hypertensives
Glucose (mmol/L)
PA
I-1 A
ntigen (
ng/m
L)
35
30
25
20
15
10
5
0Normal glucose
tolerance
(n = 693)
Impaired glucose tolerance(n = 348)
Type 2
DM(n = 510)
Festa A et al. Arterioscler Thromb Vasc Biol. 1999;19:562-568.
Reproduced with permission from Lippincott, Williams and Wilkins.
PAI-1 Levels and Glucose Tolerance

The Dyslipidemia of Insulin Resistance
Elevated
TG
Small, dense
LDL-CLow HDL-C
CHD
Insulin Responses to a 75-g OGT in 100 Non-Diabetic Healthy, Normal, Subjects in Relation to LDL Phenotype Pattern [ A, Intermediate (AB) or B ]
Reaven GM et al.
J Clin Invest.
1993;92:141-146.
1000
800
600
400
00 30 60 90 120 150
200
Time (min)Pattern B Pattern AIntermediate (AB)
Small dense LDL (Pattern B Dyslipidemia) is
Strongly Associated with Insulin Resistance

Same LDL-C Levels, Different Cardiovascular Risk
Apo B
LDL= 130 mg/dLFewer Particles More Particles
Cholesterol
Ester
More Apo B
Otvos JD, et al. Am J Cardiol. 2002;90:22i-29i.
Correlates with:
TC 198 mg/dL
LDL-C 130 mg/dL
TG 90 mg/dL
HDL-C 50 mg/dL
Non–HDL-C 148 mg/dL
Correlates with:
TC 210 mg/dL
LDL-C 130 mg/dL
TG 250 mg/dL
HDL-C 30 mg/dL
Non–HDL-C 180 mg/dL
Increased insulin resistance is associated with
increased CVD risk: San Antonio Heart Study
Odds ratio for risk of CVD (95% CI)
Quintile 5
Quintile 4
Quintile 3
Quintile 2
0 1 2 3 4 5
HO
MA
IR
Qu
inti
les
Association between HOMA-IR and 8-year risk of CV outcomes (CV death, MI, CABG, CVA, angina) in 2600 subjects free of DM and CVD at baseline
Adapted from Hanley AJ, et al. Diabetes Care 2002; 25:1177–1184.
Quintile of HOMA-IR adjusted for age, sex, ethnicity, LDL, triglyceride, HDL, systolic blood pressure, smoking, alcohol consumption, leisure time exercise and waist circumference (median split) P (trend) = 0.0185

CHD Mortality
0 2 4 6 8 10 12
0
5
10
15
20
RR (95% CI), 3.77 (1.74-8.17)
Follow-up (y)
Cu
mu
lati
ve H
azard
(%
)
Yes
No
866
288
852
279
834
234
292
100
The Kuopio Ischemic Heart Disease
Prospective 1209 Finnish men, age 42 to 60 from 1984−1989
No. at Risk
Metabolic Syndrome
YesMetabolic Syndrome:
0 2 4 6 8 10 12
0
5
10
15
20
RR (95% CI), 3.55 (1.96-6.43)
Follow-up (y)
866
288
852
279
834
234
292
100
0 2 4 6 8 10 12
0
5
10
15
20
RR (95% CI), 2.43 (1.64-3.61)
Follow-up (y)
866
288
852
279
834
234
292
100
CVD Mortality All-Cause Mortality
Lakka HM et al. JAMA. 2002;288:2709-2716.
No
CI, confidence interval; RR, relative risk.
Risk for All-Cause Mortality and Glucose Control: A Continuum Not a Threshold
EPIC-Norfolk Study
0
1
2
3
4
5
6
7
<5 5–5.4 5.4–6.9 >7 Known DM
HbA1c (%)
Adapted from Khaw K-T et al. BMJ. 2001;322:1-6.
All-c
au
se
Mo
rta
lity
* (%
)
* Age-adjusted

Insulin resistance to diabetes: Coronary vasomotor abnormalities progressively worsen
Prior JO et al. Circulation. 2005;111:2291-8.
*vs baseline
†P < 0.05 vs insulin sensitive
Cold pressor test
Insulinsensitive
Insulinresistant
IGT
Diabetes +
Hypertension
–10
0
10
20
30
40
14 7
Diabetes
10
–2
44
∆
MBF* (%)
†
††
†
IGT and undiagnosed DM2 are common in acute MI and stroke
Norhammar A et al. Lancet. 2002;359:2140-4.Matz K et al. Diabetes Care. 2006;792-7.
2-hour OGTT
66
39
(n = 181) (n = 238)
Myocardial infarction Stroke
IGT Undiagnosed DM2
Only 20% of stroke and 34% of MI patients had normal glucose levels.

MANAGEMENT
Ht 5’8”, Wt 212 lb
• BMI 32.5
• Triglycerides 166
• HDL-C (mg/dL) 38
• LDL-C 127
• BP 133/≥87
• A1C 5.9
• Fasting glucose 98
• 2hr post 75gr glu 148
Dean 42 y o male, Married 2 kids, systems Analyst. Mother- HTN, DM 2,
Father- CVD
Comment: No individual component is recommended for treatment

< 25 Lifestyle/Meds
< 100 mg/dL 1st * Statins
< 150 mg/dL 2nd * Fibrates
> 40 mg/dL 2nd * Niacin> 50 mg/dL Fibrates
< 130/85 mmHg TLM/ACE/ARB
< 100 mg/dL } TLM/meds
< 140 mg/dL } TLM/meds
Goals TreatmentParameters
BMI
LDL
TGs
HDL-CMenWomen
BP
FG
PP glucose
Metabolic Syndrome Goals & Treatment of Components
NCEP ATP III. JAMA. 2001;285:2486-2497.
*Treatment. of dyslipidemia: LDL-C is primary goal; may treat secondary goals (ie, TG, HDL-C).
ARB, angiotensin receptor blocker; ACE, angiotensin converting enzyme;
Therapeutic Lifestyle Modification (TLM); TZD, thiazolidinedione.
Goals TreatmentParameters
Dean : Obesity
BMI : 32.5
Treatment : NoneConsider : Lifestyle & Intervention
Medications

*Years 0/1/2 : Significantly different from the corresponding timepoints, P<0.0001.
+All measures significantly different from baseline and each other, P<0.0001.
Adapted from Despres J. Presented at ADA 2009 Symposium; June 5-9, 2009, New Orleans, LA.
SYNERGIE: Weight Loss and
HDL Cholesterol Over 3-Year Study
Body weight in men, followed for 3 yrs
HDL cholesterol in men,followed for 3 yrs
4
2
0
-2
-4
-6
Re
du
ctio
n in
bo
dy
w
eig
ht
(kg
)
Follow-up (yrs)
1 2 3
**
*
0 0/1 0/1/2Follow-up (yrs)Baseline
0 1 2 3
1,2
1,1
1,0
++
+
HD
L ch
ole
ste
rol
(mm
ol/
L)
TC : 189 mg/dL
LDL: 112 mg/dL
HDL: 42 mg/dL
TG : 175 mg/dL
Med: Atorvastatin 40mg
Consider: Combination Medication
Dean: Lipid Control

Isolated ↑↑↑↑ LDL-CRR=0.86 (0.59–1.26)
221
Metabolic Syndrome- LDL CVD in 4SEvent Rate (%)
Ballantyne CM et al. Circulation. 2001;104:3046-3051.
Simvastatin
Placebo
237 261 284
18.020.319.0
Lipid TriadRR=0.48 (0.33–0.69)
0
10
20
30
4036.9
4S, Scandinavian Simvastatin Survival Study.
Deedwania P et al. Lancet 2006;368:919-928.
TNT: Risk for Major CV Event in Patients with
Metabolic Syndrome
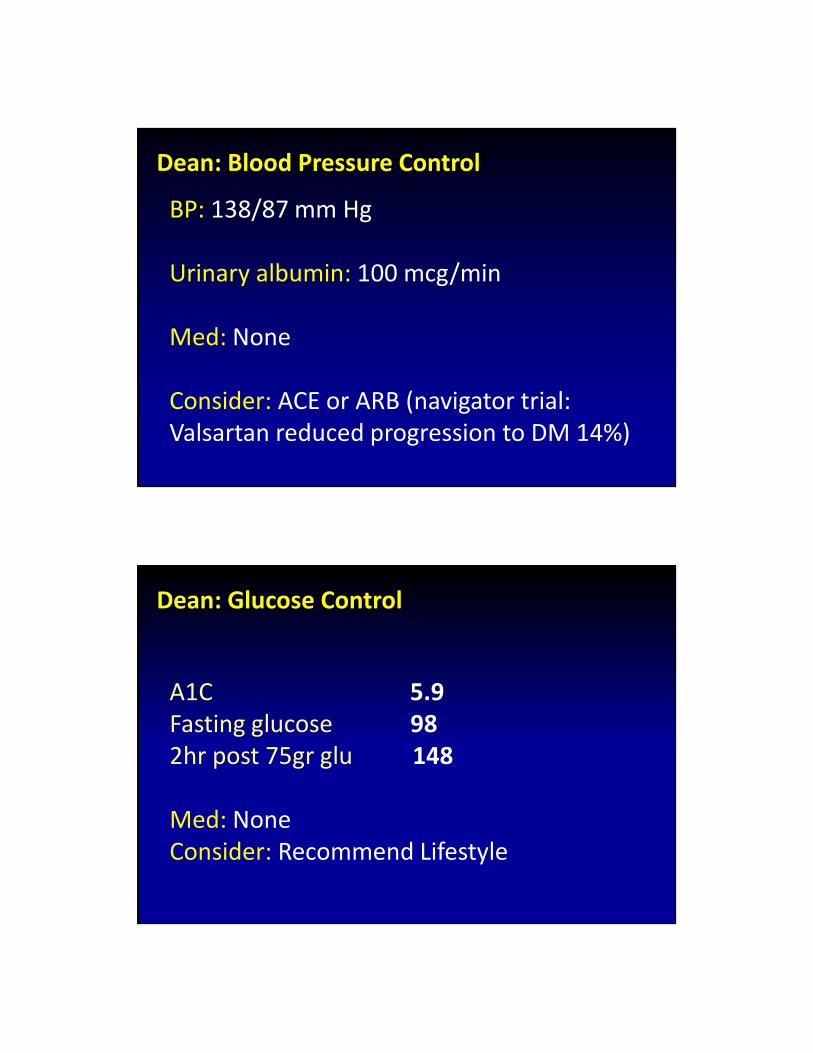
BP: 138/87 mm Hg
Urinary albumin: 100 mcg/min
Med: None
Consider: ACE or ARB (navigator trial:
Valsartan reduced progression to DM 14%)
Dean: Blood Pressure Control
A1C 5.9
Fasting glucose 98
2hr post 75gr glu 148
Med: None
Consider: Recommend Lifestyle
Dean: Glucose Control

Metformin Effect on
Cardiovascular Risk Factors
CVRF Metformin
1. Hyperglycemia
2. Hypertriglyceridemia
3. Hypercholesterolemia
4. Obesity
5. Hyperinsulinemia
6. Insulin Resistance
7. PAI-1
8. Endothelial Dysfunction
TZD Effects on Lipids
Week 24 Change From Baseline
PIO ROSI P value
Triglycerides -12.0% +14.0% <.001
HDL-C +14.9% +7.8% <.001
LDL-C +15.7% +23.3% .002
FFA (mEq/l) -0.11 -0.12 0.681
A1C -0.7% -0.6% 0.129
FPG (mg/dL) -33.2 -36.6 0.233
• Significance of data pending
– Peer-review publication of trial
• Clinical outcomes data
• TZD use with statinsGoldberg R et al. Diabetes Care. 2005;28:1547-1554.

Body weight reduction from baseline over
20 weeks in obese people without diabetes
–8
–7
–6
–5
–4
–3
–2
–1
0
–9
-5 -3 0 5 10 15 20Time (weeks)
Mean weight loss (kg)
Screening
Randomisation
Liraglutide 1.2 mg OD Liraglutide 1.8 mg OD
Liraglutide 2.4 mg OD Liraglutide 3.0 mg OD Orlistat 120 mg TID
Placebo
Baseline body weight (kg)
97.3
96.2 98.0
98.4
97.6
96.0
Liraglutide is not indicated for weight loss and not for use in people without diabetesAstrup et al. Lancet 2009;374:1606–16
OD, once daily; TID, three-times daily
Exenatide for 3.5 y
Study Results
Parameter
Baseline
(Mean ± SD)
Change from Baseline
(Mean ± SE) Average of % Change
Triglycerides (mg/dL) 225 ± 142 -44.4 ± 12.1 -12%
Total cholesterol (mg/dL) 184 ± 37 -10.8 ± 3.1 -5%
HDL-C (mg/dL) 39 ± 10 +8.5 ± 0.6 +24%
LDL-C (mg/dL) 114 ± 33 -11.8 ± 2.9 -6%
SBP (mmHg) 129 ± 13 -3.5 ± 1.2 -2%
DBP (mmHg) 79 ± 8 -3.3 ± 0.8 -4%
SD=standard deviation; SE=standard error; HDL-C=high-density lipoprotein cholesterol; LDL-C=low-density lipoprotein cholesterol; SBP=systolic blood pressure; DBP=diastolic blood pressure
Kendall D, et al. Abstract 557-P. Poster Presentation, 67th Scientific Sessions ADA 2007
•*All changes from baseline statistically significant
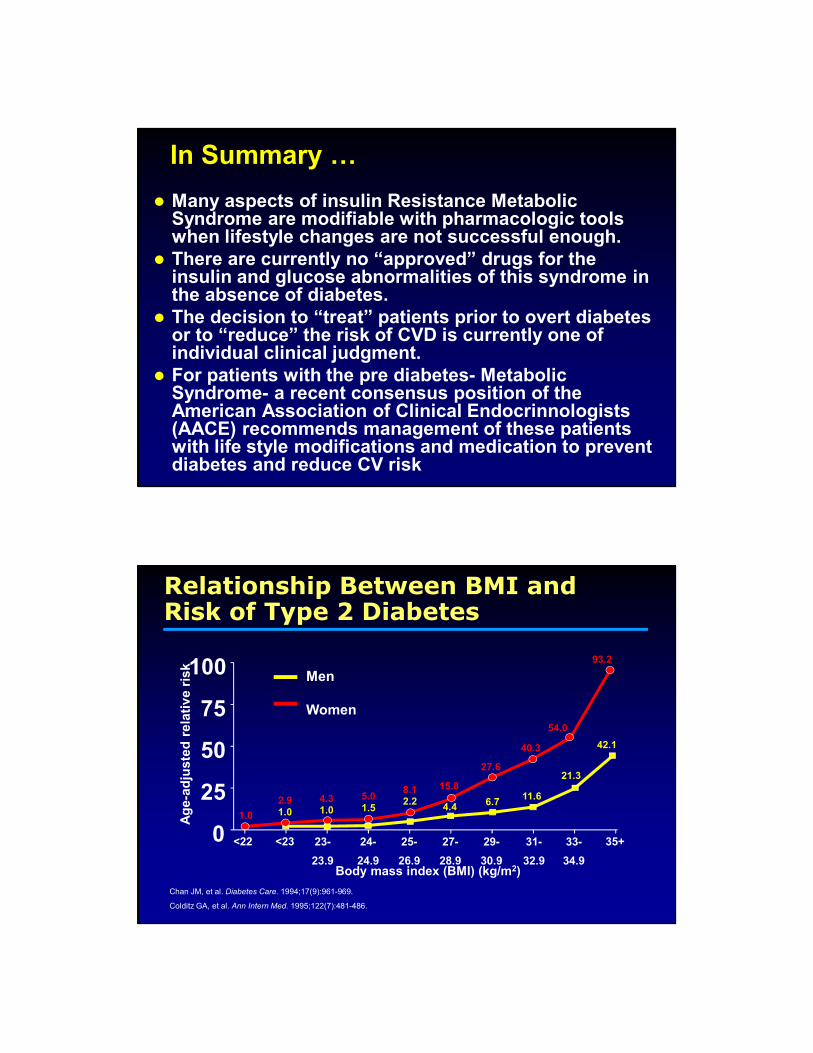
In Summary <
� Many aspects of insulin Resistance Metabolic Syndrome are modifiable with pharmacologic tools when lifestyle changes are not successful enough.
� There are currently no “approved” drugs for the insulin and glucose abnormalities of this syndrome in the absence of diabetes.
� The decision to “treat” patients prior to overt diabetes or to “reduce” the risk of CVD is currently one of individual clinical judgment.
� For patients with the pre diabetes- Metabolic Syndrome- a recent consensus position of the American Association of Clinical Endocrinnologists(AACE) recommends management of these patients with life style modifications and medication to prevent diabetes and reduce CV risk
Ag
e-a
dju
ste
d r
ela
tiv
e r
isk
Body mass index (BMI) (kg/m2)
Men
Women
<22 <23 23-
23.9
24-
24.9
25-
26.9
27-
28.9
29-
30.9
31-
32.9
33-
34.9
35+
1.0
2.91.0
4.31.0
5.01.5
8.12.2
15.8
4.4
27.6
40.3
54.0
93.2
6.711.6
21.3
42.1
0
25
50
75
100
Chan JM, et al. Diabetes Care. 1994;17(9):961-969.
Colditz GA, et al. Ann Intern Med. 1995;122(7):481-486.
Relationship Between BMI andRisk of Type 2 Diabetes

June 25, 2001
The Diagnosis and Management of
Pre-Diabetes in the Continuum of
Hyperglycemia—
When Do the Risks of Diabetes Begin?
American College of Endocrinology (ACE) and the American Association of Clinical Endocrinologists (AACE) CONSENSUS
STATEMENT

Why Recommendations for Pre-Diabetes?
57 million people in the US have pre-diabetes
Worldwide, number of people with pre-diabetes is estimated at 314 million
Projected to be418million worldwide by 2025
Pre-diabetes raises the short-term absolute risk of type 2
diabetes by 3- to 10- fold, with some populations exhibiting
greater risk than others.
Risk of Complications in Type 2 Diabetes
0
1
2
3
4
5
5.5 6.5 7.5 8.5 9.5
HbA1c
P<.0001
21% risk decrease per 1% decrement in HbA1c
*Reference category (hazard ratio 1.0) is HbA1c <6% with log linear scales. Data adjusted for age at
diagnosis of diabetes, sex, ethnic group, smoking, presence of albuminuria, systolic blood pressure,
high and low density LDL and triglycerides.
Adapted from Stratton IM, et al. (UKPDS 35). BMJ. 2000;321:405-412.
Any End Point Related to Diabetes*

Every Single Day in the United States<.
� 5,205 new cases of diabetes are diagnosed
� 230 people have a diabetes-related
amputation
� 133 people with diabetes progress to end-
stage renal disease
� 55 people with diabetes become blind
Centers for Disease Control and Prevention. 2011 National Diabetes Fact Sheet: Diagnosed and undiagnosed diabetes in the United States, all ages, 2010. Atlanta,
Age-adjusted Percentage of U.S. Adults
with Obesity or Diagnosed Diabetes Obesity (BMI ≥30 kg/m2)
1994
1994
2000
2000
No Data <14.0% 14.0-17.9% 18.0-21.9% 22.0-25.9% >26.0%
No Data <4.5% 4.5-5.9% 6.0-7.4% 7.5-8.9% >9.0%
CDC’s Division of Diabetes Translation. National Diabetes Surveillance System available at
http://www.cdc.gov/diabetes/statistics
2009
2009DIABETES
DIABETES
2000 2009OBESITY
OBESITY
DIABETES
DIABETES
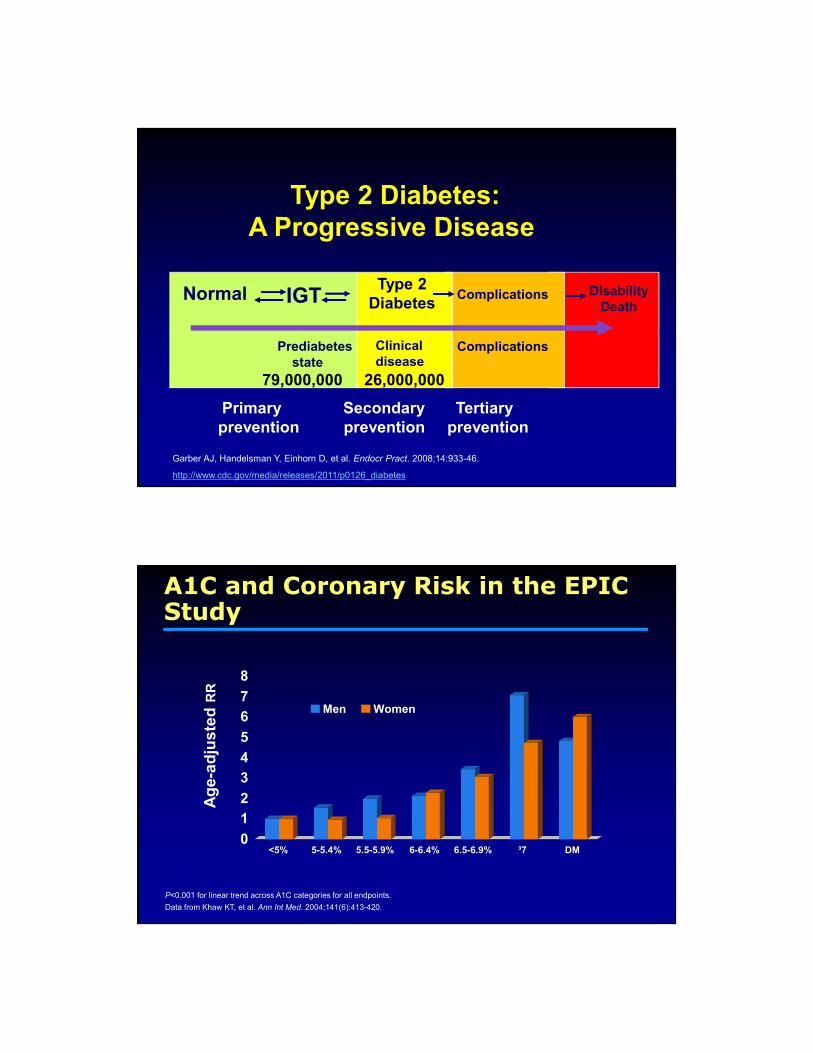
Prediabetes
state
Normal IGT
Clinical
disease
Type 2
DiabetesDisability
Death
Complications
Complications
Primary Secondary Tertiary
prevention prevention prevention
Type 2 Diabetes:
A Progressive Disease
79,000,000 26,000,000
Garber AJ, Handelsman Y, Einhorn D, et al. Endocr Pract. 2008;14:933-46.
http://www.cdc.gov/media/releases/2011/p0126_diabetes
0
1
2
3
4
5
6
7
8
<5% 5-5.4% 5.5-5.9% 6-6.4% 6.5-6.9% ³7 DM
Men Women
Data from Khaw KT, et al. Ann Int Med. 2004;141(6):413-420.
Ag
e-a
dju
ste
d R
R
P<0.001 for linear trend across A1C categories for all endpoints.
A1C and Coronary Risk in the EPIC Study

Thom T, et al. AHA. Circulation. 2006;113(6):e85-e151.
Centers for Disease Control. http://www.cdc.gov/nchs/nhis.htm. Accessed March 25, 2010.
National Hospital
Discharge Survey
CVD
Dis
ch
arg
es (
mil
lio
ns)
90 0300950
4
5
6
7
Year
Nu
mb
er
(mil
lio
ns)
National HealthInterview Survey
Diabetes
90 04989492 0096 02
Year
↑↑↑↑119%
CVD Has Risen, Accompanied by Diabetes
Macrovascular Microvascular
Cerebrovascular
disease
Heart disease and hypertension
Ulcers and
amputation
Diabetic eye disease(retinopathy, cataracts
macular edema)
Renal disease
Peripheral
Neuropathy
Foot problems
Peripheral vascular disease
Diabetes Complications
Erectile dysfunction
Autonomic
Neuropathy

9.8 9.5 9.17.9
6.6
27.8
22.9
18.9
1.8 1.7 2.11.1 1.8
6.1
10
0
10
20
30
Heart attack Chest pain Coronary
heart
disease
Congestive
heart failure
Stroke Chronic
kidney
disease
Foot
problems
Eye damage
Perc
en
tag
e w
ith
co
mp
licatio
ns Diagnosed diabetes
Normal blood sugar levels
Prevalence of Diabetes Macrovascular and Microvascular Complications
Macrovascular Microvascular
American Association of Clinical Endocrinologists. State of Diabetes Complications in America Report. Available at:
http://www.aace.com/newsroom/press/2007/images/DiabetesComplicationsReport_FINAL.pdf. Accessed April 18, 2007.
*
†
Z
*In NHANES, “chronic kidney disease" refers to people with microalbuminuria (albumin:creatinine ratio >30 µg/mg).†In the NHANES analysis, "foot problems" includes foot/toe amputations, foot lesions, and numbness in the feet.‡"Eye damage" includes a positive response by NHANES participants to the question, "Have you been told diabetes has affected your eyes/had
retinopathy?" Retinopathy is damage to the eye's retina. In NHANES, people without diagnosed diabetes were not asked this question, therefore,
prevalence information for nondiabetics is not available.
NORMAL IFG or IGT High Risk
for DM
DIABETES
FPG < 100 mg/dl IFG
FPG > 100 - 125 mg/dl
FPG > 126 mg/dl
2-h PG < 140 mg/dl IGT
2-h PG > 140 -
199 mg/dl
2-h PG > 200 mg
Random PG > 200 +
symptoms
A1C 5.5% to 6.4%
For screening *
(ADA 5.7% to 6.4)
≥ 6.5%
Secondary **
(ADA Primary)
AACE & ADA 2010 Diagnosis of Diabetes & Pre DM
ENDOCRINE PRACTICE Vol 16 No. 2 March/April 2010 155-6
* Requires testing FG or GTT ** Confirm with Glucose when possible

1. A1C is considered optional not primary criterion for diagnosis of diabetes.
2. AACE suggests glucose criteria when feasible.
3. A1C is not for diagnosing type 1 diabetes.
4. A1C is not for diagnosing gestational Diabetes.
5. A1C may be misleading in several ethnic populations (i.e, African American).
6. A1C may be misleading in hemoglobinopathies, iron deficiency, hemolytic anemia, thalassemias, spherocytosis and severe hepatic and renal disease.
A1C For Diagnosis- Precaution
ENDOCRINE PRACTICE Vol 16 No. 2 March/April 2010 155-6
Interventions Proven to Delay or
Prevent Type 2 Diabetes
Intervention % Risk Reduction
Lifestyle (4 trials) 29-58%
Metformin (2 trials) 26-31%
Lifestyle & Metformin (1 trial) 28%
Acarbose (1 trial) 25%
Troglitazone (1 trial) 52%
Rosiglitazone (1 trial) 62%
Pioglitazone (2 trials) 72%

Ht 5’10”, Wt 243 lb
• BMI 35
• Triglycerides 287
• HDL-C (mg/dL) 34
• LDL - 108
• BP 138/≥83
• A1C 6.3%
• Fasting glucose (mg/dL) 118
2hr post 75gr glu 186NCEP ATP III. JAMA. 2001;285:2486-97.
Mike
37 y male, Married 2 kids, computer programmer, C/0 E.D,
Mother- HTN, CVD. Father- DM2, CVD
Glu
co
se
(mg
/dL
)R
ela
tive f
un
cti
on
-10 -5 0
50
100
150
200
250
300
350
Insulin Resistance
Changes in Insulin Levels
Elevations in Fasting Glucose (IFG)
Elevations in Post-meal Glucose (IGT)
Onset
Diabetes
Onset
Diabetes
Pre Diabetes
Metabolic Syndrome
0
50
100
150
200
250
-15
Impaired Incretin Action
Years
Progression to Type 2 Diabetes

Impaired Glucose
Tolerance
Impaired Fasting Glucose
Diabetes
Stages in the History of
Type 2 Diabetes
Or Both
Relative Risk of Developing Diabetes Based on IGT and IFG Status
Haffner SM. Unpublished Data. IRA study.

The Metabolic Syndrome Raises the Risk for Diabetes
1.0
5.0
10.0
20.0
25.0
MetS
without
IFG
IFG
without
MetS
MetS
+
IFG
Lorenzo C, et al. Diabetes Care. 2007;30:8-13
No MetS
No IFG
Odds
Ratio
(Confidence
Interval)5.03
(3.39–7.48)
21.0 (13.1–33.8)
7.07 (3.32–15.1)
1.0
(ref)
Normal Fasting Plasma Glucose and Risk of Type 2 Diabetes Diagnosis
• The following increase the risk of developing
diabetes associated with normal fasting plasma
glucose
– Obesity
– Hypertension
– Low HDL cholesterol
– High triglycerides
– Smoking
• Closer surveillance for diabetes development might
be warranted in these patients
Nichols GA, et al. Am J Med 2008;121:519-524.

Risk Factors for Pre-DiabetesCardiovascular
Disease
Family History of Diabetes
Hypertension
DyslipidemiaSedentary
lifestyle
Overweight or Obese
Non-Caucasian Ancestry
Previously identified IGT, IFG, and/or metabolic syndrome
History of Gestational Diabetes
Delivery of a large baby
(>9 lbs/ 4 kg)
Polycystic ovary disease
Treatment for schizophrenia
or bipolar disease
Clinical Risks of Not TreatingPre-Diabetes are Substantial
• These complications involve both microvascular disease
– Retinopathy
– Neuropathy
– Nephropathy
• And cardiovascular disease (CVD)
– Heart disease
– Stroke
– Peripheral vascular disease
Most diabetes patients
die of CVD

Wong TY, et al. Lancet 2008; 371: 736–43
Fasting Plasma Glucose Thresholds Above Which the Prevalence of Retinopathy Increases
Blue Mountains
Eye Study
Australian
Diabetes, Obesity,
and Lifestyle
Study
Multi-ethnic Study
of Atherosclerosis
On visual
inspection
6.3-7.0 mmol/l
(113 -126 mg/dL)
7.1-7.8 mmol/l
(85.2-140 mg/dL)
No clear threshold
Change point
model
5.2 mmol/l
(93.6 mg/dL)
6.3 mmol/l
(113 mg/dL)
No clear threshold
Wong TY, et al. Lancet 2008; 371: 736–43.
Relationship Between Fasting Plasma Glucose and 5-Year Incident Retinopathy
≤83 84-97 99-112 113-126 ≥185128-140 157-169 171-184142-155 Mg/dL

Impaired Glucose Tolerance and Peripheral Neuropathy
• Diabetes is the most common cause of peripheral
neuropathy
• Up to 1/3 of neuropathy patients have no identifiable etiology
– Among this population, IGT is observed in approximately 40% of
patients, suggesting that neuropathy may occur as a result of pre-
diabetes
• Treatment of IGT patients with diet and exercise reduces the
risk of progression to diabetes and those with neuropathy
experience a short-term improvement in small fiber function,
with sustained benefit for pain
Singleton AG & Smith JR. Neurologist 2008;14:23-29.
Elevated Risk of CVD Prior to Clinical Diagnosis of Type 2 Diabetes
1
2.82
3.71
5.02
0
1
2
3
4
5
6
Nondiabetic
throughout the
study
Prior to diagnosis
of diabetes
After diagnosis
of diabetes
Diabetic at
baseline
Rela
tive R
isk
Hu et al. Diabetes Care. 2002;25:1129-1134.

Hoorn- IFG/IGT – CV risk Summary
Prevalence Diabetes risk CVD risk
IGT 10-15 % > 10 1.5
IFG-WHO 10-15 % > 10 1.2
IFG-ADA 30-40 % 2-3 1.1
• IFG and IGT result from different mechanisms
• Criteria from expert comittees
• publication before evaluation in existing data
Dekker, Balkau. Diabetes Care 2006
CVD and Diabetes Incidence: Relative Risk and Metabolic Syndrome Traits
Metabolic
Traits
Present
EventIFG
Present
IFG
Absent
Two Traits
CVD 1.9-2.6X 1.7-2.2X
Diabetes
Mellitus8.2-10.7X 3.1-5.0X
Three Traits
CVD 1.8-2.4X 1.9-2.1X
Diabetes
Mellitus7.7-12.4X 3.5-5.4X
Wilson Circulation 2005; 112: 3066

Relative risk of mortality is significantly
increased in subjects with IGT
DECODE- Multivariate adjusted: for age, centre, sex, cholesterol, BMI, BP, smoking
Mortality RR, multivariate
adjusted
RR, adjusted
also for FPG
CVD 1.34
(1.14-1.57)
1.32
(1.12-1.56)
CHD 1.28
(1.02-1.59)
1.27
(1.03-1.58)
Stroke 1.26
(0.88-1.80)
1.21
0.84-1.74)
All-cause 1.40
(1.27-1.54)
1.37
(1.25-1.51)
Two-Track Approach to Reduce Risk
• Lifestyle Intervention
• Pharmacotherapy in high risk patients
(1) Lower glucose to prevent microvascular
complications and progression to
diabetes
• Lifestyle Intervention
• Blood pressure goals: <130/80 mm Hg
• LDL goal: <100 mg/dL
(2) Address cardiovascular
disease risk factors

People with Pre Diabetes should be treated to the same CV risk goals as people with Diabetes
BP < 130/80
LDL < 100 (high risk < 70)
TGL < 150
HDL > 40
Consider: Statins, Fibrates, ACE ARBs, ASA etc
Pharmacotherapy for CV Risk Factors
Target Goal First-line agents Comments
LDL ≤100 mg/dL
(≤5.5
mmol/L)
Statins Additional use of fibrates, bile acid
sequestrants, ezetimibe, etc.,
should be considered as
appropriate.
Niacin should be avoided.
Blood
pressure
<130/80
mm/Hg
ACE inhibitors,
Angiotensin
receptor
blockers
Calcium channel blockers are
appropriate second line treatment
approaches.
Beta-blockers and thiazides should
be avoided.
Low-dose aspirin is recommended for all persons with pre-diabetes for
whom there is no identified excess in risk for gastrointestinal,
intracranial, or other hemorrhagic condition.

Elliott WJ, Meyer PM. Lancet 2007; 369: 201–07
Incident diabetes in clinical trials of
antihypertensive drugs: meta-analysis of 22
clinical trials in 143,153 patients
The priority in choice
of BP-lowering drugs• ACE-I/ARBs
– May be renal protective
– Ramipril did not prevent or predispose to diabetes
(DREAM trial)
• Long-acting calcium blockers
• Low-dose thiazide diuretics
– High doses predispose to diabetes (ALLHAT)
• Beta-blockers
– May worsen insulin resistance

Interventions to Reduce the Risks Associated with Pre-Diabetes
and Prevent Diabetes- Manage hyperglycemia
• Intensive lifestyle management is the cornerstone of
all prevention efforts
• No pharmacologic agents are currently approved
for the management of pre-diabetes.
– Pharmacotherapy targeted at glucose may be considered
in high risk patients- 2 out of the 3 IFG, GGT, MetSX-
after individual risk: benefit analysis.
For Patients with Prediabetes/MetS
Should Consider low-dose aspirin
• Efficacy
– Reduces risk for CVD by 20-25%
• Cost
– Not a factor
• Safety
– GI and cerebral hemorrhage
• Efficacy/Safety Ratio
– Positive when 10-yr risk for major CVD events >
10% (Framingham risk scoring)

Lifestyle Intervention
Persons with pre-diabetes should reduce weight by 5-10%, with long-term maintenance at this level.
A diet that includes calorie restriction, increased fiber intake, and maybe limitations in carbohydrate intake is advised.
• A program of regular moderate-intensity physical activity for 30-60 minutes daily, at least 5 days weekly, is recommended.
Interventions Proven to Delay or Prevent Development of Type 2 Diabetes
Intervention % Risk Reduction
Lifestyle (4 trials) 29-58%
Metformin (2 trials) 26-31%
Lifestyle & Metformin (1 trial) 28%
Acarbose (1 trial) 25%
Troglitazone (1 trial) 52%
Rosiglitazone (1 trial) 62%
Pioglitazone (2 trials) 72%

Multifactorial Lifestyle Intervention Reduces Incidence of Type 2 Diabetes in High-risk Groups
1Tuomilehto, J et al. N Engl J Med 20012Knowler et al. N Engl J Med 2002
0
10
20
30
40
50
1 2 3 4 5 6
Years of intervention
Cumulative incidence (%) 58% risk reduction
in lifestyle group
0
10
20
30
40
50
0 1 2 3 4
No intervention
Lifestyleintervention
Years of intervention
Placebo
Lifestyleintervention
58% risk reduction
in lifestyle group
Finnish Diabetes Prevention Study1 US Diabetes Prevention Program2
The Chinese Prevention Study The effect of metformin on the progression
of IGT to diabetes mellitus (n = 321)
Incidence of diabetes (%/yr)
Adapted from: Yang ,W. et al. Chin. J. Endocrinol. Metab. 17: 131-136, 2001
RRR = 65%
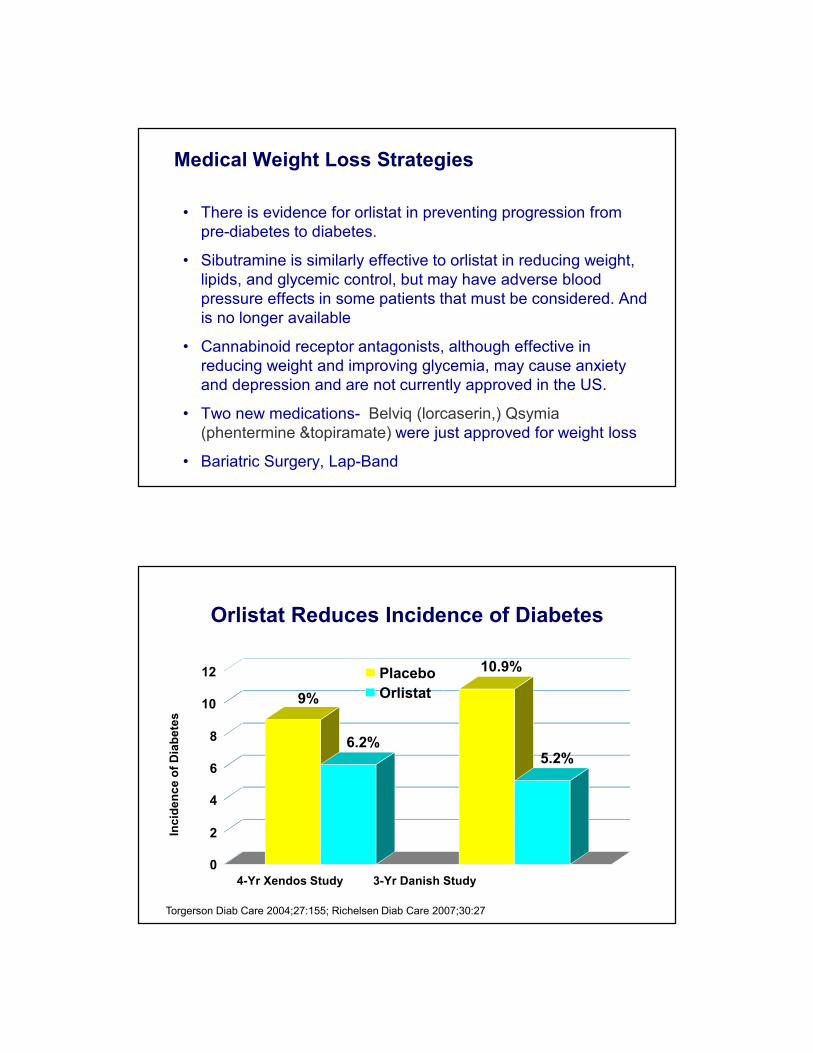
Medical Weight Loss Strategies
• There is evidence for orlistat in preventing progression from
pre-diabetes to diabetes.
• Sibutramine is similarly effective to orlistat in reducing weight,
lipids, and glycemic control, but may have adverse blood
pressure effects in some patients that must be considered. And
is no longer available
• Cannabinoid receptor antagonists, although effective in
reducing weight and improving glycemia, may cause anxiety
and depression and are not currently approved in the US.
• Two new medications- Belviq (lorcaserin,) Qsymia
(phentermine &topiramate) were just approved for weight loss
• Bariatric Surgery, Lap-Band
Orlistat Reduces Incidence of Diabetes
Inc
ide
nc
e o
f D
iab
ete
s
4-Yr Xendos Study 3-Yr Danish Study
Torgerson Diab Care 2004;27:155; Richelsen Diab Care 2007;30:27
9%
6.2%
10.9%
5.2%
0
2
4
6
8
10
12 Placebo
Orlistat

S
Adapted from: Knowler, W.C. et al. N. Engl. J. Med. 346: 393-403, 2002
Effect of Lifestyle and Metformin on the
Cumulative Incidence of Diabetes
(n = 3234)
Mather KJ et al. J Am Coll Cardiol. 2001;37:1344-50. * P = 0.0027 vs placebo
Before treatment After treatment
400
300
250
200
150
50
0
350
Metformin 1000 mg
(3 months)
3
Increase in forearm
blood flow (%)
Acetylcholine (µg/min)
100
*
Placebo
10 30 3 10 30
*
*
Metformin improves endothelial function

PAI-1 (AU/mL)
Effect of Metformin on PAI-1 Levels
Nagi DK et al. Diabetes Care. 1993;16:621-629.
*P=0.001 compared with baseline.
†P=0.0001 compared with baseline.
ZP=0.048 compared with 6 weeks.
Treatment duration (weeks)
15
20
25
30
0 6 12
Metformin
Placebo
P=0.001
P =0.036
P=0.096
*
†Z
DPP (73%)
TRIPOD (55%)
ACT NOW (72% )
DREAM (62% )
Studies of Thiazolidinediones to Prevent
Progression from IGT to Type 2 Diabetes
PIPOD (58%)

Antihypertensive Effects of Thiazolidinediones
•Pioglitazone –3 mm Hg –3 mm Hg
•Rosiglitazone–3.5 mm Hg –2.7 mm Hg
•Troglitazone –9 mm Hg –6.5 mm Hg
SBP DBP
Because of concerns about
their long-term safety, use of TZDs should be
reserved for higher risk populations
and those failing other, lower risk strategies.
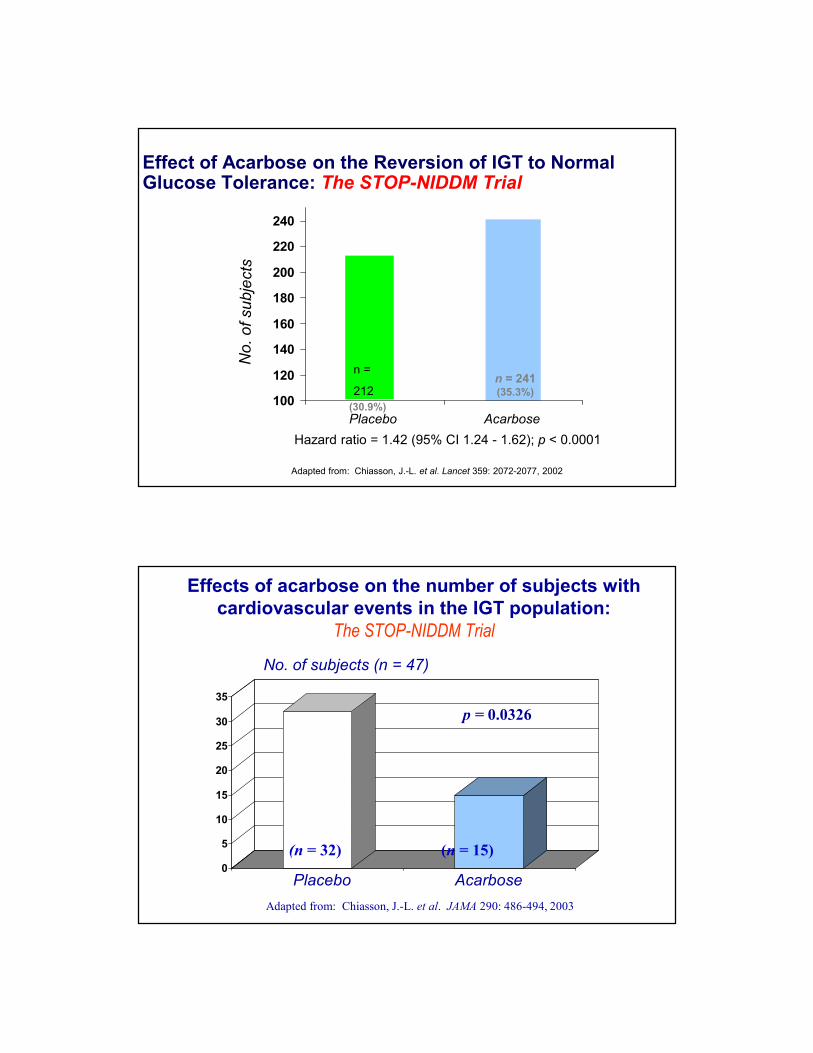
Effect of Acarbose on the Reversion of IGT to Normal Glucose Tolerance: The STOP-NIDDM Trial
100
120
140
160
180
200
220
240
n = 241(35.3%)
(30.9%)
Hazard ratio = 1.42 (95% CI 1.24 - 1.62); p < 0.0001
Adapted from: Chiasson, J.-L. et al. Lancet 359: 2072-2077, 2002
Placebo Acarbose
n =
212
Effects of acarbose on the number of subjects with
cardiovascular events in the IGT population:
The STOP-NIDDM Trial
0
5
10
15
20
25
30
35
(n = 32) (n = 15)
Adapted from: Chiasson, J.-L. et al. JAMA 290: 486-494, 2003
No. of subjects (n = 47)
p = 0.0326
Placebo Acarbose

ORIGIN- Insulin Glargine
In high risk people with IFG, IGT or early
diabetes, does insulin replacement therapy
targeting fasting normoglycemia (< 5.3 mM or 95
mg/dl) with insulin glargine, reduce CV outcomes
more than standard approaches to dysglycemia?
*P<0.0001 vs glargine, rosiglitazone, sitagliptin, or SU. **P<0.01 vs metformin. ***P<0.05 vs SU.
†All liraglutide dosages shown are 1.8 mg QD.
1. Garber A, et al. Lancet. 2009;373:473-481. 2. Nauck M, et al. Diabetes Care. 2009;32:84-90. 3. Pratley RE, et al. Lancet. 2010;375:1447-1456.
4. Marre M, et al. Diabet Med. 2009;26:268-279. 5. Zinman B, et al. Diabetes Care. 2009;32:1224-1232.
6. Russell-Jones D, et al. Diabetologia. 2009;52:2046-2055.
∆W
eig
ht (k
g)
Weight Reduction With Liraglutide:Mono and Dual Combination Therapy
* ****
*
*
***
Monotherapy vs
Glimepiride
52 Weeks1
Add-on to
Metformin
26 Weeks2
Add-on to
Metformin
26 Weeks3
Add-on to
Sulfonylurea
26 Weeks4
Add-on to
Met + TZD
26 Weeks5
Add-on to
Met + SU
26 Weeks6
N 746 1091 665 1041 821 581
Treatment
(mg/day)
Glim Lir Met Gli +
Met
Lira +
Met
Sit +
Met
Lira +
Met
SU Rosi +
SU
Lira +
SU
Rosi +
Met
Lira +
Rosi +
Met
Met +
SU
Glar +
Met +
SU
Lira +
Met +
SU
*

Preventing the progressionof pre-diabetes to diabetes
is cost effective
Diabetes prevention may have further cost
saving if the cost of lifestyle interventions
becomes lower through the availability of
group or web-based programs and the
coming availability of an expanded number of
generic medications.
Pre-Diabetes Consensus Statement: Summary
• Individuals with pre-diabetes are at increased risk for
diabetes as well as for micro- and macro-vascular
complications
• Treatment goals are to prevent deterioration in glucose
levels and modify other risk factors, such as obesity,
hypertension, and dyslipidemia
– The same BP and lipid goals for pre-diabetes as for diabetes are
suggested
• Intensive lifestyle management is the cornerstone of all
prevention efforts, pharmacotherapy targeted at glucose
may be considered in high risk patients after individual
risk:benefit analysis

Summary- Comprehensive Approach
� The obesity epidemic contributes to diabetes & CVD epidemics
� Target multiple conditions to reduce overall risk
� Utilize lifestyle modification for prevention & treatment
� Institute intensive treatment for glycemic control
� Benefit of LDL-lowering treatment in diabetic patients
� Benefit of ACE/ARB in treatment of HTN in Diabetes
� Consider anti-plateletes treatment to reduce thrombosis risk
� Consider comprehensive care of all risk factors, with combination
medications, to reduce CVD & complications

THANK YOU QUESTIONS?Nava Handelsman
Thank you Questions?