Embed Size (px)
Citation preview

1
Understanding Platform Overcrowding at Bus Rapid Transit Stations 1 2 3 4 5 6 7 8
Nicolae Duduta 9 EMBARQ Center for Sustainable Transport, 10 G St. NE Suite 800, Washington DC 20002 10
Corresponding author: [email protected], tel.: 202-729-7913 11 12 13
Asis Subedi 14 EMBARQ Center for Sustainable Transport, 10 G St. NE Suite 800, Washington DC 20002 15
[email protected] 16 17
18 19 20 21 22 23 24 25 26 27 28 29 30 31 32 33 34 35 36 37 38 39 40 41 42 43 44 45 46 47 48 49 50 51 Word count: 4118 words + 2 tables (=500 words) + 5 figures (=1250 words) = 5868 words 52

2
ABSTRACT 1 2 Platform overcrowding is a very common but relatively poorly understood occurrence at most 3 Bus Rapid Transit (BRT) systems in developing world cities. Most of the literature on BRT 4 capacity focuses on vehicle throughput for different types of lane and station configurations, and 5 relatively little is known about how different station layouts handle specific volumes of boarding 6 and alighting passengers. In this paper, we begin to address this gap in knowledge by building a 7 microscopic simulation model to test the ability of a typical Latin American BRT station 8 (median, high-platform, one bus bay per direction) of handling various volumes of passengers 9 under different scenarios. Through this modeling exercise, we first identify the areas within a 10 station that are most likely to experience overcrowding – the median refuge island at the main 11 entrance and the turnstiles. We then evaluate the performance of the station at these critical 12 points for different passenger volumes, looking mainly at pedestrian density (persons/m2) as an 13 indicator. Our results indicate a pedestrian capacity range for a typical BRT station, and also 14 quantify the impact of friction between pedestrians entering and leaving the station. Finally, we 15 estimate a regression based on the simulation results and we show the impact and statistical 16 significance of pedestrian volumes and movement direction on crowding. Our results can help 17 BRT planners better adapt their station designs to forecasted passenger volumes, ensuring they 18 provide an adequate level of service. 19 20 21 22 23 24 25 26 27 28 29 30 31 32 33 34 35 36 37 38 39 40 41 42 43 44 45 46

3
INTRODUCTION 1 2
3 Overcrowding is the most common complaint in Bus Rapid Transit (BRT) passenger surveys in 4 Latin American cities. In the case of Metrobus BRT in Mexico City, for instance, while surveyed 5 passengers are typically appreciative of the new buses and clean stations, 87% cite overcrowded 6 buses as the main problem, and 42% consider that waiting time for buses is excessive (1). 7 Considering that Metrobus buses typically run on headways of 40 to 75 seconds (2), long waiting 8 times are not an issue of low bus frequencies, but rather of difficulty boarding the buses because 9 of crowding. In the case of the TransMilenio BRT in Colombia, passenger surveys carried out by 10 the Bogota Chamber of Commerce revealed “too many passengers” as the leading complaint 11 about the BRT system (3). 12
There are two sides to this problem – overcrowding in the buses, and overcrowding on 13 station platforms. Bus crowding is a corridor capacity issue, which can be addressed by 14 increasing bus size and frequency, or by providing skip-stop services. This is the aspect of BRT 15 capacity that is generally well understood and explored in-depth in the literature (4 - 6). The 16 focus of this paper is the second aspect of crowding – pedestrian overcrowding on station 17 platforms. This aspect is considerably more complex, and while there is a body of research on 18 the pedestrian capacity of station platforms, this is usually geared towards major rail stations (7, 19 8). There is a gap in the literature regarding crowding effects for typical BRT station layouts. 20
In this study, we address this gap by studying platform crowding effects at a typical Latin 21 American BRT station. While there is considerable variation in the layout and dimensions of 22 BRT stations, we chose the typical station as the layout that is most commonly applied across 23 Latin America. An overview of several major BRT systems showed that over 80% of all BRT 24 stations in this region have the following layout: a median station with two bus bays (one per 25 direction), one two-way access point at one end of the station, next to a signalized crosswalk, 26 off-board fare collection, with turnstiles placed at the main entrance, and a platform width of 27 approximately 4 meters (13 feet) (Figure 1). 28
29
30 31

4
Aside from being the most frequent type of station used, this layout is also the one with 1 the lowest capacity (both in terms of buses and passengers on the platform). Most other station 2 types represent some form of capacity increase (e.g. additional access points, additional bus 3 bays, access via a bridge instead of a crosswalk, etc.). Therefore, the results from this paper can 4 be used to determine whether a typical station layout can handle the expected passenger volumes 5 for a given location, and can help inform planners on where capacity increases are needed. 6
In order to test the ability of this station layout of handling different passenger volumes 7 under several scenarios, we developed a microscopic simulation model using PTV Vissim and 8 Viswalk. We created several different scenarios for this station, by changing two key variables – 9 the total number of passengers, and the ratio of passengers entering and exiting the station. This 10 second variable seeks to account for the effect of friction between pedestrians moving in 11 opposite directions, an issue that has been acknowledged in previous studies (7). 12
Our first result is qualitative in nature: we identified the two critical areas where 13 crowding is more likely to occur: the median refuge island at the station entrance, and the 14 turnstile queuing zone. We then ran multiple simulations for the station with different total 15 volumes and different ratios of passengers going in and out, and measured the level of service for 16 pedestrians at these two critical areas, following the guidelines and the indicators from the 17 Transit Capacity and Quality of Service Manual (9), and focusing on pedestrian density 18 (passengers/m2). 19
Our main finding is that this simple station layout is capable of handling up to 5,000 20 passengers per hour, while maintaining an excellent level of service for passengers. Between 21 5,000 and 6,000 passengers per hour, level of service decreases rapidly, and above 6,000, the 22 station quickly becomes completely clogged. However, we also found that the friction between 23 passengers going in and out is another key element, and a high amount of pedestrian counterflow 24 can significantly reduce station capacity. For a given level of total passenger volumes, the level 25 of service for the station can vary from A to F depending on the amount of friction between 26 passenger flows. 27 28 29 30 METHODOLOGY 31 32 The main question this paper seeks to answer is straightforward: what is the maximum number 33 of passengers that can be accommodated by a typical BRT station layout, under acceptable 34 conditions? The answer, however, is considerably more complex. Vuchic argues that the 35 capacity of any transport system should never be presented as a single number, but rather as a 36 range, because minor changes in inputs can have significant impacts on the final number (10). In 37 our case, the level of crowding at the station depends on all of the following variables: station 38 length, station width, number and type of turnstiles, average delay per turnstile (depending on the 39 type of payment method used), bus frequency, bus capacity, bus occupancy, number of people 40 alighting per bus, number of people boarding. Moreover, since we are modeling a station 41 accessed via a signalized crosswalk, the signal configuration also has a significant impact on 42 crowding at the station. It was not feasible to test for the impact of all possible configurations for 43 each element mentioned above, so it was necessary to select which parameters to vary and to 44 which to leave as default values. 45

5
Since our focus is on the impact of pedestrian volumes and ratio of passengers entering 1 and leaving the station, we used different values for these two key inputs, while holding 2 everything else constant. The choice of which values to pick for constant values (i.e. a central 3 median width of 3 meters or 4 meters) is subjective to some extent. In our case, all the averages 4 values we used are based on Metrobus Line 1 in Mexico City. This ensures consistency across 5 the different values picked, but also ensures that our findings can be applicable to other systems 6 as well. Indeed, Metrobus Line 1 was among the first BRTs in Latin America, and many of its 7 features have been replicated on other systems throughout the region. We used a rectangular 8 station of 4 x 76 meters (13 x 250 feet), since these are the most common dimensions on the 9 Metrobus Line 1 corridor. We used a signal configuration designed to give priority to the BRT, 10 with an average green time for pedestrians to access the station equal to approximately 40% of 11 the length of the signal cycle. Similarly, we used five turnstiles arranged in a single row, because 12 this is the maximum number that can typically be fitted for this station width. For operational 13 characteristics (e.g. bus frequency, average bus occupancy), we used average data for Metrobus 14 Line 1 reported in its 2010 operational review report (2). Table 1 lists all the values of the 15 parameters held constant across all simulations. Note that this being a study of capacity, these 16 values are not always intended to represent averages, but rather typical values for busier stations. 17 18
6
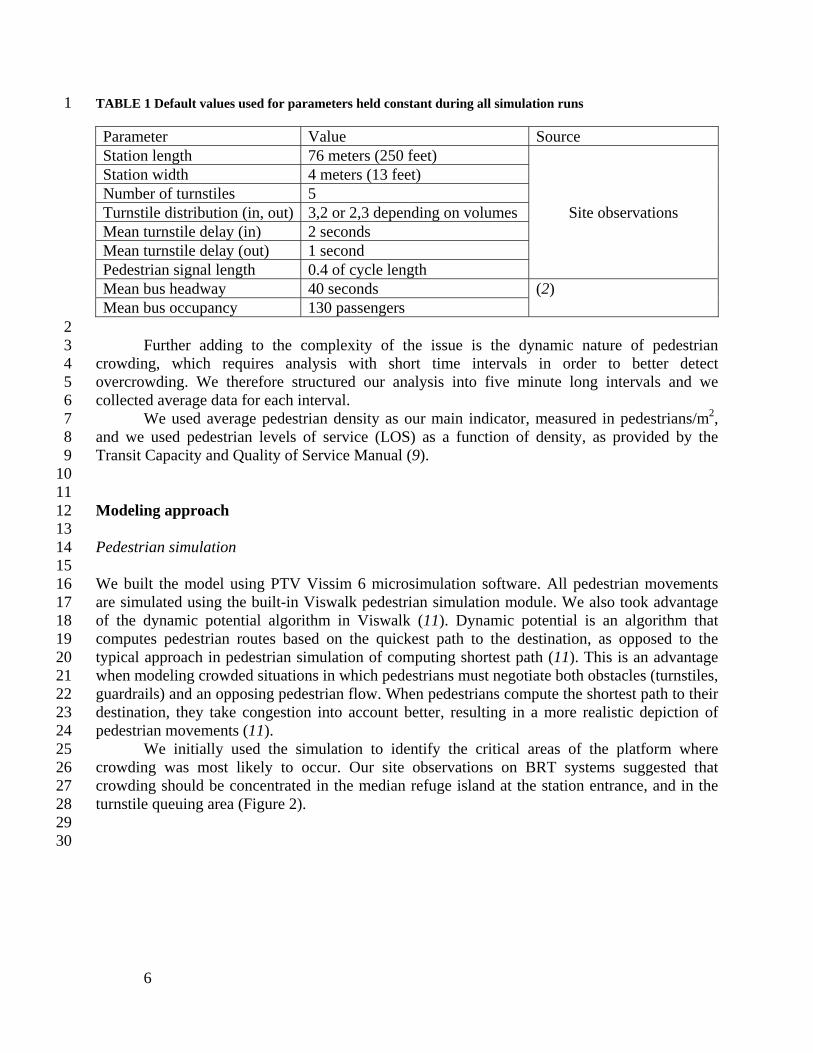
TABLE 1 Default values used for parameters held constant during all simulation runs 1
Parameter Value Source Station length 76 meters (250 feet)
Site observations
Station width 4 meters (13 feet) Number of turnstiles 5 Turnstile distribution (in, out) 3,2 or 2,3 depending on volumes Mean turnstile delay (in) 2 seconds Mean turnstile delay (out) 1 second Pedestrian signal length 0.4 of cycle length Mean bus headway 40 seconds (2) Mean bus occupancy 130 passengers
2 Further adding to the complexity of the issue is the dynamic nature of pedestrian 3
crowding, which requires analysis with short time intervals in order to better detect 4 overcrowding. We therefore structured our analysis into five minute long intervals and we 5 collected average data for each interval. 6
We used average pedestrian density as our main indicator, measured in pedestrians/m2, 7 and we used pedestrian levels of service (LOS) as a function of density, as provided by the 8 Transit Capacity and Quality of Service Manual (9). 9 10 11 Modeling approach 12 13 Pedestrian simulation 14 15 We built the model using PTV Vissim 6 microsimulation software. All pedestrian movements 16 are simulated using the built-in Viswalk pedestrian simulation module. We also took advantage 17 of the dynamic potential algorithm in Viswalk (11). Dynamic potential is an algorithm that 18 computes pedestrian routes based on the quickest path to the destination, as opposed to the 19 typical approach in pedestrian simulation of computing shortest path (11). This is an advantage 20 when modeling crowded situations in which pedestrians must negotiate both obstacles (turnstiles, 21 guardrails) and an opposing pedestrian flow. When pedestrians compute the shortest path to their 22 destination, they take congestion into account better, resulting in a more realistic depiction of 23 pedestrian movements (11). 24 We initially used the simulation to identify the critical areas of the platform where 25 crowding was most likely to occur. Our site observations on BRT systems suggested that 26 crowding should be concentrated in the median refuge island at the station entrance, and in the 27 turnstile queuing area (Figure 2). 28 29 30

7
1 FIGURE 2 Examples of crowding on station platforms. Left: at the median refuge island (TransMilenio, 2 Bogota). Right: In the turnstile queuing area (Metrobus, Istanbul). 3 4 Initial results from the pedestrian simulation confirmed our site observations. Figure 3 shows a 5 Viswalk simulation snapshot, with the pedestrian areas color-coded based on density. 6 7
8 FIGURE 3 Viswalk simulation snapshot, showing crowding in different areas of the BRT station (red 9 indicates higher pedestrian density) 10 11
While the simulation results indicate that the refuge island is likely to experience more 12 crowding than the turnstile area, we focused our analysis mainly on the turnstiles. The reason is 13 that crowding in the refuge island is relatively easy to address. Minor changes in the signal 14 configuration, or simply extending the space available for the island, can alleviate crowding 15 there. The turnstiles, on the other hand, represent a stricter limit on capacity. If the station gets to 16 the point where the turnstiles are overcrowded, a major redesign might be needed to address that 17 problem, such as adding another access point, or providing access via a pedestrian bridge, where 18 more turnstiles can be accommodated. 19
We tested a total of 34 different scenarios, in which passenger volumes ranged from 20 4,000 to 6,500 per hour and the percentage of these passengers leaving the station varied 21 between 0 and 100%. Each scenario was simulated four different times using different random 22

8
seed values, and the results were averaged across the four simulations. For each simulation, we 1 allowed an initial warm-up period, after which statistics were collected in 5-minute intervals. 2 The short time intervals allowed us to capture pedestrian crowding effects with a high resolution, 3 helping identify cases in which hourly averages were relatively low, but included 5 or 10-minute 4 intervals of high congestion. 5 6 7 Regression analysis 8 9 Using these data points, we estimated a regression model predicting pedestrian density (peds/m2) 10 in the turnstile queuing area, as a function of total passenger volumes, and the percentage of 11 passengers leaving the station. The plots of simulation results (figures 4 and 5) suggested that 12 density increases exponentially when these other variables increase linearly, indicating that the 13 relationship would take the following form: ln ∑ . We express the friction between 14 passengers entering and leaving the station as the ratio of total passengers going out. This 15 variable takes values between 0 and 1. Naturally, the increase in density is only exponential up to 16 a certain point (in our case, around 6,500 hourly passengers). At that point, it is the queue that 17 increases, while density levels remain relatively constant, in the range of 4 – 5 pedestrians/m2. 18 19 20 21 RESULTS 22 23 Our simulation results indicate that this station layout can handle up to 5,000 hourly passengers 24 (boardings and alightings), while maintaining an excellent level of service (figure 4). There is a 25 sharp increase in crowding between 5,000 and 6,000 hourly passengers, and some of the 5-26 minute time intervals see experience a level of service of D or worse (upwards of 1.5 27 pedestrians/m2). Beyond 6,000 passengers per hour, crowding is almost constant for the entire 28 simulation period, and densities climb as high as 5 persons / m2 (LOS F). 29 5,000 passengers per hour is a quite high number, even for the high-demand corridors in 30 Latin America. The average station on Metrobus Line 1 in Mexico City, for instance, has about 31 15,000 daily boardings and alightings, which rarely translates to more than 1,500 passengers 32 during the peak hour (2). This means that this most basic station design is in fact capable of 33 handling the passenger volumes at most stations. 34 35 36 37 38 39 40 41 42 43 44 45 46

9
FIGURE 4 Relationship between the hourly number of passengers entering and leaving the station, and 1 average 5-minute density at turnstiles 2 3
4 5 6
For the simulation runs shown in figure 4, the ratio of passengers leaving the station was 7 held relatively constant (varying between 56% and 66%, consistent with actual data from 8 Metrobus Line 1 stations (2) ). For another set of simulation runs, we held the total number of 9 hourly passengers constant at 6,000, and we changed the ratio of passengers exiting the station 10 from 0 to 1 (figure 5). 11 12 13 14 15 16 17 18 19 20 21 22 23 24 25 26 27

10
FIGURE 5 Relationship between the degree of counterflow (ratio of passengers exiting at constant total 1 passenger volumes), and average 5-minute density at turnstiles 2 3
4 5 6
Figure 5 illustrates how, for the same overall passenger volumes, their distribution 7 between entering and leaving the station can make the level of service vary between A and F. 8 The station performs best when the ratio of exiting passengers is between 20% and 60%. When 9 more than 80% of passengers are entering, level of service declines up to D. However, the 10 biggest crowding occurs at the opposite end of the spectrum, when 70% or more of total 11 passengers are leaving the station. This type of scenario corresponds to a major transfer station, 12 when large numbers of people are exiting the station to transfer to other lines or other transport 13 modes. It can also apply to major downtown stations in the central business district during the 14 morning rush hour. In these cases, our results indicate, if total hourly volumes approach or 15 exceed 6,000 passengers, the station is likely to become significantly crowded. 16
The reason why the station performs best when passenger flows are evenly distributed 17 between entering and leaving is that the flows match the turnstile configuration. We simulated 18 our station with three turnstiles in one direction and two in the opposite direction (depending on 19 the major flow). When the numbers of passengers entering and exiting the station are relatively 20 balanced, the turnstile configuration provides a good fit. When passenger volumes are skewed 21 heavily in one direction, the turnstiles cannot handle this and the station becomes overly 22 crowded. 23 Another interesting pattern in figure 5 is that crowding in the turnstile area is more 24 prevalent when most passengers are going out rather than in. This has to do with the passenger 25 arrival rate at the turnstiles, which is different for the two directions. Passengers entering the 26 station arrive during the green signal phase at the crosswalk. Some are initially bunched closely 27 together at the red light, but then as they walk from the sidewalk to the turnstiles, covering a 28 distance of over 40 meters, they spread out. Indeed, pedestrians have slightly different speeds, 29 and a group of pedestrians will always spread out when walking in the same direction. In 30

11
Viswalk, this is handled through the use of desired speeds and speed distributions for pedestrians 1 (12). Other pedestrians arrive randomly during the green phase and are therefore already spread 2 out. Overall, this results in relatively less queuing for the same volume of passenger entering, as 3 opposed to exiting the station. 4 Passengers leaving the station, on the other hand, have less time to spread out before 5 reaching the turnstiles. They exit the buses closely bunched, and – especially for one of the two 6 bus bays – leave the bus less than 10 meters from the turnstiles. For this reason, a smaller 7 number of passengers leaving the station can generate more crowding than a large number of 8 passengers entering. 9 10 11 Regression analysis 12 13 Table 2 shows the results of a regression predicting density in the turnstile queuing area, as a 14 function of hourly passengers and the ratio of passengers leaving the station. 15 16 TABLE 2 Results of linear regression model predicting the natural log of pedestrian density in the turnstile 17 queuing area 18
Coefficient Standard error P value
Number of passengers per hour (hundreds) 0.070 0.005 0.000
Ratio of exiting passengers to total passengers ( 0 to 1) 1.266 0.188 0.000
Simulation time elapsed (multiples of 5 minutes) 0.094 0.027 0.001
Constant -4.842 0.350 0.000
No. of observations 170
R2 0.55
F (prob.) 67.51 (p<0.001)
19 20
The regression results confirm the importance of the distribution of entering and exiting 21 passengers on crowding, after controlling for total pedestrian volumes. As the ratio of exiting 22 passengers increases, so does crowding. We added the elapsed simulation time as a control 23 variable, to account for the fact that crowding in a specific interval impacts the following 24 intervals, and therefore LOS deteriorated as each simulation progressed. 25
The regression results can be used to create an equation that seeks to predict the level of 26 crowding in a station as a function of the flow and direction of passengers, assuming that the 27 station has similar characteristics to the ones used in our simulation (see table 1): 28 29
exp 4.839 0.070100
1.266 (Eq. 1) 30
31 Where is the number of passengers during the peak hour and is the ratio of 32
exiting passengers to total passengers during that same hour (0 to 1). The constant is different 33 from table 2 because it also integrates a default value for elapsed simulation time. 34 35

12
Prediction accuracy 1 2
We tested the prediction accuracy of Equation 1 by using it to perform in-sample forecasting of 3 pedestrian density for specific combinations of passengers volumes and ratio of passengers 4 leaving. The predicted density was, on average, within 30% of average densities across several 5 simulation runs for a given scenario. Given this relative level of accuracy, equation 1 could be 6 used as a sketch planning tool to obtain an order-of-magnitude estimate of pedestrian density. 7 The equation is particularly adept at predicting situations in which the pedestrian LOS would be 8 D or worse (i.e. 1.42 pedestrians/m2 or higher). For our sample, it correctly predicted this 9 situation in 31 out of 34 scenarios, or 91% of the time. 10 From this perspective, equation 1 could be used to gain an initial estimate of crowding. If 11 the equation yields a result of 1.42pedestrians/ , this is a good indication that 12 crowding is likely, and a detailed simulation of pedestrian movements on the platform is 13 warranted. 14 15 16 17 CONCLUSION 18 19 Our findings suggest that this basic station layout (figure 1) is capable of handling hourly 20 passenger volumes higher than what most typical BRT stations will ever experience – up to 21 5,000 passengers per hour, while maintaining a level of service of A (i.e. less than 0.83 22 pedestrians/m2). As noted above, most BRT stations will rarely experience more than 2000 23 hourly passengers (2). However, if the ridership forecasts indicate that hourly volumes are likely 24 to approach or exceed 5,500 passengers, a more in-depth evaluation of the station is warranted. 25 In this case, particular attention should be given to the ratio of passengers leaving the 26 station, as this variable has a strong impact on pedestrian density, and can cause the pedestrian 27 LOS to decline all the way to F in the turnstile queuing area. The equation discussed above could 28 be used in these cases as a sketch planning tool to gain an estimate of the likely level of service, 29 and if conditions are predicted to decline below LOS D, a microscopic simulation model for the 30 station would be warranted. 31 If faced with a situation where this basic station layout would prove inadequate, planners 32 and designers of the BRT would need to know which types of capacity enhancements would be 33 needed. The experience from current BRTs suggests the following possible options: 34 35
Adding another access point at the opposite end of the platform, to double the turnstile 36 capacity (e.g. Metrobus Line 1, Mexico City) 37
Completely eliminating friction between directions of passenger flow, by making the 38 main access point an entrance only and the access point at the opposite end of the 39 platform for exit only, so that all movements on the platform are in the same direction 40 (e.g. Metrobus Line 1, Mexico City) 41
Providing access via a pedestrian overpass, and moving the turnstiles to the top of the 42 overpass, where more than five can be accommodated (e.g. Metrobus Istanbul) 43
Splitting the station into two sub-stations, one for each direction of bus travel, with a 44 mid-block access point between them, via an overpass, with turnstiles on the overpass, 45

13
and direct connection on the ground between the two sub-stations (e.g. Metrobus 1 Istanbul, TransMilenio, Bogota) 2
3 A relevant next step in this area of research would be to estimate the degree to which each of the 4 capacity enhancements mentioned above would relieve pedestrian crowding, and provide 5 guidance on the typical capacity range for these additional layouts as well. 6 7 8 9 10 11 REFERENCES 12 13
14 1. Sistema Descentralizado Metrobús, CTS-México. 2010. 5ª Encuesta de Opinion de Metrobus, 15 Mexico City. 16
17 2. Sistema Descentralizado Metrobús, CTS-México. 2010. Reporte de Revisión Operacional de 18 Metrobús, Mexico City. 19
20 3. Camara de Comercio de Bogota. 2010. Reporte Anual de Movilidad 2009. Direccion de 21 Veedurias, Observatorio de Movilidad, Bogota. Retrieved online on 07.14.2014 from 22 http://camara.ccb.org.co/documentos/6522_aspectos_negativos_transmilenio_observa2010.pdf 23
24 4. Wright, L., W. Hook, Eds. 2007. Bus Rapid Transit Planning Guide, 3rd edition. Institute for 25 Transportation and Development Policy, New York; Volume 1, section II.8. 26
27 5. Hidalgo D., G. Lleras, E. Hernandez. 2011. Passenger Capacity in Bus Rapid Transit Systems 28 - Formula Development and Application to the TransMilenio System in Bogota, Colombia, paper 29 presented at Thredbo 12 Conference, Durban. 30
31 6. Lindau, L.A., B. Medeiros Pereira, R. A. de Castilho, M. C. Diogenes, J. C. Herrera 2011. 32 Impact of Design Elements on the Capacity and Speed of Bus Rapid Transit (BRT): the case of a 33 single lane per direction corridor, paper presented at Thredbo 12 Conference, Durban. 34
35 7. Hermant, L. 2013. A New Method for the Determination of Access Gate / Turnstile 36 Requirements. Paper presented at the 32nd Southern African Transport Conference, Pretoria. 37
38 8. Lam, W.H.K. 1999. A Study of Crowding Effects at the Hong Kong Light Rail Transit 39 Stations. Transportation Research Record Part A, Policy and Practice, 02/1999, 33(5), pp: 401-40 415 41
42 9. Kittelson and Associates, Inc., Parsons Brinckerhoff, KFH Group, Texas A&M Transportation 43 Institute, Arup. 2013. Transit Capacity and Quality of Service Manual, Third Edition, Transit 44 Cooperative Research Program, TCRP Report 165, Transportation Research Board, Washington 45 DC. 46

14
1 10. Vuchic, V. 2005. Urban Transit. Operations, Planning, and Economics. Hoboken, New 2 Jersey: John Wiley and Sons. 3
4 11. Kretz, T., A. Große, S. Hengst, L. Kautzsch, A. Pohlmann, P. Vortisch. 2011. Quickest Paths 5 in Simulations of Pedestrians, Advances in Complex Systems 14, 733(2011). 6
7 12. PTV AG. 2014. PTV Vissim 6 User Manual, 5. Base Data for Simulation, 5.4.1. Using 8 desired speed distributions. PTV AG, Karlsruhe, Germany. 9
10 11
12