Embed Size (px)
Citation preview

Final summary report
Understanding out of home consumer food waste
In 2012, WRAP undertook a consumer survey and qualitative discussion groups to identify barriers to, and opportunities for, food and drink waste prevention in restaurants, pubs, quick service restaurants, hotels, staff restaurants and leisure venues.
Project code: CFP104-015 Research date: March-December 2012 Date: June 2013

WRAP’s vision is a world without waste, where resources are used sustainably. We work with businesses, individuals and communities to help them reap the benefits of reducing waste, developing sustainable products and using resources in an efficient way. Find out more at www.wrap.org.uk Written by: Sara Giorgi, Associate Director at Brook Lyndhurst
WRAP and Brook Lyndhurst have tried to make sure this report is accurate, we cannot accept responsibility or be held legally responsible for any loss or damage arising out of or in connection with this information being inaccurate, incomplete or misleading. This material is copyrighted. You can copy it free of charge as long as the material is accurate and not used in a misleading context. You must identify the source of the material and acknowledge our copyright. You must not use material to endorse or suggest we have endorsed a commercial product or service. For more details please see our terms and conditions on our website at www.wrap.org.uk

Understanding out of home consumer food waste 1
Executive summary WRAP research published in 2012 estimated that in 2009 UK hotels, pubs, restaurants and quick service restaurants disposed of 0.6 million tonnes of food waste.1 To help tackle this WRAP launched the Hospitality and Food Service Agreement (hereafter H&FSA) in June 2012 which aims to prevent waste by 5% and increase recycling to 70%. In 2012 WRAP commissioned this current research to help support the H&FSA, this research aimed to: Identify consumer barriers to and opportunities for preventing food waste when eating
out; and Develop research suggestions for how the Hospitality and Food Service sector could
support consumers in reducing food waste out of home.
This research was designed to explore why customers leave food when eating out at restaurants, pubs, quick service restaurants, hotels, staff canteens and leisure venues in the UK. It comprised an omnibus survey, a bespoke quantitative survey of over 5,000 customers and a series of discussion groups. The tailored quantitative survey asked respondents about a single specific eating out occasion at one of the abovementioned venues within the last three months as well as a series of more general behavioural and attitudinal questions about eating. The findings address the following research questions: What is the profile of customers who eat out across different venues? Who leaves food when eating out? On what occasions is food left? What is left? Why do customers leave food when eating out? What can be done to address food waste generated when eating out?
This executive summary now briefly addresses each of the research questions in turn. The profile of diners Eating out is a frequent habit for respondents. Half of respondents stated they ate out either daily or weekly. The UK’s ‘eating out-of-home-public’ is split evenly between men and women and, when compared to the UK population as a whole tends to be older and from higher socio-economic groups. When examining the psychological role of eating out, respondents can be split into two categories: those that saw the meal’s ‘functional purpose’ as fuel to keep them going (44%); and those that saw the meal as a ‘collective treat ’ – a fun social occasion to be shared with friends, partner and/or family (55%). Who leaves food when eating out? On what occasions is food left? What is left? Over a quarter of respondents (27%) left food at the end of their meal. These individuals were more likely to be women and to be younger. Hotels, pubs and restaurants had bigger proportions of meal leavers than other venues. Diners who are eating out for the social experience rather than simply to ‘re-fuel’ are more likely to leave food at the end of their meal. Meal leavers, in the quantitative survey, and 1http://www.wrap.org.uk/sites/files/wrap/RSC%20Facts%20%20Figures%20for%20web%2C%2014%20Nov%202011%20final_0.pdf WRAP is also currently working to complete this evidence base and further research will be published in summer 2013.
Understanding out of home consumer food waste 2
participants, generally in the qualitative research, perceived having a meal out to be a treat, an occasion for customers to indulge and not think about whether or what food is left. Meal leavers are more likely to want the full meal experience and therefore will order more courses (starter, main and dessert). Almost three-quarters of non meal leavers (71%) just had a main course compared to just over half (54%) of meal leavers. As meal leavers become satiated, however, they choose to leave food rather than order less. The research suggests that meal leavers either inaccurately judge the quantity they are able to eat or are more concerned about having the social experience (of several courses) than leaving food when eating out. The main dish and the accompanying side dishes were the courses most likely to be left; while appetisers, starters and desserts were less likely to be left. The staple foods that were reported left at the end of the meal included chips, vegetables and salad. Chips, vegetables and salad (including garnishes) are seen by some customers as plate fillers rather than part of the meal they ordered. Some do not even consider these food types, especially salad garnishes, to be actual food. Why do consumers leave food when eating out? Food is mainly left because portions are too big. Over half of meal leavers linked leaving food to various aspects of portion sizes. Two-fifths of meal leavers stated that one of the reasons why they had left food was because the portion was too big and one in ten stated they ordered/served themselves too much. Meal leavers who left food because of the portion being too big were more likely to be women and older. The majority of meal leavers knew what the portion size was going to be when ordering; only one in ten asked for information on portion size. Meal leavers do not feel a sense of ownership or responsibility over the food left, do not believe the amount of food they get is within their control and many will not ask for information on portion sizes. The key UK headline that meal leavers felt that their meal size was too much when compared to non meal leavers is supported across the venues. This pattern is less pronounced in staff restaurants and leisure venues and slightly more pronounced when looking at restaurants and pubs Overall, close to three-fifths of respondents are not concerned by leaving food at the end of their meal. Non meal leavers, however, seem to value food more. Amongst respondents who claimed to be concerned about leaving food, non meal leavers were more likely to show a greater degree of concern than meal leavers. Three quarters of concerned non meal leavers stated leaving food was a ‘waste of good food’ compared to three-fifths of concerned meal leavers. In addition to portion size, food quality and social norms were given as reasons for leaving food. About a fifth of meal leavers admitted some sort of responsibility for having left food; namely not liking certain things in the meal and being a fussy eater. Younger respondents were more likely to have given these reasons. 11% of meal leavers claimed that one of the reasons for leaving food was because it had not met their expectations. This included aspects like the food being of poor quality or being cold or having been badly cooked.

Understanding out of home consumer food waste 3
Meal leavers tend to be more influenced by whether others leave parts of their meal and seem to care more about how they are perceived by others than non meal leavers. When asked directly only 11% of meal leavers gave reasons for leaving food that were related to social norms; namely that they thought it was normal to leave a bit of food and that they left food because they did not want to appear greedy. Social norms, however, seem to have a bigger role to play in explaining why customers leave food. When respondents were asked to what extent they agreed or disagreed with the statement ‘When eating out, how much I eat depends on who I’m with’, nearly a quarter of all respondents agreed. Interestingly, meal leavers were more likely to agree than non meal leavers. What can be done to address food waste generated when eating out? When respondents were asked to suggest ideas for reducing plate waste both the quantitative and qualitative findings concur that the solution needs to be centred on offering different portion sizes. When asked to suggest their own ideas about what could be done to help waste less food the most popular proposition was around provision of different portion sizes. Almost two-fifths of respondents stated that a potential solution to reducing plate waste was by addressing portion sizes in terms of choice, size and price When asked about different proposed options the two most favoured were ‘being given the option of smaller portion sizes for a lower price’ and ‘ choice of larger and/or smaller portion sizes for individual part of meals’ – around eight in ten respondents were in agreement with these two suggestions. The results of the qualitative exercise conducted in the discussion groups concur with these findings as the favoured idea was to have ‘smaller meals for a lower price on the menu’. Respondents seemed to be ambivalent about doggy bags. Though over half of respondents claimed to have asked for a doggy bag in the past; two-fifths of respondents agreed with the statement ‘asking for a container to take leftovers home is embarrassing’. Meal leavers (46%) were slightly more likely to agree with this statement than non meal leavers (41%). Furthermore, respondents more generally claimed to need double reassuring: that it is socially acceptable to ask for a doggy bag and that it is safe to consume its contents at home at a later date. Suggestions from research From a technical and behavioural perspective, the key opportunities for tackling food left at the end of a meal are around portion sizes. From a technical point of view, signatories and partners to the H&FSA could prevent food waste by promoting and offering more choice of portion sizes in their outlets especially restaurants, pubs and hotels. Venues could offer different sized main courses as well as different sized side dishes which would give customers more choice and empower them to order ‘the right amount’ thereby reducing plate waste. Eating venues could further train their front of house staff so that they are better able to talk about portion sizes with customers and provide more information on the meals (e.g. ingredients, cooking). The research findings suggest that portion sizes can, at times, be a sensitive subject so discretion and skill need to be used when communicating relevant information to customers.
Understanding out of home consumer food waste 4
WRAP’s continued work with signatories to develop suitable messages around portion sizes and empowering customers to ask for more information will help reduce waste. Tools like an online resource pack where different messages tailored to the specific venue are trialled and tested could offer additional insights into which types of message wording and on what channels (e.g. on menus with/without pictographic aids, on table cards, on specials’ boards, communicated by staff) work best. Such behavioural initiatives would also benefit from a general unobtrusive awareness raising programme on the need to value food, similar to the Love Food Hate Waste campaign for food waste in the home. Customers need to feel empowered to enquire about portion sizes irrespective of whether a venue advertises different portion sizes or not. A social norm needs to be promoted that encourages customers to ask for different portion sizes. Messages in venues (e.g. on menus, table cards, posters) could help communicate the fact that certain requests are encouraged. By addressing the provision and communication of different portion sizes, both technically with industry and behaviourally with staff and customers, a decline in the amount of plate waste can be expected.

Con1.0 I
11
2.0 T22
3.0 L3333
4.0 P444
5.0 D555
6.0 W66
7.0 S77
AckWith paGiorgi, R WRAP wfor cond
ntentsIntroducti1.1 Intro1.2 MethThe profile2.1 Char2.2 CharLeaving fo3.1 Custo3.2 What3.3 Why 3.4 FeeliPortion siz4.1 How 4.2 Porti4.3 KnowDoggy bag5.1 How 5.2 Expe5.3 AttituWhat can b6.1 Spon6.2 PromSummary o7.1 Summ7.2 Sugg
knowlearticular thaRuth Towne
wishes to alducting the
s on and me
oduction ....hodology ....e of dinersracteristics oracteristics oood after aomers who t food is lefis food leftngs and att
zes ...........is the termons are too
wledge and gs .............
is the termerience of doudes towardbe done tontaneous idempted feedbof findingsmary of findgestions from
edgemnks to the Bend and Syl
so thank thquantitative
ethodology..................................
s ...............of those whof the eating meal outleave food
ft?..............? ...............titudes towa................
m portion sizo big ..........experience................
m doggy bagoggy bags .ds doggy bao help redueas for leavback on ideas and suggdings .........m the resea
mentsBrook Lyndhviane Herre
e qualitative fieldwork.
Un
y .................................................................ho eat out ..g out occas..................................................................ards food w.................ze understoo.................
e of portion .................g understoo.................ags ............uce plate wving less fooas for reducgestions fr.................arch ..........
s hurst reseaen.
ve recruitme.
nderstanding o
................................................................................
sion ...........................................................................
waste .........................od? ...........................size ..........................
od? ............................................waste? ....od .............cing plate wrom resear................................
rch team: J
ent agency,
out of home co
................
.................
.................
................
.................
.................
................
.................
.................
.................
.................
................
.................
.................
.................
................
.................
.................
.................
................
.................waste ..........rch .............................................
ayne Cox, D
Criteria, an
onsumer food
.........................................................................................................................................................................................................................................................................................................................................................................................................................................
David Fell, S
nd ICM Rese
d waste 5
.......... 6
.......... 6
.......... 6
........ 10
......... 10
......... 11
........ 12
......... 12
......... 15
......... 17
......... 20
........ 21
......... 21
......... 22
......... 24
........ 26
......... 26
......... 28
......... 29
........ 30
......... 30
......... 32
........ 36
......... 36
......... 37
Sara
earch

1.0 I 1.1 IOver thebehavioand innorecognis To dateaims to As incomconsumproducequick se A very ssnapsho21 tonnparticipahalf a kpart of forder toresearchproduce To tacklService waste aarising wand pre In 2012aimed t Ident
out; Deve
supp
1.2 MThe stu What Who Why What
The maeating o 2 http://ww3 See: http://www0.pdf 4 Sustainabhttp://wwwfood servic
Introducti
Introductione years WR
our change aovation on se and tack
e WRAP has help addre
mes rise anmed outside ed when eatervice resta
small pilot sot of 10 restnes of food wating in theilo of food wfood preparo better assh with biggeed by the ho
le food wasAgreement
and improvewhen eating
eparation).
2 WRAP como: tify consumand
elop researcport consum
Methodologdy addresset is the profleaves fooddo customet can be do
in purpose out; in orde
ww.lovefoodhate
w.wrap.org.uk/s
ble Restaurant Aw.thesra.org/wpce sector plate w
on and me
n RAP has builactivities (inproducts (in
kle the issue
not focussess this gap
d lifestyles of the homting out. Wurants dispo
study run bytaurants bawaste per y
e audit, this waste per dration, arouess the rober sample sospitality an
ste generatet (hereafter e recycling. g out both o
mmissioned
mer barriers
ch suggestiomers in redu
y ed the followfile of custod when eatiers leave fo
one to addre
of the resear to explore
tewaste.com/
/sites/files/wrap/
Association (201p-content/uploawaste refers to
ethodology
lt up a robuncluding thencluding pae of food wa
ed on food and suppor
change thee and, by eRAP researcosed of 0.6
y the Sustaiased in Londyear. Based could mean
diner. While nd a third oustness of t
sizes to bettnd food serv
ed out of hoH&FSA) whWRAP is caon the cons
this current
to and opp
ons for howcing food w
wing researomers who eing out? Onood when eaess food wa
arch was toe these reas
/RSC%20Facts%
10). Too Good tads/2012/02/SRAserved food tha
Un
y
ust evidencee launch of ackaging anaste.
waste genert efforts to
ere is an incextension, ach estimate million ton
inable Restadon, found on the num
n that the aapproxima
of the wastethese resultter quantifyvice sector.
ome, WRAPhich is desigarrying out rsumer side a
t research t
portunities fo
w the Hospitwaste out of
rch questioneat out acron what occaating out?
aste generat
o unpick thesons the res
%20%20Figures
to Waste: RestaRA002-SRA-Foodat remains unea
nderstanding o
e base whicLove Food d labelling)
erated out oo reduce foo
crease in thea likely increed that UK hnes of food
aurant Assothat the ave
mber of covaverage UK tely two thie audited wts WRAP is
y both the v
P has launchgned to supresearch onand the ind
to help supp
or preventin
tality and Fof home.
ns: oss differenasions is foo
ted when e
e reasons wsearch adop
s%20for%20we
aurant Food Wasd-Waste-Surveyaten by custome
out of home co
h has informHate Wasteto help UK
of home andod waste wh
e amount ofease in the ahotels, pubsd waste in 2
ociation (SRerage restaers of the rrestaurant rds was wa
was customecurrently coolume and
hed the Hospport the sen understanustry side (
port the H&
ng food was
ood Service
t venues? od left? Wha
ating out?
why diners lepted a ‘peop
eb%2C%2014%
ste Survey Repo-Full-Report.pdfers.
onsumer food
med both e (LFHW)2 i
K households
d this reseahen eating o
of food and amount of ws, restauran2009.3
RA) using a urant may
restaurants generates n
aste generater plate wasonducting mcost of food
spitality andector to reduding food w(e.g. kitchen
&FSA, this re
ste when ea
sector cou
at is left?
eave food wple-centred
%20Nov%20201
port. f In the hospita
d waste 6
n 2007) s
arch out.
drink waste nts and
produce
nearly ted as ste.4 In more d waste
d Food uce waste n supply
esearch
ating
ld
when
11%20final_
ality and

Understanding out of home consumer food waste 7
approach’. This means that the research first explored how consumers interact with food in terms of what food they buy, where, when, how they eat out and with whom. In effect respondents were asked about their overall eating out experience first. How this experience and the various related behaviours resulted in leaving food when eating out was explored as a secondary effect. The selected approach offers a window into people’s ordinary lives; rather than starting with the target behaviour of wasting less food upfront which tends to result in a more primed sample and more biased findings. The venues which were included in the research were:5 Quick service restaurant (QSRs hereafter) – outlets (fast food or café) which may have
take away or eat-in, or both, and where the customer pays and, generally, collects their food up front – before sitting down or leaving with their food;
Staff restaurant – a cafeteria in a workplace where customers normally use a tray to collect the food they want, pay and then sit down;
Restaurant – outlets with table service and where customers generally pay on departure; Pub – an establishment which primarily sells drinks and, therefore, food sales are less
than 50% of turnover; Hotel – outlets which provide overnight accommodation and where food accounts for less
than 50% of turnover; and Leisure venue – outlets which are located in places where leisure services (e.g.
entertainment or recreational activities) are the prime focus of activity (e.g. a sports centre or club, a theme park, a cinema or a museum).
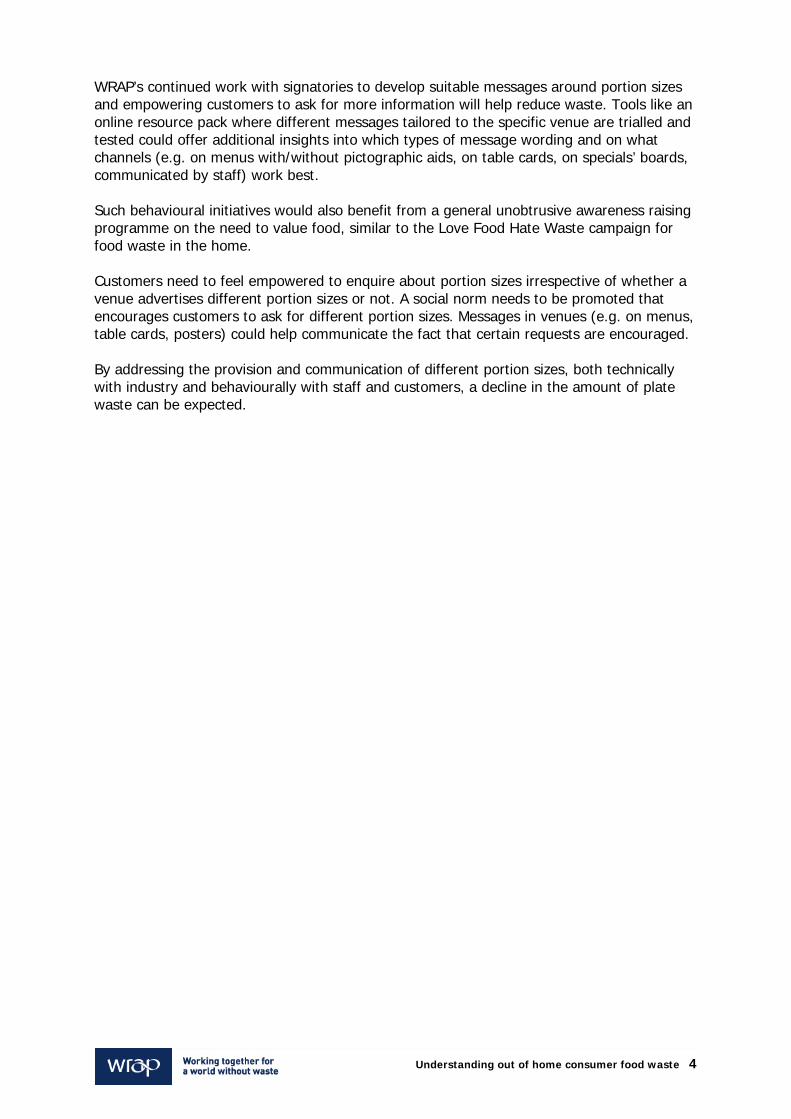
The research was designed to enhance the evidence base around why customers leave food when eating out at the above listed venues.6 Figure 1 overleaf provides details of the different research components: an omnibus7, a quantitative survey and a series of discussion groups.
5 Definitions of these venues draw from Horizons’ definitions: http://www.horizonsforsuccess.com/files/Standard%20Definitions%20and%20Terms.pdf 6 Outlets in education, healthcare and Government services were excluded in this study as users of these facilities could not be surveyed in the same way (i.e. via an online survey). Respondents who eat in schools, hospitals and Government services would need to be targeted directly at specified locations as the incidence of the general population having frequented these venues in the last three months is low. 7 An omnibus in market research is a technique where data on different subjects are collected during the same survey. Ordinarily multiple clients will provide exclusive content for the survey but share the common demographic data collected.
Understanding out of home consumer food waste 8
Figure 1 | Research components
The main quantitative survey was conducted between May 31st and June 15th 2012. This survey was representative of the ‘eating out-of-home public’ in certain UK venues. Respondents were asked to recall and describe their recent (within the last three months) experience of one specific eating out occasion in a certain venue. Approximately 80% of the questions were focused on this specific eating out occasion while the remaining 20% of questions were generic questions not linked to that particular eating out occurrence. There are two main details of the quantitative survey which are worth noting: the hierarchical least-fill approach and the sampling. The sampling was informed by WRAP’s requirement to have equal size samples in each country (with a minimum of 1,100 in each of the nations with the exception of Northern Ireland8) and the need to meet target samples of 500 for each of hotels, leisure venues and staff restaurants, 875 for each of QSR and pubs, and 950 for restaurants. To meet these target samples a hierarchical least-fill method was used in the online questionnaire. This meant that respondents were asked ‘have you eaten at any of the following locations in the past three months?’ and presented with the full list of six venues: QSR, staff restaurant, restaurant, pub, hotel and leisure venue. Where respondents selected multiple eating venues priority was given to venues with the lowest known incidence from the omnibus survey (i.e. respondents were first allocated to their least ‘popular’ selection to ensure that all venues were filled as per the target samples). For example, if a respondent selected ‘leisure venue’ and ‘restaurant’ as venues where they had eaten in the last three months the respondent was then asked to answer the survey recalling and describing their
8 Given the smaller population size and the well-known issues with market research electronic panels in Northern Ireland, a sample of 750 was deemed sufficient.
Omnibus survey
• Purpose: To act as a prequel to the main survey and assess the incidence of eating out by venue for each country so as to inform the weighting frame of the quantitative survey
• Carried out by ICM (for Great Britain) and Milward Brown Ulster (for Northern Ireland)• 10,328 respondents; 9,080 of which ate out • 10 questions
Quantitative survey
• Purpose: To explore the eating out occasion, choice of food, dining experience, food left at the end of the meal, general behaviour when eating out and attitudes towards food left
• 5,183 respondents representative of those who eat out across four countries and six venues • Carried out by ICM via their New Vista online panel• Using a hierarchical least-fill approach (explained below)• 44 questions and socio-demographic details
Discussion groups
• Purpose: To add depth and richness to the initial findings from the quantitative survey on customers’ experience of eating out and leaving food
• 12 discussion groups each lasting 1.5 hours with a total of 113 participants• Country split of groups: 6 England, 2 Northern Ireland, 2 Scotland and 2 Wales• Equal split of groups across venue, income and age
Analysis and reporting

Understanding out of home consumer food waste 9
last meal at the leisure venue rather than at the restaurant. This enabled the target samples of the least frequented venues (like leisure venues) to be filled first. The research focused on the UK, drawing respondents from England, Scotland, Wales and Northern Ireland. Table 1 below shows the numbers of respondents to the online survey by venue allocation and by nation.
Table 1 | Number of respondents interviewed by venue and nation (Base: 5,183) Venue Count Nation Count Restaurant 1,153 England 1,749 Quick service restaurant
1,103 Wales 1,366
Pub 1,098 Scotland 1,251 Hotel 627 Northern Ireland 817 Leisure venue 612 Staff restaurant 590
The venue target quotas originally set were exceeded because additional interviews were conducted to ensure robust sample sizes for gender and age brackets across each of the venues.9 The data used in this report have been weighted to be representative of the UK eating out population10 and the specific venue’s eating out population. The following factors were used in developing the weighting frame: Socio-demographics (gender, age, employment status, socio-economic group); Nation; and Venue allocation and incidence. The survey data was first processed by running a question-by-question topline of the results split by meal leavers and non meal leavers. From emerging patterns, correlations and differences in these results a cross break specification was drawn up listing all the variables selected to form the table columns. A cross break specification allows for the cross-sectioning of data from the individual questions and answer options which in turn allows for comparison. Cross breaks for this study included standard socio-demographic variables such as gender and age and many other variables derived from survey questions such as whether respondents left food or not, what type of meal they had, who they ate with and whether they were concerned about leaving food. ICM Research, who carried out the survey fieldwork, used the software Quantum provided by IBM SPSS to run tables as per the specified cross breaks. They also conducted t-tests on column proportions to establish whether two answers in a cross break set are significantly different11 from each other based on the normal distribution. Each t-test was conducted on independent variables derived from the cross breaks and accounted for the 5% risk level that an event occurred by chance. This significance testing was conducted at a UK level, country level and venue level using the relevant different weighting frames. Additional analysis on the quantitative data was conducted using standard descriptive statistics like
9 These additional interviews were conducted in September – October 2012. 10 The impact of the weighting was accounted for when undertaking statistical testing. For the purposes of statistical significance, an effective base is an indicator of the impact of the weights on the sample. In this UK eating-out-of-home population sample, given the three types of weighting variables, the effective base is 1,970. The weighting efficiency is the ratio of the effective base (1,970) to the sample (5,183). The weighting efficiency for this sample is 38%. 11Measuring the likelihood that an event occurs by chance is the idea behind ‘statistical significance.’ If there is, at most, a five per cent chance (or expressed as ‘at the 95% confidence level’) that two events would happen together it can be inferred that there is a reason that the events occurred together – a pattern or correlation is present.
Understanding out of home consumer food waste 10
multi-variable generation, cross-tabulations and frequencies.12 Throughout this report where there was a statistical difference between two numbers greater than 5% this has been noted in the text. Qualitative data was collected via notes from the facilitators after each discussion group and analysis of verbatim transcripts via researcher coded Excel spreadsheets. This report draws on both the quantitative and qualitative data13 to summarise the UK findings on: The profile of diners; Leaving food after a meal out; Portion sizes; Doggy bags; and What can be done to help reduce plate waste? The next chapter on the profile of diners sets the scene by presenting the type of people who eat out before exploring who leaves food, what food is left and why in Chapter 3. The subsequent two chapters explore participants’ experience of and attitudes towards portion sizes and doggy bags. Before the summary and suggestions, the penultimate chapter is dedicated to investigating what can be done to help reduce plate waste.
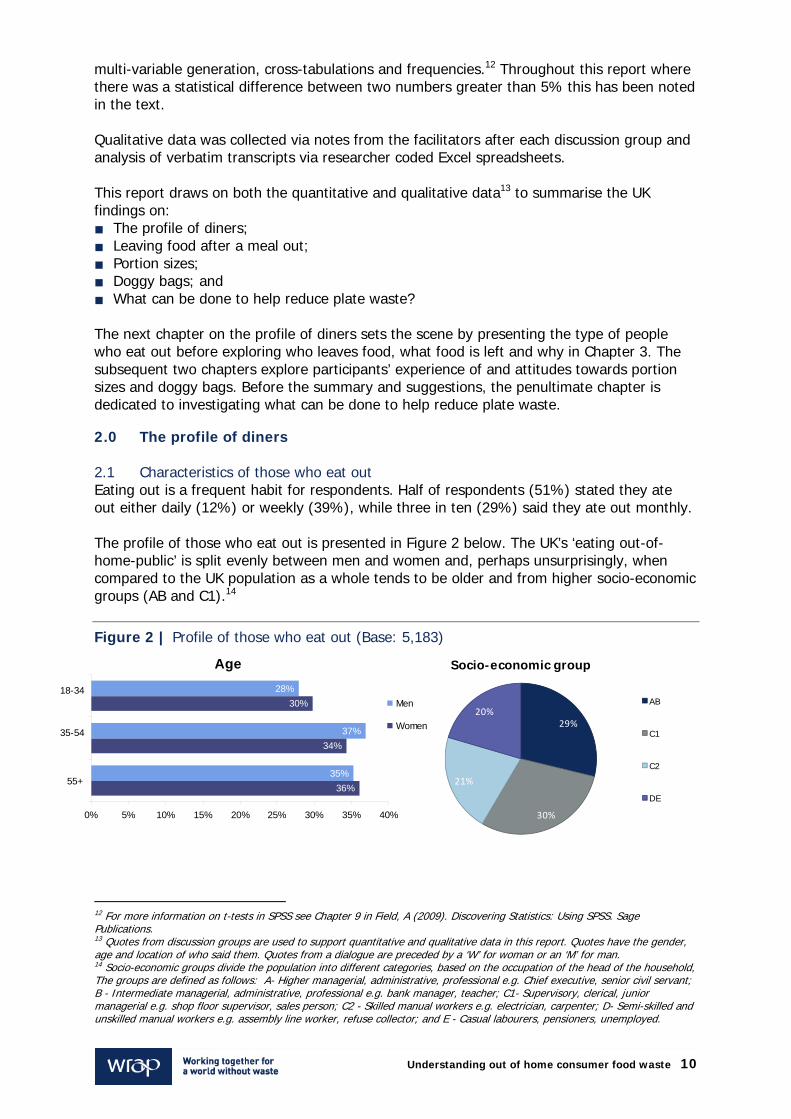
2.0 The profile of diners 2.1 Characteristics of those who eat out Eating out is a frequent habit for respondents. Half of respondents (51%) stated they ate out either daily (12%) or weekly (39%), while three in ten (29%) said they ate out monthly. The profile of those who eat out is presented in Figure 2 below. The UK’s ‘eating out-of-home-public’ is split evenly between men and women and, perhaps unsurprisingly, when compared to the UK population as a whole tends to be older and from higher socio-economic groups (AB and C1).14
Figure 2 | Profile of those who eat out (Base: 5,183)
12 For more information on t-tests in SPSS see Chapter 9 in Field, A (2009). Discovering Statistics: Using SPSS. Sage Publications. 13 Quotes from discussion groups are used to support quantitative and qualitative data in this report. Quotes have the gender, age and location of who said them. Quotes from a dialogue are preceded by a ‘W’ for woman or an ‘M’ for man. 14 Socio-economic groups divide the population into different categories, based on the occupation of the head of the household, The groups are defined as follows: A- Higher managerial, administrative, professional e.g. Chief executive, senior civil servant; B - Intermediate managerial, administrative, professional e.g. bank manager, teacher; C1- Supervisory, clerical, junior managerial e.g. shop floor supervisor, sales person; C2 - Skilled manual workers e.g. electrician, carpenter; D- Semi-skilled and unskilled manual workers e.g. assembly line worker, refuse collector; and E - Casual labourers, pensioners, unemployed.
Age
28%
37%
35%
30%
34%
36%
0% 5% 10% 15% 20% 25% 30% 35% 40%
18-34
35-54
55+
Men
Women 29%
30%
21%
20%
Socio-economic group
AB
C1
C2
DE
Understanding out of home consumer food waste 11
When asked which venues they frequented in the past three months the majority of respondents had eaten at restaurants (82%), QSRs (74%) and pubs (68%). Only a quarter had eaten at a hotel (24%), less than a fifth at a leisure venue (17%) and only 13% had eaten at a staff restaurant. The majority of respondents were describing either a lunch (46%) or an evening meal (36%) they had consumed in the last two weeks (59%). The type of meal (e.g. breakfast, lunch, snack or evening meal) consumed was inextricably linked to the venue frequented by respondents. Across the venues, however, lunches and evening meals were the most described. In QSRs and leisure venues, snacks were also mentioned and in hotels, breakfasts were also described by a sizable minority of respondents. 2.2 Characteristics of the eating out occasion When it comes to the psychological role of eating a meal out, respondents can be split broadly into two categories: those that saw the occasion as a ‘function’ - where the food is seen as fuel to keep them going (44%); and those that saw the meal as a ‘treat’ - where the food is seen as a fun, social occasion shared with friends, partner and/or family (55%).
M: “I think going out for a meal is more than going out for a meal it’s a social thing. W: A social event.
M: It’s a combination of the company, the food, the service, the ambience, the whole package.”
Dialogue, 55+, York “It’s a social thing. I enjoy going out for something to eat with friends, like on a Sunday we
all go for a roast or something like that, altogether.” Woman, 18-34, London
Over a quarter of respondents (28%) spent up to 30 minutes over their meal. About half (53%) spent between 30 minutes to 1.5 hours over their meal while around a fifth (19%) spent more than 1.5 hours over their meal. The majority of respondents (72%) stated they were already familiar with the menu before visiting the venue. Furthermore, 69% of respondents claimed they had eaten in the same venue before and an additional 11% stated they had eaten in another venue of the same chain. Overall, this means that diners tend to be familiar with both the venue and the menu prior to having their meal out. Eating out was most likely to happen in the company of one other person (48%) and often this was a partner, husband or wife. Almost half of respondents (49%) had eaten out with their partner, husband or wife and close to a third (32%) had eaten out only with their partner, husband or wife. Figure 3 illustrates the detail of who people eat out with.

Figure
When itpresentaapproximmeal asRespond Diners aas satisf 3.0 L 3.1 CThe maend of tand ‘nonmeal weend of tclassifiedistribut
15 It is wormeal.
3 |Eating i
t came to raation), tastemately thres good whendents on th
at staff restfaction leve
Leaving fo
Customers win purpose their meal. Tn meal leavere classifietheir meal wed as meal lted across v
rth clarifying tha
in company
ating their me, size of po
ee quarters n it came to
he whole are
aurants andels drop to a
ood after a
who leave fof the reseaTo this end
vers’. Thoseed as ‘meal were categoeavers. Thevenues.
at ‘meal leavers
y (Base: 5,1
meal experieortions, quaof diners fe
o taste and e pleased w
d leisure vearound half.
meal out
food arch was to responden
e that statedleavers’ and
orised as ‘noe graph in F
s’ did not necess
Und
83)
ence for quality of servelt their exp80% when
with their din
nues seeme.
o unpick thents were clad they left pd those thaton meal leaFigure 4 ove
sarily leave a me
erstanding ou
ality (ingredice and valuerience wasit came to
ning experie
ed slightly l
e reasons wssified into
part of theirt claimed thvers’15. Oveerleaf shows
eal but different
ut of home con
dients, cookue for mones positive. 8the size of ence.
ess satisfied
why diners letwo categomeal/food
hey did not erall 27% ofs how meal
t types of food m
nsumer food w
king and ey, on avera82% rated tportions.
d with their
eave food aories: ‘meal
at the end leave food f diners werl leavers are
making up part
waste 12
age, their
r meal
at the leavers’ of their at the re e
t of their

Figure
Hotels, exploredout in a‘re-fuel’to the fathereby When eable to A meal (59%), economprofile omeal lea
4 | Meal le
pubs and red in the foll social setti’. That a dinact that foo
y encouragin
eating out inchoose diffe
leaver can more likely
mic group ABof diners in avers in par
eavers by ve
estaurants howing sectiing are morner eating aod is often inng the mind
n QSR, stafferent portio
be anyone. y to be younBC1 (62%).a particularrticular venu
enue (Base
had bigger ons this pat
re likely to wt a hotel is ncluded in tdset that a c
f restauranton sizes and
At the UK lng (39% weThe profile r venue. Thues.
Und
: 5,183)
proportionsttern suggewaste food more likelythe room pacustomer is
ts and leisurd presumab
level, meal ere 18-34 yeof those we table ove
erstanding ou
s of meal leests that dinthan diners
y to be a meackage ands not technic
re venues, dbly less likely
leavers werear olds) anho leave foo
erleaf outline
ut of home con
avers than ners who ars who are sieal leaver mnot paid fo
cally paying
diners are my to leave fo
re more likend more likeod is very des the make
nsumer food w
other venure enjoying imply eating
may also be or separatelg for it direc
more likely tood.
ely to be woely to be of dependent oe-up of dine
waste 13
es. As a meal g out to linked y,
ctly.
to be
omen socio-
on the ers and

Table 2 Resta(Base: Resta(Base: Pub d(Base: Pub m(Base: QSR d(Base: QSR m(Base: Hotel (Base: Hotel (Base: Leisur(Base: Leisurleaver(Base: Staff r(Base: Staff rleaver(Base:
The oveWomen(except youngerare lessrestauraexceptiothese ve Those wto snackoften co Furthermothers tfood whdifferenClose to
16 If row pesome percblue equat
2 | Diner pr
urant dine1,153)
aurant mea: 341) iners 1,098)
meal leaver: 355) diners
1,103) meal leave: 197) diners 627)
l meal leav: 221) re venue d612)
re venue mers : 150) restaurant590)
restauranters : 144)
erarching na are more lat leisure v
r customerss likely to leaants have aon of those enues.
who left fook or graze dompared to
more, respoto leave foohen eating ace is statist
o a fifth of m
percentages do ncentages may onte to less than 1
rofile and m
ers
al leavers
ers
ers
vers
diners
meal
t diners
t meal
arrative at tikely to leavvenues and s (18-34 yeaave food at less distincover 55 ye
od at the enduring the d50% of no
ondents whod generallya meal cooktically signifmeal leavers
not add up to 10nly represent a 100 respondents
meal leaver Ge
Men
48%
39%
51%
46%
48%
33%
54%
47%
50%
52%
57%
63%
the UK levelve food at tstaff restau
ar olds) to bt the end of ct age profilars of age,
d of the meday generaln meal leav
o had left foy. For exampked at homeficant. This s (18%) sta
100% this is duesmall number o
ts; cells highlight
Und
profile by vnder
Women
52%
% 61%
49%
% 54%
52%
% 67%
46%
% 53%
50%
% 49%
43%
% 38%
l is supportethe end of turants). Simbe meal leaf their meal.le and may potentially
eal describely. 58% of vers.
food on thisple, 27% ofe comparedcontinues tated that th
e to rounding. Gof respondents ahted in dark blue
erstanding ou
venue16
18-34
28%
% 38%
29%
% 42%
33%
% 39%
30%
% 40%
42%
% 46%
46%
% 58%
ed by the dtheir meal amilarly, thereavers across. Meal leavecome frombecause th
ed in the qumeal leaver
s occasion wf meal leaved to 18% ofo be true wey often lef
Given the small band should be ue with a white fo
ut of home con
Age 35-54
38%
23%
36%
30%
38%
32%
33%
29%
36%
45%
42%
33%
etail behindacross most e is a strongs all venuesers in leisure all age braey are less
estionnaire rs claimed t
were also moers stated thnon meal l
when eating ft food whe
base of meal leaused with cautioont equate to le
nsumer food w
55+
34%
% 39%
36%
% 27%
28%
% 28%
38%
% 30%
22%
% 9%
11%
% 9%
d each venu venue typeger propens. Older custe venues an
ackets with likely to fre
were moreto snack or
ore likely thhat they oftleavers – thout genera
en eating a m
avers in some von. Cells highlighess than 50 resp
waste 14
%
%
%
%
%
%
ue. es sity for tomers nd staff the equent
e likely graze
han ten left
his ally. meal
venues, hted in light pondents.

out servmeal lea 3.2 WThe maCustomdecide wto leavethirds ostated t Almost than a tstated letypes le The stobe left i Figure
The quathat thevegetaborderedtypes to
17 All food www.istoc
ved at the tavers.
What food iin dish and ers seem towhether ande space for df meal leavethey left par
half (46%) third of noneaving chip
eft at the en
ry of what gn QSRs (45
5 | Food le
antitative finey tended tobles, salad ad but came ao be the ma
types that were
ckphoto.com
able (not bo
s left? the accom
o assess cosd what partdessert anders (63%) srt of their si
of meal lean meal leaveps (32%) annd of the me
gets left is s5%) and pu
eft (Base all
ndings are so leave carband garnishautomatical
ain part of t
e mentioned by
ought at a c
panying sidsts, value at of their med for being tsaid they leide order.
avers ordereers (29%). Tnd vegetableeal.
similar acrobs (38%).
those who
supported bbohydrates es. These telly with theiheir meal.
y 5% of meal lea
Und
counter or s
des are the nd what theeal they watoo full from
eft part of th
ed more thaThose that es (18%).
oss the venu
left food: 1
by the quali(mainly chiended to beir meal; par
avers or more ha
erstanding ou
self-service)
parts of theey actually ant to leavem having eaheir main m
an just the mleft food atFigure 5 be
ues, though
1,387)17
tative insighps, potatoee food typerticipants di
have been includ
ut of home con
) compared
e meal whicordered/wa. Mains app
aten the stameal and nea
main course the end of
elow lists the
chips are e
hts where ps, rice and s that wered not consid
ded in the graph
nsumer food w
d to only 3%
ch get left. ant/paid for pear to be sarter. Almosarly a fifth (
e comparedf their meal e different f
even more l
participants bread),
e not directlydered these
h. Source of pho
waste 15
% of non
to acrificed t two (17%)
d to less mainly food
likely to
stated
y e food
otos:
Understanding out of home consumer food waste 16
“They’re [chips] not the central; they’re not the part of the dish that made you pick that dish generally. You don’t think steak and chips, I’m having that because of the chips and that
that comes along with it, that’s extra.” Man, 18-34, Norwich
M: “I prefer to eat the meat and leave your veg and chips you know.
W: That’s what I do too.” Dialogue, 34-54, Belfast
“I always leave the grass.”
Man, 18-34, Norwich
Chips, vegetables and salad are seen by customers as ‘plate fillers’ rather than part of the meal they ordered. Some participants did not even consider these food types, especially salad garnishes, to be intended for consumption. “In restaurants you order a meal and it’s the chips or the rice or whatever is piled on to sort of fill the plate up and so you actually get a bit disappointed because you can’t finish them.”
Woman, 35-54, London
“I’d leave the salad if it looked, you know like when people they put like a main together and they’ll put salad just for kind of decoration but it doesn’t look too appealing, I wouldn’t eat it
just for the sake of the fact that it’s on my plate.” Woman, 18-34, London
“The lettuce leaves some people see it as garnish as opposed to something you can actually
eat.” Woman, 18-34, Norwich
Despite diners leaving sides of chips, vegetables and salad, when asked to what extent they agreed or disagreed with the statement ‘I prefer side orders (e.g. portion of chips, side of salad) to be included in the price of my main meal’ the majority agreed (69%). In the majority of cases only small portions of the serving were left, with the exception of instances where the serving was deemed to be too large or if it was not liked. In some cases the bulk of a dessert or starter may be left. The findings from the qualitative research suggest that this may be due to not being able to forfeit the idea of having ‘something sweet’. With regards to starters some mentioned leaving a large amount when they are planning to eat a large main.
“I would always order a dessert but I may only need that wee bit of something sweet.” Woman, 35-54, Belfast
“…Because I’m so full from a main meal but I can’t resist that pudding.”
Woman, 55+, York
Chips, vegetables and salad tended to get left because they were not considered to be “proper food” or the main part of the meal; and also because they were the cheapest part of the meal. Participants tended to make a judgement about the value of the different meal components and stated that leaving chips, vegetables and salad did not make them feel too guilty, especially because these tended to be the least expensive part of the meal.
“Bu
that’s [tend
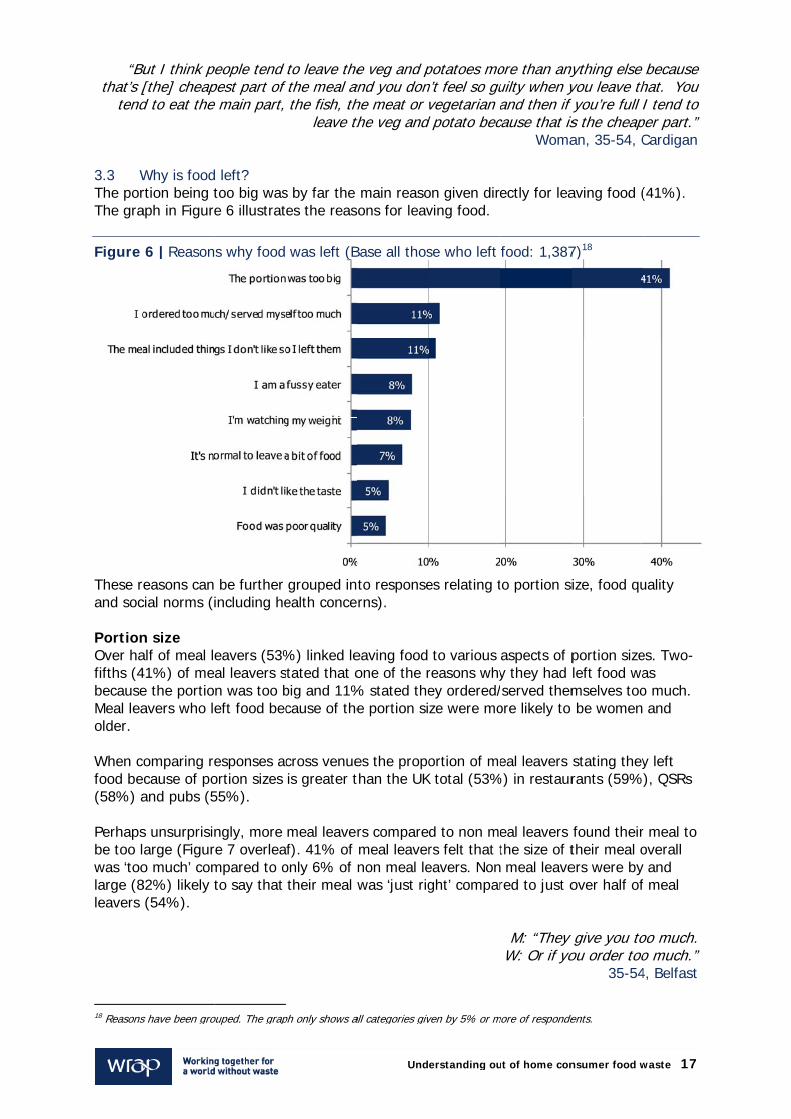
3.3 WThe porThe gra
Figure
These rand soc PortionOver hafifths (4becauseMeal leaolder. When cfood be(58%) a Perhapsbe too lwas ‘toolarge (8leavers
18 Reasons
But I think pe[the] cheapd to eat the
Why is foodrtion being taph in Figure
6 |Reason
easons cancial norms (i
n size alf of meal le41%) of mee the portioavers who le
omparing recause of poand pubs (5
s unsurprisinarge (Figuro much’ com82%) likely t(54%).
s have been gro
people tend pest part of e main part,
d left? too big wase 6 illustrat
s why food
be further including he
eavers (53%al leavers sn was too beft food bec
esponses acortion sizes 55%).
ngly, more re 7 overleampared to oto say that
ouped. The grap
to leave thef the meal an
the fish, thleave th
s by far the es the reaso
was left (B
grouped intealth conce
%) linked letated that obig and 11%cause of the
cross venueis greater t
meal leaverf). 41% of
only 6% of ntheir meal w
ph only shows al
Und
he veg and pand you donhe meat or vthe veg and
main reasoons for leav
Base all thos
to responserns).
eaving food one of the r% stated thee portion si
es the propothan the UK
rs comparedmeal leavernon meal lewas ‘just rig
all categories giv
erstanding ou
potatoes mon’t feel so guvegetarian a
d potato bec
on given direving food.
se who left
es relating t
to various reasons whyey ordered/ze were mo
ortion of meK total (53%
d to non mers felt that teavers. Nonght’ compar
ven by 5% or m
ut of home con
ore than anyuilty when yand then if y
cause that isWoma
ectly for lea
food: 1,387
to portion si
aspects of py they had /served themore likely to
eal leavers %) in restaur
eal leavers the size of t meal leavered to just o
M: “They W: Or if yo
more of responde
nsumer food w
nything else you leave thf you’re full Iis the cheapan, 35-54, C
aving food (
7)18
ize, food qu
portion sizeleft food wamselves toobe women
stating theyrants (59%
found theirtheir meal oers were by over half of
give you toou order too
35-54
ents.
waste 17
because hat. You I tend to
per part.” Cardigan
(41%).
uality
es. Two-as o much. and
y left ), QSRs
r meal to overall and
f meal
oo much. o much.” 4, Belfast

Understanding out of home consumer food waste 18
Figure 7 |Perception of overall meal size19
The key UK headline that meal leavers felt that their meal size was too much (41%) when compared to non meal leavers (6%) is supported across the venues. This pattern is less pronounced in staff restaurants and leisure venues and slightly more pronounced when looking at restaurants and pubs. This pattern is also supported when comparing how full meal leavers and non meal leavers felt at the end of the meal. Two-thirds (67%) of meal leavers stated they were full at the end of the meal compared to only one third (33%) of non meal leavers. Only 28% of meal leavers stated they felt neither full nor hungry at the end of their meal compared to 55% of non meal leavers. Again this pattern of meal leavers feeling more satiated than non meal leavers is sustained across the venues. It is worth noting that it is particularly acute in pubs and restaurants where 74% of meal leavers felt full; compared to 41% and 37% of non meal leavers respectively. Leaving food because the portions were perceived to be too big often came up in the discussion groups. Overly large portions were given as a reason for leaving food more often when eating in pubs or when eating what was considered low quality food. In addition, participants who stated that the reason they left food was because the portion was too big were often older. Food quality Food quality was given as a reason for leaving food. This encompasses both the personal ‘I’m a selective eater’ angle (where the responsibility is perceived to lie mainly with the customer) as well as the ‘food did not meet my expectations’ angle (where the responsibility is thought to lie with the venue). About a fifth of meal leavers (21%) admitted some sort of responsibility for having left food; namely not liking certain things in the meal (11%) and being a fussy eater (8%). Younger respondents were more likely to have given these reasons. Approximately one in ten meal leavers (11%) claimed that one of the reasons for leaving food was because it had not met their expectations. This included aspects like the food being of poor quality or being cold or having been badly cooked.
19 Those that stated ‘don’t know’ have not been presented in the graph therefore percentages may not add up to 100%.
15%
41%
6%
74%
54%
82%
10% 5%13%
0%
10%
20%
30%
40%
50%
60%
70%
80%
90%
100%
Total(Base: 5,183)
Meal leaver(Base: 1,387)
Non meal leaver(Base: 3,796)
Not enough
Just right
Too much
Understanding out of home consumer food waste 19
In staff restaurants and leisure venues more meal leavers felt that the food did not meet their expectations (27% for restaurants and 22% for leisure venues compared to 11% overall). “With fast food in particular...food just doesn’t taste nice after 15, 20 minutes or so the chips are cold, they’re just a bit rubbery and it’s dry, so the food quality isn’t as nice which is why I
think a lot of people leave it.” Woman, 35-54, London
“In terms of the bun or the crust or something it’s the bit that’s filling but doesn’t taste all
that so you leave that to make sure you’ve got room for the stuff that tastes good.” Man, 18-34, Norwich
Social norms Health and other reasons were given as grounds for leaving food by 14% of meal leavers; this includes 8% stating that they are watching their weight. When asked directly only 11% gave reasons for leaving food that were related to social norms; namely, 7% thought it was normal to leave a bit of food and 3% did not want to appear greedy. Beneath the surface, however, social norms seem to have a bigger role to play in explaining why customers leave food. Overall around a fifth (22%) of respondents said that other people in their party left food at the end of the meal. However, this increases to almost two-fifths (39%) when looking at meal leavers and decreases to three in twenty (15%) when looking at non meal leavers. The qualitative insights support the finding that social norms can explain part of the reasons why customers leave food. Participants stated that whether you are dining with people you feel comfortable or not influences what you order and whether you leave food. “If I’m with people I don’t know I feel I’ve got to eat really sensibly. I will have room to fit it
in but then I don’t want to finish my plate completely because they’ll think oh fatty.” Woman, Norwich, 18-34
“I think if you’re out with family, whether there’s children or your parents or your brother or
sister, whatever, I think you talk more about and you’ll say don’t order extra I couldn’t eat it, but if you’re out with colleagues or friends or something it’s not really your place to tell them
what they can or if it’s maybe going to be too much for them.” Woman, 35-54, Belfast
When respondents were asked to what extent they agreed or disagreed with the statement ‘When eating out, how much I eat depends on who I’m with’, nearly a quarter of all respondents agreed (23%). Interestingly, 28% of meal leavers compared to 21% of non meal leavers agreed - this difference is statistically significant. Furthermore, when respondents were asked to what extent they agreed or disagreed with the statement ‘When I eat out, I’d rather leave food than appear to be greedy’, overall just over one in ten respondents agreed (13%). However, only 11% of non meal leavers agreed compared to 19% of meal leavers - this difference is statistically significant. Meal leavers seemed to be more affected by what others do and how others perceive them when eating which appears to, in part, explain why they left food at the end of their meal.

Understanding out of home consumer food waste 20
3.4 Feelings and attitudes towards food waste Overall, close to three-fifths of respondents are not concerned by leaving food at the end of their meal – 56% are not that concerned when being served at the table and 58% when buying food at a counter or self-service. Figure 8 illustrates how meal leavers’ and non meal leavers’ perceptions on leaving food differ. The difference between the meal leavers and non meal leavers with regards to not being that concerned about leaving food is statistically significant in both eating situations (when being served at the table and when buying from a counter or self-service).
Figure 8 | Extent to which respondents are bothered by leaving food (Base: 5,183)20
When asked why they were bothered21 respondents mainly stated that leaving food was ‘a waste of good food’ (72%) or ‘a waste of money’ (72%). Meal leavers who stated they were bothered about leaving food were less bothered about these factors when compared to non meal leavers who stated they were concerned about food waste. Three quarters of ‘bothered’ non meal leavers (76%) stated ‘It’s a waste of good food’ compared to three-fifths (62%) of ‘bothered’ meal leavers – this difference is statistically significant. The same pattern is true for ‘It’s a waste of money’ where 76% of ‘bothered’ non meal leavers offered this reason compared to 63% of ‘bothered’ meal leavers again this difference is statistically significant. Two-fifths of those that are not bothered22 stated that this was either because they ‘would rather leave food than eat too much (feel ill/put on weight)’ (39%) or because they ‘paid for it so it’s up to me if I want to leave some food’ (38%). Meal leavers who were not bothered were slightly more likely to give these reasons than non meal leavers who were not bothered. 20 Bothered in this instance is defined by respondents who selected that they were bothered ‘a great deal’ and ‘a fair amount’ by leaving food at the end of a meal. ‘Not that bothered’ in this instance is defined by respondents who selected that they were bothered ‘a little’, ‘not very much’ and ‘not at all’ by leaving food at the end of a meal. Percentages do not add up to 100% because respondents who selected ‘never leave food’ or ‘not applicable’ have been excluded from the graph. 21 Those routed to this question included all respondents who selected either ‘a great deal’, ‘a fair amount’ or ‘a little’ when asked ‘how much, if at all, does it bother you if you leave food at the end of a meal’. 22 Those routed to this question included all respondents who selected that they were bothered ‘not very much’ or ‘not at all’ when asked ‘how much, if at all, does it bother you if you leave food at the end of a meal.’
53%
66%
55%
66%
33%
31%
28%25%
0%
10%
20%
30%
40%
50%
60%
70%
80%
90%
100%
Non meal leaver Meal leaver Non meal leaver Meal leaver
When being served at a table When buying food at a counter or self-service
Bothered
Not that bothered
Understanding out of home consumer food waste 21
The qualitative insights support the survey results. When discussion group participants were asked about their feelings around food waste there was a lot of indifference and some elements of feeling guilty over leaving food. Some mentioned feeling ‘bad’ mainly because they thought leaving food was ‘wasteful’ - a ‘waste of money’ or a ‘waste of effort’ (e.g. in cooking or preparation).
W:” You think the restaurateur would notice wouldn’t you [if a lot of food was being
wasted]. W: He would say 'I’d rather people go from here full' but we go from here feeling guilty
because there’s always food being wasted.” Dialogue, 35-54, Cardigan
“Because someone has spent time cooking it and it’s just wasted. It’s just a waste.”
Woman, 18-34, Norwich
Three-quarters of respondents (74%), in principle, agreed with the statement ‘We should all try harder not to waste food when we eat out’. The bottom line, however, is that the majority of diners do not want to think about food waste when they are enjoying a meal out. When eating out the issue of food waste is not something which is front of mind and customers do not want to engage with it. Three-fifths of respondents (59%) agreed with the statement ‘I don’t want to have to think about leaving food when I eat out’. “I think as long as I’m full or happy with what I’ve had, I’ve enjoyed it, if I leave some then I
leave it.” Woman, 18-34, Norwich
Both the qualitative and quantitative research suggests that diners still remember being taught to clear their plate and believe it is part of their cultural upbringing. Overall, three-fifths (61%) of respondents agreed with the statement ‘When I eat out I always like to clear my plate’. Unsurprisingly two-thirds of non meal leavers (66%) agreed with this statement compared to close to half (47%) of meal leavers – this difference is statistically significant.
“I was always taught by my parents, you must eat it it’s a waste if you don’t eat your food they would say to me so that’s probably where I get that from.”
Man, 18-34, Norwich
4.0 Portion sizes 4.1 How is the term portion size understood? As portion size featured so prominently in the quantitative research it was probed at length in the qualitative research in an attempt to better understand its importance. The image in Figure 9 overleaf represents the different words, language and images which discussion group participants used when asked what ‘portion sizes’ means to them.
Understanding out of home consumer food waste 22
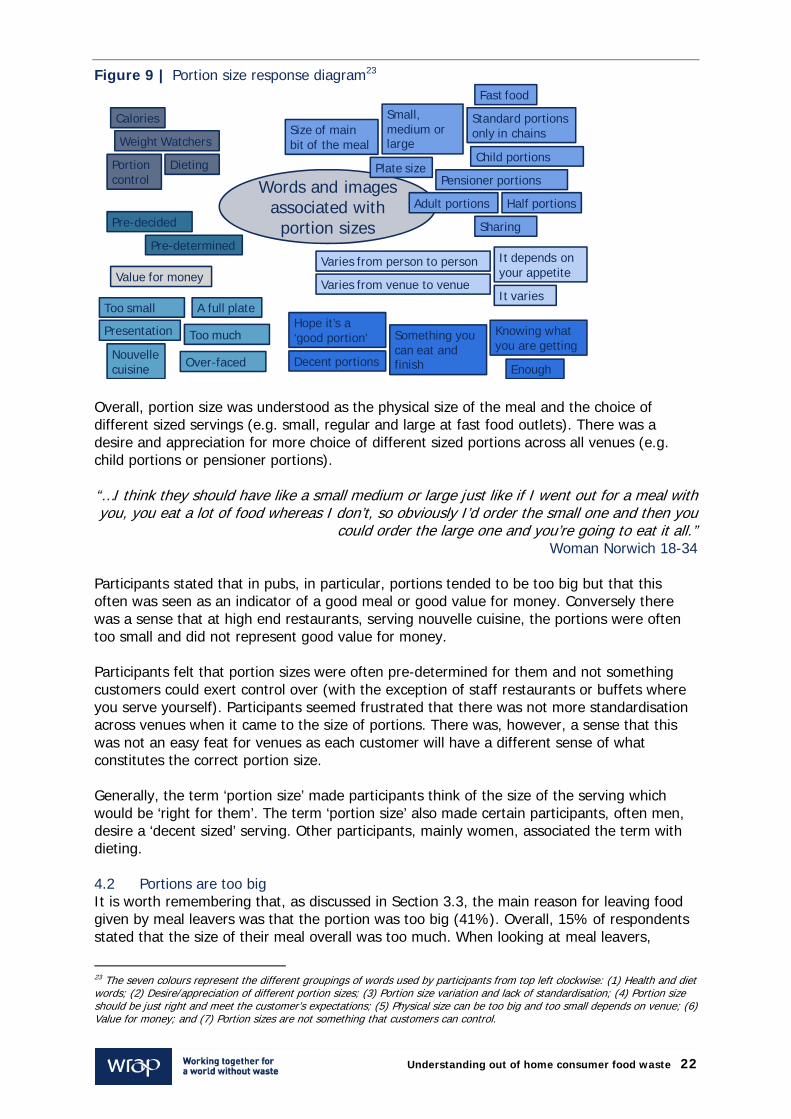
Figure 9 | Portion size response diagram23
Overall, portion size was understood as the physical size of the meal and the choice of different sized servings (e.g. small, regular and large at fast food outlets). There was a desire and appreciation for more choice of different sized portions across all venues (e.g. child portions or pensioner portions). “…I think they should have like a small medium or large just like if I went out for a meal with you, you eat a lot of food whereas I don’t, so obviously I’d order the small one and then you
could order the large one and you’re going to eat it all.” Woman Norwich 18-34
Participants stated that in pubs, in particular, portions tended to be too big but that this often was seen as an indicator of a good meal or good value for money. Conversely there was a sense that at high end restaurants, serving nouvelle cuisine, the portions were often too small and did not represent good value for money. Participants felt that portion sizes were often pre-determined for them and not something customers could exert control over (with the exception of staff restaurants or buffets where you serve yourself). Participants seemed frustrated that there was not more standardisation across venues when it came to the size of portions. There was, however, a sense that this was not an easy feat for venues as each customer will have a different sense of what constitutes the correct portion size. Generally, the term ‘portion size’ made participants think of the size of the serving which would be ‘right for them’. The term ‘portion size’ also made certain participants, often men, desire a ‘decent sized’ serving. Other participants, mainly women, associated the term with dieting. 4.2 Portions are too big It is worth remembering that, as discussed in Section 3.3, the main reason for leaving food given by meal leavers was that the portion was too big (41%). Overall, 15% of respondents stated that the size of their meal overall was too much. When looking at meal leavers,
23 The seven colours represent the different groupings of words used by participants from top left clockwise: (1) Health and diet words; (2) Desire/appreciation of different portion sizes; (3) Portion size variation and lack of standardisation; (4) Portion size should be just right and meet the customer’s expectations; (5) Physical size can be too big and too small depends on venue; (6) Value for money; and (7) Portion sizes are not something that customers can control.
Words and images associated with portion sizes
DietingPortion control
Weight Watchers
Value for money
Plate size
Presentation
Varies from venue to venue
Child portions
Pensioner portions
Adult portions
Hope it’s a ‘good portion’
Small, medium or large
Varies from person to person
Standard portions only in chains
It varies
Size of main bit of the meal
Decent portions
It depends on your appetite
Fast food
Nouvelle cuisine
Knowing what you are getting
Pre-decided
Pre-determined
Over-faced
Too much
Half portions
Calories
A full plate
Enough
Sharing
Something you can eat and finish
Too small

howevemuch coclaimed This pattoo largmeal leavenue. Those tmeal. Dsize of tvenues people (
Figure
In addit(52%), comparestaff resrestaura It wouldyoungerrespondknow thinaccura
24 All perce
er, this increompared to that the siz
ttern holds ge particularavers and n
hat found tDiners, as dethe meal to where the s(over 55) a
10 | Meal
tion to findirestaurantsed to dinersstaurants (3ants (74%)
d be fair to r) eating padents (70% he size of thate judgeme
entages in this g
eases to twoo only one inze of their m
true acrossrly in restaunon meal lea
he portionsescribed in Sbe too mucshare of melso claimed
leavers and
ng the overs (48%) ands who ate in30%). Furthclaimed to
conclude tharticularly inof non mea
he portion, hent or unwi
graph represent
o in five resn twenty (6meal overal
s the six diffurants and pavers that f
s too big tenSection 3.1,ch, tended teal leavers wthat the siz
d non meal
rall size of td hotels (49n quick servhermore, thbe full at th
hat portion sn pubs, restal leavers, 6however, paillingness to
t less than 100 r
Und
spondents (%) of non l was ‘just r
ferent venupubs. Figurefound the m
nded to be t, who left foto be womewas larger ze of the m
leavers tha
the meal to 9%) were mvice restaurree quarterhe end of th
sizes for metaurants and65% of meaart of the eo ask for som
respondents exc
erstanding ou
41%) statinmeal leaverright’ despit
es with meae 10 overlea
meal size ove
those that lood at the een and of th(hotels, pubeal overall w
at found the
be too mucmore likely trants (33%)rs of meal leheir meal.
eal leavers d hotels areal leavers) wxplanation mething dif
xcept for meal le
ut of home con
ng that theirrs. While 54te having le
al leavers fiaf illustrateserall too mu
eft food at end of the mhe younger bs and restawas too mu
e meal too m
ch, diners wto feel full a), leisure veeavers in pu
(who tend te too large. when orderihas to be a fferent.
eavers in pubs a
nsumer food w
r meal was 4% of meal eft some of
inding portis the propouch across e
the end of meal and foage bracke
aurants), oluch.
much by ve
who ate in pat end of theenues (32%ubs (74%) a
to be womeGiven that ing claimed customer’s
and restaurants.
waste 23
too leavers it.
on sizes ortion of each
the ound the ets. In der
nue24
pubs eir meal ), and and
en and 69% of
d to s

Understanding out of home consumer food waste 24
When asked whether respondents had ever done any of the following about a third of meal leavers (35%) stated they had asked for advice on portion size compared to less than three in ten (27%) of non meal leavers – this difference is statistically significant. When it came to asking for a smaller portion about two-fifths (42%) of meal leavers had asked for a smaller portion compared to less than three in ten (27%) of non meal leavers - this difference is statistically significant. Meal leavers are also significantly more likely to have let someone else help them finish their food. 71% of meal leavers compared to 55% of non meal leavers – this difference is statistically significant. Table 3 below illustrates what different meal components meal leavers consumed compared to non meal leavers. The figures suggest that non meal leavers are not particularly good at judging how many courses they are able eat or that they prioritise having the ‘full eating out experience’ over leaving some food at the end of the meal.
Table 3| Courses ordered25 Meal component Total
(Base: 4,867) Meal leaver (Base: 1,306)
Non meal leaver
(Base: 3,561) Starter, main and dessert
11% 15% 9%
Starter and main 11% 15% 9% Main and dessert 12% 15% 12% Main only 66% 54% 71%
Almost three-quarters of non meal leavers (71%) just had a main course compared to just over half (54%) of meal leavers. This would suggest that meal leavers are also more likely to order more than a single course.
W: “You’re ordering a starter and then a main course and you can’t eat your main course.
M: And then you always make room for a pudding.” 18-34, London
“Yes, I never eat all my dessert.”
Woman, 35-54, Belfast
4.3 Knowledge and experience of portion size Over two-thirds (69% in total: 70% of non meal leavers; 65% of meal leavers) of diners claim they already know the portion size of their meal when ordering. Despite this familiarity, 41% of meal leavers state that the reason they left the food was because the portion was too big. Less than a third of diners (31%) stated that there was a choice of portion size when they ordered their meal. Almost three-fifths (57%) of respondents eating at QSRs felt there was a choice of portion size. Conversely, in pubs, restaurants and hotels the proportion of respondents that felt that there was a choice of portion size is smaller.26 Approximately one in five respondents eating
25 Bases are all respondents excluding those that did not consume a main meal, i.e. they exclude respondents who only consumed a starter or sides or appetisers or drinks or snacks. 26 This aligns well with tonnage estimates on the food waste disposed by the UK Hospitality sector where pubs and restaurants were found to be the venues which disposed of more food waste in absolute and per meal terms. See: WRAP (2011). The Composition of Waste Disposed of by the UK Hospitality Industry.
Understanding out of home consumer food waste 25
in restaurants (22%) and pubs (21%), and around one in ten respondents eating in hotels (13%) felt there was a choice of portion size. Overall, very few respondents (5%) asked for information on portion size and even fewer respondents had been advised by staff on portion size (4%) on this meal occasion. In staff restaurants and leisure venues, where perhaps there is more personal familiarity between customer and staff, slightly more diners asked for information on portion size: 13% in staff restaurants and 8% in leisure venues. Interestingly, though staff did not offer advice on portion size they did ask diners whether they wanted sides or extras (38%) and whether they were interested in the specials (16%). Staff were more likely to have asked whether customers wanted sides or extras in those venues where portion sizes were too large. Around two-fifths of diners in restaurants (42%), pubs (42%) and hotels (41%) had been asked by staff if they wanted sides or extras compared to less than a third in staff restaurants (28%) and leisure venues (29%), and just over a third in QSRs (35%). In hotels, pubs and restaurants staff members were also more likely to have suggested specials than in other venues. Front of house staff in certain venues may be required to offer sides and extras or suggest specials as part of their job description or receive premiums for doing so. Informing customers about portion sizes is unlikely to be part of staff’s job description. The majority of diners do not tend to ask for information on portion size. When respondents were asked about whether they had ever asked for advice on portion size 29% said they had. Meal leavers were slightly more likely to have asked for information on portion size at 35% compared to non meal leavers at 27% - this difference is statistically significant.
Less than a third (31%) of respondents claimed to have ever asked for a smaller portion. Meal leavers were more likely to have asked for a smaller portion at 42% compared to 27% of non meal leavers – this difference is statistically significant. When it comes to portion sizes, respondents seem anxious to ask for fear of unduly troubling staff. Drawing from both the quantitative and qualitative data, the sensitivity of the topic (its link to dieting, eating too much and obesity) may further discourage customers to voice their questions on portion sizes. When eating out meal leavers may be more concerned with enjoying the experience of their meal than worrying about ordering/getting too much food.
On the few occasions where participants in the discussion groups had mentioned saying something about portion sizes, it tended to be at the end of the meal. This was often when staff, clearing the table and noticing some leftovers, had asked whether everything was ok. In these situations diners may delicately say that it was all fine but that it simply was too much.
“I don’t think I’d ask for different portion sizes because that’s just seems really picky” Woman, 18-34, London
“We’re often out in a restaurant and my wife will maybe shovel a few things over to me that she didn’t eat and makes us look like we both left a little bit, not a lot, so we don’t offend. I know it’s a silly thing but we’ve enjoyed it, we just couldn’t manage, so just do a wee bit of
reshuffling when nobody’s looking.” Man, 55+, Edinburgh
http://www.wrap.org.uk/sites/files/wrap/The_Composition_of_Waste_Disposed_of_by_the_UK_Hospitality_Industry_FINAL_JULY_2011_GP_EDIT.54efe0c9.11675.pdf

Understanding out of home consumer food waste 26
Large portions of food were thought to be off putting by 44% of diners. Three-fifths of meal leavers (57%) stated they found large portions of food off-putting compared to only two fifths of non meal leavers (39%) – this difference is statistically significant. Older respondents were more likely to agree with this statement compared to younger respondents. 31% of 18-24 year olds agree with this statement compared to 42% of 45-54 year olds; 52% of 55-64 year olds; and 58% of over 65 year olds – these differences are all statically significant. Women, furthermore, were more likely to think that large portions were off putting than men – 54% compared to 33%. Men, in particular younger men, in discussion groups expressed a strong male bravado when it came to their relationship with food and not being defeated by its quantity. Several used military style language to describe their interaction with the food they ordered (e.g. plan of attack, to plough through, a battle, etc.).
“I don’t know, you’d want to know beforehand so you could plan your attack.” Man, 35-54, Cardigan
“If the meal’s a challenge I’ll think I’ll get through that come what may.”
Man, 55+, York
Overall, large portion sizes are a concern particularly for meal leavers. Diners on the meal out described in the survey did not ask for information on portion size and, generally, appear to feel uncomfortable doing so. 5.0 Doggy bags 5.1 How is the term doggy bag understood? The image in Figure 11 overleaf represents the different words, language and images which discussion group participants used when asked what ‘doggy bags’ means to them.

Understanding out of home consumer food waste 27
Figure 11 |Doggy bag response diagram27
By and large discussion group participants understood the term doggy bag to mean food that can be taken home which is not necessarily for the dog. However, some participants did understand the term to mean strictly food that was taken home for the dog. Participants disliked the term and found it slightly derogatory. When invited to propose alternatives suggestions included ‘leftover hamper’ and ‘take out bag’.
W: “No, I think that sounds dirty, to me, that’s only me. M: It doesn’t sound very good really, doggy bag to go.”
Dialogue, 18-34, Norwich Participants associated doggy bags with food which already had an established norm of being consumed as take away (e.g. Chinese cuisine, Indian cuisine and pizza). The only other food type considered to be worth taking home was substantial pieces of meat.
“I don’t know, you’d eat it or leave it. But if you are going to take it home, put it in a napkin, and you wouldn’t ask to have a little bag or a box unless it was Pizza Hut and you’d
have pizza left. You’d ask for a box.” Man, 18-34, Norwich
Most discussion groups pointed out how in the United States doggy bags were the norm and staff members would ask customers, as a matter of course, whether they wanted to take their leftovers home. Discussion group participants felt that they would only be willing to take food home which was substantial both in quantity and value. The food that tends to get left at the end of a meal (chips, vegetables and salad) would not fit into this category.
“It would have to be something substantial. It couldn’t be like I’m bringing the vegetables home, it would have to be like a steak or something.”
Man, 35-54, Belfast
27 The eight colours represent the different groupings of words used by participants from top left clockwise: (1) Images conjured; (2) Understanding and suggestions for alternative terms; (3) Associated with foods that can already be ordered as take-away; (4) Health and safety and legality concerns; (5) Containers; (6) A good service; (7) Mainly for dogs but useful for children; and (8) Disliked term.
Words and images associated with
doggy bags
Curry
Foil (swans)
Proper containers
Dislike
Disrespectful for chef
Degrading
To take away
America
For humans and for dogs
Leftover hamper
Can I take it away?
(Something) to go
Take out bag
Napkins
Food to take home, not necessarily for the dog
Health & safety Illegal
Makes sense to ask for children
BoxRe-heating concerns
Take-away placesSubstantial piece of meat or leftover pieces (e.g. fat) for dog
Pizza
Restaurant getting sued over food poisoning
A good service
Take out
Children’s birthday party
Chinese
Indian
Being asked to sign a disclaimer
Leftovers
Takeaway
Oversize box

Understanding out of home consumer food waste 28
“If I’m going out and I’ve eaten really nice food I would ask to take it home, I wouldn’t just leave it, if it is a sizeable amount because I think that’s a waste, especially if I’ve paid like
good money for it as well.” Woman, 18-34, London
In most groups a couple of participants had experienced issues when asking for a doggy bag where venues had refused due to health and safety reasons. A couple of participants in several groups were adamant that it was now illegal for a venue to provide doggy bags.28 Overall, participants who had asked for a doggy bag recounted good experiences of the containers supplied (including foil swans for example). Participants, in the round, felt that the provision of doggy bags was an indicator of a good service. “It’s a good service though, if you’re paying for an expensive meal and for some reason you
don’t want it all I think it is a good service, to be given the opportunity to either take it away and leave it, I don’t want to see it again, or you can take it home for a wee sandwich
tomorrow morning or something, or if you’ve got a dog.” Man, 55+, Edinburgh
5.2 Experience of doggy bags Over half of respondents (52%), in the quantitative survey, claimed to have asked for a doggy bag in the past. Meal leavers were more likely to have asked for a doggy bag than non meal leavers, 59% compared to 50% - this difference is statistically significant. When asked about doggy bags, out of the 113 participants who took part in the discussion groups, 77 (68%) said they had asked for a doggy bag before while only 53 (47%) claimed to have been offered a doggy bag. It was suggested that staff could be more forthcoming in offering a doggy bag to customers who have left food at the end of their meal. Women are more amenable to asking for doggy bags than men. 55% of women had asked for a doggy bag compared to 49% of men – this difference is statistically significant. This male discomfort around asking for a doggy bag was often vocalised, but left unexplained, in the discussion groups. Men simply felt less at ease asking for a doggy bag.
“My partner would never ask. He used to find it really embarrassing if I said oh could you just wrap that up please, I’d like to take that home, he ‘d say oh don’t keep doing that, he’d
sort of cower in the corner like really embarrassing.” Woman, 55+, York
Some participants had enjoyed a very positive experience when asking to take home leftover food – especially with regards to venue staff offering to wrap up any leftovers and providing appropriate containers.
“That was one of the most beautiful experiences eating out I’ve ever had it was in a Thai restaurant years and years ago and it wasn’t that you were asking, they had actually plastic
bowls and they were offering that. So you didn’t feel that you would be stingy, a stingy person you know and you could take it home and that’s what they were offering and I love
that because I hate wasting food.” Woman, 35-54, Cardigan
28 Doggy bag guidance from the Food Standards Agency is available in the Resource pack for hospitality and food service at: www.wrap.org.uk/outofhome More information about food safety is available from the Food Standards Agency website www.food.gov.uk/

Understanding out of home consumer food waste 29
Others had had a negative experience with asking for a doggy bag which, in some cases, had influenced their willingness to ask in future. This often was related to either being refused a doggy bag due to health and safety concerns or not being sure whether something can be re-heated safely once it has been taken home (e.g. rice).
M: “We finished our meal and there was something left and we asked for a doggy bag and the waiter said you can take it but you have to sign to say if there’s anything wrong with it.
W: Yes because you can sue them if you’ve got a bad tummy.” Dialogue, York, 55+
In the discussion groups participants were asked what happened to the food once it had been taken home, the diagram below shows the four main avenues for leftover food that had been taken home.
Figure 12 | What happens to leftover food taken home?29
There was a strong sense amongst discussion group participants that the leftover food taken home needed to be consumed the following day.
“I generally don’t even eat it but I take it home anyway. It sits in the fridge for a day or so and then I just end up chucking it away.”
Woman, 18-34, Norwich
“Well it’s either eaten or thrown away but it’s got to be by the next day." Woman, 55+, York
5.3 Attitudes towards doggy bags Overall, approximately two-fifths (42%) of respondents agreed with the statement that ‘asking for a container to take leftovers home is embarrassing’. Meal leavers were slightly more likely to agree with this statement than non meal leavers, 46% compared to 41%. The discussion group insights also suggest that there is still a stigma attached to asking for a doggy bag for leftover food.
29 Source of photos: www.istockphoto.com
Breakfast the next day• Pizza and
curries
Lunch the following day• Leftover meat
put into a sandwich
• Leftover meat used in a salad
• Re-heated curry or Chinese
Fed to the dogs• Mainly only
meat leftovers
Thrown away• Forgotten or
not consumed therefore it goes in the bin

Understanding out of home consumer food waste 30
“Sometimes you don’t know. You don’t know if you’re being a bit uncouth by asking if you’re not sure and you really want to take it home but you don’t want to seem like cheeky or
something, you just keep quiet.” Man, 18-34, Cardiff
Participants stated that there was not a norm of asking for a doggy bag as they had experienced in other countries like the United States. Diners need to be reassured both socially and from a health and safety perspective. Customers need to know that it is socially acceptable to ask for a doggy bag and that it is safe to consume its contents at home at a later date.
“I think because it’s not the normal here. If it was then I would do it, but if you’re one of a minority actually doing it then I would feel quite uneasy doing it. So it’s easy to just not
bother.” Man, 18-34, Norwich
When asked spontaneously about what could be done to help reduce the amount of food left when eating out only 8% of respondents mentioned doggy bags. When asked directly whether they were in favour of ‘being offered a doggy bag or container to take your leftovers home’, however, three-quarters of respondents (74%) were in favour. Women were more likely to be in favour of doggy bags than men; 81% compared to 68% - this difference is statistically significant. 6.0 What can be done to help reduce plate waste? 6.1 Spontaneous ideas for leaving less food In both the quantitative and qualitative research participants were asked about their ideas on how customers could be encouraged to leave less food, whether or not they admitted to leaving food, their spontaneous reactions offered useful insights. From the quantitative survey, when asked unprompted, 11% stated they did not leave food when eating out. A further 18% did not make a suggestion or stated that they didn’t know. Of the other responses, suggestions can be grouped into six different categories: portion sizes; more flexibility, advice and information when ordering; changing the presentation of food; diner’s responsibility; doggy bags; and side dish and opt-out options.
Figure 13 overleaf illustrates the different suggestions proposed spontaneously.

Figure
The mofifths ofaddressthat offeaddressportion as a sol The prosolutionparticipa M:”Yes
M: Th
“…Youme
there’s
A furtheindividuSuggestsharing As discuHowevespontanavailabl
13 |Spont
ost popular sf respondensing portion ering a chos the issue osizes. Whenution increa
ovision of din to help cusants apprec
es because t
hese days yo
u can do thaeal because a choice fo
er one in tenual diner to tions includmeals.
ussed in Chaer, they did neously aboe or actively
taneous sug
suggestion nts (38%) st
sizes in terice of differof plate wasn looking atases to 20%
fferent sizestomers redciated when
there used t
you can’t say
at at home e it’s either aor the adults
n respondereduce the ed making
apter 5, dognot appear
out potentiay/automatic
ggestions fo
was aroundtated that arms of choicrent portionste. A furthet meal leave
% compared
d portions (duce the amn venues off
to be that o
y ladies and
the chickena special occs but for the
nts (11%) samount of better choic
ggy bags prr to be frontl solutions. cally offerin
Und
or helping to
d provision a potential sce, size andn sizes (incluer 17% speers the propd to 15% of
(small, medmount of foofered pensio
on the menu
d gents beca
n nuggets, tccasion and e children th
and
stated that food left onces, orderin
roved a popt of mind wOnly 8% m
ng doggy ba
erstanding ou
o leave less
of different solution to rd price. Of tuding childrecifically sugportion suggf non meal l
dium and larod left on thoner and ch
u, whether y
cause that wcould
the fish fingyou want s
they’re just sd chips with
it was effecn their plateng less, eati
pular choicehen respon
mentioned eags. Particip
ut of home con
food (Base
portion sizereducing plahese responen’s portion
ggested offegesting smaleavers.
rge) was suheir plates. hildren sized
you wanted
would be disd have large
Dialogu
gers and whsomething astuck with th beans or p
Woma
ctively the re at the endng less befo
e when promdents wereither makin
pants in disc
nsumer food w
e: 5,183)
es. Almost ate waste wndents 17%ns) would hering smallealler portion
uggested asDiscussion d portions.
d a gents’ poa ladies’
scriminatione or small pue, 55+, Ed
hen you go oa bit differenthe chicken peas or soman, 35-54, C
responsibilitd of the meaorehand an
mpted direce asked ng doggy bacussion grou
waste 31
two-
was by % stated
elp er n sizes
s a group
portion or ’ portion. n but you portions.” dinburgh
out for a nt where nuggets
mething.” Cardigan
ty of the al. d
ctly.
ags ups did
Understanding out of home consumer food waste 32
mention them has a potential solution but this may have been influenced by earlier discussions on doggy bags. A further 5% of respondents stated having different side options and the possibility of opting out of certain items as a suggestion for tackling plate waste. In the discussion groups, the modular menu used in restaurants like Nando’s was well liked especially for allowing customers to select side dishes.
“One thing I like in particular in Nando’s you can choose your burger and then you can choose the sides to go with it so you can choose then exactly how much you are getting
which I think is better rather than just getting a burger and chips.” Woman, 18-34, Cardiff
One suggestion mentioned spontaneously in some discussion groups was the need for more staff training and better interaction by staff with customers. Participants felt that staff could be better informed and more willing to offer information on aspects of their meal like ingredients, portion size and specials on offer. Furthermore, if staff members interacted with customers in a way that reassured customers and granted them permission to ask for clarifications or changes, it was thought that this may reduce the amount of plate waste.
“ It’s down to service again of somebody when you’re placing your order to tell you what you’re getting and you know they’ll say one side will do the four of you, you know, they’ll
talk to you and they’ll just say, they’ll tell you exactly, and the better they are the less you leave.”
Man, 35-54, Belfast
6.2 Prompted feedback on ideas for reducing plate waste In both the qualitative and quantitative research different ideas that could help reduce the amount of food left after a meal out were tested. The graph in Figure 14 overleaf outlines the extent to which respondents agreed with different ideas proposed.
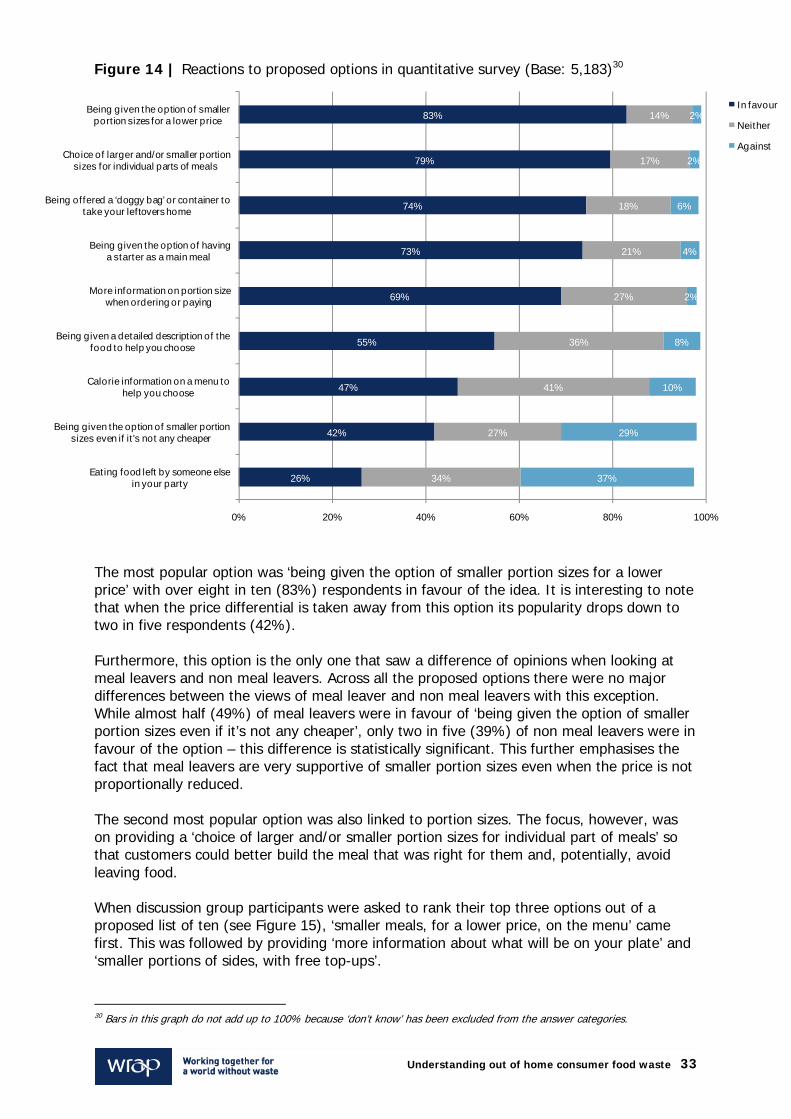
Understanding out of home consumer food waste 33
Figure 14 | Reactions to proposed options in quantitative survey (Base: 5,183)30
The most popular option was ‘being given the option of smaller portion sizes for a lower price’ with over eight in ten (83%) respondents in favour of the idea. It is interesting to note that when the price differential is taken away from this option its popularity drops down to two in five respondents (42%). Furthermore, this option is the only one that saw a difference of opinions when looking at meal leavers and non meal leavers. Across all the proposed options there were no major differences between the views of meal leaver and non meal leavers with this exception. While almost half (49%) of meal leavers were in favour of ‘being given the option of smaller portion sizes even if it’s not any cheaper’, only two in five (39%) of non meal leavers were in favour of the option – this difference is statistically significant. This further emphasises the fact that meal leavers are very supportive of smaller portion sizes even when the price is not proportionally reduced. The second most popular option was also linked to portion sizes. The focus, however, was on providing a ‘choice of larger and/or smaller portion sizes for individual part of meals’ so that customers could better build the meal that was right for them and, potentially, avoid leaving food. When discussion group participants were asked to rank their top three options out of a proposed list of ten (see Figure 15), ‘smaller meals, for a lower price, on the menu’ came first. This was followed by providing ‘more information about what will be on your plate’ and ‘smaller portions of sides, with free top-ups’.
30 Bars in this graph do not add up to 100% because ‘don’t know’ has been excluded from the answer categories.
26%
42%
47%
55%
69%
73%
74%
79%
83%
34%
27%
41%
36%
27%
21%
18%
17%
14%
37%
29%
10%
8%
2%
4%
6%
2%
2%
0% 20% 40% 60% 80% 100%
Eating food left by someone else in your party
Being given the option of smaller portion sizes even if it's not any cheaper
Calorie information on a menu to help you choose
Being given a detailed description of the food to help you choose
More information on portion s ize when ordering or paying
Being given the option of having a starter as a main meal
Being offered a ‘doggy bag’ or container to take your leftovers home
Choice of larger and/or smaller portion sizes for individual parts of meals
Being given the option of smaller portion sizes for a lower price
In favour
Neither
Against

Understanding out of home consumer food waste 34
Discussion group participants suggested that the communication of different portion sizes would need to be made visually understandable (for example by using images of three chillies, three bears, different sized plates, the number of scoops, etc.) but remain sensitive. The issues around sensitivity were mainly linked woman’s fears of being perceived as fat or eating too much. In the discussion groups, suggestions of using calories or weights by some participants were strongly disliked by other participants. Providing ‘calorie information on a menu to help you choose’ in the quantitative survey was supported by 47% of respondents.
“Mummy bear, baby bear and daddy bear.” Woman, Over 55+, York
“You’ll have a portion size to suit everybody.”
Man, 35-54, Belfast The importance of the lower price element of this option was deemed essential also in the discussion groups. Participants stated that the difference in price needed to be in the order of 20-30% cheaper to encourage customers to opt for the smaller portion. Otherwise it was suggested that diners would simply order the bigger portion because it is better value for money, irrespective of whether they thought they could finish it or not. The least favourite options in the discussion groups were ‘sides served, and paid for, separately’ and ‘ordering the next course when you’ve finished the one you’re eating’.
“It’s the monetary side of it, people are in a recession and it’s the fact that they don’t want to sit there and calculate can we afford to have peas and carrots tonight.”
Woman, 35-54, Cardigan
W: “It would just take forever. W: And with kids and all, oh my God no.
M: No chance. W: You’d never know when you were getting out.”
35-54, Belfast The graph in Figure 15 overleaf illustrates the reactions of discussion group participants to the proposed options discussed above; the numbers are expressed in counts rather than percentages due to the small sample size (113 participants).

Understanding out of home consumer food waste 35
Figure 15 | Reactions to proposed options in discussion groups (Base: 113)31
Overall, it appears that the preferred options involve a supply side solution of providing different portion sizes along with more information about portion sizes when ordering or paying. Some participants in the discussion groups (a minority) wanted to know what happened to the food left as they believed this may then enable them to better understand why plate waste is an issue. Nando’s ‘building block’ style menu was often cited as a model that enabled customers to make better, more informed meal choices. Customers, ultimately, need to be made to feel that they can compose the meal they want. Furthermore, they need to feel like they have the ‘permission’ or ‘right’ to ask for clarifications/changes or that they are provided with enough information to be able to directly address their questions.
31 Some bars may not add up to 113 as one or two participants may not have answered that question in the exercise sheet.
12
18
37
38
41
52
62
64
69
74
27
35
50
31
41
36
41
34
29
27
30
37
19
26
26
13
9
6
11
12
34
22
6
16
4
8
1
5
2
8
1
1
3
3
1
0 20 40 60 80 100 120
Sides served, and paid for, separately
Order the next course when you’ve finished the one you’re eating
Flat price meal, includinga choice of s ides
Flat price, but you change your meal proportions to suit you
Starters for mains
Smaller portions of s ides,with free top-ups
Swap ingredients or s ides you don’t like for something else
Staff to say ‘why not take it home?’
More information about what will be on your plate
Smaller meals, for a lowerprice, on the menu
Number of respondents
Very good idea
Good idea
Neither good nor bad
Bad idea
Very bad idea

Understanding out of home consumer food waste 36
7.0 Summary of findings and suggestions from research
7.1 Summary of findings Close to three in ten respondents (27%) left food at the end of their meal. These meal leavers were more likely to be women and to be younger. Hotels, pubs and restaurants had bigger proportions of meal leavers than other venues. The main dish and the accompanying sides were the courses most likely to be left; while appetisers, starters and desserts were less likely to be left. The staple foods that tend to get left at the end of the meal are chips, vegetables and salad. Chips, vegetables and salad are seen by some customers as plate fillers rather than part of the meal they ordered. Some do not even consider these food types, especially salad garnishes, to be intended for consumption. Meal leavers tend to be more influenced by whether others leave food and care more about how they are perceived by others than non meal leavers. Diners who are eating out for the experience rather than simply to ‘re-fuel’ are more likely to leave food at the end of their meal. Eating out is often perceived to be a treat, an occasion for customers to indulge – a hedonistic experience where they do not want to have to worry about food waste. Meal leavers are more likely to want the full meal experience by ordering more courses (starter, main and dessert) but as this makes them too full they leave food rather than ordering less. This suggests that meal leavers either inaccurately judge the quantity they are able to eat or are after the ‘full meal experience’ and, therefore, are less concerned about leaving some food. Respondents who had left food on this occasion were also more likely than others to leave food generally. Over a quarter (27%) of meal leavers stated that they often left food when eating a meal cooked at home compared to 18% of non meal leavers. This continues to be true when eating out generally. This suggests that meal leavers as a group of people seem to value food less compared to non meal leavers. Meal leavers tended to be less concerned about leaving food at the end of the meal than non meal leavers. Amongst respondents who claimed to be ‘bothered’ about leaving food, non meal leavers were more likely to show a greater degree of concern than meal leavers. Three quarters of ‘bothered’ non meal leavers stated leaving food was a ‘waste of good food’ compared to three-fifths of ‘bothered’ meal leavers. The main reason for leaving food was that the portion was too big – two-fifths of respondents (41%) gave this reason. Higher proportions gave this reason when respondents were describing a meal that took place in a restaurant, QSRs or pub. When it comes to portion sizes, respondents seem anxious to ask for fear of unduly troubling staff. The sensitivity of the topic, its link to dieting, eating too much and obesity, further discourages customers to voice their questions on portion sizes. When in the moment meal leavers may be more concerned with enjoying the experience of their meal than worrying about ordering/getting too much food. Meal leavers would benefit from more choice of portion sizes. Meal leavers tend to be more sensitive to large portions and are less willing to enquire about portion sizes. 41% stated that their meal was too much compared to only 6% of non meal leavers. The majority of meal leavers, interestingly, stated that they knew what the portion size was going to be when ordering but a small minority asked for information on portion size.

Understanding out of home consumer food waste 37
Meal leavers do not feel a sense of ownership or responsibility over the food left, the amount of food they get is considered out of their control, and a sizeable proportion will not ask for anything different. Front of house staff could be doing more to inform customers on the size of the servings. Only 4% of respondents had been offered advice on portion size compared to 38% being asked whether they wanted sides or extras. Furthermore respondents were keen for venues to proactively offer doggy bags for leftover food. The majority of diners do not want to think about whether they leave any food when they are enjoying a meal out. When eating out the issue of food waste is not something which is front of mind and customers do not want to engage with it. Three fifths of respondents (59%) agreed with the statement ‘I don’t want to have to think about leaving food when I eat out’. When respondents were asked to suggest solutions to reducing plate waste both the quantitative and qualitative findings concur that the solution needs to be centred on offering different portion sizes. 7.2 Suggestions from the research From both a technical and behavioural perspective, the key opportunities for reducing the amount of food left after a meal out are around portion sizes. From a technical point of view, signatories to the H&FSA could better promote and offer more choice of portion sizes in their outlets especially restaurants, pubs and hotels. Venues could offer different sized main courses as well as different sized side dishes which would give customers more choice and empower them to order ‘the right amount’ thereby reducing plate waste. Other technical solutions could include venues actively offering doggy bags for any food left by customers, venues explicitly allowing customers to have a starter as a main (or permitting customers not to order a main course) and staff offering more information about portions. All these industry-led solutions have their consumer-driven counterparts. Eating venues could train their staff so that they are better able to talk about portion sizes with customers and provide more information on the meals (e.g. ingredients, cooking). As the research findings suggest, portion sizes can, at times, be a sensitive subject so discretion and skill need to be used when communicating relevant information to customers. It may be worth exploring how staff are incentivised (whether by performing against their job description or premiums) so as to better inform the type of training needed. From a behavioural point of view, WRAP’s continued work with signatories to develop suitable messages around portion sizes and empowering customers to ask for more information will further help. Tools like an online resource pack where different messages tailored to the specific venue are trialled and tested could offer additional insights into which types of message wording and on what channels (e.g. on menus with/without pictographic aids, on table cards, on special’s boards, communicated by staff) work best. Any messages or communication initiatives developed need to be subtle, as diners do not want to be told what to do when out enjoying themselves nor do they want to think about food waste while eating out. Such behavioural initiatives would benefit also from a general raising of awareness on the need to value food similarly to what the Love Food Hate Waste campaign is doing for food

Understanding out of home consumer food waste 38
waste generated in the home. Any messages or general communication initiative, however, cannot be seen to ‘interrupt’ the eating out experience as the whole occasion is seen as a treat to be enjoyed by the customer. In terms of assessing impacts of these messages, participating venues could be asked to weigh the plate waste prior and post any intervention. Marrying this monitoring with short interviews with staff and a sample of customers may offer additional insights into the best way forward. Further investigation via qualitative research of when (e.g. in which occasions/venues) diners feel comfortable asking about portion sizes and why often they do not feel comfortable asking about portion sizes may shed more light into the complexities around the topic. Customers need to feel empowered to enquire about portion sizes irrespective of whether a venue advertises different portion sizes or not. A social norm needs to be promoted that it is acceptable - or indeed - encouraged for customers to ask for different portion sizes. Messages in venues (e.g. on menus, table cards, posters) could help communicate the fact that certain requests are encouraged. By addressing the provision and communication of different portion sizes, both technically with industry and behaviourally with staff and customers, a decline in the amount of plate waste can be expected.

Printed on xx% recycled content paper
www.wrap.org.uk/outofhome