Embed Size (px)
Citation preview

Understanding Metropolitan Change:The Urban Turnaround, Boomburbs, and
Growth Counties
Robert Lang, Ph.D.Professor and Director
Metropolitan Institute at Virginia TechAlexandria, Virginia
Census 2000 Conference UC Berkeley
November 1, 2002

Key Trends
• 1990s were the best decade for big, traditional cities since the 1940s
• A new category of suburban super city, or “boomburb” is emerging
• Many metropolitan core counties are growing more diverse, while peripheral counties remain mostly white

36 Large Cities in the “Urban Turnaround” Analysis
Akron, OH Jersey City, NJ Portland, OR
Atlanta, GA Kansas City, MO Providence, RI
Baltimore, MD Louisville, KY Richmond, VA
Birmingham, AL Milwaukee, WI Rochester, NY
Boston, MA Minneapolis, MN San Francisco, CA
Buffalo, NY New Orleans, LA Seattle, WA
Chicago, IL New York, NY St. Louis, MO
Cincinnati, OH Newark, NJ St. Paul, MN
Cleveland, OH Norfolk, VA Syracuse, NY
Dayton, OH Oakland, CA Toledo, OH
Denver, CO Philadelphia, PA Washington, DC
Detroit, MI Pittsburgh, PA Worcester, MA

Criteria for Cities
• 200,000 or more population in 1950, which in 1950 came to 50 cities
• At least two decades of decline from 1950 to 2000, which resulted in 36 cities

Numbers of Older Industrial Cities Gaining and Losing Population
by Decade, 1950-2000
138
0
1015
2328
36
2621
40
30
20
10
0
10
20
Number of cities gaining population Number of cities losing population
1950s 1960s 1970s 1980s 1990s
Source: Metropolitan Institute at Virginia Tech, Alexandria, VA (mi.vt.edu)Tabulations of decennial census data by Patrick A. Simmons and Robert E. Lang

Best and Worst DecadesFor Population Growth in Older
Industrial Cities(Based on Numeric Population Change)
125
04
15
3 1 3 0
29
35
30
25
20
15
10
5
0
5
10
15
20
Number of cities gaining population Number of cities losing population
Source: Metropolitan Institute at Virginia Tech, Alexandria, VA (mi.vt.edu)Tabulations of decennial census data by Patrick A. Simmons and Robert E. Lang
1950s 1960s 1970s 1980s 1990s
The 53 Boomburbs
Arizona: Chandler, Gilbert, Glendale, Mesa, Peoria, Scottsdale, Tempe
California: Anaheim, Corona, Costa Mesa, Fontana, Fullerton, Irvine, Lancaster, Moreno Valley, Ontario, Orange, Oxnard, Rancho Cucamonga, Riverside, San Bernardino, Santa Ana, Santa Clarita, Simi Valley, Thousand Oaks, Chula Vista, Escondido, Oceanside, Daly City, Fremont, Santa Rosa, Sunnyvale
Colorado: Aurora, Lakewood, Westminster
Florida: Coral Springs, Hialeah, Pembroke Pines, Clearwater
Nevada: Henderson, North Las Vegas
Texas: Arlington, Carrollton, Garland, Grand Prairie, Irving, Mesquite, Plano
Other States: Naperville, IL; Salem, OR; West Valley City, UT; Chesapeake, VA; Bellevue, WA

Criteria for Boomburbs
• Double-digit growth for each decade since 1950
• Population above 100,000 by 2000 Census
• Not the largest central city in the region
• Located in one of the 50 largest regions in the US, which runs from Richmond, VA to New York
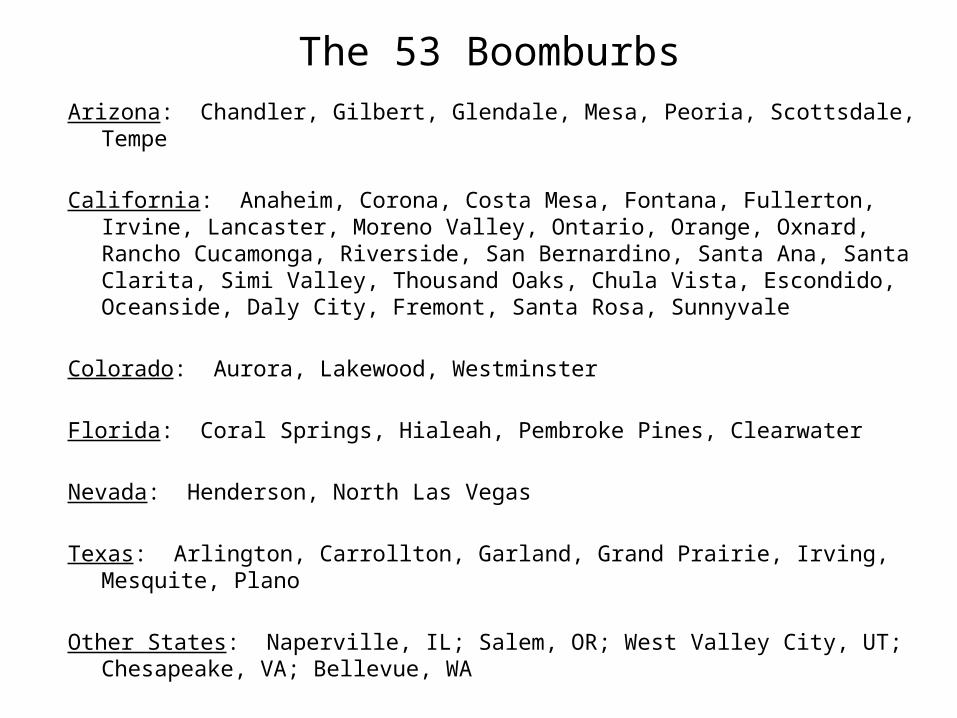
What are Boomburbs?
• Urban in fact, but not in feel
• Lack a large downtown relative to their size (there is no skyline)
• Have “hybrid” problems: urban sprawl and increasing poverty
• Come in two major types: immigrant dominated and traditional suburban

Boomburbs that had the largest increase in population in the 1990s:
Metro Area Increase
Gilbert, AZ
Henderson, NV
North Las Vegas, NV
Peoria, AZ
Pembroke Pines, FL
Chandler, AZ
276%
170%
142%
114%
110%
95%
Phoenix
Las Vegas
Las Vegas
Phoenix
Miami
Phoenix
Source: Metropolitan Institute at Virginia Tech, Alexandria, VA (mi.vt.edu)

Boomburbs 300,000 or More
Metro Area Year started Start pop. 2000 pop.
Mesa, AZ Phoenix 1950 16,790 396,375
Santa Ana, CA Los Angeles 1950 45,433 337,977
Arlington, TX Dallas 1950 7,692 332,969
Anaheim, CA Los Angeles 1950 14,556 328,014
Source: Metropolitan Institute at Virginia Tech, Alexandria, VA (mi.vt.edu)
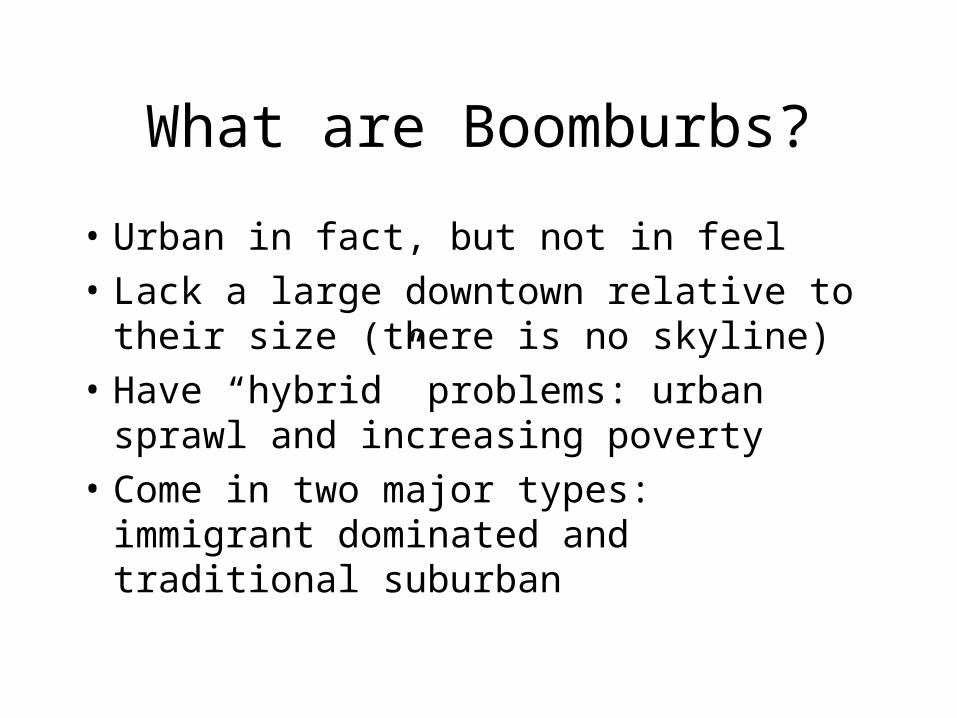
Crossing Paths:Some "Boomburbs" Have Surpassed Traditional Cities
0
100
200
300
400
500
600
700
800
900
1950 1960 1970 1980 1990 2000
Po
pu
lati
on
(th
ou
san
ds)
St. Louis, MO Mesa, AZ
Source: Fannie Mae Foundation.

Metropolitan Growth Counties*
County Types/ MEGA** Edge New Metropolis UnitedAttributes Counties Counties Counties States
Population Range Above 800,000 200,000 to 800,000 Below 200,000 ……….
Total Counties 23 54 47 3,141
No. of Metro Areas 17 26 26 276
Total Population 37.0 Million 20.8 Million 4.7 Million 281.4 Million
Location in Metro Near the Core Middle to Edge At the Fringe ……….
US Distribution Mostly in Sunbelt National Mostly in East ……….
Tag Line New Metro Heartlands Metro Growth Engines Suburbs of Suburbs ……….
What's Unique? High Tech Centers In Slow-Growth Metros Added to Metro Since 1971 ……….
Example Clark (NV) Lake (IL) Loudoun (VA) ……….
*Growth Counties grew at double-digit rates for each census since 1950.**MEGA (Massively Expanded, Growth-Accelerated) Counties.
Source: Metropolitan Institute at Virginia Tech, Alexandria, VA (mi.vt.edu)

Growth County Criteria
• Double-digit growth for each decade since 1950
• Located in largest 50 metropolitan areas
• New Metropolis Counties added since 1971

Growth County Share of U.S. Population: 1950 and 2000
0
5
10
15
20
25
1950 2000
Pe
rce
nt


MEGA CountiesMaricopa, AZ DuPage, ILContra Costa, CA Montgomery, MDOrange, CA Clark, NVRiverside, CA Bexar, TXSacramento, CA Dallas, TXSan Bernardino, CA Harris, TXSan Diego, CA Tarrant, TXSanta Clara, CA Travis, TXBroward, FL Salt Lake, UTHillsborough, FL Fairfax, VAMiami-Dade, FLOrange, FLPalm Beach, FL


Edge CountiesPlacer, CA Will, IL Butler, OH
Santa Cruz, CA Johnson, KS Cleveland, OK
Solano, CA Anne Arundel, MD Clackamas, OR
Sonoma, CA Harford, MD Marion, OR
Ventura, CA Howard, MD Washington, OR
Arapahoe, CO Ottawa, MI Bucks, PA
Boulder, CO Anoka, MN Chester, PA
Jefferson, CO Dakota, MN Brazoria, TX
Lake, FL Washington, MN Denton, TX
Pasco, FL St. Charles, MO Fort Bend, TX
Seminole, FL Durham, NC Galveston, TX
Clayton, GA Mecklenburg, NC Davis, UT
Cobb, GA Wake, NC Henrico, VA
DeKalb, GA Hillsborough, NH Prince William, VA
Gwinnett, GA Rockingham, NH Kitsap, WA
Kane, IL Gloucester, NJ Pierce, WA
Lake, IL Ocean, NJ Snohomish, WA
McHenry, IL Orange, NY Thurston, WA


New Metropolis CountiesEl Dorado, CA Charles, MD Rutherford, TNNapa, CA Frederick, MD Comal, TXDouglas, CO Queen Anne's, MD Hays, TXClay, FL Allegan, MI Johnson, TXHernando, FL Livingston, MI Culpeper, VANassau, FL Carver, MN Gloucester, VAOsceola, FL Scott, MN James City, VABarrow, GA Sherburne, MN Loudoun, VACherokee, GA Warren, MO New Kent, VADouglas, GA Davidson, NC Powhatan, VAForsyth, GA Orange, NC Spotsylvania, VAHenry, GA Randolph, NC Stafford, VAPaulding, GA Hunterdon, NJ Island, WARockdale, GA Sussex, NJ St. Croix, WISt. Charles Parish, LA Nye, NV Washington, WICalvert, MD Fairfield, OH
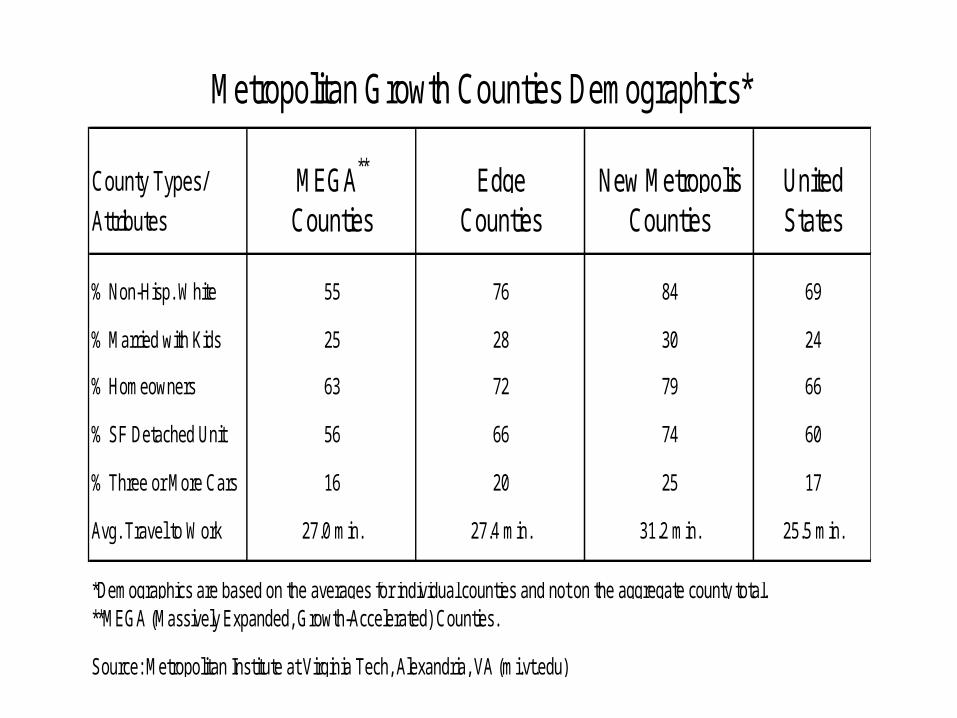
Metropolitan Growth Counties Demographics*
County Types/ MEGA** Edge New Metropolis UnitedAttributes Counties Counties Counties States
% Non-Hisp. White 55 76 84 69
% Married with Kids 25 28 30 24
% Homeowners 63 72 79 66
% SF Detached Unit 56 66 74 60
% Three or More Cars 16 20 25 17
Avg. Travel to Work 27.0 min. 27.4 min. 31.2 min. 25.5 min.
*Demographics are based on the averages for individual counties and not on the aggregate county total.**MEGA (Massively Expanded, Growth-Accelerated) Counties.
Source: Metropolitan Institute at Virginia Tech, Alexandria, VA (mi.vt.edu)

mi.vt.edu• Urban Turnaround (Census Note 01)• Boomburbs (Census Note 05)• Growth Counties (under Current Research)
Coming Soon (Spring 2003):
Bruce Katz and Robert Lang. Redefining Cities and Suburbs Robert Lang. Edgeless Cities: Exploring the Elusive Metropolis
Both from the Brookings Institution Press

www.mi.vt.edu