Embed Size (px)
Citation preview
ISSN 2165-8714
Copyright © 2012 EUJER
http://www.akademikplus.com/eujer/index.html
International Journal of Environmental & Science Education
Vol. 3 , No. 3 , July 2008, xx-xx
Understanding Mathematics: Some Key Factors
Asma Amanat Ali1, Norman Reid
2
1 University of Glasgow, Scotland 2 University of Glasgow, Scotland
E-mail: [email protected]
Mathematics is well known as a subject area where there can be problems in terms of under-
standing as well as retaining positive attitudes. In a large study involving 813 school students
(ages approximately 10-12) drawn from two different school systems in Pakistan, the effect of
limited working memory capacity on performance in mathematics was explored along with a
survey of areas of difficulty and student attitudes. This involved looking at student perceptions
of their experiences, the nature of the difficulties they have with mathematics and possible rea-
sons for these difficulties. The overall aim is to explore the extent of the effect of working
memory and to gain insights so that practical ways forward to enhance mathematics education
can be identified. It was found that limited working memory capacity has a very strong influ-
ence on performance, confirming other studies. Indeed, if the cognitive load exceeds the capac-
ity of working memory, understanding becomes a casualty, with consequent attitude deteriora-
tion. Students need to be able to see that mathematics has a purpose in being able to be applied
to real-life situations. However, attempts to develop applications may often generate further
working memory overload. Curricula devised by those outside the classroom can sometimes be
inappropriate while topics causing the greatest problems at these ages and include areas of ge-
ometry, statistics and the applications of mathematics.
Keywords: working memory capacity, attitudes to mathematics, difficulties in mathematics,
cognitive overload.
Difficulties in Learning in Mathematics
There are many studies which have identified areas of difficulty in the learning of mathematics at vari-
ous levels (eg. Kouba et al., 1997; Lo & Watanabem, 1997; Lucangeli et al., 1998; Moss and Case,
1999; Tirosh, 2000; Watson and Moritz, 2000; Friel et al., 2001; Cramer et al., 2002; Kato et al., 2002;
Harries & Suggate, 2006; Harries & Barmby, 2007). This study seeks to look beyond the descriptions
and explore some fundamental reasons for the problems, in an attempt to suggest practical ways for-
ward to enhance mathematics education.
The difficulties in certain areas of mathematics are widespread and occur across cultures, curricu-
la and methodologies. Therefore, it is unlikely that they are caused by the teachers. Firstly, mathematics
curricula are rarely determined by practising teachers but are planned and designed by those who them-
selves are mathematicians and who are committed to mathematics. Inevitably, such curricula are de-
signed around the logic of mathematics and the needs of those who will use or depend on mathematics
later in life. All of this can result in material being included which poses problems for learners. Further
problems can occur with assessment. Teachers do not decide national certification and yet teachers may
be criticised if their students are not successful enough. This can lead to a dependence on the memorisa-
tion of procedures, understanding being a casualty.
Another major source of the problem lies in the nature of mathematics and learning (Tall, 2004).
Indeed, mathematics learning can be conceptualised in terms of four processes (Figure 1).
EUROPEAN JOURNAL OF EDUCATIONAL RESEARCH Vol. 1, No. 3, 283-299

284 Ali & Reid
© 2012, European Journal of Educational Research, 1(3), 283-299
Figure 1. The Mathematics Tetrahedron
The work of Piaget (1963) has established that the young learner is trying to make sense of what
is experienced. In mathematics, trying to master the processes and symbolism may well create enough
pressure on limited working memory capacity. The learner cannot cope with concepts (understandings),
procedures, symbolisms and applications all at the same time.
Adding on the 'making sense of' dimension will almost certainly generate overload and yet it is
this dimension which is the natural way of learning. Ausubel (1968) talks of meaningful learning where
what is understood is 'internalised'. This is critical but the limitations of working memory may make
such understanding and internalisation very difficult. There are good arguments, therefore, for making
the mathematics taught meaningful. There are also good arguments that this may prove very difficult.
The key has to be in establishing confidence and competence in the processes and symbolisms at
one point in time and, later, adding on the understanding. In this way, the limitations imposed by work-
ing memory may be reduced. With the procedures more or less automated, enough working memory
space is now available to think about their meaning and application.
Development of Attitudes towards Mathematics
Learners have often perceived mathematics as a difficult subject (Brown et al. 2008). Mathematics is
abstract and logical in nature and many concepts in mathematics cannot be explained easily in terms of
physical representations or related to every day life. It is possible that mathematics is able to contribute
to the all-round development of each student by offering understanding which will enable them to de-
velop socially in the sense of being able contribute to society more effectively and being able to make
sense of society more effectively. However, mathematics is often portrayed as being abstract and unre-
lated to life.
In many countries, many students do not enjoy school mathematics and seek to avoid it later
(McLeod, 1994; Brown et al, 2008). Attitudes tend to deteriorate with age simply because work be-
comes more demanding and also because, as the students get older, they may start to think that they will
not need mathematics in the future. Indeed, negative attitudes towards mathematics are difficult to undo
(Duffin & Simpson, 2000).
Al-Ahmadi and Oraif (2009) looked at the idea of academic confidence and found it related al-
most exclusively to past success. This has enormous implications for mathematics. If the students see
success as elusive, then it is not likely that attitudes will remain positive. If confidence is mostly related
to examination success only and is not dependent on other factors, then examinations are almost
doomed to consign certain students to the dustbin of failure and their confidence will be damaged.
While the demand of challenging tasks does not, of itself, necessarily generate a perception of dif-
ficulty, when a task is perceived as being so difficult that the effort is not justified by the rewards, atti-
tudes seem to deteriorate (Reid & Yang, 2002; Reid & Skryabina, 2002). Alhmali (2007) found that the

Understanding Mathematics 285
© 2012, European Journal of Educational Research, 1(3), 283-299
perceptions of Libyan school students (ages 12-18) were that mathematics was not an easy subject, it
was over-abstract, and the least enjoyable and least attractive part of school. In his results, ‘polarisa-
tion’ of views was quite remarkable: while some students ‘loved’ it, many students ‘hated’ it.
In a recent study, Jung and Reid (2009) found a relationship between attitudes towards the scienc-
es and measured working memory capacity. Of even greater significance, they found that those with
lower working memory capacities tended to rely more on memorisation while those with higher work-
ing memories were more reliant on understanding. However, both groups appeared to want to under-
stand. Perhaps this offers the key: negative attitudes relate to failure to understand. The natural process
is to seek to make sense of things. When this is impossible or the opportunities are denied them, then
attitude problems will arise.
Teachers make a huge impact on learner attitudes (Ponte et al., 1991; Johnstone and Reid, 1981;
Reid and Skrybina, 2002) and there is a remarkable relationship between the views and attitudes of the
teachers and those of their students (Al-Enezi, 2004). Brown et al. (2008), working with a sample of
over 1500 students in 17 schools in England, investigated student attitudes towards mathematics. These
students were close to the moment of curriculum choice and the results showed that the main reason for
opting out was perceived difficulty. However, the learners may be receiving external messages about
difficulty and these may suggest that their future in mathematics may be a struggle. This may accelerate
the feeling of being unable to understand mathematics (Matrhews & Pepper, 2005; Kyriacou and
Goulding, 2006). Ma and Kishore (1997) have brought many of the findings together by considering
how all these influences generate identities relating to mathematics: ‘low expectations create low at-
tainment as much as they respond to it’.
Matthews and Pepper (2005) note powerful reasons for not continuing with mathematics. These
include lack of enjoyment and a belief that the subject is boring, for both high attaining as well as low
attaining students. They also saw the perceived irrelevance to the real world as a factor. Indeed, at age
11-14, fun is a key aspect for students of effective mathematics learning (Nardi & Steward, 2003).In
England, a predominant reason for taking mathematics is to become a mathematician or to choose a
career heavily dependent on mathematics while, in Scotland, the reason for taking mathematics at the
upper end of secondary is that mathematics is seen as an integral part of overall education. Mathematics
is very popular in Scotland at all levels, the reverse of England.
Experimental
The aim was to explore aspects of mathematics learning experiences in grades 5 to 7 (ages approxi-
mately 10-12) in both Urdu medium and English medium schools in Pakistan. This involved looking at
student perceptions of their experiences, the nature of the difficulties they have with mathematics and
possible reasons for these difficulties. To achieve this, a short survey was used with students in grades
5, 6 and 7, drawn for both language systems. This survey not only looked at the student perceptions
related to their experiences in mathematics but also surveyed topic areas to see where they were having
difficulties. For grade 5, working memory capacity was measured and their mathematics marks were
gained.
Samples Used
Samples of students were drawn from a range of Urdu medium schools in the Lahore area of the coun-
try, reflecting a diversity of areas and social backgrounds. For English medium schools, two boys
schools were selected.

286 Ali & Reid
© 2012, European Journal of Educational Research, 1(3), 283-299
Table 1. Samples Chosen
Grade Urdu Medium English Medium Totals
Girls Boys Boys
5 74 76 150 300
6 33 115 106 254
7 107 51 101 259
Totals 214 242 375 813
A list of all the aspects of mathematics was drawn up and questions were developed to explore
these. Lists of topics in the mathematics curriculum for each year group for each language system were
drawn up. The draft survey was considered by experienced mathematics teachers and minor amend-
ments incorporated. The survey was translated into Urdu and the translation checked. The survey for
grade 5, English medium, is shown in the appendix and used several question formats (Likert, 1932;
Osgood et al., 1957; Reid, 2003). The other surveys were identical except for the list of topics covered
in question 9.
Measurement of Working Memory Capacity
To determine an individual’s working memory capacity, the Figural Intersection Test, developed by
Pascual-Leone (1970), was used. There are two sets of simple geometric shapes. The presentation set
consists of a number of shapes separated from each other. The test set consists of the same shapes but
overlapping, so that there exists a common area which is inside all the shapes of the presentation set.
Altogether, there are 20 items in the test. The number of shapes varies from 2 to 8. The test is timed.
Every item has to be completed in about 20-25 seconds. Its validity and reliability have been demon-
strated by Johnstone and Elbanna (1986, 1989).
The Effect of Working Memory
The working memory capacity of the grade 5 students was measured using the figural intersection test.
The descriptive data are shown in Table 2.
Table 2. Working Memory Data
Sample Minimum Maximum Mean Standard Deviation
300 2 8 4.1 1.2
Grade 5 students have an average age of about 10-11 years. Students of age 10 might be expected
to have a mean working memory capacity of 4 and the results obtained here are consistent with this.
The working memory capacity measurements were correlated with the marks in mathematics
(standard school examinations) using Pearson correlation. The results are shown in Table 3.

Understanding Mathematics 287
© 2012, European Journal of Educational Research, 1(3), 283-299
Table 3. Working Memory Correlations
Sample Pearson r Probability
Grade 5 Urdu Medium 150 0.69 < 0.001
Grade 5 English Medium 150 0.43 < 0.001
Working memory capacity measurements will only correlate with performance measurements if
one or both of the following conditions are fulfilled (Reid, 2009):
“(a) The teaching and learning process is such that students with higher working memory capaci-
ties have an advantage.
(b) The assessment is such that students with higher working memory capacities have an ad-
vantage.”
Typically, correlation values which lie between 0.2 and 0.65 are obtained when working memory
capacities are correlated with examination performance (Reid, 2009). A value of 0.69 is unusually high
indicating that about 50% of the variance in their mathematics marks is controlled by their working
memory capacity. While correlation does not of itself imply causation, the work of Johnstone and El-
banna (1986, 1989) shows clearly that causation is involved. The effect of working memory capacity on
mathematics performance is illustrated in Table 4.
Table 4. Differences in Mean Marks Related to Working Memory Capacity
Working
Memory Capacity
Urdu Medium English Medium
N = 150 N = 150
Mean Mathematics Marks (%)
Above average 63.0 55.7
Average 50.0 48.1
Below average 39.7 46.4
It is clear that working memory capacity can make a very large difference in examination marks.
Al-Ahmadi and Oraif (2009) used factor analysis to show that, while working memory capacity corre-
lates with both recall and understanding, it is a very different factor. In other words, the test perfor-
mance may be influenced strongly by working memory capacity and yet not reflect ability to remember
or understand. Thus, students are being rewarded on the basis of a genetic feature (working memory
capacity) which does not necessarily reflect ability in mathematics.

288 Ali & Reid
© 2012, European Journal of Educational Research, 1(3), 283-299
Survey Data Analysis
The survey offered a vast amount of data. The aim here is to discuss a little of the data where the
information may be applicable well beyond the specific educational structure in Pakistan. To simplify
the analysis here, it was noted that quite a number of the items in four of the questions [questions 1, 2, 3
and 5 (24 items in all)] how quite high intercorrelations (Kendall’s Tau-b) with each other. The items in
these four questions were never designed with any underlying structure in mind. Nonetheless, a factor
analysis can offer insights to see if there is any underlying structure to explain these correlations. The
data for the entire sample (N = 813) were considered using principal components analysis, with
varimax rotation. 9 components accounted for 68% of the variance. Table 5 shows the items which had
the highest loading on each of these factors (components), with the likely nature of these nine compo-
nents.
Table 5. Loadings Table (Highest loadings only)
Factors (Components)
1 2 3 4 5 6 7 8 9
Question
Enjoy-
ment,
interest
Easiness,
difficulty Effort
Memoris-
ing or un-
derstanding
Useful in
daily life
Type of
revision
Visual-
spatial
Extent of
help at
home
Confi-
dence to
understand
1 (part 2) 0.85
1 (part 3) 0.80
1 (part 5) 0.80
2 (part 4) 0.83
2 (part 6) 0.72
3 (part 4) 0.82
3 (part 5) 0.88
5 (part 2) 0.89
5 (part 3) 0.73
The identification of these components suggest the factors which may be critically important in
influencing the development of positive (or negative) attitudes in relation to the learning of mathemat-
ics at school level at these ages. For simplicity, the student responses to these nine questions (which
loaded most highly onto the nine factors) will be discussed and the data for the other questions left.
Table 5 reveals that enjoyment and interest are very important in developing positive attitudes re-
lated to mathematics. It also suggests that a mathematics curriculum must be of appropriate difficulty:
excessive difficulty may have powerful negative effects on attitudes. Two factors are particularly inter-
esting: the memorising-understanding dimension and the perception of usefulness in daily life.
It has shown very clearly that understanding is what learners are seeking but, if the difficulties are
too great, the learners have to resort to memorisation with concomitant attitude deterioration (Jung and
Reid, 2009). Examinations may have a very powerful effect here. The other factor of interest is the
perception or otherwise of the usefulness of mathematics in daily life. This has been found to be critical
in the sciences (Reid and Skryabina, 2002) and it seems important here also. It is relatively easy to in-

Understanding Mathematics 289
© 2012, European Journal of Educational Research, 1(3), 283-299
troduce applications into syllabuses in biology, chemistry and physics at school level. It may be very
much more demanding to achieve this in mathematics in that introducing another layer of thought will
almost certainly overwhelm the working memory. This issue has been discussed by Al-Enezi (2008)
and no easy solution is yet apparent.
Patterns of Responses and Age
The patterns of responses for the nine items are shown for Urdu medium schools for each of the three
age groups. Data are shown as percentages for clarity but all statistical calculations use raw data. The
response patterns are compared using chi-square as a contingency test (table 6).
Table 6. Patterns for Response from Urdu Medium Schools
N (grade 5) = 150, N (grade 6) = 148, N
(grade 7) = 158
Grade
Responses (%) χ2
Usefulness in life
Useful in daily life
5 79 17 1 0 1 2
Useless in daily life 65.1 (2)
p < 0.001 6 43 16 10 13 16 3
7 81 13 4 1 1 1
Easy of under-standing
Easy to understand
5 47 24 15 0 3 11
Difficult to understand 61.6 (6)
p < 0.001 6 30 18 12 16 10 15
7 65 10 4 2 4 16
Enjoyment I want to learn it because I
enjoy it
5 63 15 1 1 4 17
I do not want to learn it but it is a compulsory subject
24.6 (2) p < 0.001
6 40 11 12 14 16 8
7 63 6 8 4 2 17
Understanding-memorising
I actually understand the procedures in class
5 68 2 13 5 3 9
I just memorise the proce-dures in class
26.0 (4) p < 0.001
6 30 14 19 13 11 14
7 67 10 4 2 5 11
Effort I revise my lessons regular-
ly
5 64 7 3 1 5 21 I revise them just before the
exam or test 45.3 (6)
p < 0.001 6 43 15 9 11 10 13
7 69 6 4 3 3 16
Type of revi-sion
Enough revision at school to help
5 48 9 11 12 14 5
Not enough revision at school to help to help me understand
well
49.4 (10)
p <
0.001
6 34 18 14 17 9 9
7 63 8 6 4 5 14
Extent of home help
I understand at school with little extra help from home
5 49 9 5 9 10 18 I understand at school with
extra help from home 35.0 (6)
p < 0.001 6 34 19 7 12 11 18
7 61 7 3 1 8 21
Visual-spatial Diagram and pictures help me to understand mathe-
5 67 26 3 1 3 42.
7 6 38 29 21 11 1

290 Ali & Reid
© 2012, European Journal of Educational Research, 1(3), 283-299
N (grade 5) = 150, N (grade 6) = 148, N
(grade 7) = 158
Grade
Responses (%) χ2
matics well
7 50 34 8 6 3
(6)
p <
0.001
Confidence to understand
I can understand the main points easily
5 65 21 11 3 1
37.8 (6) p < 0.001
6 43 23 15 16 3
7 57 28 11 4 1
Three features stand out in the data. Firstly, grade 6 is responding in a very different way when
compared to grades 5 and 7. As this sample is drawn from the same schools with the same teachers and
the same resources and environment, the differences must be caused by the national curriculum in grade
6. This is simply too demanding. Secondly, there is some polarisation of views in many of the items: a
significant proportion are opting for the two extreme positions. This is consistent with what Alhmali
(2007) found in Libya with older school students. Thirdly, for the majority, views are very positive.
This is encouraging. The patterns of responses for the nine items are shown for English medium
schools for each of the three age groups. The response patterns are compared using chi-square as a con-
tingency test (table 7).
Responses tend to be positive and there are very few differences in the response patterns for the
three age groups. Thus, it appears that the curriculum difficulties for grade 6 observed for Urdu medium
schools are not repeated here, suggesting a more appropriate curriculum. However, there is some evi-
dence of polarisation of views, suggesting a small minority who are negatively disposed towards math-
ematics.
Areas of Difficulty
The areas which showed the highest indication of difficulty for Urdu medium students are shown in
table 10. In grade 5, many areas of perceived difficulty relate to geometry. In grade 6, six topics stand
out. However, when comparing the response patterns of grade 6 to those of grades 5 and 7, more topics
tended to be rated as difficult and the proportion of students seeing difficulty is very much higher. This
confirms that that there is a major problem with the curriculum in year 6.
In grade 7, geometry features quite a bit in areas regarded as ‘difficult’ but the greatest problems
lie in areas where mathematics is being applied to life: tax, inheritance, business. There may be two
problems here Firstly, at this age, there will be a great lack of experience of such areas of life. Howev-
er, secondly, teaching in these areas requires a mastery of the mathematics involved at the same time as
its application in life. This may simply reflect overload of limited working memory capacity.

Understanding Mathematics 291
© 2012, European Journal of Educational Research, 1(3), 283-299
Table 7. Patterns for Response from English Medium Schools
N (grade 5) = 150, N (grade 6) = 106, N (grade 7) = 101 Grade Responses (%)
χ2
Usefulness in life Useful in daily life
5 63 23 8 2 1 2
Useless in daily life 5.7 (6)
ns. 6 59 26 13 1 1 1
7 56 26 14 2 1 1
Easy-difficult Easy to understand
5 37 25 14 8 5 12
Difficult to understand 16.2 (8) p < 0.05
6 34 33 19 7 4 4
7 33 25 20 9 3 11
Enjoyment I want to learn it because I
enjoy it
5 62 16 8 4 1 8 I do not want to learn it but it is a compulsory
subject
22.9 (6)
p < 0.001 6 45 25 14 7 5 4
7 40 23 14 9 4 10
Understanding-
memorising I actually understand the
procedures in class
5 34 12 16 11 8 19
I just memorise the
procedures in class
12.2 (10)
ns. 6 34 15 10 11 15 14
7 34 14 15 13 10 15
Effort I revise my lessons regu-
larly
5 47 13 15 8 5 12
I revise them just before
the exam or test
16.7 (10)
ns. 6 44 20 15 4 7 10
7 36 21 12 9 7 15
Type of revision Enough revision at school
to help
5 59 15 10 5 3 8 Not enough revision at
school to help to help me
understand well
23.9 (8)
p < 0.01 6 45 24 16 5 3 7
7 41 26 9 6 8 9
Extent of home
help I understand at school with
little extra help from home
5 49 20 12 5 2 12 I understand at school
with extra help from home
7.4 (8)
ns. 6 45 26 13 3 3 9
7 41 27 12 6 5 10
Kind of explana-tion
Diagram and pictures help me to understand mathe-
matics well
5 31 34 30 5 1
1.9 (4)
ns. 6 29 37 25 6 3
7 25 38 22 8 7
Capacity to
understand
I can understand the main
points easily
5 44 33 18 5 1
9.4 (6)
n.s. 6 51 33 13 2 1
7 40 40 15 3 2

292 Ali & Reid
© 2012, European Journal of Educational Research, 1(3), 283-299
Table 8. Areas of Difficulty (Urdu medium)
Grade 5 Grade 6 Grade 7
To draw an isosceles and a scalene
triangle Equivalent Fractions Inheritance & Partnership
Kinds of triangles and the perimeter of a
triangle Reduction of C.F to the Simplest Form Direct Proportion and Inverse Proportion
Kinds of angles and their measurement Use of Brackets Income Tax, Property Tax and Custom
To draw a perpendicular on a line Construction of Triangles Commission and Discount
Graphs To Measure the Area of a Square and a
Rectangle
Finding the Volume of a Cube and a
Cuboid
Graphs Bisection of a Line Segment
Table 9. Areas of Difficulty (English Medium)
Most Difficult Topics
Distributive Property
Area
Volume
Capacity
Information Handling (basic statistics)
Algebraic Sentences
Organising and Using Data (basic statistics)
Factorising numbers into Prime Factors
Classifying Quadrilaterals
Identifying Nets for a closed Shape
Different Times Around the World
Ratio and Proportion
Collecting and Organising Data
Perimeter of Compound shapes
Reflection in a given Line
Translation, Rotation about a given point
Enlargement of 2D-Shapes
Deducing the formula for the Area of a Parallelogram
Deducing the formula for the area of a Trapezium

Understanding Mathematics 293
© 2012, European Journal of Educational Research, 1(3), 283-299
The curriculum for Urdu medium schools is determined nationally but English medium schools
develop their own curricula. The two English medium schools each had its own curriculum. Thus, the
response patterns reflect the actual specific curricula in each of the schools. As with the Urdu medium
schools, geometry features highly. Statistical themes also pose problems and, again, this is almost cer-
tainly a working memory problem. In statistics, there is the added complication of statistical samples
and probability as well as the use of multiple ways of presentation.
Discussion
The factor analysis reveals a number of key factors worthy of further exploration. The whole issue of
memorisation and understanding is vitally important in the development of positive attitudes. The natu-
ral process for human beings is to seek to understand (Piaget, 1963). Jung and Reid (2009) have shown
that where understanding is difficult due to working memory overloading, then the learner has to turn to
memorisation and attitudes tend to deteriorate. This is a clear issue for mathematics. The goal of under-
standing must be stressed more if positive attitudes are to be retained.
Secondly, relating the mathematics studied to the lifestyle of the learner seems very important alt-
hough ways to do this are not easy. There are two possible, and inter-related, ways forward:
(a) Using the ideas summarised in the mathematics tetrahedron (figure 1), ensure that the focus
at the start is entirely on the procedures and representations. Once these have effectively
been automated, the working memory is set free to consider conceptual understandings and
then applications.
(b) Reduce the content covered, releasing time to develop such understandings and then to see
how the mathematics learned can be applied
The correlation values obtained between performance in mathematics and working memory ca-
pacity reveal yet again the key role of limited working memory capacity in all learning, a point stressed
eloquently by Kirschner et al. (2006). Reid (2002) showed that, at least in terms of assessment, ques-
tions can be developed which do not place undue stress on the working memory. The questions are still
demanding but the demand lies with the understanding of the mathematics, not the capacity of the indi-
vidual’s working memory. It is very clear that, in Pakistan, at this age, both the curriculum and the as-
sessment appear to be placing the working memory under stress. This is a major issue needing ad-
dressed by curriculum planners and by those who set examinations. The situation with the Urdu cur-
riculum and assessment is particularly a matter of concern.
Key Issues
Working Memory Capacity is known to be an issue in all subject areas but is particular im-
portant in the maths-sciences areas of the curriculum (Hindal et al., 2009; Reid, 2009). In the
sciences, successful ways forward have been described (Hussein and Reid, 2009). It is es-
sential that teaching and assessment in mathematics addresses this issue.
If the cognitive load exceeds the capacity of working memory, understanding becomes a
casualty and the student has to resort to memorisation, with potential attitude deterioration
(Jung and Reid, 2009). This may offer a key insight into why there are negative attitudes to-
wards study in mathematics.

294 Ali & Reid
© 2012, European Journal of Educational Research, 1(3), 283-299
Students need to be able to see that mathematics has a purpose in being able to be applied to
real-life situations. However, attempts to develop applications may often generate working
memory overload (see Al-Enezi, 2008). The two related suggestions on reducing working
memory overload by considering the mathematics tetrahedron and content reduction look
fruitful ways forward.
In the national curriculum used in Urdu schools, it is clear that the Grade 6 curriculum is in-
appropriate, probably too demanding. It is interesting to note that, in the English medium
schools, mathematics teachers determine their own curriculum and they seem to be more
successful in this task when compared to those who devised the national curriculum. Thus, it
seems important that the development of mathematics curricula involves practicing teachers
who know the reality of the classroom situation.
Certain topics seem to be causing problems and these include areas of geometry, statistics
and the applications of mathematics. This needs further exploration. It is likely that these
topics are being introduced too early. This leads to two problems: too high a demand on
working memory and a lack of life experience to appreciate the importance of the topics.
References
Al-Ahmadi, F and Oraif, F. (2009). Working memory capacity, confidence and scientific thinking. Re-
search in Science and Technological Education, 27(2), 225-243.
Alenezi, D.F. (2004). Difficulties Associated with Teaching and Learning Mathematics: A Study of
Psychological Factors Affecting Pupils' Performance. MSc Thesis, Glasgow: University of
Glasgow.
Alenezi, D.F. (2008). A Study of Learning Mathematics Related to some Cognitive Factors and to Atti-
tudes. PhD Thesis, Glasgow: University of Glasgow. [http://theses.gla.ac.uk/333/]
Alhmali, R.J. (2007). Student Attitudes in the Context of the Curriculum in Libyan Education in Middle
and High Schools, PhD Thesis, Glasgow: University of Glasgow.
Ausubel, D. P. (1968). Educational psychology a cognitive view. New York: Holt, Rinehart and Win-
ston.
Brown, M., Brown, P. and Bibby, T. (2008). I would rather die: Reasons given by 16-years-olds for not
continuing their study of mathematics. Research in Mathematics Education, 10(1), 3-18.
Cramer, K.A., Post, T.R. and delMas, R.C. (2002). Initial Fraction Learning by Fourth and Fifth Grade
Students: A Comparison of the Effects of Using Commercial Curricula With the Effects of Us-
ing the Rational Number Project Curriculum. Journal for Research in Mathematics Education,
33(2), 111-144.
Duffin, J. and Simpson, T. (2000). Understanding their Thinking: the tension between the Cognitive
and the Affective, In: Diana Coben (2002). Perspectives on Adults Learning Mathematics,
Mathematics Education Library, 21, Section I, 83-99.
Friel, S.N., Curcio, F.R., and Bright, G.W. (2001). Making Sense of Graphs: Critical Factors Influenc-
ing Comprehension and Instructional Implications. Journal for Research in Mathematics Edu-
cation, 32(2), 124-158.
Harries, T and Barmby P (2007). Representing and Understanding Multiplication, Journal for Research
in Mathematics Education, 9, 33-45.

Understanding Mathematics 295
© 2012, European Journal of Educational Research, 1(3), 283-299
Harries, T. and Suggate, J. (2006). Exploring links across representations of numbers with young chil-
dren. International Journal for Technology in Mathematics Education, 13(2), 53-64.
Hindal, H, Reid, N., and Badgaish, M. (2008). Working Memory, Performance and Learner Character-
istics. Research in Science and Technological Education, 27(2), 187-204.
Hussein, F. and Reid, N. (2009). Working memory and difficulties in school chemistry. Research in
Science and Technological Education. 27(2), 161-185.
Johnstone, A. H., and El-Banna, H. (1986). Capacity, Demands and Processes - A Predictive Model for
Science Education. Educational in Chemistry, 23, 80-84.
Johnstone, A. H., and El-Banna, H. (1989). Understanding learning difficulties - a predictive research
model. Studies in Higher Education, 14,159-68.
Johnstone, A. H. and Reid, N. (1981). Toward a model of attitude change. European Journal of Science
Education. 3(2), 205-212.
Jung, E-S. and Reid, N. (2009). Working memory and attitudes, Research in Science and Technological
Education. 27(2), 205-223.
Kato, Y., Kamii, C., Ozaki, K. and Nagahiro, M. (2002). Young Children’s Representations of Groups
of Objects: The Relationship between Abstraction and Representation. Journal for Research in
Mathematics Education, 3(1), 30-45.
Kirschner, P.A., Sweller, J. and Clark, R.E. (2006). Why Minimal Guidance during Instruction Does
not Work: An Analysis of the Failure of Constructivist, Discovery, Problem-based,
Experiential, and Inquiry-Based Learning. Educational Psychologist, 41(2), 75-86.
Kouba, V., Zawojewski, J. and Strutchens, M. (1997). What do students know about numbers and op-
erations? In P.A. Kenny and E. A. Silver (Eds), Results from the sixth mathematics assessment
of the National Assessment of Educational Progress, Reston, VA : Council of Teachers of
Mathematics, 87-140. Kyriacou, C. and Goulding, M. (2006). A systematic review of strategies to raise pupils' motivational
effort in Key Stage 4 mathematics EPPI Centre, London : Institute of Education.
Likert, R. (1932). A technique for the measurement of attitudes. Archives of Psychology, 140, 5–55
Lo, J-J. and Watanabem T. (1997). Developing Ratio and Proportion Schemes: A Story of a Fifth Grad-
er, Journal for Research in Mathematics Education. 28(2), 216-236.
Lucangeli, D., Tressoldi, P. E. and Cendron, M. (1998). Cognitive and Metacognitive Abilities In-
volved in the Solution of Mathematical Word Problems: Validation of a Comprehensive Mod-
el. Contemporary Educational Psychology, 23, 257-275.
Ma, X. and Kishore, N. (1997). Assessing the Relationship between Attitude towards Mathematics and
Acievement in Mathematics : A Meta Analysis. Journal for Research in Mathematics Educa-
tion, 28(1), 26-47.
Matthews, A. and Pepper, D. (2005). Evaluation of participation in A level mathematics: Interim re-
port, London: Qualifications and Curriculum Agency.
McLeod, D.B. (1994). Research on affect and mathematics Learning in the JRME: 1970 to the present.
Journal for Research in Mathematics Education 24, 637-647.
Moss, J., and Case, R. (1999). Developing children’s understanding of the rational numbers: A new
model and experimental curriculum. Journal for Research in Mathematics Education, 30,122-
147.
Nardi, E. and Steward, S. (2003). Is mathematics T.I.R.E.D? A profile of quiet disaffection in the sec-
ondary mathematics classroom. British Educational Research Journal, 29(3), 345-367.
Osgood, C. E., Suci, C. J. and Tannenbaum, P. H. (1957). The measurement of meaning. Urbana, IL:
University of Illinois Press.
Pascual-Leone, J. (1970). A mathematical model for the transition rule in Piaget's developmental stag-
es. Acta Psychologica, 32, 301-345.

296 Ali & Reid
© 2012, European Journal of Educational Research, 1(3), 283-299
Piaget, J. (1963). The Child’s Conception of the world, Peterson, N.J.: Little Field, Adams.
Ponte, J.P., Matos, J.F., Guimares, H.M., Leal, L.C. and Canavarro, A.P. (1991). Students' Views and
Attitudes towards Mathematics teaching and Learning: A case of a Curriculum Experience. Ed-
ucational Studies in Mathematics, 26(4), 347-365.
Reid, N. (2003). Getting Started in Pedagogical Research in Higher Education. LTSN Physical Sci-
ence, Hill: Higher Education Academy.
http://www.heacademy.ac.uk/resources/detail/subjects/physsci/Practice-guide-getting-started-
ped-research
Reid, N. (2009). Working Memory and Science Education. Research in Science and Technological
Education, 27(2), 245-250.
Reid, N. and Skryabina, E. (2002). Attitudes towards physics. Research in Science and Technological
Education. 20(1), 67-81.
Reid, N. and Yang, M-J. (2002). Open-ended problem solving in school chemistry: a preliminary
investigation, International Journal of Science Education, 24(12), 1313 – 1332
Reid, P. (2002). Problem solving by primary school children with particular reference to dyslexics.
MSc Thesis, Glasgow: University of Glasgow.
Tall, D (2004) Thinking through three worlds of mathematics. Proceedings of the 28th Conference of
the International Group for the Psychology of Mathematics Education, 4, 281–288
Tirosh, D. (2000). Enhancing Prospective Teachers' Knowledge of Children's Conceptions: The Case of
Division of Fractions. Journal for Research in Mathematics Education, 31 (1), 5-25.
Watson, J.M. and Moritz, J.B. (2000). Developing Concepts of Sampling, Journal for Research in
Mathematics Education, 31(1), 44-70.

Understanding Mathematics 297
© 2012, European Journal of Educational Research, 1(3), 283-299
Appendix.
What do you think about Mathematics?
(1) What is your opinion about the subject mathematics?
Tick one box on each line
I like mathematics I do not like mathematics
Useful in daily life Useless in daily life
Easy to understand Difficult to understand
Boring subject Interesting subject
I do not want to learn it but it is a compulsory subject I want to learn it because I enjoy it.
(2) What is your opinion about mathematics lessons?
Tick one box on each line
Easy lessons Difficult lessons
I understand my lessons completely I do not understand my lessons completely
I like the way my teacher explains the methods I do not like the way my teacher explains the methods.
I just memorise the procedures in class I actually understand the procedures in class
I do not like doing too much class work daily I enjoy doing my class work daily
I revise my lessons regularly I revise them just before the exam or a test.
(3) How do you feel yourself in your mathematics course at school?
Tick one box on each line
I feel I am trying hard to do well in mathematics It is my fault I cannot study mathematics well.
I hate homework because I can’t do it on my own I enjoy homework because I can do it on my own
I am getting better at the subject I am getting worse at the subject.
Enough revision at school to help me understand well Not enough revision at school ... me understand well
I understand at school with little extra help at home I understand at school only with extra help from home
(4) Imagine you have problem in understanding a new topic or concept. What is your likely reaction?
Tick as many boxes as you wish.
Start to panic See it as a challenge Seek help from my teacher
Seek help from my tutor No worries, I will understand it with time. Seek help from a family member
(5) Here are some descriptions of the way students approach mathematics.
Tick one box on each line.
strongly agree not sure disagree strongly
agree disagree
Revision sheets help me to understand mathematics well
Diagram and pictures help me to understand mathematics well
I can understand the main points easily.
I think mathematics help me in daily life a lot.
I do not want to learn mathematics but it is compulsory
I enjoy studying mathematics classes
I work hard in mathematics but cannot get good marks in exam
298 Ali & Reid
© 2012, European Journal of Educational Research, 1(3), 283-299
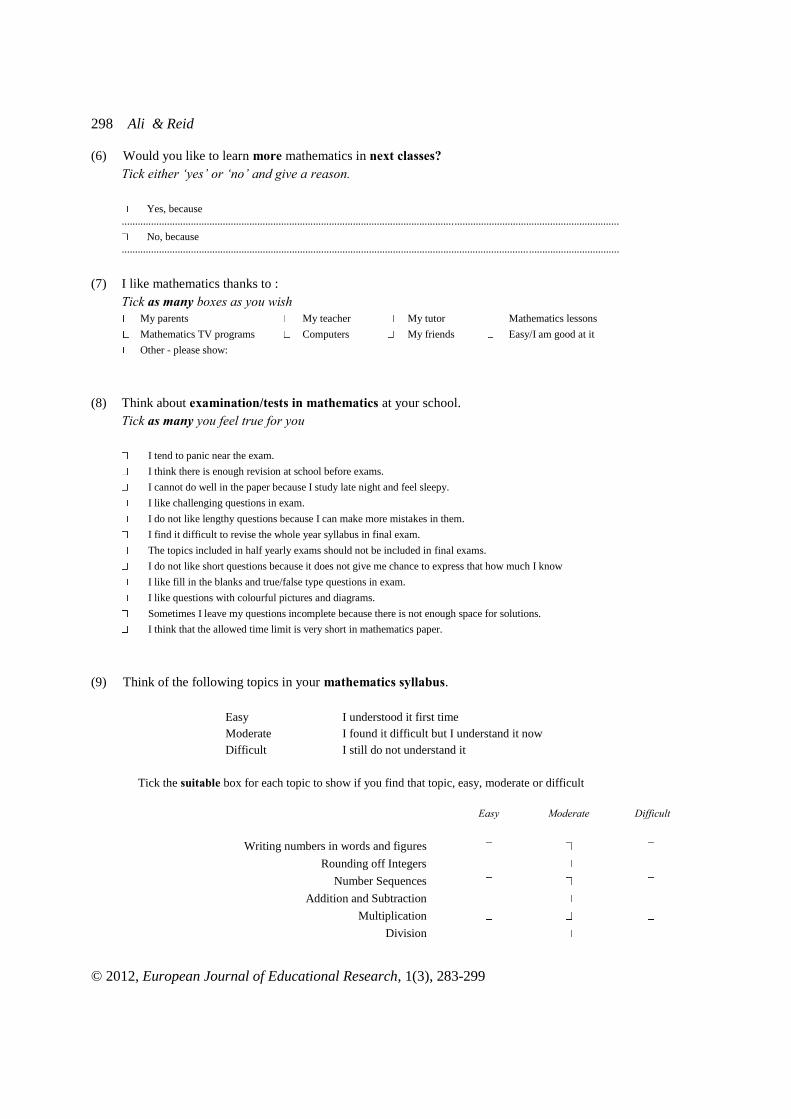
(6) Would you like to learn more mathematics in next classes?
Tick either ‘yes’ or ‘no’ and give a reason.
Yes, because
...........................................................................................................................................................................................
No, because
...........................................................................................................................................................................................
(7) I like mathematics thanks to :
Tick as many boxes as you wish
My parents My teacher My tutor Mathematics lessons
Mathematics TV programs Computers My friends Easy/I am good at it
Other - please show:
(8) Think about examination/tests in mathematics at your school.
Tick as many you feel true for you
I tend to panic near the exam.
I think there is enough revision at school before exams.
I cannot do well in the paper because I study late night and feel sleepy.
I like challenging questions in exam.
I do not like lengthy questions because I can make more mistakes in them.
I find it difficult to revise the whole year syllabus in final exam.
The topics included in half yearly exams should not be included in final exams.
I do not like short questions because it does not give me chance to express that how much I know
I like fill in the blanks and true/false type questions in exam.
I like questions with colourful pictures and diagrams.
Sometimes I leave my questions incomplete because there is not enough space for solutions.
I think that the allowed time limit is very short in mathematics paper.
(9) Think of the following topics in your mathematics syllabus.
Easy I understood it first time
Moderate I found it difficult but I understand it now
Difficult I still do not understand it
Tick the suitable box for each topic to show if you find that topic, easy, moderate or difficult
Easy Moderate Difficult
Writing numbers in words and figures
Rounding off Integers
Number Sequences
Addition and Subtraction
Multiplication
Division

Understanding Mathematics 299
© 2012, European Journal of Educational Research, 1(3), 283-299
Common Fractions
Decimal Fractions
Percentages
Use of Brackets
Even and Odd Numbers
Problem Solving
Organising and Using Data
Shapes and Measures
Rectangles
Triangles
Symmetry
Angles
Recognising Parallel / Perpendicular lines
Length, Mass, Capacity measurements
Area
Perimeters of rectangles and regular polygons
Time