Embed Size (px)
Citation preview

Understanding Major Analyses of H.R. 2454,American Clean Energy and Security Act of 2009
EPRI Global Climate ProgramJuly 22, 2009

2© 2009 Electric Power Research Institute, Inc. All rights reserved.
Announcements
Please put your phones on mute unless you have questions
Please raise questions at any time
Please do not put phones on hold
Webcast Recording Notice
• We are recording this webcast and its audio discussion.
• Your continuing participation in this webcast provides consent to the recording.
• If you do not consent, you should end your participation.
• We plan to make this recording available to members‐only.

3© 2009 Electric Power Research Institute, Inc. All rights reserved.
Background
• May 2008, we held a Capitol Hill workshop to understand cost estimates of Lieberman‐Warner
– Estimates from 6 modeling teams + CBO
– Differences due primarily to different baselines and different electric sector technology cost and deployment assumptions
– Presentations and webcast available at EPRI Newsroom archive:http://my.epri.com/portal/server.pt?open=512&objID=342&PageID=223366&cached=true&mode=2

4© 2009 Electric Power Research Institute, Inc. All rights reserved.
Today’s Webcast
• Is for members only (Climate Programs 102 and 103)
• Will help begin to understand the key assumptions that drive differences in analyses released to date
– Unlike Lieberman‐Warner, differences in $/ton cost estimates are driven assumptions about the availability of international offsets
– If offsets are limited, then the electric sector assumptions again become critical
• Is likely the beginning of a discussion – many more public analyses are on the way
Please participate actively!
What important questions/communication issues do you see?

5© 2009 Electric Power Research Institute, Inc. All rights reserved.
Webcast Overview
• Introduction to public estimates Tom Wilson
• Private NEMS analysis Vic Niemeyer
• Exploring EPA offset assumptions Francisco de la Chesnaye
• Examining household impacts Tom Wilson
• Thanks to Delavane Diaz and Adam Diamant for their help with
the presentation

6© 2009 Electric Power Research Institute, Inc. All rights reserved.
H.R. 2454: Combination of Incentives and Mandates Plus Economy‐wide Cap & Trade Program
• Titles I & II deal with clean energy and energy efficiency– CERES combines renewable electricity and energy efficiency standards– Energy efficiency programs, CCS and other technology programs
• Title III establishes a cap & trade system for greenhouse gas emissions– Cap decreases over time so that emissions are 17% below 2005 levels by 2020,
42% below by 2030, and 83% below by 2050– Unlimited banking of allowances, restrictions on borrowing– Strategic Allowance Reserve (1‐3% of allowances withheld)– Offsets limited to 2,000 million metric tons CO2 equivalent (MtCO2 e) per year
(actually less)– Supplemental reductions from reduced deforestation through allowance set‐
asides• Title IV addresses competitiveness issues / transition to a clean energy economy
– Creates an output‐based allowance allocation mechanism based on H.R. 7146 (Inslee‐Doyle bill)

7© 2009 Electric Power Research Institute, Inc. All rights reserved.
Waxman‐Markey Passed House 219‐212 on June 26th:Seeks to Cut CO2 Emissions Well Below Historic Levels
Generous Offset Provisions Could Loosen Emissions Cap(Adapted from MIT’s Denny Ellerman)
8

9© 2009 Electric Power Research Institute, Inc. All rights reserved.
Very Limited Number of Public Analyses to Date
Selected Analyses
• EPA – macroeconomic analyses with ADAGE and IGEM; electric sector analysis for “core” policy scenario with IPM
• CBO – input/output analysis that depends on EPA $/ton permit costs
• CRA (Black Chamber of Commerce)
• Heritage Foundation – macroeconomic analysis using IHS Global Insight
• MIT and others – generic analysis of cumulative allowable emissions from 2012 to 2050
– 167 billion metric tons == linear reductions to 80% below 2008 level
– 203 billion metric tons == linear reductions to 50% below 2008 level
Analyses to date focus primarily on Title III cap‐and‐trade provisions
Heritage Foundation provides limited results/assumptions (e.g., no estimate of $/ton allowance price reports); difficult to interpret

10© 2009 Electric Power Research Institute, Inc. All rights reserved.
Public Estimates of Waxman‐Markey Allowance Prices
Allowance Price Estimates for Waxman‐Markey
CRA high cost
CRA core refIGEM no int'l offsets (7)CRA low cost
ADAGE ref nuclear (5)ADAGE sensitivity (3,4,6)ADAGE core (2)
IGEM core (2)
$‐
$50
$100
$150
$200
2010 2015 2020 2025 2030 2035 2040 2045 2050
Allowance Price ‐ $/tCO2e
CRA high cost
CRA core ref
IGEM no int'l offsets (7)
CRA low cost
ADAGE ref nuclear (5)
ADAGE sensitivity (3,4,6)
ADAGE core (2)
IGEM core (2)

11© 2009 Electric Power Research Institute, Inc. All rights reserved.
Public Estimates of Waxman‐Markey Allowance Prices
Allowance Price Estimates for Waxman‐Markey
CRA high cost
CRA core refIGEM no int'l offsets (7)CRA low cost
ADAGE ref nuclear (5)ADAGE sensitivity (3,4,6)ADAGE core (2)
IGEM core (2)
$‐
$50
$100
$150
$200
2010 2015 2020 2025 2030 2035 2040 2045 2050
Allowance Price ‐ $/tCO2e
CRA high cost
CRA core ref
IGEM no int'l offsets (7)
CRA low cost
ADAGE ref nuclear (5)
ADAGE sensitivity (3,4,6)
ADAGE core (2)
IGEM core (2)
Assume offsets available and limits not binding
EPA – no international offests
CRA – full international offsets, price ??
No avoided deforestation; Offset price assumed to
equal domestic marginal cost

12© 2009 Electric Power Research Institute, Inc. All rights reserved.
EPA’s Analysis Shows Access to International Offsets is Critical for Allowance Cost Containment
Without international offsets, allowance price would increase 89% relative to H.R. 2454
Source: EPA Analysis of the American Clean Energy and Security Act of 2009, H.R. 2454 in the 111th Congress, U.S. EPA, 6/23/09, Page 31.
13© 2009 Electric Power Research Institute, Inc. All rights reserved.
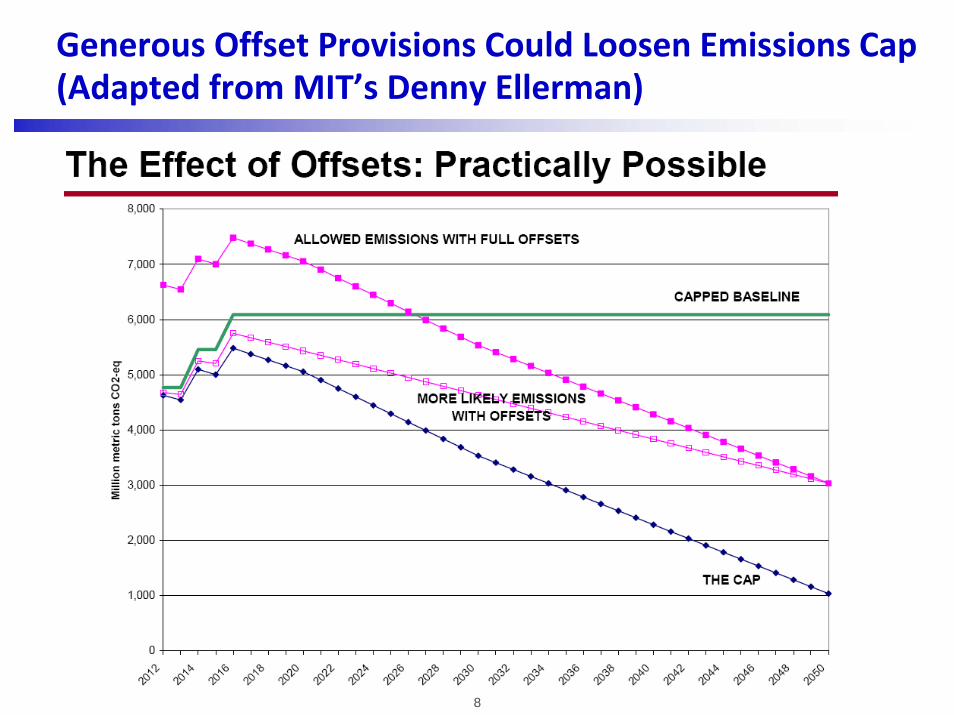
Where do Emission Reductions Come From?EPA HR 2454 Core Case, June 23
electric sectorelectric sector
offsetsoffsets

14© 2009 Electric Power Research Institute, Inc. All rights reserved.
Where do Emission Reductions Come From?Offsets (primarily international) and Electric Sector
electric sectorelectric sector electric sectorelectric sectoroffsetsoffsets
offsetsoffsets
EPA HR 2454 Core Case, June 23 CRA Reference Policy Case, 2009

15© 2009 Electric Power Research Institute, Inc. All rights reserved.
When Domestic Capped Reductions Have to be Made, Capital Costs for Low‐carbon Generation are Important
Overnight Capital Cost for 2020 Build
$
$1000
$2000
$3000
$4000
$5000
$6000
Nuclear IGCC CCS
(200
8$/kW)
EPA 2008 EPA 2009 CRA 2008 CRA 2009 EIA 2008 EIA 2009

16© 2009 Electric Power Research Institute, Inc. All rights reserved.
EPA Analyses of Reference and Policy Cases Estimate Limited Electric Capacity Additions through 2025
Note: EPA did not run their electric sector model for a case with limited international offsets
Cumulative Capacity Additions by Technology
0
50
100
150
200
250
300
350
2015 2020EPAref
2025 2015 2020EPAcore
2025 2015 2020CRAlow
2025 2015 2020CRAhigh
2025
Capacity Addition
s (GW)
Renewables
Nuclear
Nat Gas
Coal CCS
Coal

17© 2009 Electric Power Research Institute, Inc. All rights reserved.
Electric Sector Generation Mix Largely Unchanged in EPA Core Analysis
Modeled Electricity Generation Mix
0
1000
2000
3000
4000
5000
6000
2015 2020EPAcore
2025 2015 2020CRAlow
2025 2015 2020CRAhigh
2025
TWh Renewables
Hydro
Nuclear
Nat Gas
Coal CCS
Coal

18© 2009 Electric Power Research Institute, Inc. All rights reserved.
Estimated Allowance Prices for Waxman‐Markey Including EPRI/PacifiCorp NEMS Analyses
Allowance Price Estimates for Waxman‐Markey
CRA high cost
CRA core refIGEM no int'l offsets (7)CRA low cost
ADAGE ref nuclear (5)ADAGE sensitivity (3,4,6)ADAGE core (2)
IGEM core (2)
$‐
$50
$100
$150
$200
2010 2015 2020 2025 2030 2035 2040 2045 2050
Allowance Price ‐ $/tCO2e
NEMS core policy
NEMS 2B Offsets
NEMS 1B Offsets
NEMS 0.5B Offsets

19© 2009 Electric Power Research Institute, Inc. All rights reserved.
Private NEMS Analysis for PacifiCorp
• Preliminary NEMS results courtesy of PacifiCorp, a subsidiary of MidAmerican Energy Holdings Company
• NEMS and AEO 2009 publicly available from EIA
• EPRI applied model to represent Waxman‐Markey on behalf of PacifiCorp
– PacifiCorp assumptions on power plant costs (2008)
– PacifiCorp/EPRI team set scenarios

20© 2009 Electric Power Research Institute, Inc. All rights reserved.
NEMS Analysis Highlights Critical Role of Offset Availability Assumptions
• Based on AEO 2009 updated w. Stimulus Package and revised CAFE standards
• No link to macro economy
• Best‐effort representation of H.R.2454 (E&C version)
– Cap‐and‐trade program
– RES and Energy Efficiency provisions (15% + 5%)
• Reference Case has full 2b tons of offsets availability
• Three offsets sensitivity cases phase‐in offsets from zero
– Case 1 “Plentiful” 2 Billion Tons by 2030
– Case 2 “Scarce” 1 Billion Tons by 2030
– Case 3 “Very Scarce” half Billion Tons by 2030

21© 2009 Electric Power Research Institute, Inc. All rights reserved.
Offset Sensitivity Cases
Scenario Offset Availabilities
0
500
1,000
1,500
2,000
2,500
2007 2010 2013 2016 2019 2022 2025 2028
Offs
ets
(mm
t)
Ref Offsets Case 1 Case 2 Case 3

22© 2009 Electric Power Research Institute, Inc. All rights reserved.
NEMS Results Highlight Critical Importance of Offset Availability for Cost Containment
NEMS CO2 Price Path to Meet Abatement Target
$-
$50
$100
$150
$200
$250
2007 2010 2013 2016 2019 2022 2025 2028
CO
2 P
rice
($/m
etric
ton)
Full WM Offsets Offset Case 1 Offset Case 2 Offset Case 3
No offsets at first
Very scarce .5B by 2030
Offsets plentiful throughout
Scarce1B by 2030
Plentiful2B by 2030

23© 2009 Electric Power Research Institute, Inc. All rights reserved.
Results Also Show Electric Sector Providing Over 90% of Economy’s Total CO2 Abatement
Economy-Wide and Electric Sector CO2 Emissions
0
1,000
2,000
3,000
4,000
5,000
6,000
7,000
2007 2010 2013 2016 2019 2022 2025 2028
Mill
ion
Met
ric T
ons
of C
O2
Econ - Ref Offsets Econ - Case 1 Econ - Case 2 Econ - Case 3Elect - Ref Offsets Elect - Case 1 Elect - Case 2 Elect - Case 3

24© 2009 Electric Power Research Institute, Inc. All rights reserved.
Electric Consumers See Rate Increases (partly offset by allowance transfers – not shown)
Average Electricity Price
0
5
10
15
20
25
2007 2010 2013 2016 2019 2022 2025 2028
2007
cen
ts/k
Wh
Ref Offsets Case 1 Case 2 Case 3

25© 2009 Electric Power Research Institute, Inc. All rights reserved.
Generation By Fuel Type – HR 2454 with Full Offsets
Generation By Fuel Type - Ref Offsets
0
500
1,000
1,500
2,000
2,500
3,000
3,500
4,000
4,500
5,000
2007 2010 2013 2016 2019 2022 2025 2028
billio
n kw
h
DG (Natural Gas)Renewable SourcesPS/OtherNuclear PowerNatural GasPetroleumCoal

26© 2009 Electric Power Research Institute, Inc. All rights reserved.
Generation By Fuel Type – Offsets Limited to 1B (mostly burns more gas)
Generation By Fuel Type - Case 2
0
500
1,000
1,500
2,000
2,500
3,000
3,500
4,000
4,500
5,000
2007 2010 2013 2016 2019 2022 2025 2028
billio
n kw
h
DG (Natural Gas)Renewable SourcesPS/OtherNuclear PowerNatural GasPetroleumCoal

27© 2009 Electric Power Research Institute, Inc. All rights reserved.
Cumulative Capacity Additions – HR 2454 w Full Offsets
Cumu. Capacity Addition - Ref Offsets
0
50
100
150
200
250
2007 2010 2013 2016 2019 2022 2025 2028
GW
DGRenewableNuclearConv CTAdv CTConv CCAdv CC w/SeqAdv CCConv CoalIGCC w/SeqIGCC

28© 2009 Electric Power Research Institute, Inc. All rights reserved.
Cumulative Capacity Additions – Offsets Limited to 1B
Cumu. Capacity Addition - Case 2
0
50
100
150
200
250
2007 2010 2013 2016 2019 2022 2025 2028
GW
DGRenewableNuclearConv CTAdv CTConv CCAdv CC w/SeqAdv CCConv CoalIGCC w/SeqIGCC

29© 2009 Electric Power Research Institute, Inc. All rights reserved.
Exploring EPA’s Offset Assumptions

30© 2009 Electric Power Research Institute, Inc. All rights reserved.
Forest Management & Afforestation are the Largest Sources of Domestic Offsets
Source: Appendix to EPA Preliminary Analysis of the Waxman-Markey Discussion Draft, 4/20/09, P. 60
Source: EPA Analysis of H.R. 2454 6/23/09, P. 23.
EPA’s estimates are based upon Texas A&M’s FASOM model; Recent EPRI re-analysis with FASOM suggests lower domestic offset availability

31© 2009 Electric Power Research Institute, Inc. All rights reserved.
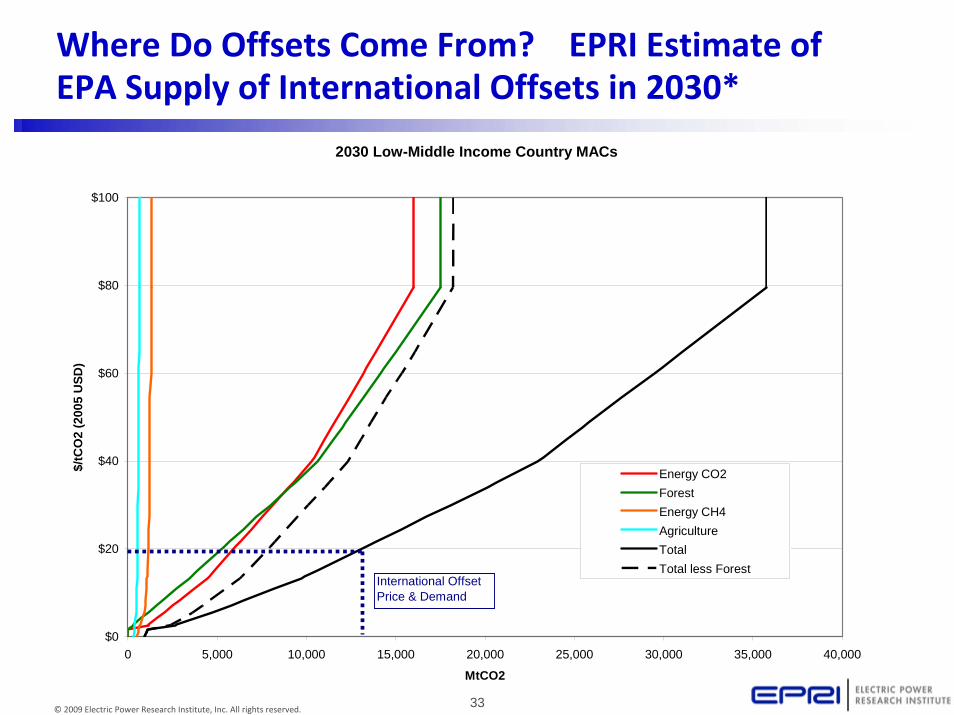
EPA Estimates of International Offsets are Based Upon Three Primary Sources
• Forestry emission reductions – afforestation, forest management, and avoided deforestation ‐‐ are based upon analyses using Brent Sohngen’s (Ohio State University) Global Timber Model (GTM)
• Energy sector CO2 reductions are estimated for an international climate policy scenario using Jae Edmond’s MiniCAM model
• Non‐CO2 emission reductions are based upon bottom‐up studies of each of the relevant sectors

32© 2009 Electric Power Research Institute, Inc. All rights reserved.
Where Do Offsets Come From? EPRI Estimate ofEPA Supply of International Offsets in 2010*
2010 Low-Middle Income Country MACs
$0
$20
$40
$60
$80
$100
0 500 1,000 1,500 2,000 2,500 3,000 3,500
MtCO2
$/tC
O2
(200
5 U
SD)
Energy CO2ForestEnergy CH4AgricultureTotalTotal less Forest
International Offset Price & Demand
33© 2009 Electric Power Research Institute, Inc. All rights reserved.
Where Do Offsets Come From? EPRI Estimate ofEPA Supply of International Offsets in 2030*
2030 Low-Middle Income Country MACs
$0
$20
$40
$60
$80
$100
0 5,000 10,000 15,000 20,000 25,000 30,000 35,000 40,000
MtCO2
$/tC
O2
(200
5 U
SD)
Energy CO2ForestEnergy CH4AgricultureTotalTotal less Forest
International Offset Price & Demand

34© 2009 Electric Power Research Institute, Inc. All rights reserved.
Critical Weaknesses in Committee Defined Scenarios:Potential Availability of Offsets is Overestimated
International energy CO2 offset availability depends critically upon the international climate policy scenario
• EPA offset dataset based upon
– Group 1 countries (Kyoto group less Russia) follow an allowance path that is falling gradually from the simulated Kyoto emissions levels in 2012 to 50% below 1990 in 2050.
– Group 2 countries (rest of world) adopt a policy beginning in 2025 that returns each to 2015 emissions levels through 2034, and then returns and maintains them at 2000 emissions levels from 2035 to 2050.
• G8 has stated a much stronger position:
– “the G8 Leaders agreed to reduce their emissions 80% or more by 2050 as its share of a global goal to lower emissions 50% by 2050, acknowledging the broad scientific view that warming should be limited to no more than two degrees Celsius.”
• If G8 goal is implemented, the current EPA analysis overstates availability of international energy offsets
35© 2009 Electric Power Research Institute, Inc. All rights reserved.
Offset Supply Curves Have Important Limitations:They Do Not Fully Reflect Implementation Challenges
• Domestic offsets – relatively small potential– EPA estimates only ~170MtCO2 annually through 2020– Most to be derived from forest management & afforestation– CH4 offsets largely not available due to new NSPS (CMM & LFG)– EPA may be underestimating N2O offsets in agriculture– Rulemakings / protocols / methodologies will take time to develop
• International Offsets – large potential, but hard to implement– Sectoral offsets– Offsets issued by an international body (e.g., CDM)– Reduced Emissions from Deforestation and Degradation (REDD)– All three categories are problematic!

36© 2009 Electric Power Research Institute, Inc. All rights reserved.
Bottom Line on Offset Analysis
• Domestic offsets are expected to be very limited in the near term.
• The availability of international offsets depends on the assumption about international policies
– the more stringent the international climate policy, the less international offsets available!
• Allowing extensive international offsets limits the ability of US‐only models to give useful answers. You have to understand the international policy!
• Finally, EPRI is revisiting the EPA analyses of domestic and international forestry offsets … results at Fall advisory meeting in Colorado

37© 2009 Electric Power Research Institute, Inc. All rights reserved.
Household Cost Impacts: A Postage Stamp a Day?Waxman‐Markey Household Costs Make Headlines
• EPA: “Cost to households averaged over the years 2010 to 2050 will be between $80 and $111”
• CRA: “Costs per household could be from $600 to $1600 in 2020”• CBO: “Cost average household $175 in higher energy costs in 2020”
– API’s Jack Gerard: “when faulty assumptions…are corrected, the annual cost to a household could be as much as $3,300 by 2020”
• ACEEE: “Waxman‐Markey could save approximately $1,050 per household by 2020 and $4,400 per household by 2030”
• Heritage: “Raise average family's annual energy bill by $1,500”• MIT’s John Reilly often misrepresented 2008 analysis: Claims that climate policy will cost +$3000 are incorrect $800 is correct
This year media and interest groups have grabbed hold of household impacts, not allowance price, to either attack or defend the climate bill– Differences are largely driven by analytic approach and
interpretation of allowance allocation; we will return to this later
‐ $1050ACEEE
$80‐111EPA
$175CBO
$800CRA
$3300API
$1500HF
…$0

38© 2009 Electric Power Research Institute, Inc. All rights reserved.
Household Impacts Depend Upon …
• Estimated cost of the policy – some say High, others, Low
• Particular cost estimate that is used – e.g., lost consumption, GDP loss, cost of making reductions, size of the allowance market, bottom‐up partial estimate of cost
• Assumptions about where permit revenue goes

39© 2009 Electric Power Research Institute, Inc. All rights reserved.
EPA versus Heritage Foundation
• EPA assumes extensive availability of low cost offsets so costs/household are low
– In 2020, EPA estimates policy cost to be $28 billion
• $ 7 billion of reductions in sectors under the cap
• $ 2 billion for domestic offsets
• $20 billion for international offsets
– Size of allowance market ‐‐ $79 billion
• Heritage Foundation
– Limits the use of offsets to 15% of cap which necessitates extensive reductions from the electric sector
– Limits electric technology availability, which necessitates a big demand response
• limits renewables to current state requirements
• does not allow significant penetration of CCS
• limits nuclear to 16GW of growth through 2050
– Gets much higher policy cost

40© 2009 Electric Power Research Institute, Inc. All rights reserved.
John Boehner (House Minority Leader) vs. John Reilly (MIT)
• Boehner used 2007 MIT estimate of the size of the allowance market and divided by households to get $3000+
• Reilly pointed out that allowance revenue gets recycled back into the economy – directly to households, to households via businesses, or to households via government .
– Reilly argued that the cost per household from the analysis was $800 – the cost of making reductions

41© 2009 Electric Power Research Institute, Inc. All rights reserved.
CBO Analysis – Assumptions about Where Permit Value Goes
CBO starts with a low cost based on preliminary EPA analysis ‐‐ $28/ton CO2 in 2020 with 83% of allowances gratis
• Rising energy costs and consequent rises in costs of goods and services that households consume ‐‐ $110 billion or $890/household
• Emission allowances increase household purchasing power via
– Benefit payments
– Rebates
– Tax decreases or credits
– Wages
– Returns on investments
• CBO estimates household benefits of
– $28 billion to offset higher energy costs
– $47 billion to businesses, that will increase return on household investments
– $10 billion to Federal and state government for technology development and energy efficiency, which will increase wages, decrease energy bills, etc.
• Bottom line ‐‐ $175/household

42© 2009 Electric Power Research Institute, Inc. All rights reserved.
Concluding Thoughts
• We hope the webcast has helped improve your understanding of the key assumptions that drive differences in analyses released to date
– Unlike Lieberman‐Warner, differences in $/ton cost estimates are driven assumptions about the availability of international offsets
– If offsets are limited, then the electric sector assumptions again become critical
– International offsets make this an international modeling issue
• Many more public analyses are on the way … given your interest, we will plan to continue the discussion
• Hope to see you October 6‐7 in Colorado!

43© 2009 Electric Power Research Institute, Inc. All rights reserved.
For more information:
Tom Wilson 650‐855‐7928 [email protected]
Vic Niemeyer 650‐855‐2744 [email protected]
Francisco 202‐293‐6347 [email protected] la Chesnaye