Embed Size (px)
Citation preview
1
UNDERSTANDING KEY ISSUES FACING U. S. WEST
COAST SWORDFISH FISHERIES AND CONSUMERS
A NOAA National Marine Fisheries Service White Paper
Southwest Region and Southwest Fisheries Science Center1
I. Introduction
The broadbill swordfish (Xiphias gladius) complements seafood palates throughout the
developed world especially in the United States, Europe, and Japan, where it is
considered luxury cuisine (Govender et al., 2003). Fisheries in the Pacific, Indian, and
Atlantic Oceans including the Mediterranean Sea supply the demand. Swordfish are
highly migratory and cosmopolitan in distribution ranging between the 50°N and 50°S
latitudes (Ward, Porter and Elscot, 2000; Hinton, 2003).
As is true for nearly all fisheries, the harvest of swordfish can incur unintended impacts
to the ecosystem such as the capture and discard of non-targeted mega fauna (e.g., sharks,
marine mammals, seabirds, and sea turtles). These associated ecological costs, known as
“bycatch,” come as an incidental part of most any food production system such as
commercial fishing (Bartram and Kaneko, 2004).
Probably more attention and effort has been directed towards sea turtle interactions than
any other fauna as fisheries bycatch is recognized to be a major threat to all seven sea
turtle species (Wallace et al., 2010). In the North Pacific Ocean (NPO), international
efforts to recover sea turtle populations, all of which are threatened or endangered under
the Endangered Species Act (ESA), have suggested a holistic suite of broad-based
terrestrial and marine actions. The use of sustainable fishery practices designed to reduce
sea turtle interactions and mortalities in at-sea and coastal fisheries is considered the
primary ocean-based strategy to restore sea turtles (Bellagio Steering Committee, 2004;
FAO, 2004; Kaplan, 2005; Seminoff et al., 2007; Dutton and Squires, 2008).
In federal NPO swordfish fisheries, NOAA’s National Marine Fisheries Service’s
(NMFS) fishery managers have used different strategies to minimize sea turtle
interactions for addressing ecosystem sustainability. Conservation measures have
included hard cap limits on sea turtle interactions, use of specific hook and bait
modifications, time/area closures, and even disapproving particular fishery plans due to
inadequate conservation measures. Such strategies are ideally designed to achieve desired
conservation objectives while attempting not to seriously compromise economic aspects
of the fishery. However, fisheries management schemes are adaptive, meaning that
management actions may be adjusted if the impacts of fishing operations change. For
example, NMFS opined in a 2000 ESA Section 7 consultation that the U. S. West Coast
California/Oregon drift gillnet (DGN) fishery would likely jeopardize the existence of sea
turtles (NMFS, 2000). Consequently, NMFS implemented time/area closures to protect
1 NMFS contributors are listed alphabetically: Craig D’Angelo, Heidi Dewar, Mark Helvey, Naresh
Pradhan, Sunee Sonu, Dale Squires, Jenny Sun, Yonat Swimmer, and Charles Villafana,
2
these stocks, an appropriate avoidance strategy for mitigating the effects of entanglement
gear (Valdermarsen and Suuronen, 2003). One of these closures, designed to protect
leatherback sea turtles, annually closes off over 213,000 sq. miles of prime swordfish
fishing grounds during a 3-month period.
In another effort to protect leatherback and loggerhead sea turtles, NMFS disapproved the
high seas longline swordfish fishery component of the Fishery Management Plan (FMP)
for U.S. West Coast Fisheries for Highly Migratory Species (HMS FMP) because the
plan did not limit fishing effort on the seaward side of the U. S. Exclusive Economic
Zone (EEZ). The agency then proceeded to implement regulations prohibiting swordfish
longline sets on the high seas in the Pacific Ocean east of 1500
longitude by vessels
managed under the HMS FMP2.
These examples of ecosystem-based fishery management substantially curtailed one
swordfish fishery and closed another because sufficient safeguards were not in place.
The net result is that while there is better protection for sea turtles, the U.S. West Coast
now plays an even smaller role in providing a source of sustainable swordfish to meet
strong U.S. consumer demand. With less locally caught product available, it is expected
that U.S. consumers will rely more on foreign sources of swordfish. In 2009, the United
States imported 77 percent of the 18,000 metric tons of swordfish it consumed.
Ironically, these foreign sources of swordfish are believed to elicit greater ecosystem
impacts especially to sea turtles because of less stringent and enforceable fishing
restrictions compared to heavily regulated U.S. fisheries (Santora, 2003; Bartram and
Kaneko, 2004; Gilman et al. 2006; Sarimento, 2006; Rausser et al. 2009; Bartram et al.,
2010).
In a 2008 workshop convened by NMFS to explore ways of coupling adaptive but well-
regulated fisheries management, the need for an active U.S. West Coast swordfish fishery
was recognized, not only for generating economic benefits to local fishing communities,
but also to provide societal benefits by giving U.S. consumers a reliable and local source
of sustainably caught swordfish (NMFS 2009). However, U.S. fisheries such as the
California DGN fishery are often overlooked in environmental efforts designed to shape
public opinion and change consumer behavior (e.g., boycotts, seafood guides,
ecolabelling, and retailer pressure) for seafood harvested from sustainable stocks and by
harvesting methods based on the best available science. Oftentimes, the substantive
regulations placed on U. S. fishing operations compared to foreign counterparts due to
the intertwined conservation mandates of the Magnuson Steven Act, the Marine Mammal
Protection Act, and the ESA go unnoticed by the public.
The potential consequence of diminishing U.S. fisheries such as the California DGN
swordfish fishery is that U.S. consumers will continue to enjoy the benefits of imported
fish products that may come at the cost of imparting greater harm to ecosystems beyond
U.S. jurisdiction. Consumers continue to enjoy swordfish through foreign fishermen
2 Because these regulations only apply to U.S. fishermen, they have no impact on the approximately 11
foreign fleets known to fish this same area (Hinton et al., 2005).
3
harvesting their seafood without having to incur any of the concomitant environmental
costs in their own waters. The question then becomes how well consumers understand
the importance of knowing where there seafood came from and how it was harvested?
This workshop will probe that question by working towards a common understanding
among the invited participants on current issues facing and the potential future of the U.S.
west coast swordfish fisheries. In order to achieve this objective, the workshop is
structured so that participants will leave with a shared understanding of the current state
of knowledge on the biological, ecological, and socio-economic factors affecting these
fisheries. The reminder of this paper provides a general glimpse of the current situation.
II. Swordfish Supply and Demand
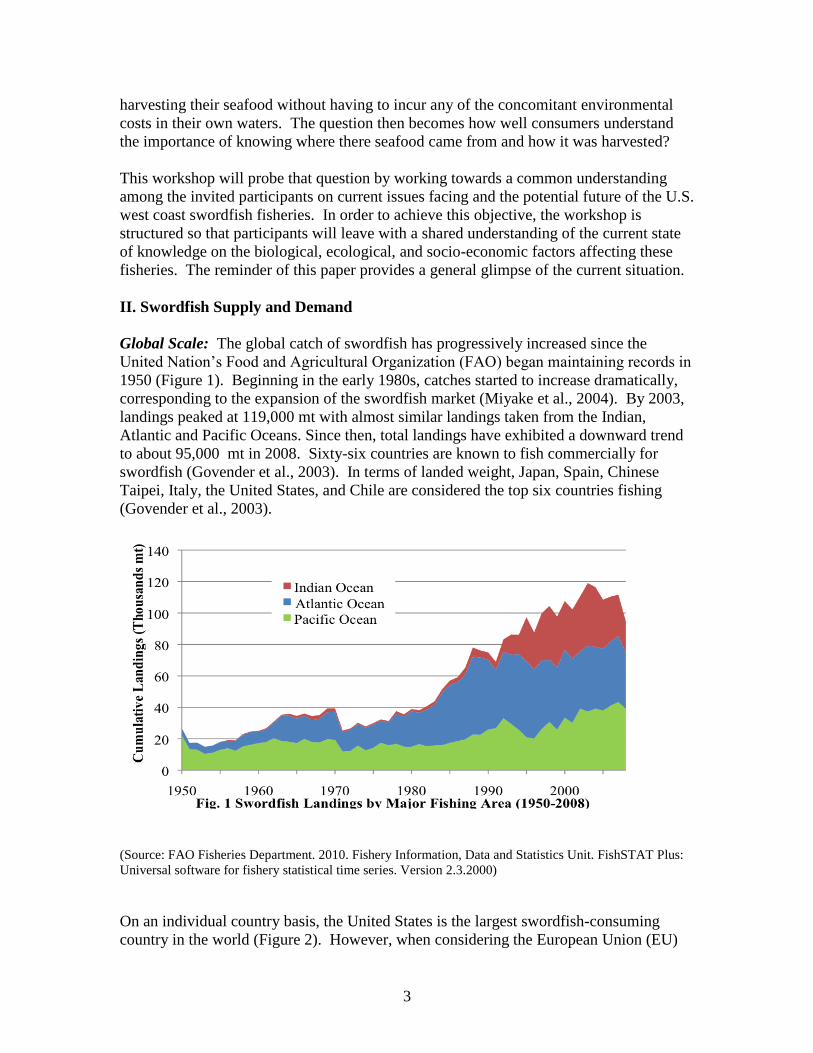
Global Scale: The global catch of swordfish has progressively increased since the
United Nation’s Food and Agricultural Organization (FAO) began maintaining records in
1950 (Figure 1). Beginning in the early 1980s, catches started to increase dramatically,
corresponding to the expansion of the swordfish market (Miyake et al., 2004). By 2003,
landings peaked at 119,000 mt with almost similar landings taken from the Indian,
Atlantic and Pacific Oceans. Since then, total landings have exhibited a downward trend
to about 95,000 mt in 2008. Sixty-six countries are known to fish commercially for
swordfish (Govender et al., 2003). In terms of landed weight, Japan, Spain, Chinese
Taipei, Italy, the United States, and Chile are considered the top six countries fishing
(Govender et al., 2003).
(Source: FAO Fisheries Department. 2010. Fishery Information, Data and Statistics Unit. FishSTAT Plus:
Universal software for fishery statistical time series. Version 2.3.2000)
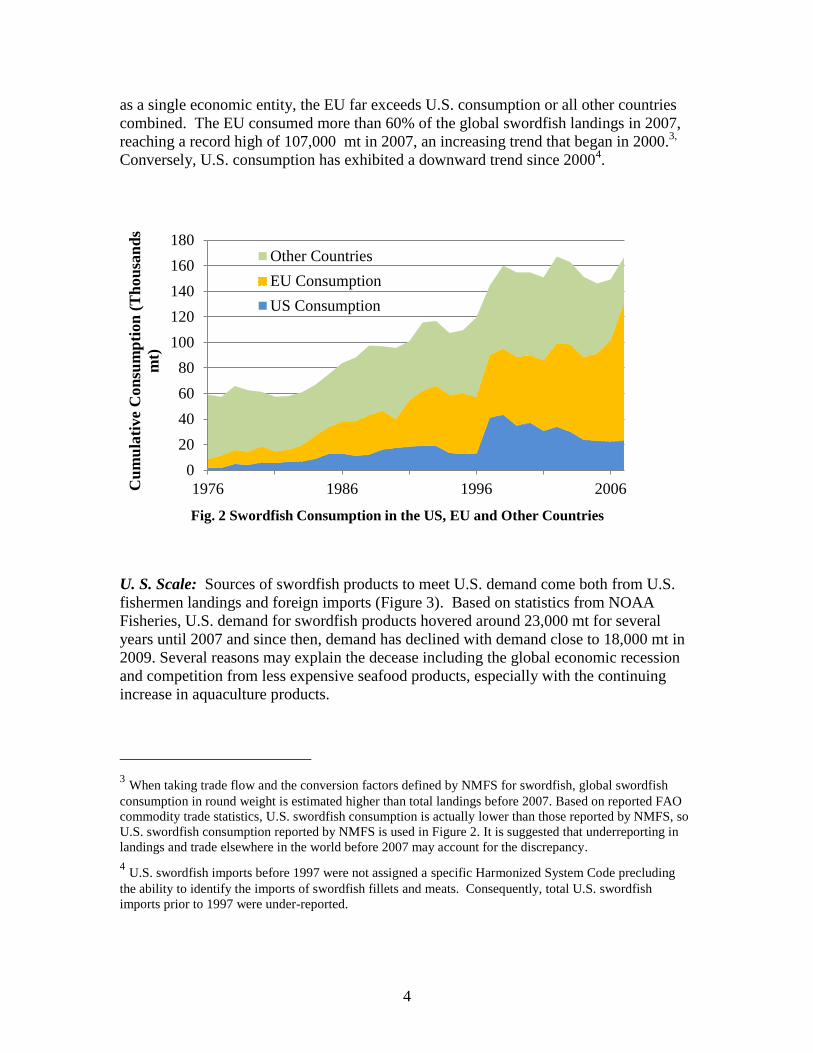
On an individual country basis, the United States is the largest swordfish-consuming
country in the world (Figure 2). However, when considering the European Union (EU)
4
as a single economic entity, the EU far exceeds U.S. consumption or all other countries
combined. The EU consumed more than 60% of the global swordfish landings in 2007,
reaching a record high of 107,000 mt in 2007, an increasing trend that began in 2000.3,
Conversely, U.S. consumption has exhibited a downward trend since 20004.
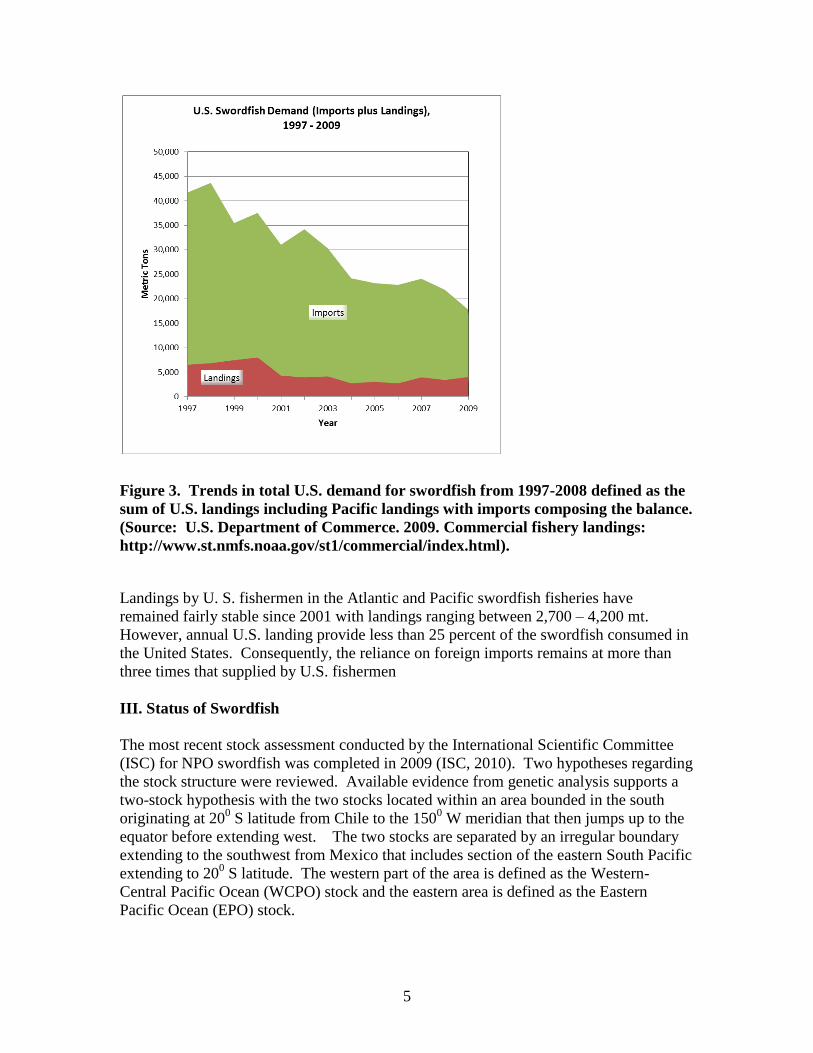
U. S. Scale: Sources of swordfish products to meet U.S. demand come both from U.S.
fishermen landings and foreign imports (Figure 3). Based on statistics from NOAA
Fisheries, U.S. demand for swordfish products hovered around 23,000 mt for several
years until 2007 and since then, demand has declined with demand close to 18,000 mt in
2009. Several reasons may explain the decease including the global economic recession
and competition from less expensive seafood products, especially with the continuing
increase in aquaculture products.
3 When taking trade flow and the conversion factors defined by NMFS for swordfish, global swordfish
consumption in round weight is estimated higher than total landings before 2007. Based on reported FAO
commodity trade statistics, U.S. swordfish consumption is actually lower than those reported by NMFS, so
U.S. swordfish consumption reported by NMFS is used in Figure 2. It is suggested that underreporting in
landings and trade elsewhere in the world before 2007 may account for the discrepancy.
4 U.S. swordfish imports before 1997 were not assigned a specific Harmonized System Code precluding
the ability to identify the imports of swordfish fillets and meats. Consequently, total U.S. swordfish
imports prior to 1997 were under-reported.
0
20
40
60
80
100
120
140
160
180
1976 1986 1996 2006Cu
mu
lati
ve
Con
sum
pti
on
(T
hou
san
ds
mt)
Other Countries
EU Consumption
US Consumption
Fig. 2 Swordfish Consumption in the US, EU and Other Countries
5
Figure 3. Trends in total U.S. demand for swordfish from 1997-2008 defined as the
sum of U.S. landings including Pacific landings with imports composing the balance.
(Source: U.S. Department of Commerce. 2009. Commercial fishery landings:
http://www.st.nmfs.noaa.gov/st1/commercial/index.html).
Landings by U. S. fishermen in the Atlantic and Pacific swordfish fisheries have
remained fairly stable since 2001 with landings ranging between 2,700 – 4,200 mt.
However, annual U.S. landing provide less than 25 percent of the swordfish consumed in
the United States. Consequently, the reliance on foreign imports remains at more than
three times that supplied by U.S. fishermen
III. Status of Swordfish
The most recent stock assessment conducted by the International Scientific Committee
(ISC) for NPO swordfish was completed in 2009 (ISC, 2010). Two hypotheses regarding
the stock structure were reviewed. Available evidence from genetic analysis supports a
two-stock hypothesis with the two stocks located within an area bounded in the south
originating at 200 S latitude from Chile to the 150
0 W meridian that then jumps up to the
equator before extending west. The two stocks are separated by an irregular boundary
extending to the southwest from Mexico that includes section of the eastern South Pacific
extending to 200 S latitude. The western part of the area is defined as the Western-
Central Pacific Ocean (WCPO) stock and the eastern area is defined as the Eastern
Pacific Ocean (EPO) stock.
6
Results from the stock assessment indicate that the exploitable biomass of both stocks is
above biomass levels necessary to achieve maximum sustainable yield (i.e., BMSY) and
that both stocks are in good condition. As a result of this latest stock status, it was
concluded that the WCPO and EPO stocks of swordfish are healthy and above the level
required to sustain recent catches (ISC, 2010).
IV. Status of Pacific Sea Turtles (adapted from NMFS, 2009)
The waters off the U.S. West Coast are considered a productive area for North Pacific
swordfish, but they are also considered an important foraging area for ESA-listed
leatherback and loggerhead sea turtles. Analyses of genetic data and satellite tracking of
leatherbacks by the SWFSC indicate that these animals originate from nesting beaches in
the western Pacific (e.g., Indonesia and Solomon Islands) (Benson et al. 2007). These
turtles are genetically distinct from turtles nesting in the eastern Pacific that forage in the
southeastern Pacific (Dutton et al. 2007) and are threatened by swordfish fisheries
operating out of Central and South America.
All swordfish fleets operating in the North Pacific have the potential to directly interact
with the western leatherback sea turtle stock (Benson, et al. 2007). In the western Pacific,
there are an estimated 1,100 to 1,800 females nesting each year at 28 nesting sites, and
leatherbacks typically nest every other year. The overall estimate of nesting females in
this area is approximately 2,700 to 4,500 individuals, although these are considered rough
estimates, since they are derived from nest counts (Dutton et al. 2007). While this
subpopulation is not experiencing the dramatic declines that are evident in the eastern
Pacific subpopulation, there have been significant declines at long-term monitored
beaches since the 1980s (Hitipeuw et al. 2007).
V. History and Current Status of U. S. West Coast Swordfish Fisheries
Off the U. S. West Coast, the swordfish fishery predates European settlement. From at
least the 1st century AD, the Chumash tribe in California’s Santa Barbara region caught
swordfish with harpoons thrown from plank canoes (Davenport et al. 1993). This
method depended on a behavioral trait of swordfish called “finning” where they
periodically surface, The harpoon fishery was revived in the early 1900’s by southern
California fishermen (Coan et al., 1998) and grew in response to consumer demand for
swordfish (Sakagawa, 1989).
Harpoon fishing remained the only legal means of harvesting swordfish until the late
1970s when a few vessels began targeting common thresher sharks (Alopias vulpinus)
using gillnets. Almost immediately, swordfish and shortfin mako (Isurus oxyrinchus)
became important components of the catch (Hanan and Coan, 1993). It was soon
discovered that for targeting swordfish, the nets were more cost effective in terms of fuel
economy and yielded greater catches than harpoons. Swordfish was also worth nearly
four times the dockside value of sharks (Bedford 1987; Holts 1988), and by the early
1980s, swordfish became the primary target species for the DGN fleet.
7
Due to the harpoon fishery’s dependency on calm seas (Sakagawa, 1989; Coan et al.,
1998), and the greater efficiency of entanglement, the DGN fishery evolved as the
primary means of harvesting swordfish off the U. S. West Coast until around 1991.
During the 1991-1992 fishing season, three high seas5 longline vessels relocated to
California, fishing seaward of the 200 mile EEZ of the West Coast. By 1994, the number
of vessels grew to 31 (Vojkovich and Barsky, 1998). Beginning in 1995, the majority of
these vessels departed for Hawaii and began following swordfish movements by
operating out of Hawaii in the spring and summer and California in the fall and winter
(PFMC, 2003). The west coast fishery continued until 2004 when the Pacific Council’s
HMS FMP was implemented, effectively prohibiting shallow set longlines between the
mainland and the 1500
W. longitude due to inadequate sea turtle protections.6 Since then,
the DGN fishery returned as the predominate method used to harvest swordfish off the U.
S. West Coast with the current fleet operating out of California.
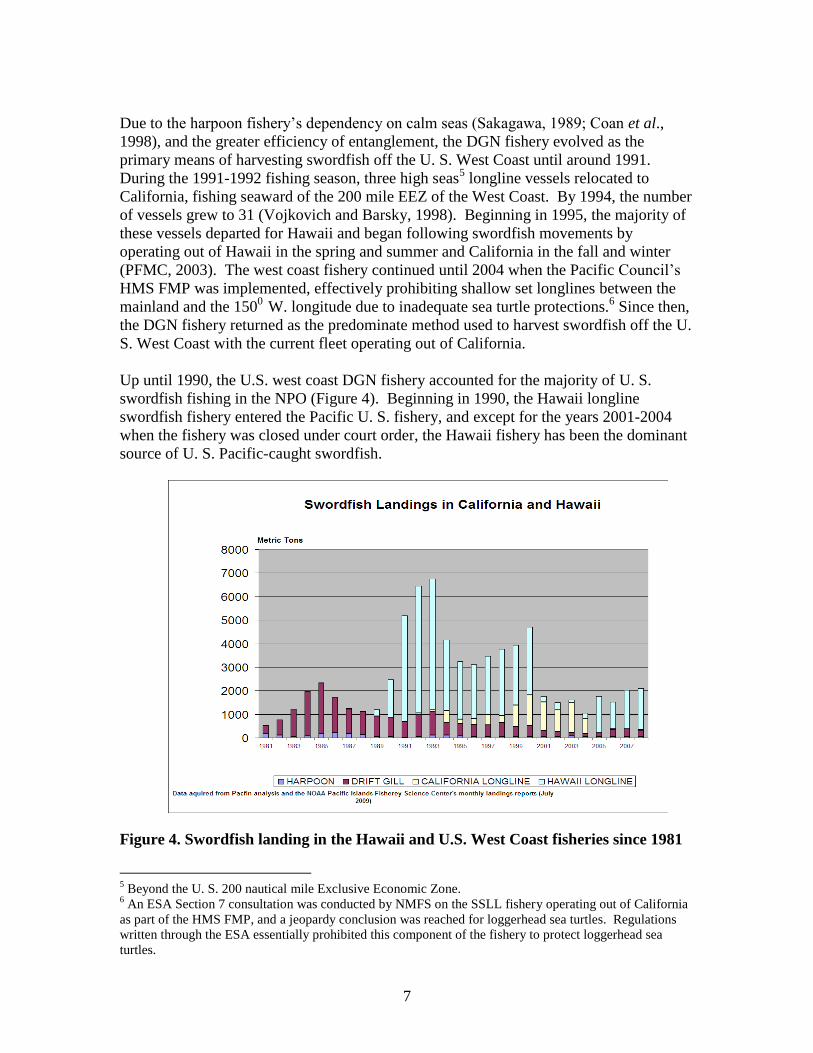
Up until 1990, the U.S. west coast DGN fishery accounted for the majority of U. S.
swordfish fishing in the NPO (Figure 4). Beginning in 1990, the Hawaii longline
swordfish fishery entered the Pacific U. S. fishery, and except for the years 2001-2004
when the fishery was closed under court order, the Hawaii fishery has been the dominant
source of U. S. Pacific-caught swordfish.
Figure 4. Swordfish landing in the Hawaii and U.S. West Coast fisheries since 1981
5 Beyond the U. S. 200 nautical mile Exclusive Economic Zone.
6 An ESA Section 7 consultation was conducted by NMFS on the SSLL fishery operating out of California
as part of the HMS FMP, and a jeopardy conclusion was reached for loggerhead sea turtles. Regulations
written through the ESA essentially prohibited this component of the fishery to protect loggerhead sea
turtles.
8
Since 1990, when NMFS approved observers were first placed on DGN vessels, the
number of active vessels participating in the DGN fishery has ranged from a high of 129
vessels in 1990 and 1994 to a low of 32 in 2009. Industry representatives attribute the
decline in vessel participation and annual effort to regulations implemented to protect
threatened and endangered marine mammals, sea turtles, and seabirds (PFMC, 2009). It is
believed that the closure especially affected vessels home ported north of Pt. Conception,
and especially smaller vessels that have a harder time getting around the frequent rough
waters near Pt. Conception.
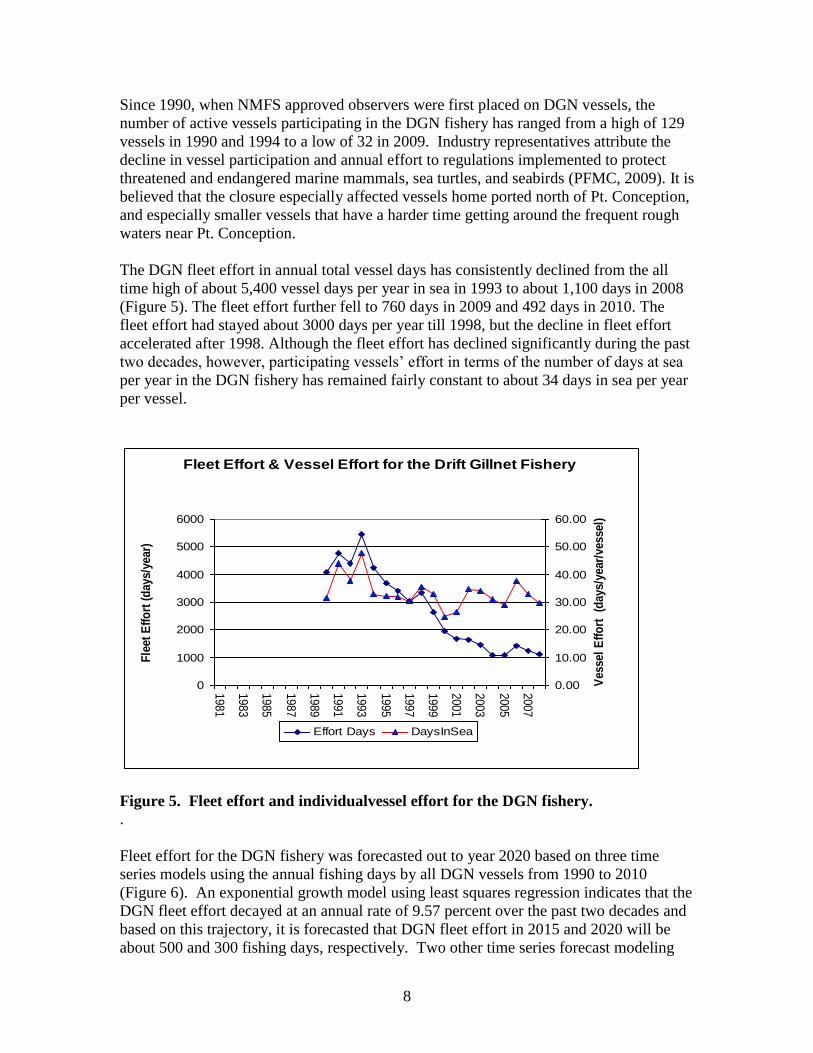
The DGN fleet effort in annual total vessel days has consistently declined from the all
time high of about 5,400 vessel days per year in sea in 1993 to about 1,100 days in 2008
(Figure 5). The fleet effort further fell to 760 days in 2009 and 492 days in 2010. The
fleet effort had stayed about 3000 days per year till 1998, but the decline in fleet effort
accelerated after 1998. Although the fleet effort has declined significantly during the past
two decades, however, participating vessels’ effort in terms of the number of days at sea
per year in the DGN fishery has remained fairly constant to about 34 days in sea per year
per vessel.
Figure 5. Fleet effort and individualvessel effort for the DGN fishery. .
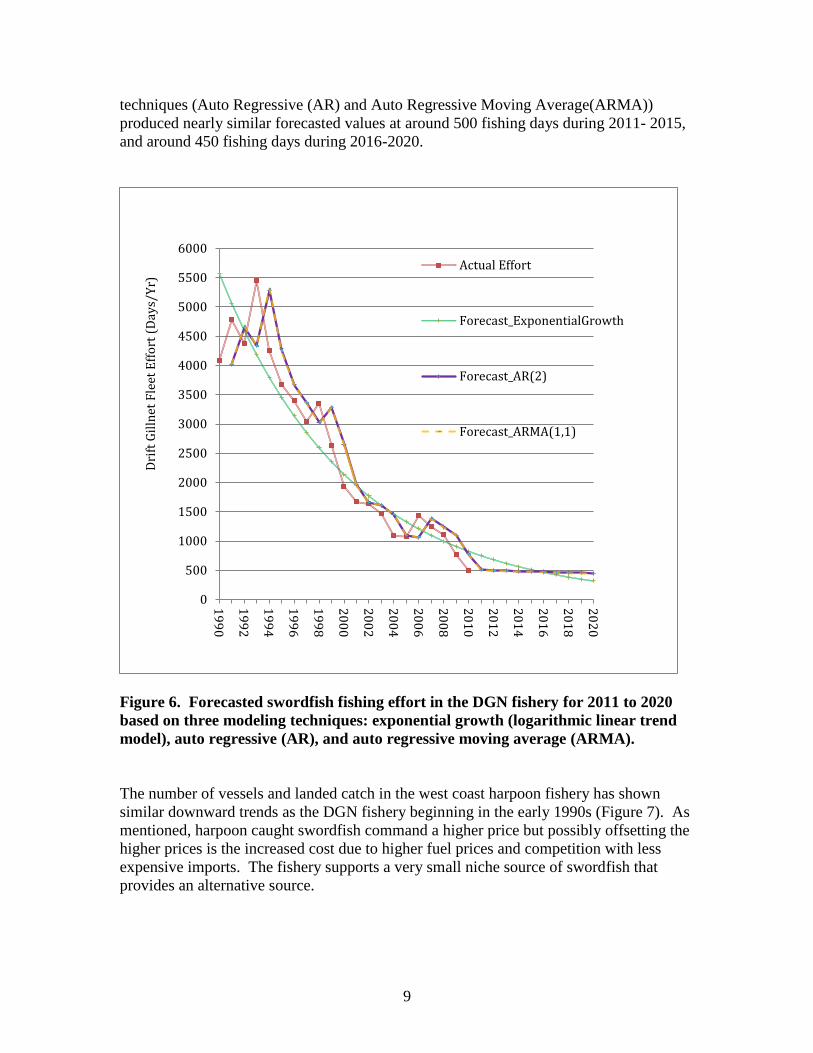
Fleet effort for the DGN fishery was forecasted out to year 2020 based on three time
series models using the annual fishing days by all DGN vessels from 1990 to 2010
(Figure 6). An exponential growth model using least squares regression indicates that the
DGN fleet effort decayed at an annual rate of 9.57 percent over the past two decades and
based on this trajectory, it is forecasted that DGN fleet effort in 2015 and 2020 will be
about 500 and 300 fishing days, respectively. Two other time series forecast modeling
Fleet Effort & Vessel Effort for the Drift Gillnet Fishery
0
1000
2000
3000
4000
5000
6000
1981
1983
1985
1987
1989
1991
1993
1995
1997
1999
2001
2003
2005
2007
Fle
et
Eff
ort
(d
ays/y
ear)
0.00
10.00
20.00
30.00
40.00
50.00
60.00
Vessel
Eff
ort
(d
ays/y
ear/
vessel)
Effort Days DaysInSea
9
techniques (Auto Regressive (AR) and Auto Regressive Moving Average(ARMA))
produced nearly similar forecasted values at around 500 fishing days during 2011- 2015,
and around 450 fishing days during 2016-2020.
Figure 6. Forecasted swordfish fishing effort in the DGN fishery for 2011 to 2020
based on three modeling techniques: exponential growth (logarithmic linear trend
model), auto regressive (AR), and auto regressive moving average (ARMA).
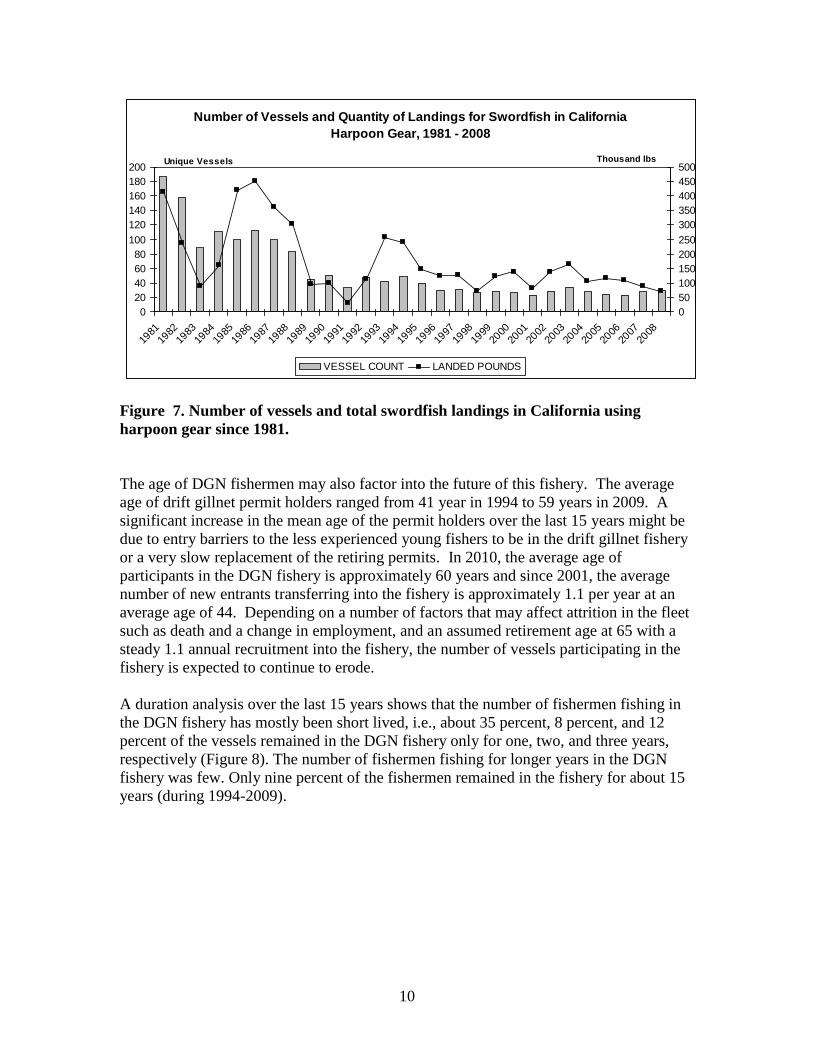
The number of vessels and landed catch in the west coast harpoon fishery has shown
similar downward trends as the DGN fishery beginning in the early 1990s (Figure 7). As
mentioned, harpoon caught swordfish command a higher price but possibly offsetting the
higher prices is the increased cost due to higher fuel prices and competition with less
expensive imports. The fishery supports a very small niche source of swordfish that
provides an alternative source.
0
500
1000
1500
2000
2500
3000
3500
4000
4500
5000
5500
6000
19
90
19
92
19
94
19
96
19
98
20
00
20
02
20
04
20
06
20
08
20
10
20
12
20
14
20
16
20
18
20
20
Dri
ft G
illn
et F
leet
Eff
ort
(D
ays/
Yr)
Actual Effort
Forecast_ExponentialGrowth
Forecast_AR(2)
Forecast_ARMA(1,1)
10
Figure 7. Number of vessels and total swordfish landings in California using
harpoon gear since 1981.
The age of DGN fishermen may also factor into the future of this fishery. The average
age of drift gillnet permit holders ranged from 41 year in 1994 to 59 years in 2009. A
significant increase in the mean age of the permit holders over the last 15 years might be
due to entry barriers to the less experienced young fishers to be in the drift gillnet fishery
or a very slow replacement of the retiring permits. In 2010, the average age of
participants in the DGN fishery is approximately 60 years and since 2001, the average
number of new entrants transferring into the fishery is approximately 1.1 per year at an
average age of 44. Depending on a number of factors that may affect attrition in the fleet
such as death and a change in employment, and an assumed retirement age at 65 with a
steady 1.1 annual recruitment into the fishery, the number of vessels participating in the
fishery is expected to continue to erode.
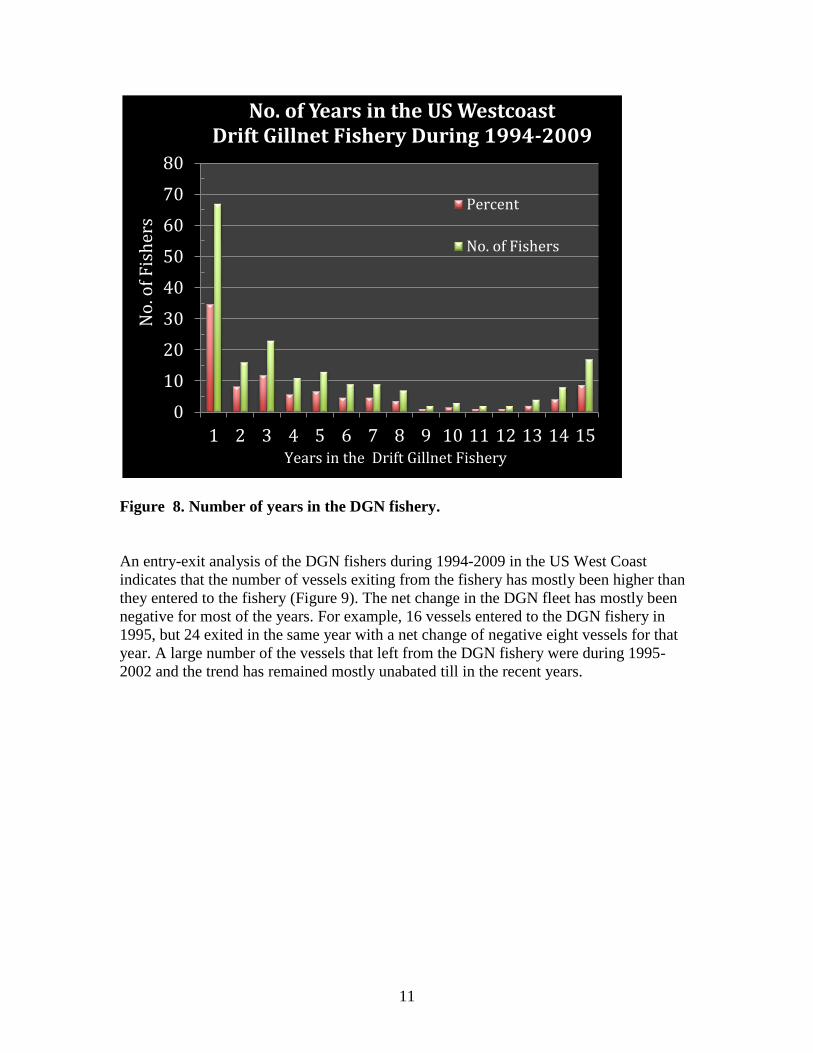
A duration analysis over the last 15 years shows that the number of fishermen fishing in
the DGN fishery has mostly been short lived, i.e., about 35 percent, 8 percent, and 12
percent of the vessels remained in the DGN fishery only for one, two, and three years,
respectively (Figure 8). The number of fishermen fishing for longer years in the DGN
fishery was few. Only nine percent of the fishermen remained in the fishery for about 15
years (during 1994-2009).
Number of Vessels and Quantity of Landings for Swordfish in California
Harpoon Gear, 1981 - 2008
0
20
40
60
80
100
120
140
160
180
200
1981
1982
1983
1984
1985
1986
1987
1988
1989
1990
1991
1992
1993
1994
1995
1996
1997
1998
1999
2000
2001
2002
2003
2004
2005
2006
2007
2008
Unique Vessels
0
50
100
150
200
250
300
350
400
450
500Thousand lbs
VESSEL COUNT LANDED POUNDS
11
Figure 8. Number of years in the DGN fishery.
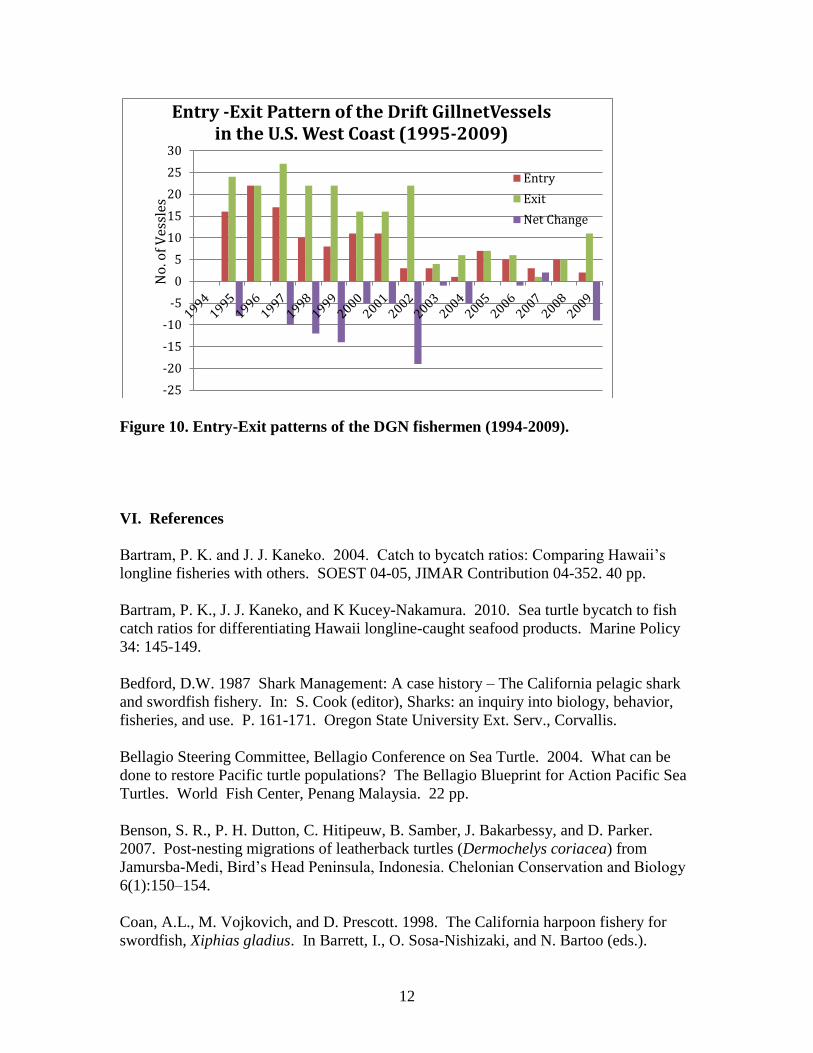
An entry-exit analysis of the DGN fishers during 1994-2009 in the US West Coast
indicates that the number of vessels exiting from the fishery has mostly been higher than
they entered to the fishery (Figure 9). The net change in the DGN fleet has mostly been
negative for most of the years. For example, 16 vessels entered to the DGN fishery in
1995, but 24 exited in the same year with a net change of negative eight vessels for that
year. A large number of the vessels that left from the DGN fishery were during 1995-
2002 and the trend has remained mostly unabated till in the recent years.
0
10
20
30
40
50
60
70
80
1 2 3 4 5 6 7 8 9 10 11 12 13 14 15
No. of Years in the US Westcoast Drift Gillnet Fishery During 1994-2009
Percent
No. of Fishers
Years in the Drift Gillnet Fishery
No
. of
Fis
her
s
12
Figure 10. Entry-Exit patterns of the DGN fishermen (1994-2009).
VI. References
Bartram, P. K. and J. J. Kaneko. 2004. Catch to bycatch ratios: Comparing Hawaii’s
longline fisheries with others. SOEST 04-05, JIMAR Contribution 04-352. 40 pp.
Bartram, P. K., J. J. Kaneko, and K Kucey-Nakamura. 2010. Sea turtle bycatch to fish
catch ratios for differentiating Hawaii longline-caught seafood products. Marine Policy
34: 145-149.
Bedford, D.W. 1987 Shark Management: A case history – The California pelagic shark
and swordfish fishery. In: S. Cook (editor), Sharks: an inquiry into biology, behavior,
fisheries, and use. P. 161-171. Oregon State University Ext. Serv., Corvallis.
Bellagio Steering Committee, Bellagio Conference on Sea Turtle. 2004. What can be
done to restore Pacific turtle populations? The Bellagio Blueprint for Action Pacific Sea
Turtles. World Fish Center, Penang Malaysia. 22 pp.
Benson, S. R., P. H. Dutton, C. Hitipeuw, B. Samber, J. Bakarbessy, and D. Parker.
2007. Post-nesting migrations of leatherback turtles (Dermochelys coriacea) from
Jamursba-Medi, Bird’s Head Peninsula, Indonesia. Chelonian Conservation and Biology
6(1):150–154.
Coan, A.L., M. Vojkovich, and D. Prescott. 1998. The California harpoon fishery for
swordfish, Xiphias gladius. In Barrett, I., O. Sosa-Nishizaki, and N. Bartoo (eds.).
-25
-20
-15
-10
-5
0
5
10
15
20
25
30
Entry -Exit Pattern of the Drift GillnetVessels in the U.S. West Coast (1995-2009)
Entry
Exit
Net Change
No
. of
Ves
sles
13
International Symposium of Pacific swordfish, Ensenada, Mexico, 11-14, December
1994. U. S. Dept. Commerce, NOAA Tech. Rep. NMFS 142. 276 pp.
Davenport, D., J. R. Johnson, and J. Timbrook. 1993. The Chumash and the swordfish.
Antiquity 67: 257-72.
Dutton, P.H. and D. Squires. 2008. Reconciling Biodiversity with Fishing: A Holistic
Strategy for Pacific Sea Turtle Recovery. Ocean Development & International Law
Dutton, P. H., C. Hitipeuw, M. Zein, S. Benson, G. Petro, J. Pita, V. Rei, L. Ambio, and
J. Bakarbessy. 2007. Status and genetic structure of nesting populations of leatherback
turtles (Dermochelys coriacea) in the Western Pacific. Chelonian Conservation Biology
6(1):47-53.
FAO. 2004. Expert consultation on interactions between sea turtles and fisheries within
an ecosystem context. FAO Fisheries Report No. 738. FAO, Rome, 37p.
FAO. 2009. Species Identification and Data Programme: fact sheet, Xiphias gladius
http://www.fao.org/fishery/species/2503/en
Govender A, R. van der Elst, and N. James. 2003 Swordfish: Global lessons. World
Wide Fund for Nature - South Africa, 2003. http://iodeweb1.vliz.be/odin/bitstream/
1834/921/1/Swordfish.pdf.
Gilman, E., E. Zollett, S. Beverly, H.Nakano, K. Davis, D. Shiode, P. Dalzell, and I.
Kinan. 2006. Reducing sea turtle by-catch in pelagic longline fisheries. Fish and
Fisheries 7: 2-23.
Govender A, R. van der Elst, and N. James. 2003 Swordfish: Global lessons. World
Wide Fund for Nature - South Africa, 2003. http://iodeweb1.vliz.be/odin/bitstream/
1834/921/1/Swordfish.pdf.
Hanan, D. A. and A. L. Coan Jr. 1993. The California drift gill net fishery for sharks and
swordfish, 1981–82 through 1990–91. California Dept. Fish and Game, Fish Bull. 175,
95P.
Hinton, M.G. 2003. Status of swordfish stocks in the eastern Pacific Ocean estimated
using data from Japanese tuna longline fisheries. Marine and Freshwater Research
54:393-399.
Hinton, M.G., W.H. Bayliff, and J. Suter. 2005. Assessment of swordfish in the eastern
Pacific Ocean. Inter-Amer. Trop. Tuna Comm. Stock Assess. Rep. 5: 291-326.
Hitipeuw, C., P. H. Dutton, S. Benson, J. Thebu, and J. Bakarbessy. 2007. Population
status and inter-nesting movement of leatherback turtles, Dermochelys coriacea, nesting
14
on the northwest coast of Papua, Indonesia. Chelonian Conservation and Biology
6(1):28-36.
Holts, D. B. 1988. Review of U.S. West Coast commercial shark fisheries. Marine
Fisheries Review 50(1):1-8.
International Scientific Committee for Tuna and Tuna-like Species in the North Pacific
Ocean (ISC). 2010. Report of the Tenth Meeting of the International Scientific
Committee for Tuna and Tuna-like Species in the North Pacific Ocean. Plenary Session,
21-26 July, 2010, Victoria, British Columbia, Canada. 50 pp.
Kaplan, I. C. 2005. A risk assessment for Pacific leatherback turtles (Dermochelys
coriacea). Can. J. Fish. Aquat. Sci. 62: 1710–1719.
Miyake, M.P. N. Miyabe, and H. Nakano. 2004. Historical trends of tuna catches in the
world. FAO Fisheries Technical Paper. No. 467. Rome, FAO. 74p.
NMFS, 2009. Swordfish and leatherback use of temperate habitat (SLUTH). H. Dewar
(editor). SLUTH workshop report, May 28-29, 2008. 35 pp.
PFMC 2003. Fishery management plan and environmental impact statement for U.S.
West Coast fisheries for highly migratory species. Pacific Fishery Management Council,
Portland, Oregon.
PFMC. 2010. Status of the U. S, West Coast Fisheries for Highly Migratory Species
Through 2009: Stock Assessment and Fishery Evaluation. Pacific Fishery Management
Council, Portland, Oregon 188 pp.
Rausser, G., S. Hamilton, M. Kovach, and R. Stifter. 2009. Unintended consequences:
The spillover effects of common property regulations. Marine Policy 33:24-39.
Sakagawa, G.T. 1989. Trends in fisheries for swordfish in the Pacific Ocean. In Stroud,
R.H. (ed.) Planning the Future of billfishes: Research and management in the 90s and
beyond. Proceedings of the Second International Billfish Symposium, Kailua–Kona,
Hawaii, August 1–5 1988. National Coalition for Marine Conservation, Savannah.
Santora, C. 2003. Management of turtle bycatch: Can endangered species be protected
while minimizing socioeconomic impacts? Coastal Management 31: 424-434.
Sarmiento, C. 2006. Transfer function estimation of trade leakages generated by court
rulings in the Hawaii longline fishery. Applied Economics 38: 183-190.
Seminoff, J. A., F. V. Paladino, and A. G. J. Rhodin. 2007. Refocusing on leatherbacks:
Conservation challenges and signs of success. Chelonian Conservation and Biology 6:1-
6.
15
Valdemarsen, J. W. and P. Surronen. 2003. Modifying fishing gear to achieve
ecosystem objectives. IN Sinclair, M. and G. Valdimarsson (eds.). Responsible Fisheries
in the Marine Ecosystem. FAO, Rome, pp 321-341.
Vojkovich, M., and K. Barsky. 1998. The California-based longline fishery for swordfish,
Xiphias gladius, beyond the U.S. Exclusive Economic Zone. U.S. National Marine
Fisheries Service, NOAA Technical Report. NMFS 142:147-152.
Wallace, B. P., R. L. Lewison, S.L. McDonald, R. K. McDonald, C. Y. Kot, S. Kelez, R.
K. Bjorkland, E. M. Finkbeiner, S.Helmbrecht, and L. B. Crowder. 2010. Global
patterns of marine turtle bycatch. Conservation Letter xx:1-12.
Ward, P. and S. Elscot. 2000. Broadbill swordfish: Status of world fisheries. Bureau of
Rural Sciences, Commonwealth Department of Agriculture, Fisheries and Forestry,
Canberra, Australia.
Ward, P., J. M. Porter, and S. Elscot. 2000 Broadbill swordfish: Status of established
fisheries and lessons for developing fisheries. Fish and Fisheries 1: 317-336.
Western Pacific Fishery Management Council (WPFC). 2009. Amendment 18 to the
Fishery Management Plan for Pelagic Fisheries of the Western Pacific Region Including
a Final Supplemental Environmental Impact Statement, Regulatory Impact Review, and
Initial Regulatory Flexibility Act Analysis Management Modifications for the Hawaii-
based Shallow-set Longline Swordfish Fishery that Would Remove Effort Limits,
Eliminate the Set Certificate Program, and Implement New Sea Turtle Interaction Caps.
WCPFC, Honolulu, HI. 333pp.