Embed Size (px)
Citation preview
Understanding Isobars
This slide show helps you learn how to draw the isobars (lines of equal pressure) around high and low centers. It also shows the ways in which winds blow.
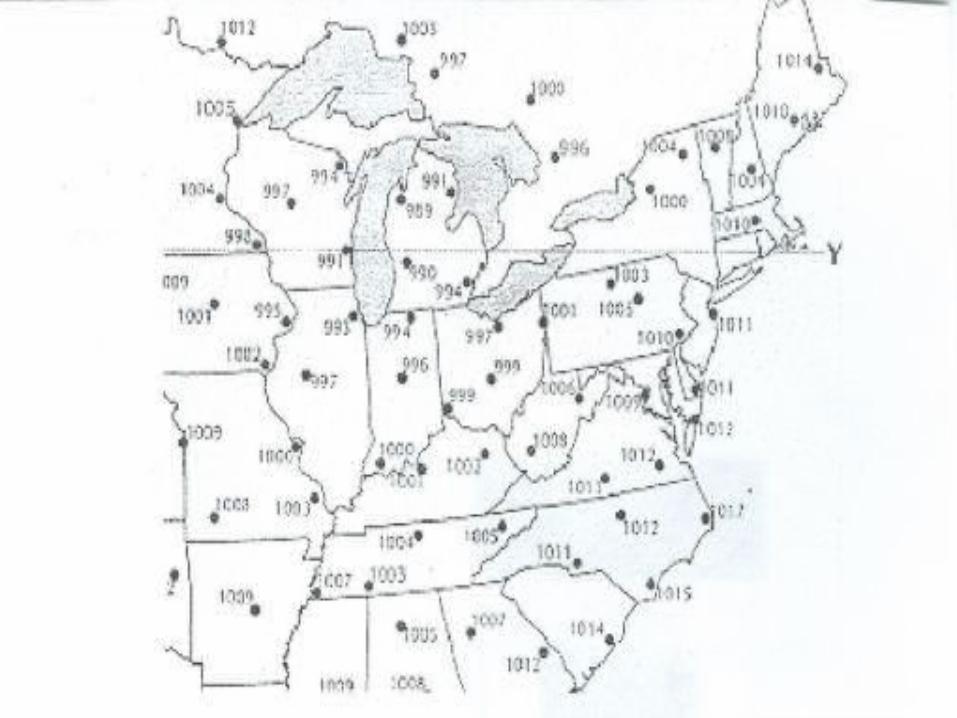
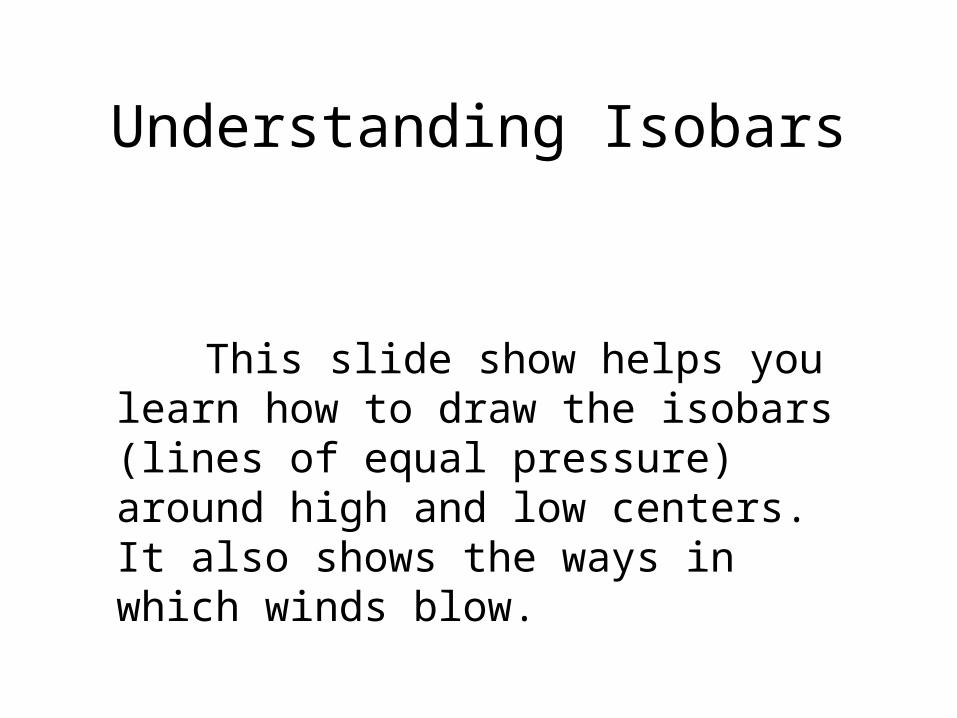
ISOLINE ACTIVITY:
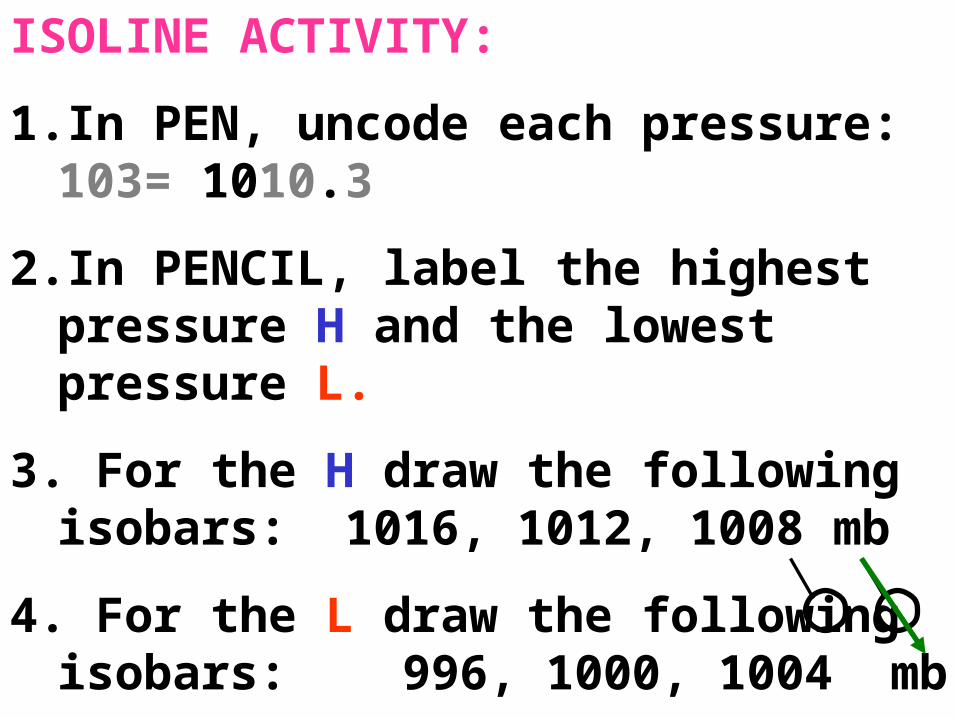
1. In PEN, uncode each pressure: 103= 1010.3
2. In PENCIL, label the highest pressure H and the lowest pressure L.
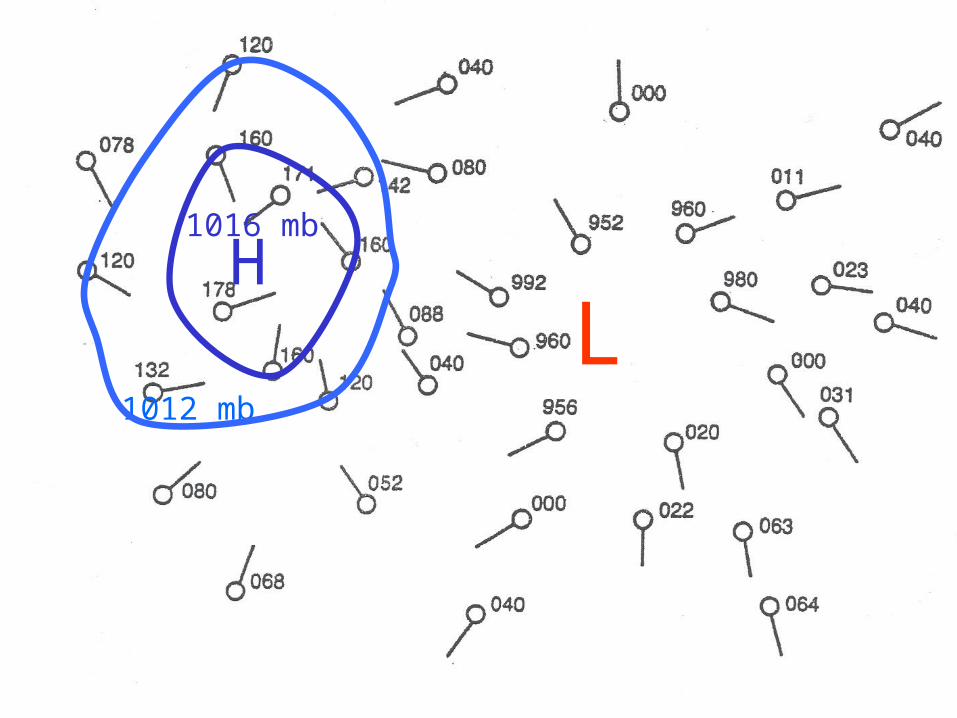
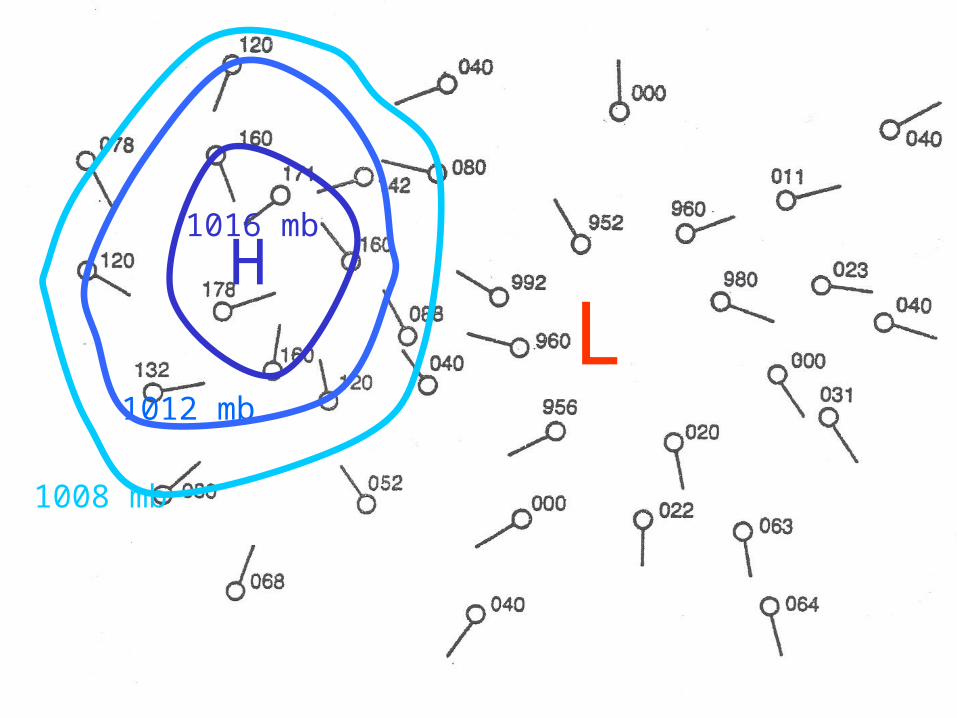
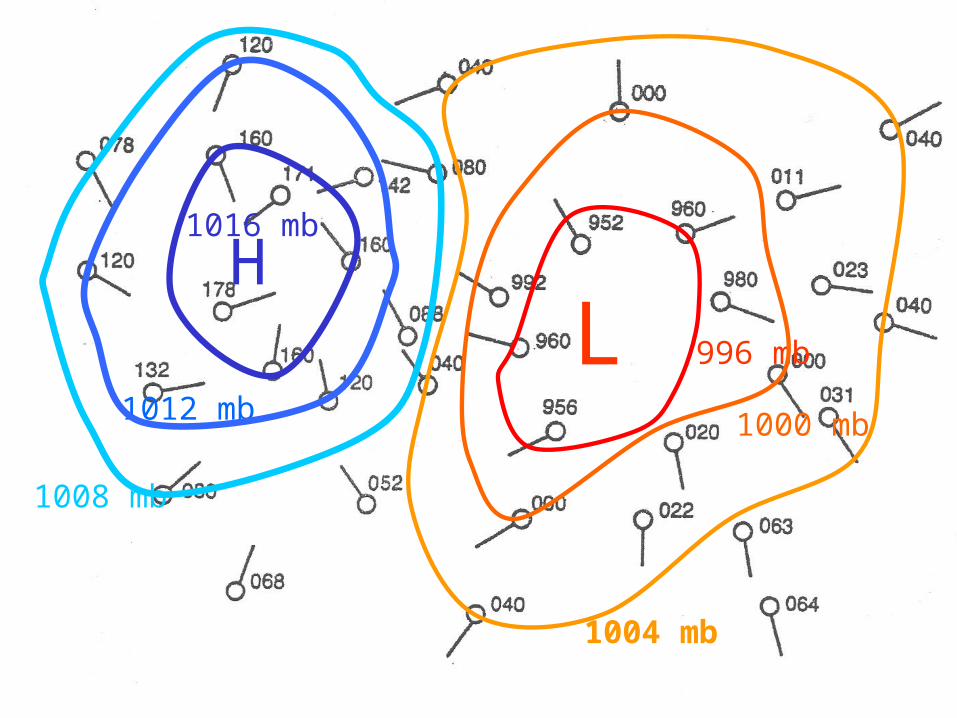
3. For the H draw the following isobars: 1016, 1012, 1008 mb
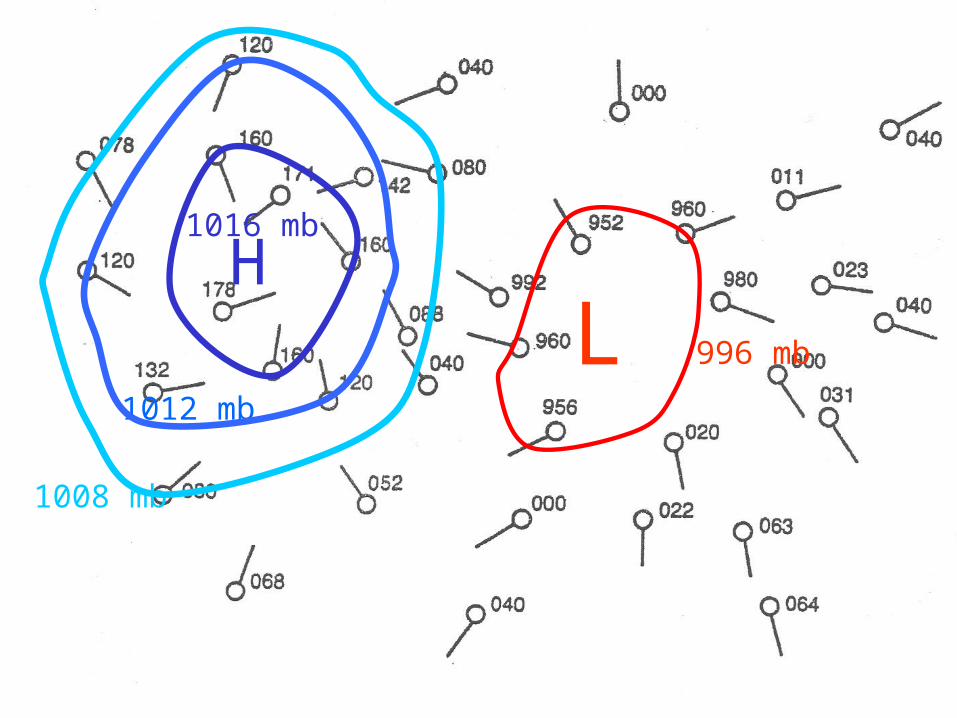
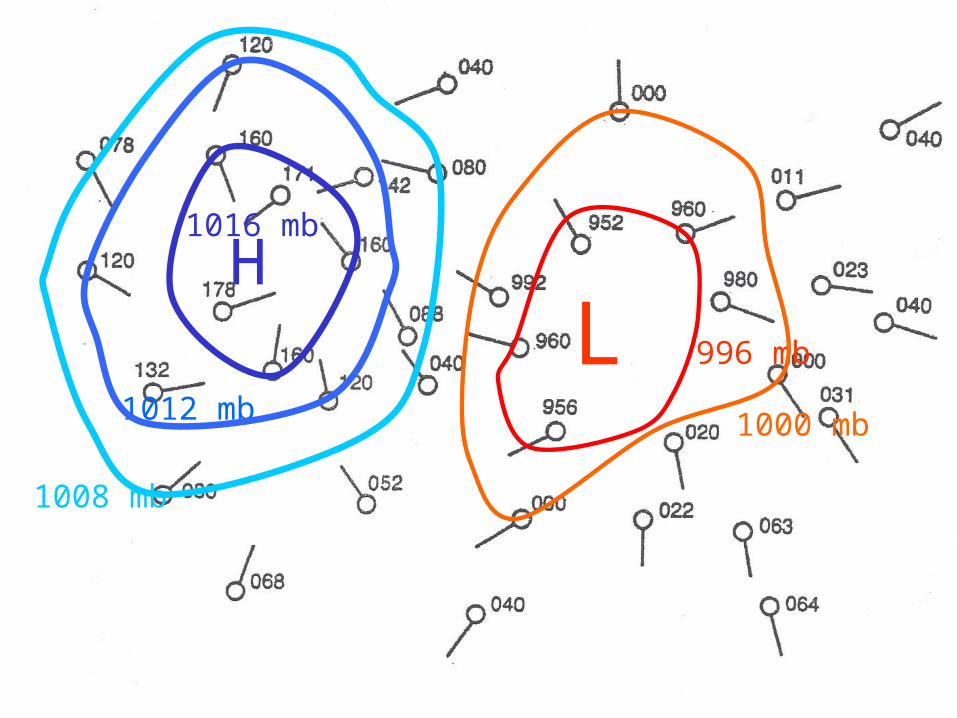
4. For the L draw the following isobars: 996, 1000, 1004 mb
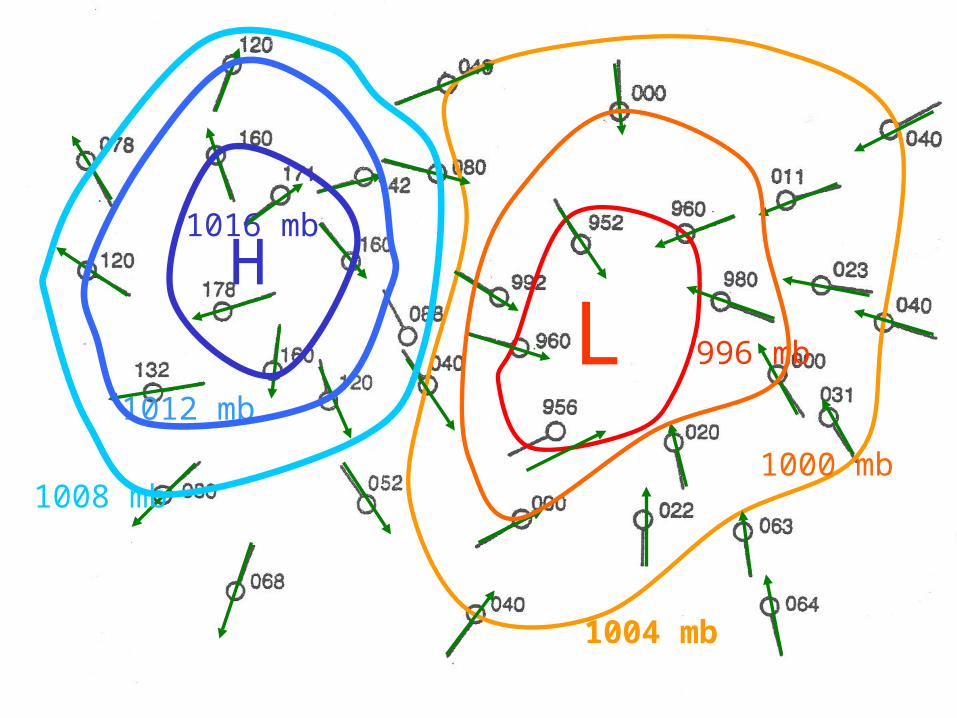
5. For each wind indicator- show wind movement.

HL
1016 mb
HL
1012 mb
1016 mb
HL
1008 mb
1012 mb
1016 mb
HL 996 mb
1008 mb
1012 mb
1016 mb
HL 996 mb
1008 mb
1012 mb
1016 mb
1000 mb
HL
1004 mb
1000 mb
996 mb
1008 mb
1012 mb
1016 mb
HL
1004 mb
1000 mb
996 mb
1008 mb
1012 mb
1016 mb
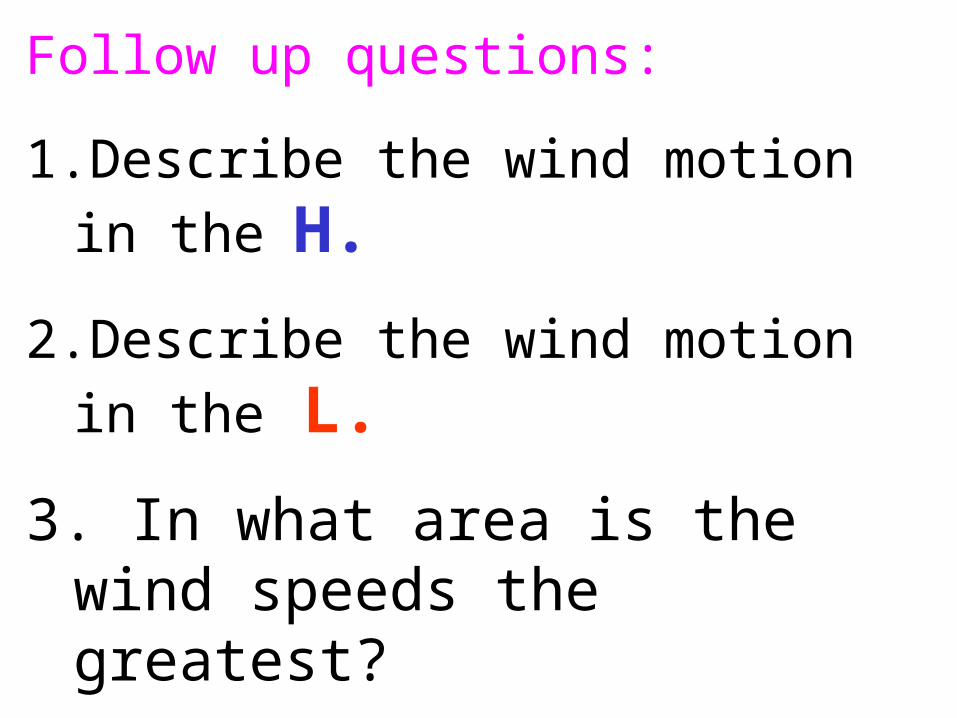
Follow up questions:
1. Describe the wind motion in the H.
2. Describe the wind motion in the L.
3. In what area is the wind speeds the greatest?
4.Winds go from ___ to ____ for pressure.
Summary
• Winds around a High blow in a clockwise direction away from the center. (“The clock is high.”) Highs usually have fair weather.
• Winds around a Low blow in a counter-clockwise and inward. (“The counter is low.”) Low pressure systems often have stormy or unsettled weather.
Go to the following website and follow the directions on how to draw isobars on the map. Draw the lines, as drawn on the website, on a copy of the map that you will need to paste into a PowerPoint presentation of your own.
http://www.uwsp.edu/geo/faculty/ritter/geog101/textbook/manuals/instructor_manual/how_to/drawing_isobars.html
Do the following on your PowerPoint presentation.
1. Slide one should have a title with your name.
2. Slide two needs to have the answers to the four questions that were on my slide 11.
3. For slide 3, copy the map from my slide 14 and paste it in your PowerPoint as slide 3.
4. Follow the directions from the website above and continue drawing all of the isobars on the entire map with the tools at the bottom of the screen (You should end up with 3 isobars).