Embed Size (px)
Citation preview
Understanding Innovation - Values Fitfrom the Consumer Perspective:A New Mixed-Model Approach
Michael S. Mulvey and Charles E. Gengler
Abstract
Innovations that are perceived to be the means to
realizing important personal values have a greater
likelihood of success than those that clash with or
impede value fulfillment. The concept of innovation-
values fit (or value compatibility) explains broad
patterns of consumer adoption across diverse product
categories. However, the simple “poor-neutral-good”
scales typically used to measure innovation-values fit
are incapable of providing the kinds of fine-grained
insights considered necessary to support decisions for
marketing a particular new product. This research
contributes an analytic framework based on the
Means-End approach to understand innovation-values
fit from the consumer perspective with the goal of
informing new product commercialization strategy.
The article revisits old practices and initiates new work
that probes more deeply, directly, and specifically into
how consumers evaluate new products and perceive
links between distinctive product features and
personal values. Using data from160 personal
“laddering” interviews in a national field study, we
examine consumer reaction to a next-generation cell
phone and discover seven innovation-values themes
that drive consumer preference and price
expectations in the product category. Implications are
discussed for marketers who commercialize
innovations and need to understand the incremental
benefits that consumers associate with adopting a
new product over its rivals.
Key words: Consumer adoption, New product
marketing, Innovation management, Consumer
decision making, Personal values, Means-end model
Understanding Innovation - Values Fit from theConsumer Perspective: A New Mixed-Model Approach
Understanding Innovation - Values Fit from theConsumer Perspective: A New Mixed-Model Approach
It's new, but will people want it? Many innovations
have failed not because of technical deficiencies, but
due to incompatibility or a lack of fit with personal
goals and values . The idea of achieving congruence
between an innovation and the values of the target
users is among the most important and widely
reported generalizations in the extensive innovation-
adoption literature . Accordingly, innovation managers
are advised to research how targeted users perceive a
given innovation and the extent to which it clashes or
coincides with their personal values .
In the early years of innovation adoption research,
researchers rarely measured the perceptions of the
potential adopter, opting instead to infer the level of
value compatibility . The persistent lack of direct
measurement in the literature led to advocate a
survey measure of innovation-values fit, defined as
“the extent to which targeted users perceive that use
of the innovation will foster (or, conversely, inhibit) the
fulfillment of their values.” While the popular “low-
medium-high” innovation-values fit scale proved
useful in predicting success in adoption processes,
alone this measure does not provide guidance on how
to improve and to make smart choices in the
commercialization process. We posit that the measure
lacks fidelity with how consumers actually evaluate
innovations and is too granular to discern the specific
values that foster an innovation's desirability to the
individual.
The primary aim of this paper is to propose a new
analytic framework for discovering and evaluating
user perceptions of innovation-values fit. Our
approach is based on two key assumptions. First, the
concept of innovation-values fit is more variegated
and complex than normally assumed. Impression
formation may involve multiple perceptual
dimensions that are used as choice criteria in
consumer adoption decisions. Second, the best way to
discover innovation-values fit is directly from users, in
their own words. We favor generative research that
encourages consumers to express the motivationally
significant values used in their evaluations over using
traditional values scales that may not correspond with
consumers' perceptions. Simply put, our method
solicits qualitative data that provides a more nuanced
and precise accounting of the specific personal values
implicated when individuals evaluate innovations.
Building on established means-end models for
studying consumer decision making we develop an
analytical framework to map and measure the means-
end chains of logic that describe consumer
perceptions of an innovation's relevance to personal
values. Our approach combines established qualitative
methods for developing insights into consumer
perceptions with quantitative evaluations of products
to gain deeper insights on both what is important and
measure of the degree of importance.
Existing perceptual and preference mapping
techniques help managers see how their own product
compares to rivals through the eyes of their
customers. With a plethora of sophisticated data
analysis tools at their disposal, researchers can
produce concise visual representations of the
competitive landscape with great psychometric
precision. Notwithstanding methodological
developments in modeling brand/product attribute
performance or importance, these maps do not tell us
much about why consumers form certain perceptions
or preferences.
In contrast, the laddering interview technique probes
more deeply, directly, and specifically into how brand /
ISSN: 0971-1023 | NMIMS Management ReviewDouble Issue: Volume XXIII October-November 2013 University Day Special Issue January 2014
ISSN: 0971-1023 | NMIMS Management ReviewDouble Issue: Volume XXIII October-November 2013 University Day Special Issue January 2014
18 19
product aligns with higher-level customer needs,
goals, and values. It asks and seeks to answer the
question “What matters, or what might matter, to
potential customers?” by eliciting consumers' reasons
for choosing a product over its competitors. Laddering
study results discover the dimensions that matter
most to consumers and are therefore widely used by
managers to identify positioning options, develop
commercialization strategy, and design marketing
communications.
Despite substantial research, the two approaches for
studying consumer perceptions have rarely, if ever,
been combined in one study. Given the
complementary perspectives offered by perceptual
mapping and laddering techniques, there exists a
missed opportunity to merge these two approaches to
create a more accurate and comprehensive view of
how consumers evaluate innovations. We contend
that consumers construe the reasons why an offering
has value (form their own qualitative means-end
chains of logic) and use these dimensions to evaluate
the performance of an offering relative to the available
alternatives (assign ratings that reflect relative
performance on the dimensions). Our approach is
unique as it gathers the qualitative dimensions and
quantitative ratings in a single study as opposed to the
arduous multi-study data collection process that is
typically used. Consequently, we can perform multi-
dimensional scaling analysis by comparing offerings
(brand, model, etc.) using objective attributes and
perceived dimensions of value.
Our objective is combine existing methods in an
original way to generate novel insights into the role of
consumer perceptions of innovation-values fit in the
adoption process. Our analytical framework enriches
our knowledge of consumer adoption perceptions and
produces more exact, actionable, and timely insights
than offered by either of the established methods
alone. The benefits offered by our approach are
greatly appreciated in volatile markets with
increasingly short life cycles, and where the
introduction of an innovative feature could be a game-
changer.
The remainder of the article is organized as follows:
First, we review the theoretical underpinnings and
measurement issues surrounding consumers'
evaluations of innovations and discuss the suitability
of the means-end approach and laddering technique
to measure consumer perceptions of innovation-
values fit. Second, we outline our procedure for
studying the linkages between consumer preferences,
price expectations and product evaluations, and
present the results of an application of our approach to
a large-scale field study of consumer reaction to a
next-generation product (a cellular phone handset).
Finally, we discuss the implications for managers
aiming to develop timely and effective strategies for
marketing innovations and managing other products,
brands and models in the company's portfolio.
New Product Evaluation and Innovation-
Values Fit
The findings of a meta-analysis reviewing 35 years of
academic research confirms the influence of “relative
advantage” and “compatibility” on consumer
innovation adoption (Arts et al., 2011). Relative
advantage refers to customers’ perceptions of the
comparative performance of the innovation versus
established products in the market (Rogers, 1995).
Compatibility “reflects the degree to which the
innovation matches the potential adopter’s needs and
values” and is “therefore an important aspect of the
innovation’s desirability to the individual.”(Arts et al.,
2011, p. 136). Following Klein and Sorra (1996, p.
1064), our research focuses on the perceptual piece of
compatibility known as “innovation-values fit” defined
as “the extent to which targeted users perceive that
use of the innovation will foster (or, conversely, inhibit)
the fulfillment of their values.” Next, we review three
approaches for studying consumer perceptions of
innovation-values fit: (a) innovation-values fit scales,
(b) product feature and performance, and (c) the
proposed means-end approach.
Innovation-Values Fit Scales
In general, the literature uses parsimonious scales to
measure the extent of innovation-values fit. The
concept of innovation-values fit, however, is more
variegated and complex than normally assumed (e.g.,
Bunker, Kautz, & Nguyen, 2007; Harrington & Ruppel,
1999; Klein & Sorra, 1996). Though simple “poor-
neutral-good” innovation-values fit measures are
useful for certain research purposes, we believe that a
more nuanced and precise accounting of the specific
personal values implicated in consumer evaluations of
innovations could greatly enrich our understanding of
consumer adoption decisions. As evidenced by
seminal research by Rokeach (1973), Schwartz and
Bilsky (1987) and Kahle, Beatty, and Homer (1986),
people have multiple values that motivate their
behavior. The identification of specific personal values
that are salient or in conflict is crucial to the task of
developing communications that resonate with
consumers’ belief systems and priorities (Olson &
Reynolds, 1983). Particular attention should be made
to investigate consumer perceptions of the link
between means (product features and performance)
and ends (satisfaction of needs and important
personal values).
Product Features and Performance
The management of technology field is inter-
disciplinary, and it should come as little surprise that
engineering-, manufacturing- and product-managers
concentrate on what they know and what they can
control – product design and production (Levitt, 1960).
Many firms seem guided by the view that a superior
product will sell itself: “if you build it they will come.”
Indeed, gaining market acceptance often depends on
the comparative performance of an innovation
relative to the established products in the market, and
as a result, a good deal of research has focused on
measuring the impact of new product attributes and
features on purchase intentions.
An innovation may well offer new or higher levels of
performance due to distinctive features, but a
competitive advantage can only be realized if buyers
perceive an improvement over alternative products.
Tests of consumer acceptance of new products
typically present controlled sets of products or
prototypes to respondents and analyze their
preference patterns to discern their implicit valuations
(utilities or part-worths) for specific product features
and combinations thereof (Carroll, Green, & Kim,
1989). Some studies simplify the competitive
landscape by assuming that consumers will only
consider products along one or two key performance
dimensions (Christensen, 1997; D’Aveni, 2007). For
example, size and capacity are considered to be the
dominant choice criteria for disk drives, or processor
speed drives high-end laptop choice. The buyer simply
specs the product and buys on price. More elaborate
studies investigate the tradeoffs consumers make to
discover the optimal set of product attributes. Multi-
attribute models provide an accepted and efficient
method to estimate consumers’ utility for an
innovation. They take into account the relative
Understanding Innovation - Values Fit from theConsumer Perspective: A New Mixed-Model Approach
Understanding Innovation - Values Fit from theConsumer Perspective: A New Mixed-Model Approach
ISSN: 0971-1023 | NMIMS Management ReviewDouble Issue: Volume XXIII October-November 2013 University Day Special Issue January 2014
ISSN: 0971-1023 | NMIMS Management ReviewDouble Issue: Volume XXIII October-November 2013 University Day Special Issue January 2014
20 21
advantages among products and make it possible to
explore the extent to which these attributes can
account for differences in adoption.
Managers responsible for launch strategy decisions
should be mindful of certain limitations that restrict
the actionability of attribute- and feature-based
studies. Though product-centered studies can
establish what features offer a relative advantage,
they rarely provide insight into the user-centered
motivational questions of why consumers perceive an
advantage and how the selection satisfies their needs.
Marketers who commercialize innovations also need
information suited to influence purchase decisions
(Slater & Narver, 1998).
The Means-End Approach
Customers are the ultimate arbiters of new product
acceptance and success. Customers’ initial exposure to
an innovation is followed by knowledge acquisition of
its meaning and use (Griffith, 1999; Rogers, 1995),
triggering sense-making (Weick, 1995), visualization of
product use (Dahl & Hoeffler, 2004), and the
development of mental models of how the product
works (Hill & Levenhagen, 1995). In turn, these
perceptual processes can induce feelings of personal
relevance and influence evaluations of the
innovation’s potential to satisfy goals and values.
Means-end theory provides an antidote to the
prevailing limited focus on product attributes and
features. It builds upon work by psychologists
(Cartwright, 1949; Tolman, 1932) and economists
(Newell & Simon, 1972) who assert that people do not
buy a product for the product’s sake, but for what the
product can do for them. The underlying idea of the
means-end approach is that “decision makers choose
courses of action (including behaviors such as
purchase of particular brands) that seem most likely to
achieve important outcomes” (Reynolds & Olson,
2001, p. 3). Objects have value only because they
produce desirable consequences or enable one to
avoid negative consequences. Means-end theory asks
and answers the question: “What matters, or what
might matter, to potential customers?” by mapping
the personally-relevant “reasons why” consumers
prefer a product to competitors’ products. Managers
then can use these insights to develop strategies to
influence consumer decision processes.
In marketing, research into how customers think about
value has often followed a means-end approach
(Gutman, 1982; Reynolds & Gutman, 1988; Zeithaml,
1988). The means-end approach for studying
consumer decision making assumes that there will
likely be a number of different reasons for engaging in
a given behavior, and that consumers can verbalize the
reasons for their actions (Parry, 2002; Reynolds &
Olson, 2001). Unlike models that presume that value
resides in product attributes, the means-end approach
“takes no a priori position as to what the key sources of
value are for any object or decision”(Reynolds,
Dethloff, & Westberg, 2001, p. 392). Rather, the
identification of key sources of value is an empirical
question.
Means-end logic permeates human discourse as
“people use language to express their judgments and
provide bases for their judgments” (Bagozzi &
Dabholkar, 2000, p. 538). Representations of
consumers’ thoughts and feelings become the object
of study for researchers who endeavor to map the
means-end chains of logic that describe how products
gain relevance to consumers. Laddering, the in-depth,
one-on-one interviewing technique used in means-
end chain research provides a more complete picture
of the motivational reasons for consumer behavior
and is prized for its focus and fidelity to the consumer
view (Reynolds et al., 2001; Reynolds & Gutman,
1988). Proponents of the means-end approach state:
“it represents a more personalized, emotional, more
personal, more idiosyncratic vision of how consumers
think and make decisions about which products to buy
to satisfy their needs” (Howard & Warren, 2001, p. xii).
Over the years, researchers have presented various
means-end models to better understand consumer
decision-making (see Figure 1). One of the earliest
versions, the Grey Benefit Chain (Young & Feigin,
1975), emphasized the important role of intangible
benefits and anticipated “emotional payoffs” in
consumer choice. Later research introduced and
a d va n c e d t h e w i d e l y - a d o p te d Att r i b u te -
Consequence-Value (ACV) model, which appears in
three- four- or six-level versions (Gutman, 1982; Olson
& Reynolds, 1983). Means-end chains map the “why of
personal relevance” by linking means to ends, where
means represent aspects of product knowledge and
the ends represent aspects of consumer self-
knowledge (Mulvey, Olson, Celsi, & Walker, 1994;
Reynolds & Olson, 2001; Walker & Olson, 1991).
Others have suggested that the ACV model, though
well-suited for product choice, is less-suited for more
abstract choices such as services, ideas or behaviors.
Accordingly, consumers’ reasons for action are
sometimes modeled as “hierarchical goal structures”
(Bagozzi & Dholakia, 1999; Gutman, 1997; Ligas, 2000;
Pieters, Baumgartner, & Allen, 1995) using different
terms to identify the levels of the means-end chain
(e.g., Gengler, Howard, & Zolner, 1995; Overby,
Gardial, & Woodruff, 2004). The “consumer goal
structure” model (Ratneshwar, Mick, & Huffman,
2000) and “levels of consumer thinking” model
(Zaltman & Zaltman, 2008) provide more macro- and
context-sensitive representations of the interplay
between consumers’ lifestyle choices and product
choices.
Understanding Innovation - Values Fit from theConsumer Perspective: A New Mixed-Model Approach
Understanding Innovation - Values Fit from theConsumer Perspective: A New Mixed-Model Approach
ISSN: 0971-1023 | NMIMS Management ReviewDouble Issue: Volume XXIII October-November 2013 University Day Special Issue January 2014
ISSN: 0971-1023 | NMIMS Management ReviewDouble Issue: Volume XXIII October-November 2013 University Day Special Issue January 2014
22 23
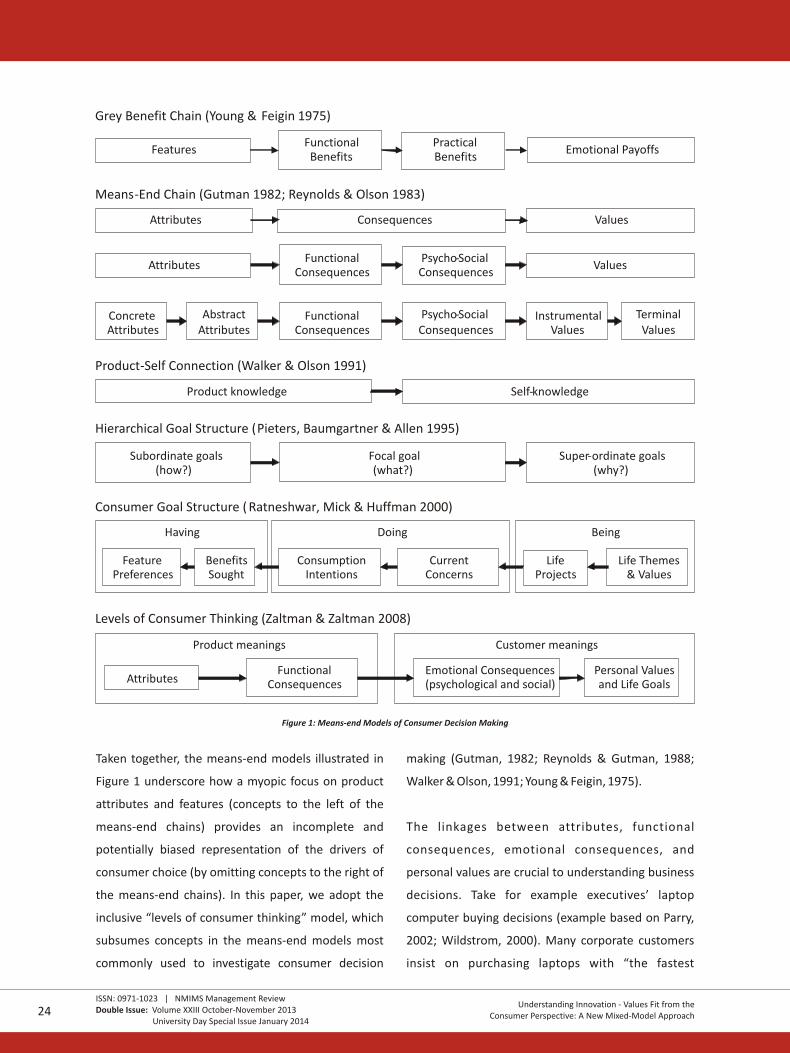
Figure 1: Means-end Models of Consumer Decision Making
Understanding Innovation - Values Fit from theConsumer Perspective: A New Mixed-Model Approach
Understanding Innovation - Values Fit from theConsumer Perspective: A New Mixed-Model Approach
Taken together, the means-end models illustrated in
Figure 1 underscore how a myopic focus on product
attributes and features (concepts to the left of the
means-end chains) provides an incomplete and
potentially biased representation of the drivers of
consumer choice (by omitting concepts to the right of
the means-end chains). In this paper, we adopt the
inclusive “levels of consumer thinking” model, which
subsumes concepts in the means-end models most
commonly used to investigate consumer decision
making (Gutman, 1982; Reynolds & Gutman, 1988;
Walker & Olson, 1991; Young & Feigin, 1975).
The linkages between attributes, functional
consequences, emotional consequences, and
personal values are crucial to understanding business
decisions. Take for example executives’ laptop
computer buying decisions (example based on Parry,
2002; Wildstrom, 2000). Many corporate customers
insist on purchasing laptops with “the fastest
processor Intel makes” (product attribute) to “be more
productive” (functional consequence). A computer
with these performance characteristics would hold a
relative advantage over competitors. However, these
product-centered meanings are pretty vacant without
the motivationally-significant customer meanings that
truly drive that preference. Upon further inquiry,
executives reveal that ownership of the newest fastest
laptop sends a public message about the importance
of that executive (social consequence) and makes
them feel confident and capable (psychological
consequences), earning status and the respect of
others while upholding approval and equality with
peers (personal values and life goals). The means-end
chain of associated concepts constitutes executives’
judgments of innovation-values fit. Executives’
disposition to acquire the latest laptop models is
explained by the bridge between product meanings
and customer meanings.
New product evaluation links product performance
considerations with personally-relevant motivational
concerns. Thus, to advance theory on technology
adoption, it is vital to understand the perceptual links
consumers form in evaluating new products. The
purpose of this research is to provide a more rigorous
and actionable approach to studying innovation-
values fit and adoption decisions.
Evaluating Consumer Reaction to an
Innovation
This research establishes the means-end approach as a
complement to the existing body of knowledge on
innovation-values fit. The main contribution of this
paper is a template of how managers can use the
means-end model to understand consumers’ adoption
decisions. The framework (Table 1) presents a 5-step
process which can be reused and applied to similar
situations where managers encounter the common
problem of having to evaluate consumer reaction to
new products to develop launch strategy. We
demonstrate the approach with the results of a study
that investigated consumer reaction to a next-
generation model of cell phone to gain broad insight
into market acceptance of the innovation.
ISSN: 0971-1023 | NMIMS Management ReviewDouble Issue: Volume XXIII October-November 2013 University Day Special Issue January 2014
ISSN: 0971-1023 | NMIMS Management ReviewDouble Issue: Volume XXIII October-November 2013 University Day Special Issue January 2014
24 25
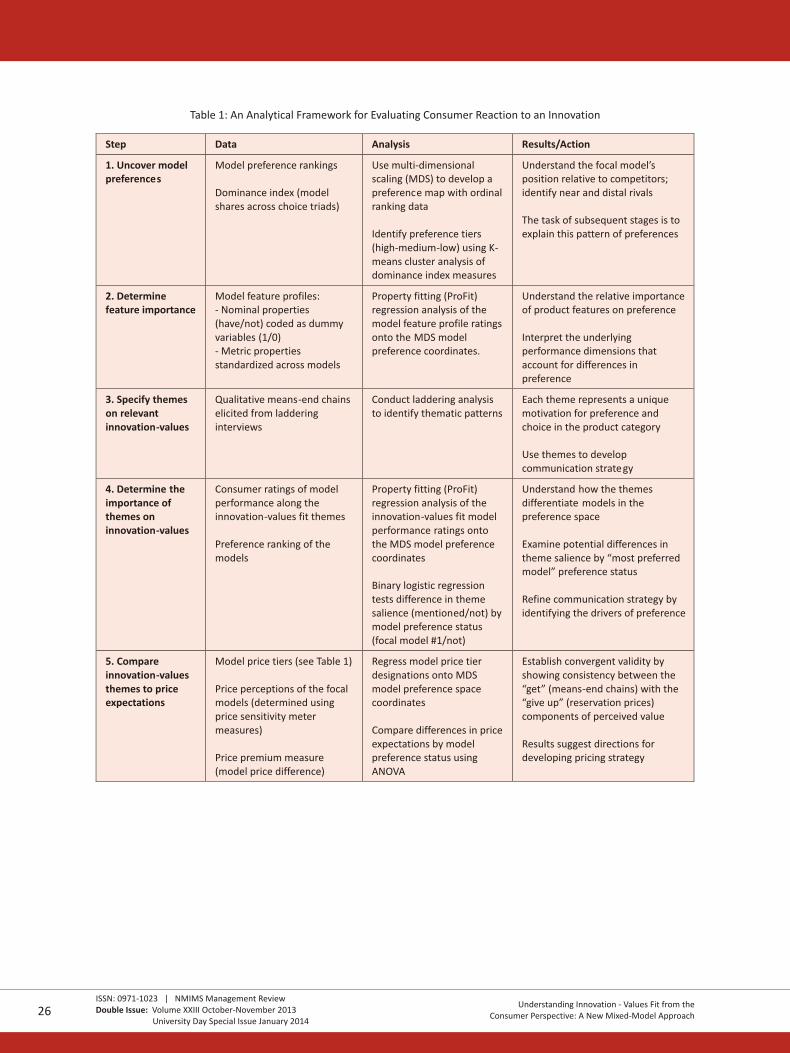
Table 1: An Analytical Framework for Evaluating Consumer Reaction to an Innovation The Study
In 1997, we conducted a large-scale field study to
develop positioning strategy for cell phones in the
consumer market. The data set is based on 160
laddering interviews with a randomly-selected sample
of consumers. Typically, 20 to 30 laddering interviews
are sufficient to reveal the full range of potentially
important consumer perceptions. By comparison, the
present study sample is exceptionally large to allow
sub-group comparisons and to reduce the risk of
missing anything important – the stakes of this new
product launch were exceptionally high. Though the
data is dated, it is ideal for our objective of
demonstrating the means-end model of innovation-
values fit to explain consumers’ adoption decisions
regarding a next-generation product. However, we
make no claim to the generalizability of past drivers of
choice in the fast-moving telecommunication category
to the present.
Participants
We conducted 160 one-on-one interviews with
current and potential cellular telephone users.
Participants were contacted using a random-digit
dialing CATI system and were selected according to
pre-specified quotas for behavioral and demographic
characteristics. Sampling criteria ensured balanced
representation of the following subgroups of the
population: gender, usage status (owners and
intenders), occupational status (ultra-professionals,
blue-collar workers, homemakers, and college
students), and geographic location (Chicago, Los
Angeles, Miami, Philadelphia, Seattle and Washington
DC).
Product Category: Cell Phone Handsets
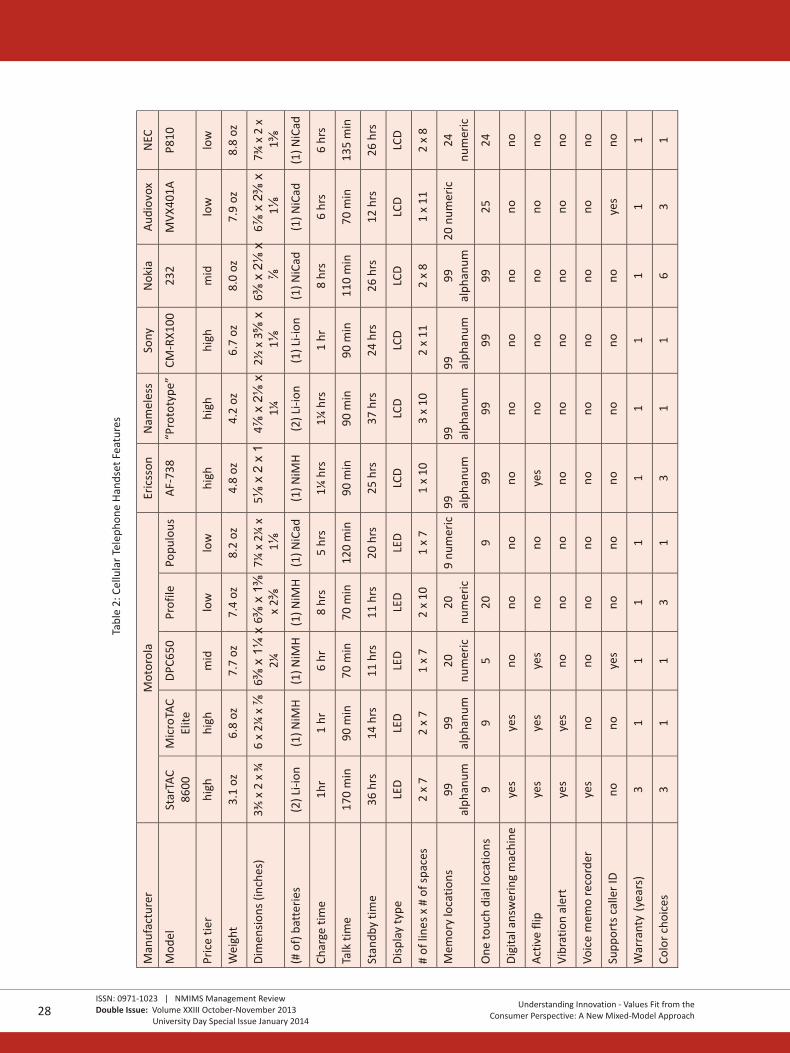
The set of eleven cellular telephone handset models
used in the study spanned the entire spectrum of price
and functionality, from entry-level to high-end. Table 2
lists the key handset features. This study focused on
consumer reactions to the Motorola StarTAC – a new
model that offered an innovative “clamshell” design
and unmatched levels of functionality. The StarTAC
displaced the MicroTAC as the high-end anchor of
Motorola’s handset portfolio. The set of handsets
included five models from Motorola’s product line and
six competitors’ models. Months later, a Consumer
Reports test (1997) would confirm the popularity of
eight of the handset models.
Understanding Innovation - Values Fit from theConsumer Perspective: A New Mixed-Model Approach
Understanding Innovation - Values Fit from theConsumer Perspective: A New Mixed-Model Approach
ISSN: 0971-1023 | NMIMS Management ReviewDouble Issue: Volume XXIII October-November 2013 University Day Special Issue January 2014
ISSN: 0971-1023 | NMIMS Management ReviewDouble Issue: Volume XXIII October-November 2013 University Day Special Issue January 2014
26 27
Table 1: An Analytical Framework for Evaluating Consumer Reaction to an Innovation The Study
In 1997, we conducted a large-scale field study to
develop positioning strategy for cell phones in the
consumer market. The data set is based on 160
laddering interviews with a randomly-selected sample
of consumers. Typically, 20 to 30 laddering interviews
are sufficient to reveal the full range of potentially
important consumer perceptions. By comparison, the
present study sample is exceptionally large to allow
sub-group comparisons and to reduce the risk of
missing anything important – the stakes of this new
product launch were exceptionally high. Though the
data is dated, it is ideal for our objective of
demonstrating the means-end model of innovation-
values fit to explain consumers’ adoption decisions
regarding a next-generation product. However, we
make no claim to the generalizability of past drivers of
choice in the fast-moving telecommunication category
to the present.
Participants
We conducted 160 one-on-one interviews with
current and potential cellular telephone users.
Participants were contacted using a random-digit
dialing CATI system and were selected according to
pre-specified quotas for behavioral and demographic
characteristics. Sampling criteria ensured balanced
representation of the following subgroups of the
population: gender, usage status (owners and
intenders), occupational status (ultra-professionals,
blue-collar workers, homemakers, and college
students), and geographic location (Chicago, Los
Angeles, Miami, Philadelphia, Seattle and Washington
DC).
Product Category: Cell Phone Handsets
The set of eleven cellular telephone handset models
used in the study spanned the entire spectrum of price
and functionality, from entry-level to high-end. Table 2
lists the key handset features. This study focused on
consumer reactions to the Motorola StarTAC – a new
model that offered an innovative “clamshell” design
and unmatched levels of functionality. The StarTAC
displaced the MicroTAC as the high-end anchor of
Motorola’s handset portfolio. The set of handsets
included five models from Motorola’s product line and
six competitors’ models. Months later, a Consumer
Reports test (1997) would confirm the popularity of
eight of the handset models.
Understanding Innovation - Values Fit from theConsumer Perspective: A New Mixed-Model Approach
Understanding Innovation - Values Fit from theConsumer Perspective: A New Mixed-Model Approach
ISSN: 0971-1023 | NMIMS Management ReviewDouble Issue: Volume XXIII October-November 2013 University Day Special Issue January 2014
ISSN: 0971-1023 | NMIMS Management ReviewDouble Issue: Volume XXIII October-November 2013 University Day Special Issue January 2014
26 27
Tab
le 2
: Cel
lula
r Te
lep
ho
ne
Han
dse
t Fe
atu
res
Data collection procedure
A professional agency assisted with the field research
by booking facilities and providing recruitment and
screening services. Participants were paid an incentive
of up to $100 to help increase participation rates and
reduce non-response bias. Interviews lasted
approximately fifty minutes and were conducted by
one of six members of a research team that included
the authors. Field notes were taken during and after
the interviews, which were audio recorded.
To begin, participants examined eleven cellular
telephone handset models with product feature cards.
They were instructed to focus their interest on the
phone that would best serve their needs and were told
to assume that they were buying the phone separately
from air time and connection charges for service and
that the phone would be paid by someone else. Next,
they ranked the models according to their preferences.
After that, focused “laddering” interviews were
conducted to elicit the means-end relations that
constituted the individual's preferences. Using the
triadic sort technique , participants were presented
with a set of 3 handsets (determined prior to the
interview using a random-number generator) and
asked to choose their most preferred model. The
interviewer then used the laddering technique to elicit
the reasons for their preference. Once the participant
had elaborated the basis of his/her choice sufficiently
(articulated a coherent means-end chain), the
interviewer summarized what was said and asked the
person if the summary was correct. Once the accuracy
of the means-end chain was confirmed, the participant
rated each handset on a seven-point scale (1=does not
satisfy the basis at all, 7=satisfies the basis extremely
well). Ratings were obtained for each distinct means-
end chain. To elicit additional means-end chains, the
interviewer repeated the process with two more
randomly-selected handset triads.
The final phase of the interview focused on consumers'
price perceptions. In contrast to the previous phase
where participants were told that the phone would be
paid for by someone else, participants were now asked
to assume that they were buying and paying for a
phone for themselves. Van Westendorp's Price
Sensitivity Meter (PSM) technique was adapted to
measure each individual's range of acceptable prices
for the MicroTAC and StarTAC handsets. For each
model, participants were presented with a price scale
in $10 increments ranging from $10 to $1200 and were
asked to identify the following price points: (a) “The
phone is so expensive I would not buy it,” (b) “The
phone begins to be expensive,” (c) “The phone begins
to be cheap,” and (d) “The price is so cheap that you
question the quality of the phone and would not buy
it.”
Analysis and Results
The overall aim of the study was to evaluate consumer
reaction to a new product to inform the development
of launch strategy and influence market acceptance.
Primary and secondary data were collected and
qualitative and quantitative analysis techniques used
to provide a level of precision and depth of perspective
that cannot be achieved by either of the approaches
alone. Differences in consumer preference,
brand/model performance, and price perceptions are
investigated systematically using appropriate
statistical methods including MDS, cluster analysis,
and regression techniques. For clarity, our research
findings are presented in 5 steps; each step focuses on
achieving a specific research goal using specific data
collection and analysis techniques: 1) uncover model
preferences, 2) determine feature importance, 3)
Understanding Innovation - Values Fit from theConsumer Perspective: A New Mixed-Model Approach
Understanding Innovation - Values Fit from theConsumer Perspective: A New Mixed-Model Approach
ISSN: 0971-1023 | NMIMS Management ReviewDouble Issue: Volume XXIII October-November 2013 University Day Special Issue January 2014
ISSN: 0971-1023 | NMIMS Management ReviewDouble Issue: Volume XXIII October-November 2013 University Day Special Issue January 2014
28 29
specify relevant innovation-values themes, 4)
determine innovation-values importance, and 5)
compare innovation-values themes to price
expectations.
Step 1: Uncover Model Preferences
The starting point for our research is the focal behavior
we aim to influence: consumer model preference. A
multi-dimensional scaling approach is used to provide
a vivid visual representation of the structure of market
preference. Preference maps are a popular way to
portray relationships between brands/models and
clarify the underlying patterns of consumer tastes. The
visual approach is engaging and facilitates
communication between researchers and managers .
Preference Measures. The ordinal ranking of handsets
provided the main measure of consumer preference.
Also, using the triadic choice data, a Dominance Index
measure of a model's strength relative to competitive
offerings was computed as the frequency the model
was selected divided by the expected count. A value of
1.0 means that the brand is on par with its
competitors; values above 1.0 reflect dominance and
values below 1.0 reflect weakness.
Multi-dimensional Scaling (MDS). Preference maps
provide useful visualizations of the competitive
landscape. The ordinal handset preference ranking
data was submitted to the MDS PROXSCAL algorithm in
SPSS 17.0 to create a consumer preference map.
Whereas MDS reveals the structure of preference,
other techniques are used to interpret (label) the
underlying dimensions .
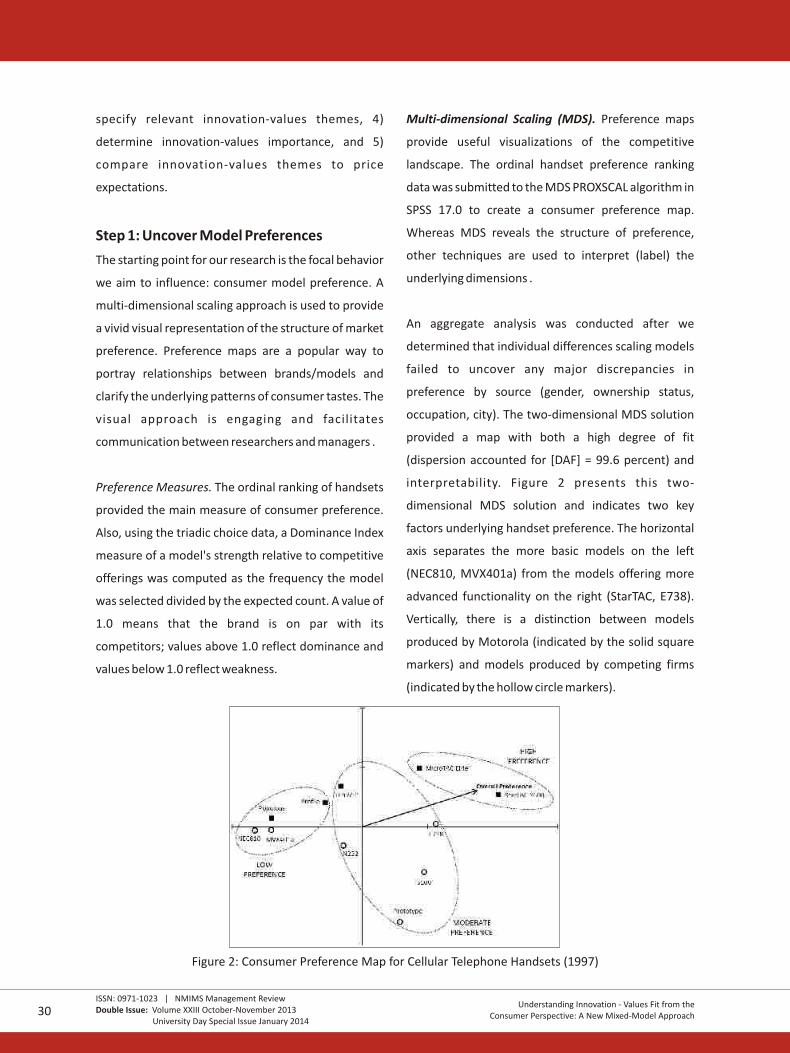
An aggregate analysis was conducted after we
determined that individual differences scaling models
failed to uncover any major discrepancies in
preference by source (gender, ownership status,
occupation, city). The two-dimensional MDS solution
provided a map with both a high degree of fit
(dispersion accounted for [DAF] = 99.6 percent) and
interpretability. Figure 2 presents this two-
dimensional MDS solution and indicates two key
factors underlying handset preference. The horizontal
axis separates the more basic models on the left
(NEC810, MVX401a) from the models offering more
advanced functionality on the right (StarTAC, E738).
Vertically, there is a distinction between models
produced by Motorola (indicated by the solid square
markers) and models produced by competing firms
(indicated by the hollow circle markers).
Figure 2: Consumer Preference Map for Cellular Telephone Handsets (1997)
A regression analysis of the overall rankings onto the
MDS solution space, illustrated by the overall
preference vector, shows the tendency of consumers
to prefer handset models located to the top-right of 2the space (R =.918, F = 44.7, p <.001). A regression of
the Dominance Index measures of preference yielded 2similar results (R =.837, F = 20.6, p <.001). Two
Motorola handset models (StarTAC and MicroTAC)
occupy the top-right “high preference” quadrant. The
stature of these models is evident in the overall
Dominance Index measures (StarTAC dominated
10/10 models, Dominance Index = 2.17; MicroTAC
dominated 9/10 models, Dominance Index =1.67).
K-Means Cluster Analysis. Clustering methods provide
complementary perspectives to MDS by attending to
the pair-wise rather than global patterns in object
(model) similarity (Mohr, 1998). A K-means cluster
analysis of the Dominance Index measures partitioned
the handset models into three preference tiers (low, 1moderate, and high). The allocation of handset
models to clusters was based on maximizing between-
cluster variance in preference while minimizing within-
cluster variance in preference. Two Motorola handset
models constitute the “high preference” cluster. This
outcome presents an interesting challenge to
Motorola, for it must position the StarTAC both against
the MicroTAC (the incumbent leader of Motorola’s
handset portfolio) and well-liked competitive models
in the “moderate preference” cluster.
Step 2: Determine Feature Importance
Product features provide an objective and available
data source to explore the relationship between the
models and consumer preference. Multi-attribute
models provide an accepted and efficient method to
estimate consumers’ utility for an innovation.
Attribute data describing different models or brands
are commonly used to generate product positioning
maps using multi-dimensional scaling (MDS)
techniques (e.g., Adams & Van Auken, 1995; D’Aveni,
2007). Combined with consumer response data,
additional insights can be provided about the
relationship of innovation attributes on consumer
preference or perceived value (e.g., Carroll et al., 1989;
DeSarbo, Kim, Choi, & Spaulding, 2002; Sinha &
DeSarbo, 1998). Differences among innovations are
important variables in explaining consumer adoption
decisions. Attribute approaches take into account
similarities and differences among innovations and
makes it possible to explore the extent to which these
attributes can account for differences in adoption.
Model Feature Scores. Feature scores were calculated
for each model using the information in Table 2. Metric
measures were standardized across models and
nominal properties (have/not) were coded as dummy
(1/0) variables.
ProFit (Property Fitting) Regression Analysis.
Regression analysis is frequently used to determine
what attributes of a product are driving preferences
along with the task of identifying any underlying
dimensions that reflect attribute co-variation
(Schiffman, Reynolds, & Young, 1981; van Kleef, van
Trijp, & Luning, 2006). Specifically, we wanted to
identify the features that people seem to use to
structure their phone model preferences. Using ProFit
1 There are numerous methodologies and modifications to clustering algorithms. The K-means algorithm was chosen because of its long established history and
because its effectiveness versus hierarchical clustering algorithms. K-means will attempt to begin clustering by defining k centroids maximally distant apart,
whereas hierarchical algorithms define a cluster for each observation and iteratively combine clusters to reach an eventual conclusion. The K-means is more
effective in our particular situation because of the content of the data. When many of the clusters have some overlap, the hierarchical algorithms tend to
aggregate clusters based on small overlaps that do not accurately reflect the meaning structures in the data, and tend to over-aggregate. This could be a topic of
future research.
Understanding Innovation - Values Fit from theConsumer Perspective: A New Mixed-Model Approach
Understanding Innovation - Values Fit from theConsumer Perspective: A New Mixed-Model Approach
ISSN: 0971-1023 | NMIMS Management ReviewDouble Issue: Volume XXIII October-November 2013 University Day Special Issue January 2014
ISSN: 0971-1023 | NMIMS Management ReviewDouble Issue: Volume XXIII October-November 2013 University Day Special Issue January 2014
30 31
specify relevant innovation-values themes, 4)
determine innovation-values importance, and 5)
compare innovation-values themes to price
expectations.
Step 1: Uncover Model Preferences
The starting point for our research is the focal behavior
we aim to influence: consumer model preference. A
multi-dimensional scaling approach is used to provide
a vivid visual representation of the structure of market
preference. Preference maps are a popular way to
portray relationships between brands/models and
clarify the underlying patterns of consumer tastes. The
visual approach is engaging and facilitates
communication between researchers and managers .
Preference Measures. The ordinal ranking of handsets
provided the main measure of consumer preference.
Also, using the triadic choice data, a Dominance Index
measure of a model's strength relative to competitive
offerings was computed as the frequency the model
was selected divided by the expected count. A value of
1.0 means that the brand is on par with its
competitors; values above 1.0 reflect dominance and
values below 1.0 reflect weakness.
Multi-dimensional Scaling (MDS). Preference maps
provide useful visualizations of the competitive
landscape. The ordinal handset preference ranking
data was submitted to the MDS PROXSCAL algorithm in
SPSS 17.0 to create a consumer preference map.
Whereas MDS reveals the structure of preference,
other techniques are used to interpret (label) the
underlying dimensions .
An aggregate analysis was conducted after we
determined that individual differences scaling models
failed to uncover any major discrepancies in
preference by source (gender, ownership status,
occupation, city). The two-dimensional MDS solution
provided a map with both a high degree of fit
(dispersion accounted for [DAF] = 99.6 percent) and
interpretability. Figure 2 presents this two-
dimensional MDS solution and indicates two key
factors underlying handset preference. The horizontal
axis separates the more basic models on the left
(NEC810, MVX401a) from the models offering more
advanced functionality on the right (StarTAC, E738).
Vertically, there is a distinction between models
produced by Motorola (indicated by the solid square
markers) and models produced by competing firms
(indicated by the hollow circle markers).
Figure 2: Consumer Preference Map for Cellular Telephone Handsets (1997)
A regression analysis of the overall rankings onto the
MDS solution space, illustrated by the overall
preference vector, shows the tendency of consumers
to prefer handset models located to the top-right of 2the space (R =.918, F = 44.7, p <.001). A regression of
the Dominance Index measures of preference yielded 2similar results (R =.837, F = 20.6, p <.001). Two
Motorola handset models (StarTAC and MicroTAC)
occupy the top-right “high preference” quadrant. The
stature of these models is evident in the overall
Dominance Index measures (StarTAC dominated
10/10 models, Dominance Index = 2.17; MicroTAC
dominated 9/10 models, Dominance Index =1.67).
K-Means Cluster Analysis. Clustering methods provide
complementary perspectives to MDS by attending to
the pair-wise rather than global patterns in object
(model) similarity (Mohr, 1998). A K-means cluster
analysis of the Dominance Index measures partitioned
the handset models into three preference tiers (low, 1moderate, and high). The allocation of handset
models to clusters was based on maximizing between-
cluster variance in preference while minimizing within-
cluster variance in preference. Two Motorola handset
models constitute the “high preference” cluster. This
outcome presents an interesting challenge to
Motorola, for it must position the StarTAC both against
the MicroTAC (the incumbent leader of Motorola’s
handset portfolio) and well-liked competitive models
in the “moderate preference” cluster.
Step 2: Determine Feature Importance
Product features provide an objective and available
data source to explore the relationship between the
models and consumer preference. Multi-attribute
models provide an accepted and efficient method to
estimate consumers’ utility for an innovation.
Attribute data describing different models or brands
are commonly used to generate product positioning
maps using multi-dimensional scaling (MDS)
techniques (e.g., Adams & Van Auken, 1995; D’Aveni,
2007). Combined with consumer response data,
additional insights can be provided about the
relationship of innovation attributes on consumer
preference or perceived value (e.g., Carroll et al., 1989;
DeSarbo, Kim, Choi, & Spaulding, 2002; Sinha &
DeSarbo, 1998). Differences among innovations are
important variables in explaining consumer adoption
decisions. Attribute approaches take into account
similarities and differences among innovations and
makes it possible to explore the extent to which these
attributes can account for differences in adoption.
Model Feature Scores. Feature scores were calculated
for each model using the information in Table 2. Metric
measures were standardized across models and
nominal properties (have/not) were coded as dummy
(1/0) variables.
ProFit (Property Fitting) Regression Analysis.
Regression analysis is frequently used to determine
what attributes of a product are driving preferences
along with the task of identifying any underlying
dimensions that reflect attribute co-variation
(Schiffman, Reynolds, & Young, 1981; van Kleef, van
Trijp, & Luning, 2006). Specifically, we wanted to
identify the features that people seem to use to
structure their phone model preferences. Using ProFit
1 There are numerous methodologies and modifications to clustering algorithms. The K-means algorithm was chosen because of its long established history and
because its effectiveness versus hierarchical clustering algorithms. K-means will attempt to begin clustering by defining k centroids maximally distant apart,
whereas hierarchical algorithms define a cluster for each observation and iteratively combine clusters to reach an eventual conclusion. The K-means is more
effective in our particular situation because of the content of the data. When many of the clusters have some overlap, the hierarchical algorithms tend to
aggregate clusters based on small overlaps that do not accurately reflect the meaning structures in the data, and tend to over-aggregate. This could be a topic of
future research.
Understanding Innovation - Values Fit from theConsumer Perspective: A New Mixed-Model Approach
Understanding Innovation - Values Fit from theConsumer Perspective: A New Mixed-Model Approach
ISSN: 0971-1023 | NMIMS Management ReviewDouble Issue: Volume XXIII October-November 2013 University Day Special Issue January 2014
ISSN: 0971-1023 | NMIMS Management ReviewDouble Issue: Volume XXIII October-November 2013 University Day Special Issue January 2014
30 31
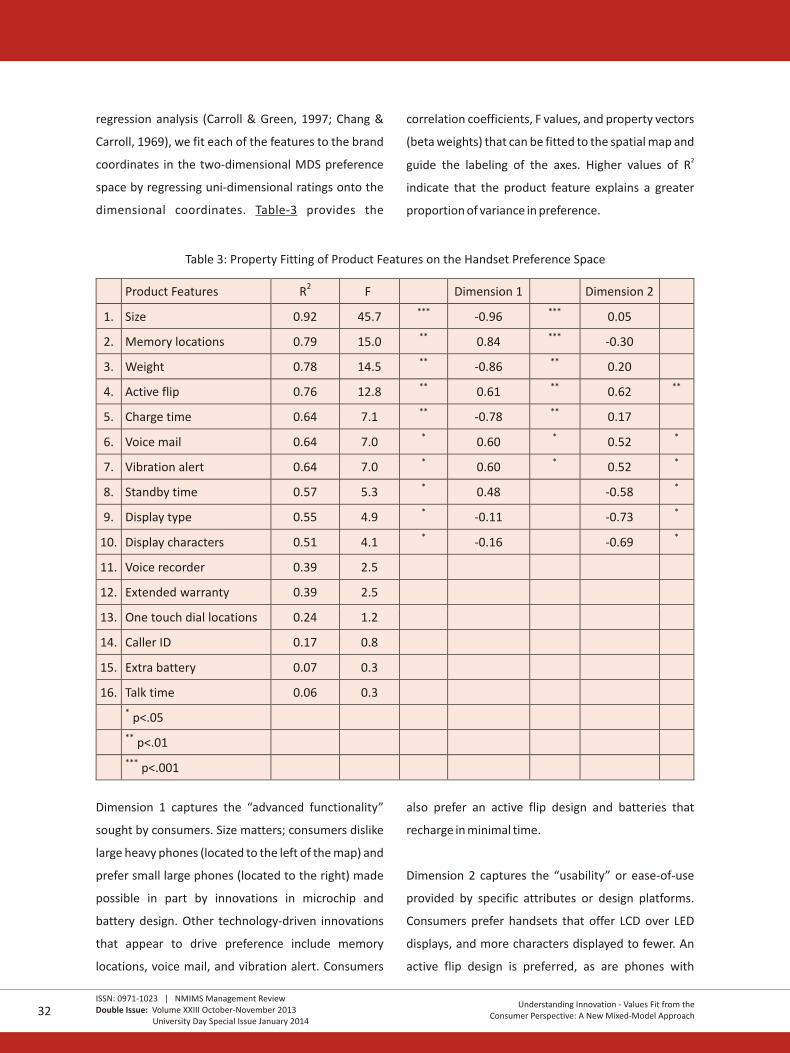
regression analysis (Carroll & Green, 1997; Chang &
Carroll, 1969), we fit each of the features to the brand
coordinates in the two-dimensional MDS preference
space by regressing uni-dimensional ratings onto the
dimensional coordinates. Table-3 provides the
correlation coefficients, F values, and property vectors
(beta weights) that can be fitted to the spatial map and 2guide the labeling of the axes. Higher values of R
indicate that the product feature explains a greater
proportion of variance in preference.
Table 3: Property Fitting of Product Features on the Handset Preference Space
Dimension 1 captures the “advanced functionality”
sought by consumers. Size matters; consumers dislike
large heavy phones (located to the left of the map) and
prefer small large phones (located to the right) made
possible in part by innovations in microchip and
battery design. Other technology-driven innovations
that appear to drive preference include memory
locations, voice mail, and vibration alert. Consumers
also prefer an active flip design and batteries that
recharge in minimal time.
Dimension 2 captures the “usability” or ease-of-use
provided by specific attributes or design platforms.
Consumers prefer handsets that offer LCD over LED
displays, and more characters displayed to fewer. An
active flip design is preferred, as are phones with
longer standby time, vibration alert, and voice mail.
Figure 3 shows the direction of the attribute property
vectors in the model preference space. Large, heavy
“brick-like” handsets are located to the left, whereas
small, light models are located to the right. Notably,
the top 3 preferred models have a flip design that
increases their compactness. Exclusive model
features, notably vibration alert and a digital
answering machine, enhanced the appeal of the
StarTAC and MicroTAC. Yet, the position of the entire
Motorola product line was lessened somewhat by its
adherence to an LED display platform.
Figure 3: Differentiation of Preference via Product Features
Attributes that fail to differentiate models in the
preference space also provide insight into consumer
perception. Though these attributes hold little
potential as differentiators, they may still serve as
prerequisites or points-of-parity that must-be fulfilled
by all models in the category. Alternately, certain
models may include features that are not necessary or
desired by consumers (over-engineering). Whereas
consumers care about model differences in standby
time, they are seemingly uninterested in the fact that
some models offer more talk time than others, or have
extra battery capabilities. Likewise, voice mail was a
valued differentiator but support for caller
identification was not.
Step 3: Specify Relevant Innovation-Values Themes
Measuring the extent of innovation-values fit offers an
overall judgment of compatibility. Yet to influence
these judgments, a more micro and nuanced view of
the specific values is needed to develop strategy to
influence adoption decisions.
Laddering Interview Data. Initial analysis of the
laddering data followed standard coding protocols
using LadderMap software to facilitate the initial
judgment task of coding verbatim comments and
ensuing quantitative analyses. The four key steps are:
(1) Specify elements (attributes, consequences,
values) that constitute each ladder, (2) Develop a set of
content codes (usually 30 – 60 codes), (3) Classify
verbatim elements into the content codes, and (4)
Understanding Innovation - Values Fit from theConsumer Perspective: A New Mixed-Model Approach
Understanding Innovation - Values Fit from theConsumer Perspective: A New Mixed-Model Approach
ISSN: 0971-1023 | NMIMS Management ReviewDouble Issue: Volume XXIII October-November 2013 University Day Special Issue January 2014
ISSN: 0971-1023 | NMIMS Management ReviewDouble Issue: Volume XXIII October-November 2013 University Day Special Issue January 2014
32 33
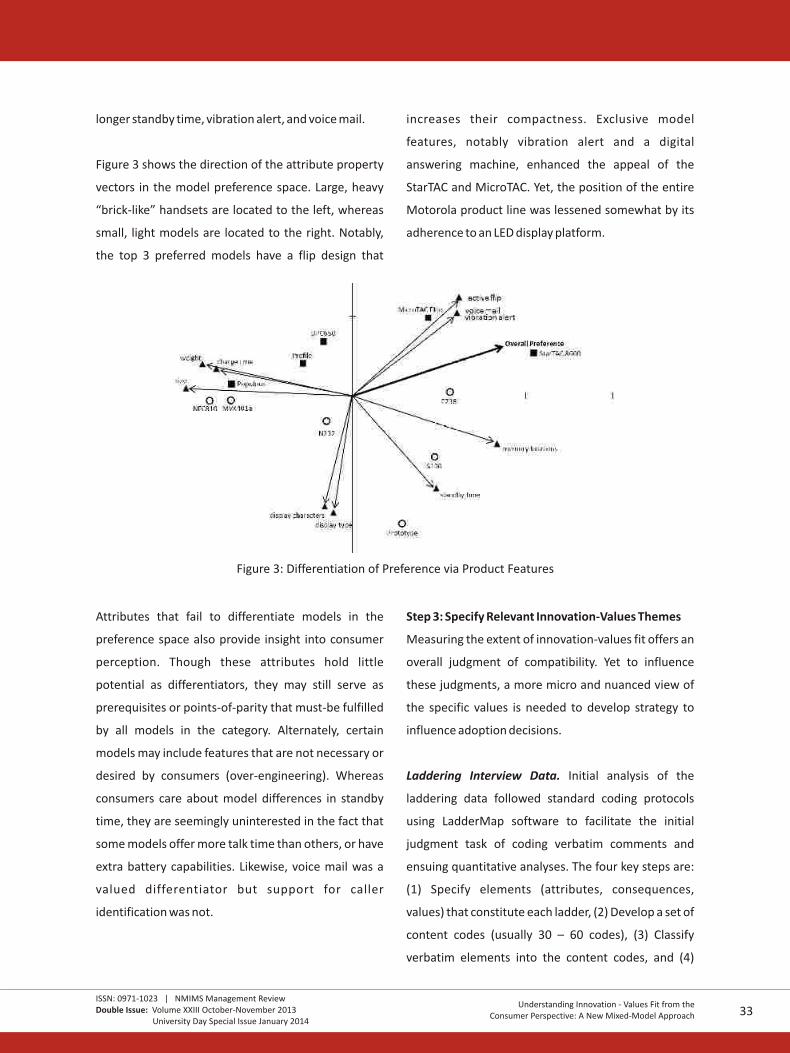
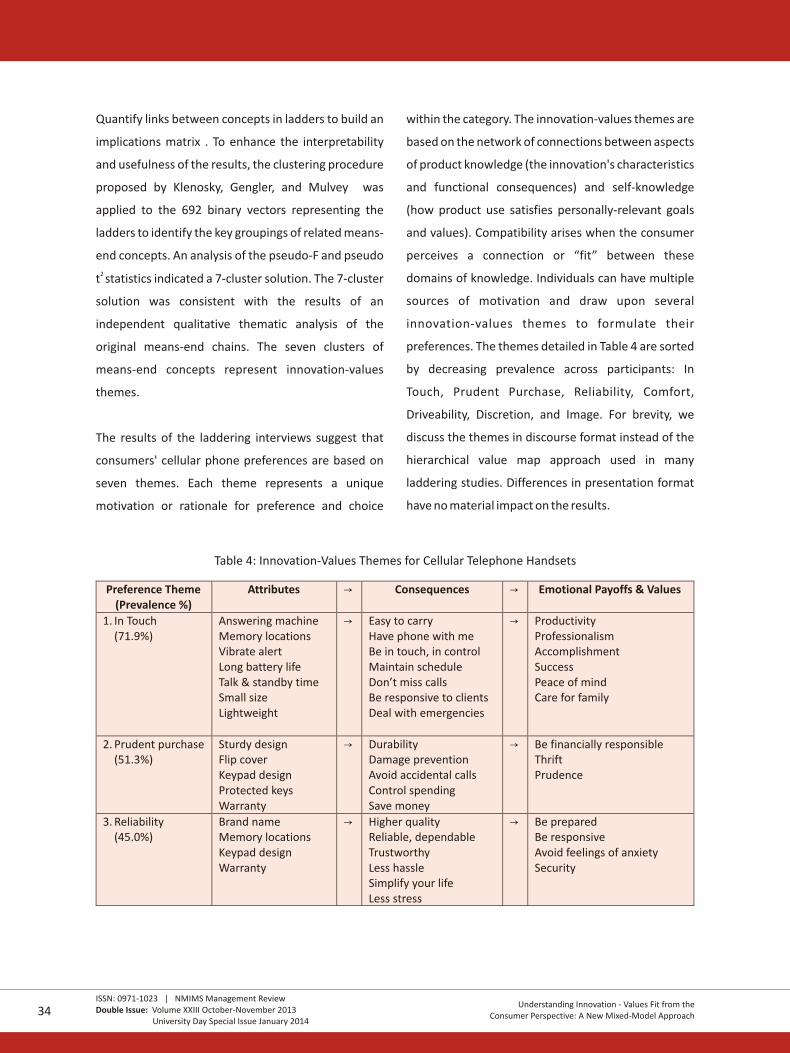
Quantify links between concepts in ladders to build an
implications matrix . To enhance the interpretability
and usefulness of the results, the clustering procedure
proposed by Klenosky, Gengler, and Mulvey was
applied to the 692 binary vectors representing the
ladders to identify the key groupings of related means-
end concepts. An analysis of the pseudo-F and pseudo 2 t statistics indicated a 7-cluster solution. The 7-cluster
solution was consistent with the results of an
independent qualitative thematic analysis of the
original means-end chains. The seven clusters of
means-end concepts represent innovation-values
themes.
The results of the laddering interviews suggest that
consumers' cellular phone preferences are based on
seven themes. Each theme represents a unique
motivation or rationale for preference and choice
within the category. The innovation-values themes are
based on the network of connections between aspects
of product knowledge (the innovation's characteristics
and functional consequences) and self-knowledge
(how product use satisfies personally-relevant goals
and values). Compatibility arises when the consumer
perceives a connection or “fit” between these
domains of knowledge. Individuals can have multiple
sources of motivation and draw upon several
innovation-values themes to formulate their
preferences. The themes detailed in Table 4 are sorted
by decreasing prevalence across participants: In
Touch, Prudent Purchase, Reliability, Comfort,
Driveability, Discretion, and Image. For brevity, we
discuss the themes in discourse format instead of the
hierarchical value map approach used in many
laddering studies. Differences in presentation format
have no material impact on the results.
Table 4: Innovation-Values Themes for Cellular Telephone Handsets
“In Touch” focuses on how features such as message
taking, battery life, and portability keep the phone
working and with the user at all times. Enhanced
connectivity and fewer missed calls are critical to
enhancing professional and personal productivity;
taking care of business is tied to taking care of one's
family. Life runs on a schedule, yet changes in plans are
inevitable. The power to make or take calls 24/7
empowers users to be more responsive and efficient,
supporting their ambition for success.
“Prudent Purchase” concerns the desire to be practical
and financially responsible, a goal that is realized by
purchasing a durable, long-lasting phone. Innovations
must heed the virtues of prudence and thrift. A broken
phone is a useless phone; a design that resists damage
or accidental dialing is critical. At a minimum, a phone
ought to be able to withstand the abuse incurred by
storing it in a purse, gym bag, pocket, or vehicle glove
box.
“Reliability” appeals to consumers who want to be
prepared for whatever challenges lie ahead. Brand
name products backed by long warranties provide
strong signals of product quality and trustworthiness
over the long-term. Reliability is vital when one must
be reachable to clients, supervisors, or family. Knowing
that they will be able to connect at any time makes
users feel secure and confident, a need that is
especially salient during long car trips, such as driving
across Alligator Alley, Florida. A sensible keypad design
and memory locations help to simplify use and avoid
the hassles, frustration, stress, and anxiety caused by
lesser designs.
“Comfort” centers on the ergonomics of a phone's
design and the sensory experiential aspects of phone
usage. Aspects of product design and form – especially
phone weight, shape, and size – foster ease of use to
allow the user to focus, relax, and enjoy the
conversation. Conversely, consumers avoid poorly
Understanding Innovation - Values Fit from theConsumer Perspective: A New Mixed-Model Approach
Understanding Innovation - Values Fit from theConsumer Perspective: A New Mixed-Model Approach
ISSN: 0971-1023 | NMIMS Management ReviewDouble Issue: Volume XXIII October-November 2013 University Day Special Issue January 2014
ISSN: 0971-1023 | NMIMS Management ReviewDouble Issue: Volume XXIII October-November 2013 University Day Special Issue January 2014
34 35
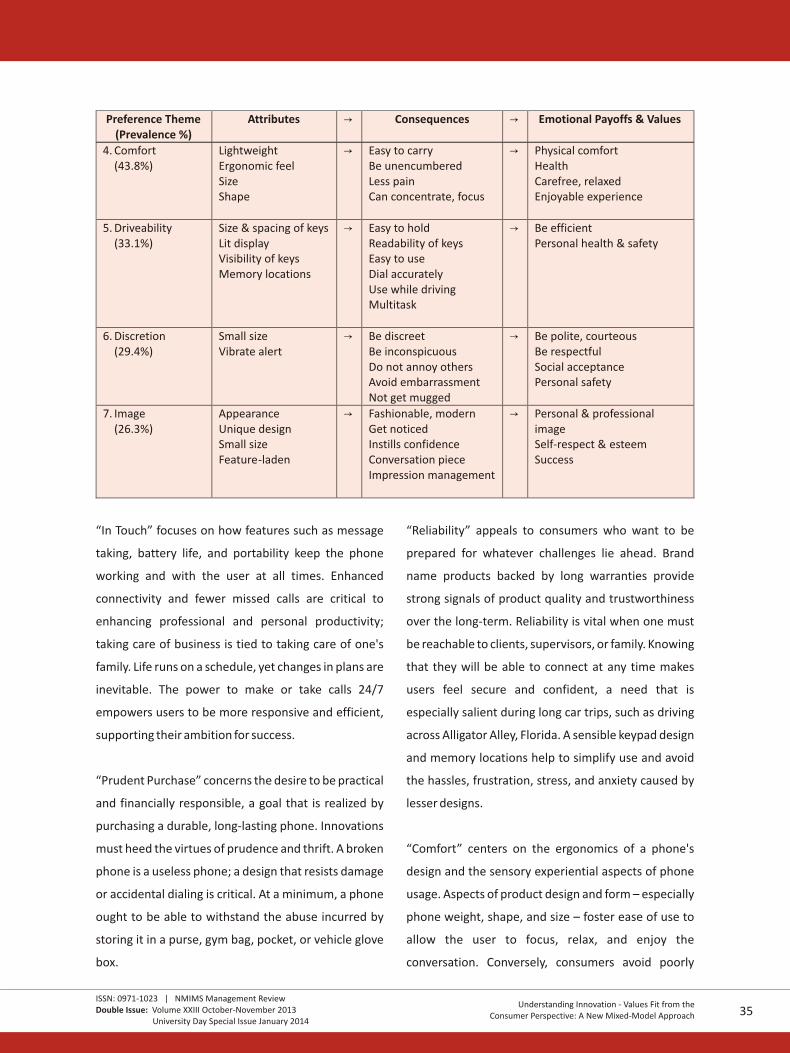
designed phones that are awkward or even painful to
use. The annoyance of walking or exercising with a
phone is familiar to men who clip their phone to a belt
or stow it in a pocket, unlike women who put their
phone in a purse.
Though currently a contentious legal issue,
“Driveability” was an important issue to many multi-
tasking consumers who wanted to use their cell
phones while driving. Features including a lit display,
optimally scaled and easily-read keys, and memory
locations enhance dialing accuracy and reduce the risk
of inherently hazardous activity. Drivers who lend their
phones to passengers also appreciate an intuitive
easy-to-use design as it alleviates the distraction and
burden of explaining how to use it.
“Discretion” focuses on how some cell phone users
want to remain inconspicuous and to avoid annoying
others. Discretion is sought in public spaces including
places of worship, schools, and restaurants as well in
workplace meetings. Small phones with vibrate alert
feature epitomize discretion. Discretion is driven by
the desire to shun unwanted attention sparked by
phone ownership, is compelled by a wish to avoid
distracting others out of courtesy and respect, and
stems from a feeling of precautionary safety and not
wanting to be a target for thieves.
Finally, “Image” was an important criterion in terms of
the phone's appearance and features. Small-sized
feature-laden phones with a unique design are
fashionable, attracting attention and triggering
conversations. Concerned with making the right
impression, modern, expensive and prestigious
phones instill confidence in those who “dress to
impress, dress for success.” The quest for cool is
shadowed by the escape from ridicule; nobody wants a
large phone in the pocket that “looks like a boob.”
Step 4: Determine Innovation -Values Theme
Importance
Means-end research typically provides insight into the
qualitative dimensions of perceived value, yet only
considers their importance as a function of prevalence
of mention across consumers. To increase the
interpretability, usefulness and actionability of study
results, we augment the traditional analysis with
scaled judgments of model performance along the
innovation-value themes. These ratings are then
correlated with consumers' model preferences.
Innovation-Values Theme Ratings. Participants only
rated the means-end dimensions they elaborated in
the laddering interviews, and ratings of model
performance were standardized across models.
Already we have established the dominance of the
StarTAC and MicroTAC versus their competitors using
preference measures. The reasons for their
dominance are evident upon examination of the
standardized model performance ratings across the
seven themes, as illustrated in Figure 4. Clearly, the
two models outperform their rivals in the moderate-
and low-preference tiers.
Figure 4: Standardized Model Ratings by Innovation-Values Theme
ProFit regression of the model performance ratings
onto the handset preference space provides additional
evidence of how consumers differentiate models in
reference to the themes. The property vectors listed in
Table 5 and fitted to the MDS space in Figure 5 show
how the MicroTAC and especially the StarTAC received
the highest ratings for six of the seven innovation-
values themes. The lone exception was that the
MicroTAC was rated as providing superior
“Driveability” to the StarTAC. The fact that the
“Driveability” property vector is perpendicular to the
overall preference vector is important as it provides
evidence of heterogeneity in consumer preference
and raises the possibility that a minority (sub-
segment) of participants had distinct needs that were
not fully satisfied by the next-generation product. We
will revisit this issue later.
Table 5: Property Fitting of Innovation-Values Themes on the Handset Preference Space
* p<.05** p<.01*** p<.001
Understanding Innovation - Values Fit from theConsumer Perspective: A New Mixed-Model Approach
Understanding Innovation - Values Fit from theConsumer Perspective: A New Mixed-Model Approach
ISSN: 0971-1023 | NMIMS Management ReviewDouble Issue: Volume XXIII October-November 2013 University Day Special Issue January 2014
ISSN: 0971-1023 | NMIMS Management ReviewDouble Issue: Volume XXIII October-November 2013 University Day Special Issue January 2014
36 37
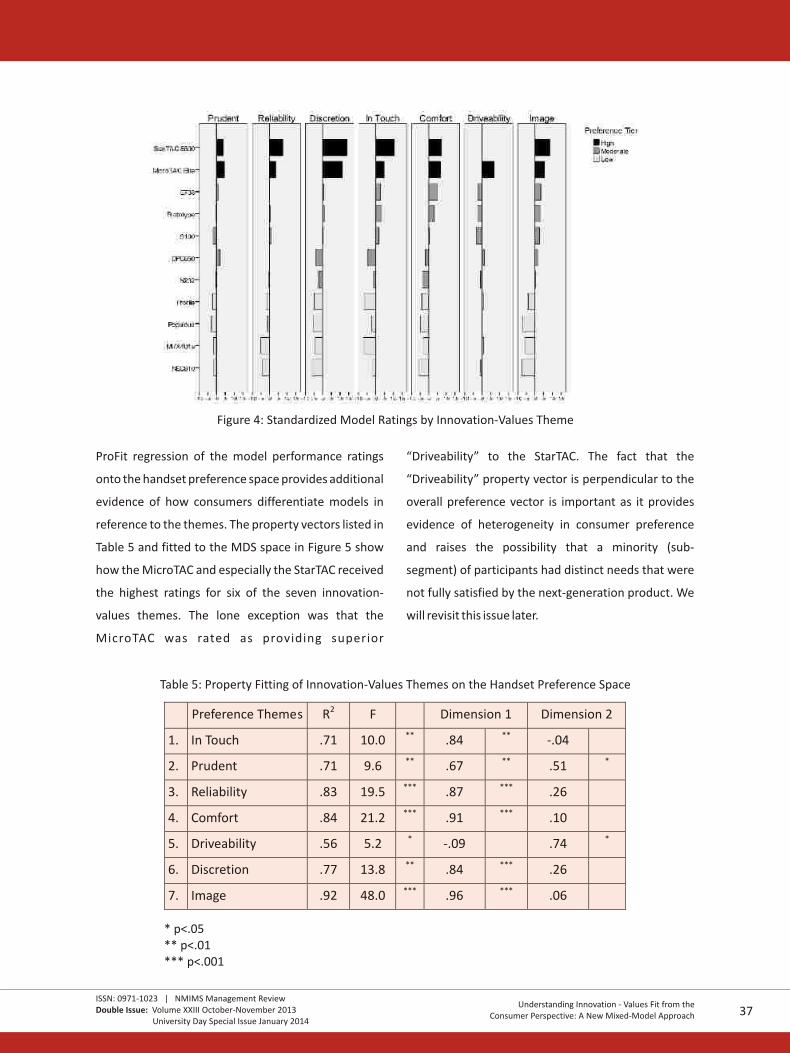
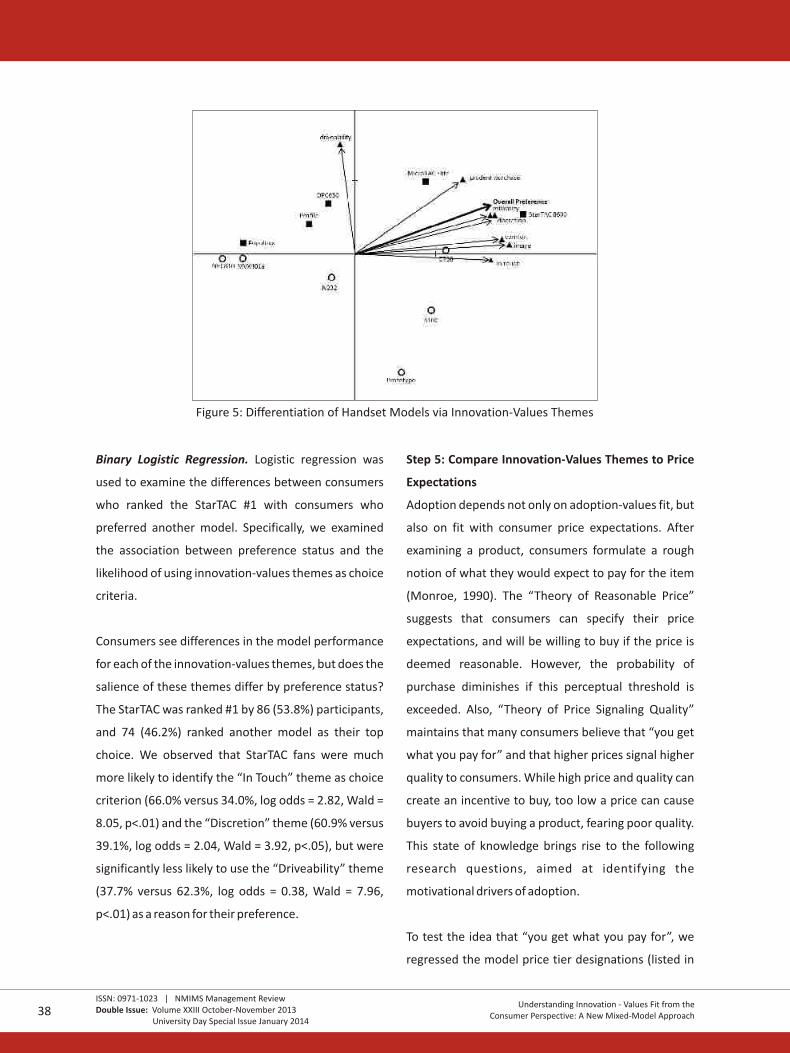
Figure 5: Differentiation of Handset Models via Innovation-Values Themes
Binary Logistic Regression. Logistic regression was
used to examine the differences between consumers
who ranked the StarTAC #1 with consumers who
preferred another model. Specifically, we examined
the association between preference status and the
likelihood of using innovation-values themes as choice
criteria.
Consumers see differences in the model performance
for each of the innovation-values themes, but does the
salience of these themes differ by preference status?
The StarTAC was ranked #1 by 86 (53.8%) participants,
and 74 (46.2%) ranked another model as their top
choice. We observed that StarTAC fans were much
more likely to identify the “In Touch” theme as choice
criterion (66.0% versus 34.0%, log odds = 2.82, Wald =
8.05, p<.01) and the “Discretion” theme (60.9% versus
39.1%, log odds = 2.04, Wald = 3.92, p<.05), but were
significantly less likely to use the “Driveability” theme
(37.7% versus 62.3%, log odds = 0.38, Wald = 7.96,
p<.01) as a reason for their preference.
Step 5: Compare Innovation-Values Themes to Price
Expectations
Adoption depends not only on adoption-values fit, but
also on fit with consumer price expectations. After
examining a product, consumers formulate a rough
notion of what they would expect to pay for the item
(Monroe, 1990). The “Theory of Reasonable Price”
suggests that consumers can specify their price
expectations, and will be willing to buy if the price is
deemed reasonable. However, the probability of
purchase diminishes if this perceptual threshold is
exceeded. Also, “Theory of Price Signaling Quality”
maintains that many consumers believe that “you get
what you pay for” and that higher prices signal higher
quality to consumers. While high price and quality can
create an incentive to buy, too low a price can cause
buyers to avoid buying a product, fearing poor quality.
This state of knowledge brings rise to the following
research questions, aimed at identifying the
motivational drivers of adoption.
To test the idea that “you get what you pay for”, we
regressed the model price tier designations (listed in
Table 2) onto the preference space and confirmed that
consumer preference exhibits a high level of
2corresponds with market price tiers (R =.892, F = 33.9,
p <.001).
Shifting focus to consumers’ internal standards of
value, we tested the link between model preference
status and consumer expectations of price level. As
illustrated in the error bar graphs in Figure 6A, price
expectations for the MicroTAC were very consistent
regardless of participants’ model preference status. In
contrast, price expectations for the next-generation
StarTAC model shown in Figure 6B reveal that fans of
the StarTAC (vs. fans of other models) perceived
greater value and expected to pay significantly more
for the phone at each of the four price anchors. On
average, StarTAC fans had major reservations about
product quality at $116.40 (vs. $66.67, F = 13.21,
p<.001), viewed it as a deal at $190.81 (vs. $131.39, F =
9.61, p<.01), felt it as getting expensive but still worth
consideration at $320.76 (vs. $220.69, F = 12.10,
p<.001) and deemed it too expensive at $407.09 (vs.
$304.86, F = 7.40, p<.01).
A. Incumbent ModelMicroTAC Elite
B. Next-generation ModelStarTAC 8600
Figure 6: Price Sensitivity Points for Incumbent and Next-generation Models by Model Preference
Overall, participants felt that the next-generation
StarTAC would be priced higher than the incumbent
MicroTAC. Fans of the StarTAC (vs. fans of other
models) perceived a greater price premium (P – StarTAC
P ) across all four measures: “too cheap” (+$46.98 MicroTAC
vs. + $12.50, F = 13.29, p<.001), “bargain price”
(+$64.36 vs. +$20.69, F = 16.25, p<.001), “high-end
consider” (+$93.20 vs. +$9.58, F = 23.95, p<.001) and
“too high” (+$107.67 vs. +$21.25, F = 20.48, p<.001).
These results support the conclusion that Motorola
should consider launching the new StarTAC model at a
higher price than the incumbent model because
consumers realize that it provides superior
performance along crucial innovation-values themes.
This brings us to the question of “which theme(s)
drives price expectations?”
We investigated the relationship between theme
salience and the StarTAC price perceptions. Evidently,
the innovation-values fit of being “In Touch” is worth
Understanding Innovation - Values Fit from theConsumer Perspective: A New Mixed-Model Approach
Understanding Innovation - Values Fit from theConsumer Perspective: A New Mixed-Model Approach
ISSN: 0971-1023 | NMIMS Management ReviewDouble Issue: Volume XXIII October-November 2013 University Day Special Issue January 2014
ISSN: 0971-1023 | NMIMS Management ReviewDouble Issue: Volume XXIII October-November 2013 University Day Special Issue January 2014
38 39
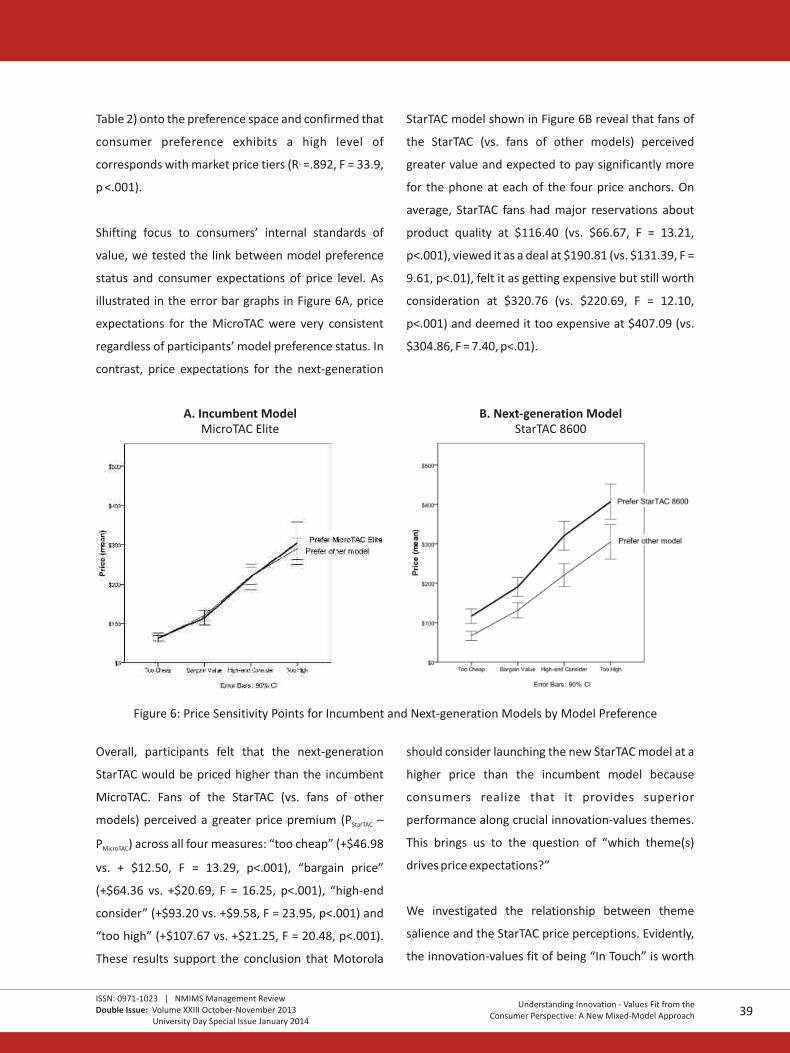
paying for. Consumers who used the “In Touch” theme
as a choice criterion provided higher “begins to be
expensive” price estimates on average (+$46.75, F =
5.4, p<.05) than consumers who did not mention the
theme. Activation of the “Driveability” theme proved
to lower price expectations (-$52.60, F = 7.67, p<.01),
whereas the salience of “Discretion” has no significant
impact on price expectations. These results
demonstrate how mere differentiation is not a sound
basis for developing a positioning strategy because
consumers must also value the difference. Though the
exceptional level of discretion provided by the StarTAC
will be noticed by prospective customers, its capacity
to keep users “In Touch” will matter most in closing the
sale.
DISCUSSION
The goal of this research was to propose and
demonstrate a novel approach to study innovations-
value fit and compatibility. By adapting and extending
the means-end motivational framework, we provided
a conceptual template for analyzing technology's
relevance to consumers. This research also answered
Hauser, Tellis & Griffin's challenge to develop new
consumer-centric perspectives on innovation
adoption using field study data. The detailed analysis
of 160 prospects' reactions to a new-generation
product using laddering interviews provided much
deeper insight into innovation-values fit than is usual.
In this study, we pushed means-end methodology into
quantitative directions that have rarely been explored.
We asked: Why not capture consumers' qualitative
and quantitative reactions to an innovation at the
same time? It is possible to gather complementary
perspectives in a single stage, thus speeding analysis
and providing timely input for the time-sensitive
decisions that typify the innovation commercialization
process. We demonstrated how first-step one-on-one
interviews can deliver much more than purely
qualitative insights by collecting additional measures
such as brand/model preferences, performance
ratings, and price perceptions. The effort to collect
these scale measures is trivial compared to the “high
amount of effort in data collection” and “extensive
effort in coding (summarizing and categorizing) and
interpreting the meaning of the results” required of
the means-end approach. Conversely, this study
provided fuller information and added uncommon
qualitative insight to familiar descriptive and
inferential statistics and positioning maps.
Our research has several important implications for
both innovation scholars and practicing managers.
From a theoretical standpoint, our means-end
framework goes beyond the simple “poor-neutral-
good” scale measures of innovation-values fit to
produce a more fundamental understanding of
consumers' reactions to an innovation. Connections
are crucial. Products only matter if consumers perceive
personal relevance in their consumption. Innovations
have to connect with consumers' goals, values, and
ultimately their lives. As such, this research builds on
recent efforts that underscore how to gain a
competitive advantage by establishing the personal
relevance of a brand's technology.
Managerial Implications
The means-end model of innovation-values fit also
provides the kinds of actionable insights that
managers need to make decisions about marketing
new products. The innovation-values themes provide
conceptual templates the company can use in
positioning the innovative product. Commercial
applications of means-end study results to domains
like advertising are well-established in the literature .
Our extensions to the basic means-end approach
include the collection and comparison of brand/model
rating data and price perception measures –
improvements that have been frequently suggested,
but rarely implemented.
This methodology can benefit managers in two
important ways. Firstly, shortening the product
development process and improving probabilities of
success has been an important topic for over two
decades, and has been the subject of such voluminous
research that six meta-analyses have been performed
on the topic . By essentially collapsing the research
process to one step instead of several, important
product feature decisions can be improved and
launches quickened. For example, design features and
positioning decisions for a new line of consumer hand
brushes can be made within a few weeks of the
research being initiated. Launches can be made
quickly with greater confidence that they are both
delivering the features consumers value the most and
that the promotional efforts are promising the
benefits that are being valued most by consumers. Too
often a crowded message of all the benefits a new
product contains fails to clearly articulate the benefits
that are most valued by consumers, because it is lost in
the clutter.
Secondly, in many elite markets or business-to-
business markets, the opportunity to reach customers
is severely limited. One example might be studying the
features most important to private purchasers of
private jet services. The number of elite consumers
who are able and willing to pay for this service is
extremely limited. Furthermore, their attention for an
interview is difficult and expensive to obtain. For this
reason, market researchers will want to maximize the
amount of information they can get from these
individuals in one interview, because it may simply be
infeasible to do a stage of qualitative and a follow-up
survey without exhausting the available population
willing to be surveyed. A similar situation exists for a
financial institution desiring to interview CFOs of
fortune 100 corporations on decisions related to fund
investments. Only a subset of them is willing to
participate in research at all, and maximizing the
information we can get from each interview is of
paramount importance.
There are additional strategic considerations to be
considered. Innovative companies face the dilemma of
cannibalization because the introduction of
innovations often affects sales and profitability of
older models. The next-generation StarTAC model
leapfrogged the incumbent technology, instigating the
need to reposition the MicroTAC as it was no longer the
most feature-laden and desirable model on the
market. However, it was rated as having the highest
level of “Driveability” of all models tested.
Unfortunately, though offering a differential
advantage, it would be irresponsible and risky for
Motorola to use “Driveability” as a positioning theme.
However, if one closely examines the means-end
elements that constitute this theme, it points to the
fact that certain consumers wanted a handset that is
really easy to use. Fast forward to the present and
there is a bourgeoning niche market for handsets
targeted primarily to seniors that offer large readable
buttons and displays, and better sound quality;
innovations that are compatible with their needs and
fit with their values.
Limitations and Directions for Future
Research
Price and perceived value are two sides of the same
Understanding Innovation - Values Fit from theConsumer Perspective: A New Mixed-Model Approach
Understanding Innovation - Values Fit from theConsumer Perspective: A New Mixed-Model Approach
ISSN: 0971-1023 | NMIMS Management ReviewDouble Issue: Volume XXIII October-November 2013 University Day Special Issue January 2014
ISSN: 0971-1023 | NMIMS Management ReviewDouble Issue: Volume XXIII October-November 2013 University Day Special Issue January 2014
40 41
coin. We discovered that people who see value in the
next-generation product expect to pay more.
Traditionally the means-end approach has been used
to study consumer perceived value, but rarely has it
reconciled the anticipated “get” of the exchange with
the inevitable “give up”. Such tradeoffs are
fundamental and ought to occupy a higher priority on
researchers' agendas. The present analysis takes some
original steps in demonstrating a link between
innovations-values themes and price expectations.
The price sensitivity meter provides a theory-based
approach to study consumer price perceptions more
systematically, and yet has certain limitations (i.e. it
tends to underestimate willingness-to-pay, and works
best when consumers have lots of experience with the
product). For this reason, future research should
consider including more sophisticated measures of
consumer price perceptions and tradeoffs for
innovations.
Methodologically, this research could be extended and
enhanced using quantitative and qualitative
approaches. This analysis focused on the preference
pattern of the market as a whole and did not fully
explore heterogeneity in consumer preference. A high
level of consensus among participants in their brand
rankings across a-priori groupings lessened the harm
instigated by this assumption. Yet, advances in latent
class segmentation techniques and the increased
availability of commercial software programs provide
powerful tools to capture and investigate unobserved
heterogeneity and are worth considering . Likewise,
the systematic collection and analysis of insights from
consumers' technology narratives and metaphoric
expressions of their thoughts and feelings would
surface deep insights into the meanings and
ideological concerns that structure how consumers
perceive technology's relevance .
In summary, this study has revisited the important
relationship between consumer adoption behavior
and innovation-values fit. Our analysis presented a
method to identify the themes that constitute the
general concept of innovation-values fit and
established their impact on consumer perceptions of
brand/model differentiation, desirability, and price
expectations. We hope our means-end model
stimulates future research on understanding
innovation-values fit from the consumer perspective.
• Adams, A. J., & Van Auken, S. (1995). A New Approach to Measuring Product Category Membership. Journal of
Advertising Research, 35(5), 73-79.
• Arts, J. W. C., Frambach, R. T., & Bijmolt, T. H. A. (2011). Generalizations on consumer innovation adoption: A
meta-analysis on drivers of intention and behavior. International Journal of Research in Marketing, 28(2), 134-
144.
• Bagozzi, R. P., & Dabholkar, P. A. (2000). Discursive psychology: An alternative conceptual foundation to means-
end chain theory. Psychology & Marketing, 17(7), 535-586.
• Bagozzi, R. P., & Dholakia, U. (1999). Goal Setting and Goal Striving in Consumer Behavior. Journal of Marketing,
63 (Special Issue), 19-32.
References
•
• Breidert, C., Hahsler, M., & Reutterer, T. (2006). A review of methods for measuring willingness-to-pay.
Innovative Marketing, 2(4), 8-32.
• Bunker, D., Kautz, K.-H., & Nguyen, A. L. T. (2007). Role of value compatibility in IT adoption. Journal of
Information Technology, 22(1), 69-78.
• Cankurtaran, P., Langerak, F., & Griffin, A. (2013). Consequences of New Product Development Speed: A Meta-
Analysis. Journal of Product Innovation Management, 30(3), 465-486.
• Carroll, J. D., & Green, P. E. (1997). Psychometric methods in marketing research: Part 2 - Multidimensional
Scaling. Journal of Marketing Research, 34, 193-204.
• Carroll, J. D., Green, P. E., & Kim, J. (1989). Preference mapping of conjoint-based profiles: An INDSCAL
approach. Journal of the Academy of Marketing Science, 17(4), 273-281.
• Cartwright, D. (1949). Some principles of mass persuasion: Selected findings of research on the sale of United
States War Bonds. Human Relations, 2(3), 253-267.
• Chang, J., & Carroll, J. (1969). How to use PROFIT, a computer program for property fitting by optimizing
nonlinear or linear correlation. Bell Telephone Laboratories, Murray Hill, NJ.
• Christensen, C. M. (1997). The Innovator’s Dilemma: When New Technologies Cause Great Firms to Fall.
Boston, MA: Harvard Business School Press.
• Consumer Reports. (1997). Cellular phones with less static. Consumer Reports, 62(11), 16-22.
• D’Aveni, R. A. (2007). Mapping your competitive position. Harvard Business Review, 85(11), 110-120.
• Dahl, D. W., & Hoeffler, S. (2004). Visualizing the Self: Exploring the Potential Benefits and Drawbacks for New
Product Evaluation. Journal of Product Innovation Management, 21(4), 259-267.
• DeSarbo, W. S., Kim, J., Choi, S. C., & Spaulding, M. (2002). A Gravity-Based Multidimensional Scaling Model for
Deriving Spatial Structures Underlying Consumer Preference/Choice Judgments. Journal of Consumer
Research, 29(1), 91-100. doi: doi:10.1086/339923
• Gengler, C. E., Howard, D. J., & Zolner, K. (1995). A personal construct analysis of adaptive selling and sales
experience. Psychology and Marketing, 12(4), 287-304.
• Gengler, C. E., & Reynolds, T. J. (1995). Consumer understanding and advertising strategy: Analysis and strategic
translation of laddering data. Journal of Advertising Research, 35(4), 19-33.
• Griffith, T. L. (1999). Technology Features as Triggers for Sensemaking. The Academy of Management Review,
24(3), 472-488.
• Grover, R., & Vriens, M. (2006). The handbook of marketing research: uses, misuses, and future advances.
Thousand Oaks, CA: Sage.
• Guiltinan, J. P. (1999). Launch strategy, launch tactics, and demand outcomes. Journal of Product Innovation
Management, 16(6), 509-529.
• Gutman, J. (1982). A means-end chain model based on consumer categorization processes. Journal of
Marketing, 46(2), 60-72.
• Gutman, J. (1997). Means-end chains as goal hierarchies. Psychology & Marketing, 14(6), 545-560.
• Harrington, S. J., & Ruppel, C. P. (1999). Telecommuting: a test of trust, competing values, and relative
Borg, I., Groenen, P. J. F., & Mair, P. (2013). Applied multidimensional scaling: Springer.
Understanding Innovation - Values Fit from theConsumer Perspective: A New Mixed-Model Approach
Understanding Innovation - Values Fit from theConsumer Perspective: A New Mixed-Model Approach
ISSN: 0971-1023 | NMIMS Management ReviewDouble Issue: Volume XXIII October-November 2013 University Day Special Issue January 2014
ISSN: 0971-1023 | NMIMS Management ReviewDouble Issue: Volume XXIII October-November 2013 University Day Special Issue January 2014
42 43
advantage. IEEE Transactions on Professional Communication, 42(4), 223-239.
• Hauser, J. R., Tellis, G. J., & Griffin, A. (2006). Research on Innovation: A Review and Agenda for Marketing
Science. Marketing Science, 25(6), 687-717.
• Hill, R. C., & Levenhagen, M. (1995). Metaphors and Mental Models: Sensemaking and Sensegiving in
Innovative and Entrepreneurial Activities. Journal of Management, 21(6), 1057-1074. doi:
10.1177/014920639502100603
• Holak, S. L., & Lehmann, D. R. (1990). Purchase Intentions and the Dimensions of Innovation: An Exploratory
Model. Journal of Product Innovation Management, 7(1), 59-73.
• Holbrook, M. B., & Holloway, D. V. (1984). Marketing Strategy and the Structure of Aggregate, Segment-
Specific, and Differential Preferences. Journal of Marketing, 48(1), 62-67.
• Howard, J. A., & Warren, G. E. (2001). Foreword. In T. J. Reynolds & J. C. Olson (Eds.), Understanding Consumer
Decision Making: The Means-End Approach to Marketing and Advertising Strategy (pp. xi-xiii). Mahwah, NJ:
Lawrence Erlbaum Associates.
• Kahle, L. R., Beatty, S. E., & Homer, P. (1986). Alternative measurement approaches to consumer values: the list
of values (LOV) and values and life style (VALS). Journal of Consumer Research, 405-409.
• Klein, K. J., & Sorra, J. S. (1996). The Challenge of Innovation Implementation. Academy of Management
Review, 21(4), 1055-1080.
• Klenosky, D. B., Gengler, C. E., & Mulvey, M. S. (1993). Understanding the factors influencing ski destination
choice: A means-end analytic approach. Journal of Leisure Research, 25(4), 362-379.
• Kozinets, R. V. (2008). Technology/Ideology: How Ideological Fields Influence Consumers’ Technology
Narratives. Journal of Consumer Research, 34(6), 865-881. doi: doi:10.1086/523289
• Levitt, T. (1960). Marketing Myopia. Harvard Business Review, 38(5), 26-48.
• Ligas, M. (2000). People, products, and pursuits: Exploring the relationship between consumer goals and
product meanings. Psychology & Marketing, 17(11), 983-1003.
• Lilien, G. L., & Rangaswamy, A. (2003). Marketing Engineering: Computer-Assisted Marketing Analysis and
Planning (2nd ed.). Upper Saddle River, NJ: Prentice Hall.
• Mohr, J. W. (1998). Measuring meaning structures. Annual Review of Sociology, 24, 345-370.
• Monroe, K. B. (1990). Pricing: Making Profitable Decisions (2nd ed.). New York: McGraw Hill.
• Mulvey, M. S., & Kavalam, B. E. (2010). Mining deeper meaning in consumer decision maps. Qualitative Market
Research: An International Journal, 13(4), 372-388.
• Mulvey, M. S., Olson, J. C., Celsi, R. L., & Walker, B. A. (1994). Exploring the Relationships Between Means-End
Knowledge and Involvement. In C. T. Allen & D. R. John (Eds.), Advances in Consumer Research (Vol. 21, pp. 51-
57).
• Myers, J. H. (1996). Segmentation and positioning for strategic marketing decisions. Chicago, IL: American
Marketing Association.
• Newell, A., & Simon, H. A. (1972). Human Problem Solving. Englewood Cliffs, NJ: Prentice Hall.
• Olson, J. C., & Reynolds, T. J. (1983). Understanding Consumers’ Cognitive Structures: Implications for
Advertising Strategy. In L. Percy & A. G. Woodside (Eds.), Advertising and Consumer Psychology (pp. 77-90).
Lexington, MA: Lexington Books.
• Olson, J. C., Waltersdorff, K., & Forr, J. (2009). Incorporating Deep Customer Insights in the Innovation Process
Kundenorientierte Unternehmensführung (pp. 507-527).
• Overby, J. W., Gardial, S. F., & Woodruff, R. B. (2004). French versus American consumers’ attachment of value
to a product in a common consumption context: A cross-national comparison. Journal of the Academy of
Marketing Science, 32(4), 437-460.
• Padgett, D., & Mulvey, M. S. (2007). Differentiation via technology: Strategic positioning of services following
the introduction of disruptive technology. Journal of Retailing, 83(4), 375-391.
• Parry, M. E. (2002). Strategic Marketing Management: A Means-End Approach. New York: McGraw-Hill.
• Pieters, R., Baumgartner, H., & Allen, D. (1995). A means-end chain approach to consumer goal structures.
International Journal of Research in Marketing, 12(3), 227-244.
• Ratneshwar, S., Mick, D. G., & Huffman, C. (2000). The Why of Consumption: Contemporary Perspectives on
Consumer Motives, Goals and Desires. New York: Routledge.
• Reynolds, T. J., Dethloff, C., & Westberg, S. J. (2001). Advancements in laddering. In T. J. Reynolds & J. C. Olson
(Eds.), Understanding consumer decision making: The means-end approach to marketing and advertising
strategy (pp. 91-118). Mahwah, NJ: Lawrence Erlbaum Associates, Publishers.
• Reynolds, T. J., & Gutman, J. (1988). Laddering theory, method, analysis, and interpretation. Journal of
Advertising Research, 28(1), 11-31.
• Reynolds, T. J., & Olson, J. C. (Eds.). (2001). Understanding consumer decision making: The means-end
approach to marketing and advertising strategy. Mahwah, NJ: Lawrence Erlbaum Associates, Publishers.
• Rogers, E. M. (1995). Diffusion of Innovations (5th ed.). New York: Free Press.
• Rokeach, M. (1973). The Nature of Human Values. New York: Free Press.
• Schiffman, S. S., Reynolds, M. L., & Young, F. W. (1981). Introduction to Multidimensional Scaling: Theory,
Methods, and Applications. New York: Academic Press.
• Schwartz, S. H., & Bilsky, W. (1987). Toward a universal psychological structure of human values. Journal of
personality and social psychology, 53(3), 550.
• Sinha, I., & DeSarbo, W. S. (1998). An Integrated Approach toward the Spatial Modeling of Perceived Customer
Value. Journal of Marketing Research, 35(2), 236-249.
• Slater, S. F., & Narver, J. C. (1998). Customer-led and market-oriented: Let’s not confuse the two. Strategic
Management Journal, 19(10), 1000-1006.
• Thio, A. O. (1971). A Reconsideration of the Concept of Adopter-Innovation Compatibility in Diffusion
Research. The Sociological Quarterly, 12(1), 56-68.
• Tolman, E. C. (1932). Purposive behavior in animals and men. New York: Century.
• Tornatzky, L. G., & Klein, K. J. (1982). Innovation Characteristics and Innovation Adoption-Implementation: A
Meta-Analysis of Findings. IEEE Transactions on Engineering Management, 29(1), 28-45.
• van Kleef, E., van Trijp, H., & Luning, P. (2006). Internal versus external preference analysis: An exploratory study
on end-user evaluation. Food quality and preference, 17(5), 387-399.
• Walker, B. A., & Olson, J. C. (1991). Means-end chains: Connecting products with self. Journal of Business
Understanding Innovation - Values Fit from theConsumer Perspective: A New Mixed-Model Approach
Understanding Innovation - Values Fit from theConsumer Perspective: A New Mixed-Model Approach
ISSN: 0971-1023 | NMIMS Management ReviewDouble Issue: Volume XXIII October-November 2013 University Day Special Issue January 2014
ISSN: 0971-1023 | NMIMS Management ReviewDouble Issue: Volume XXIII October-November 2013 University Day Special Issue January 2014
44 45
Research, 22(2), 111-118.
• Weick, K. E. (1995). Sensemaking in organizations. Thousand Oaks, CA: Sage Publications.
• Wildstrom, S. H. (2000, May 8). Laptops: Do You Need That Speed? Business Week, 28.
• Young, S., & Feigin, B. (1975). Using the benefit chain for improved strategy formulation. Journal of Marketing,
39(3), 72-74.
• Zaltman, G., & Zaltman, L. (2008). Marketing Metaphoria: What Deep Metaphors Reveal about the Minds of
Consumers. Boston, MA: Harvard Business Press.
• Zeithaml, V. A. (1988). Consumer perceptions of price, quality, and value: A means-end model and synthesis.
Journal of Marketing, 52(3), 2-22.
Michael S. Mulvey is Assistant Professor of Marketing at the Telfer School of Management, University of
Ottawa. Previously, he held research and teaching positions at Rutgers, The State University of New Jersey
(1996-2002) and Penn State University (1993-1996). He has also served as a visiting professor at Rutgers
Business School (2005-06) and the Bucharest School of Management (2006-2010). At Rutgers, Dr. Mulvey
was named GE Teaching Fellow in 2000 for his innovative use of technology in the classroom and he was a
three-time finalist for the Paul Nadler Award for Teaching Excellence and a finalist for the Thomas H. Mott
Teaching Excellence Award. He can be reached at [email protected]; [email protected]
Charles E. Gengler is Professor of Marketing at the Zicklin School of Business, Baruch College, City
University of New York. (Ph.D., University of Texas - Dallas) He is Chairman and Professor of Marketing. His
research and teaching interests center on positioning strategies, advertising campaign strategies,
motivation research, interviewing strategies and associated analysis, charitable giving, and sales training
development. He can be reached at and [email protected]
The authors contributed equally.
Understanding Innovation - Values Fit from theConsumer Perspective: A New Mixed-Model Approach
ISSN: 0971-1023 | NMIMS Management ReviewDouble Issue: Volume XXIII October-November 2013 University Day Special Issue January 2014
46