Embed Size (px)
Citation preview
Understanding Inferential Statistics—Estimation
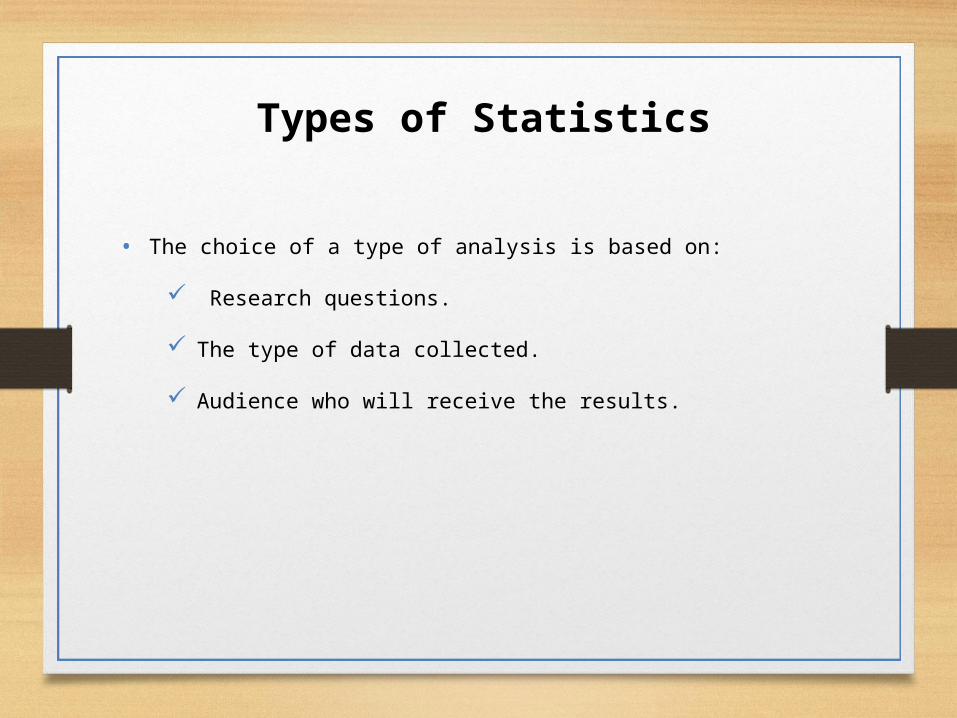
Types of Statistics
• The choice of a type of analysis is based on:
Research questions.
The type of data collected.
Audience who will receive the results.
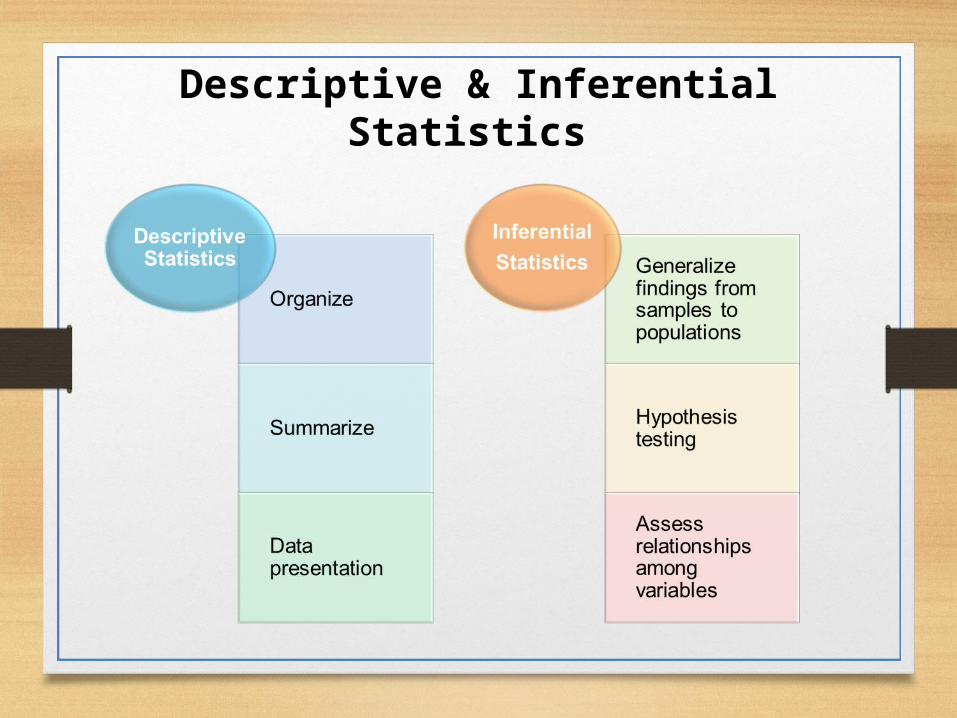
Descriptive & Inferential Statistics
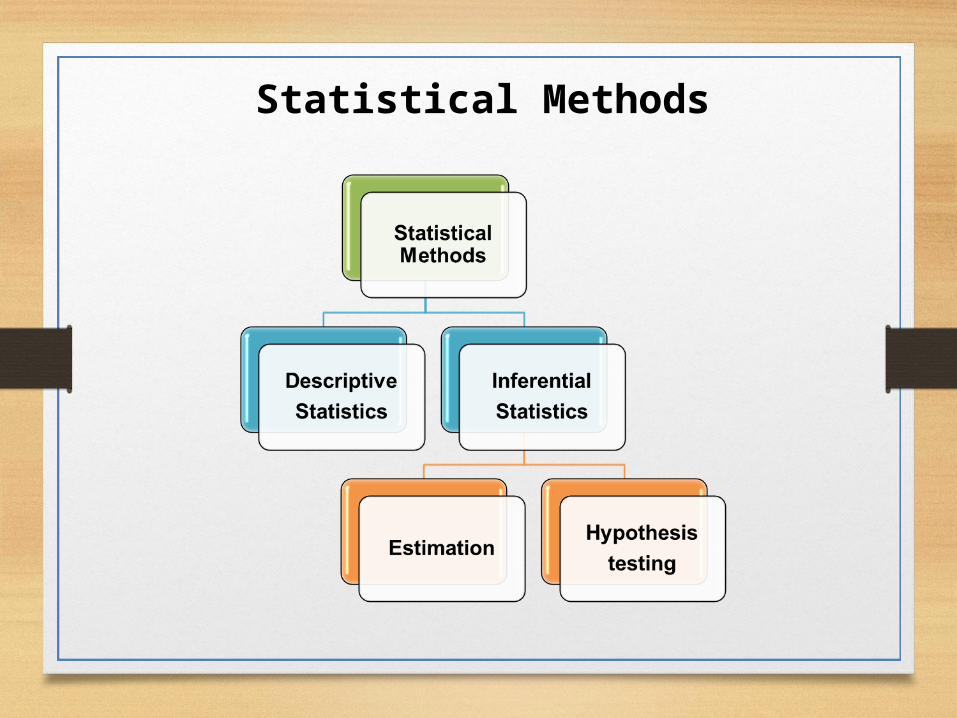
Statistical Methods
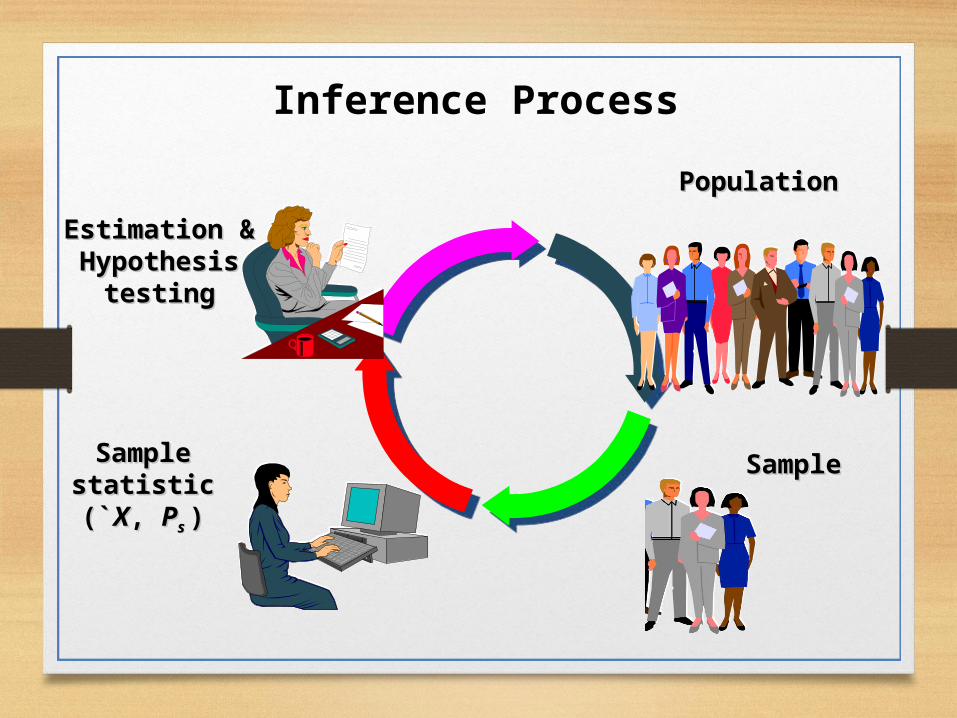
Inference Process
PopulationPopulation
SampleSampleSample Sample statistic (`statistic (`XX, , PPs s
))
Estimation & Estimation & Hypothesis Hypothesis
testingtesting
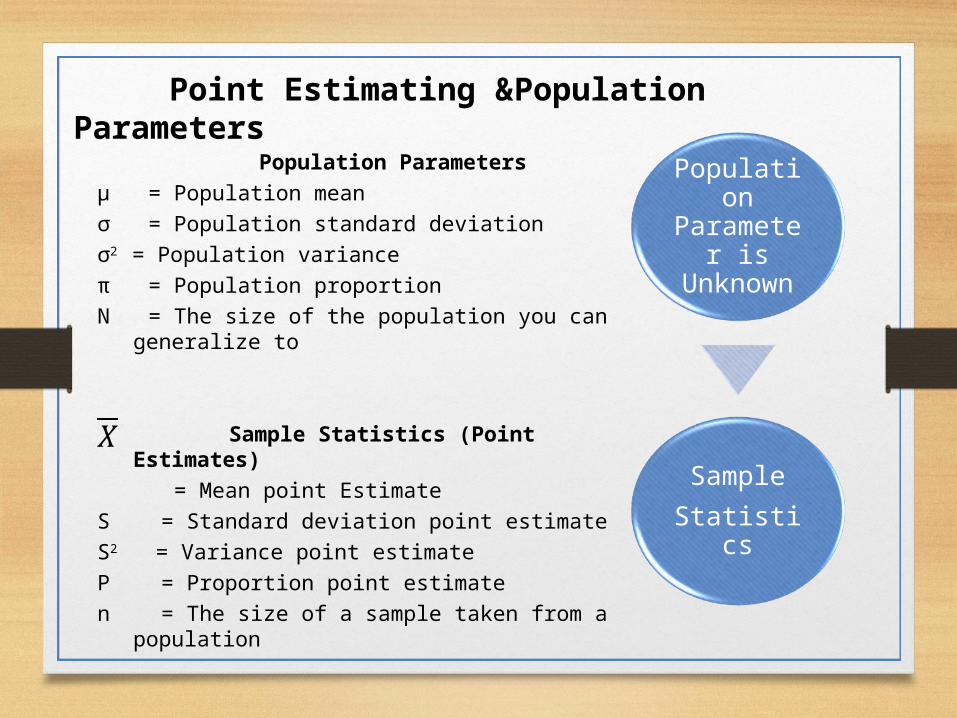
Point Estimating &Population Parameters
Population Parameters
µ = Population mean
σ = Population standard deviation
σ2 = Population variance
π = Population proportion
N = The size of the population you can generalize to
Sample Statistics (Point Estimates)
= Mean point Estimate
S = Standard deviation point estimate
S2 = Variance point estimate
P = Proportion point estimate
n = The size of a sample taken from a population
Population Parameter
is Unknown
Sample
Statistics
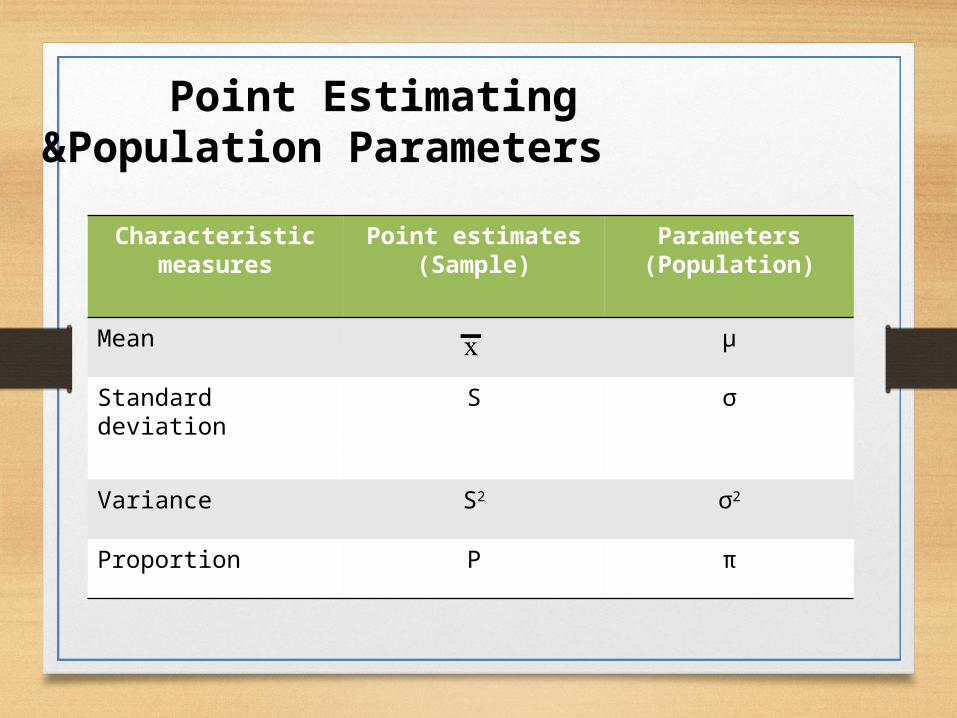
Point Estimating &Population Parameters
Characteristic measures
Point estimates(Sample)
Parameters(Population)
Mean µ
Standard deviation S σ
Variance S2 σ2
Proportion P π
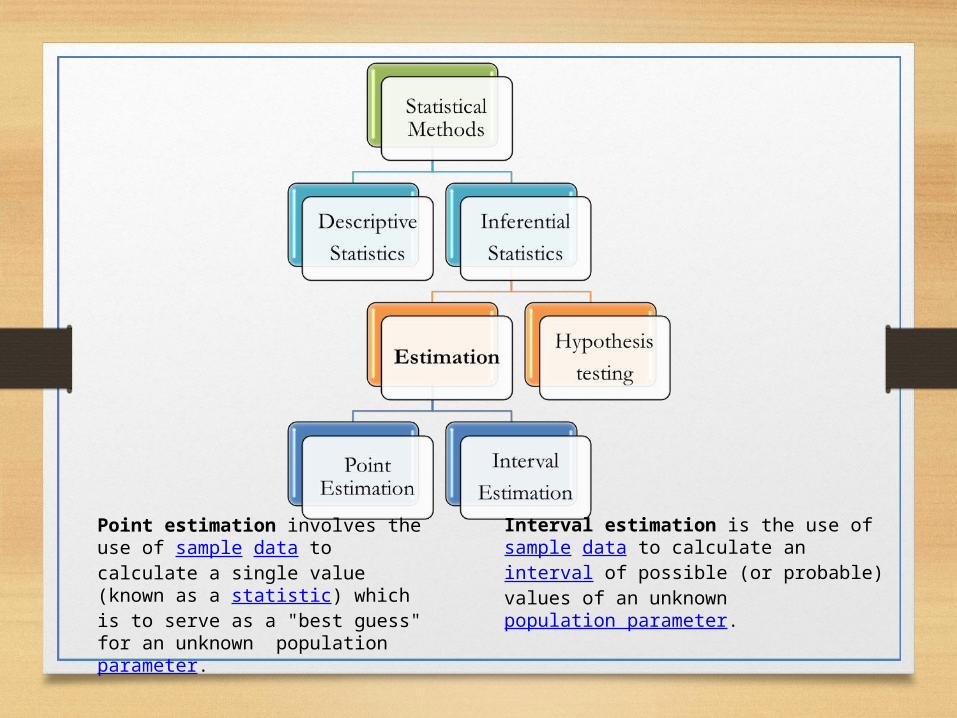
Point estimation involves the use of sample data to calculate a single value (known as a statistic) which is to serve as a "best guess" for an unknown population parameter.
Interval estimation is the use of sample data to calculate an interval of possible (or probable) values of an unknown population parameter.
Example 1:
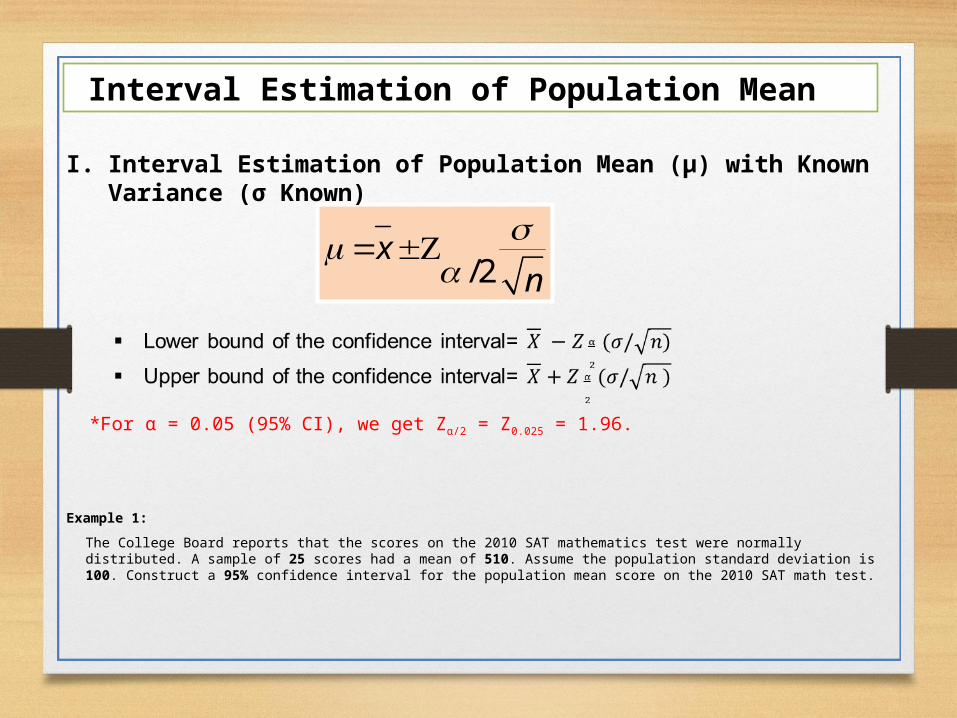
The College Board reports that the scores on the 2010 SAT mathematics test were normally distributed. A sample of 25 scores had a mean of 510. Assume the population standard deviation is 100. Construct a 95% confidence interval for the population mean score on the 2010 SAT math test.
Interval Estimation of Population Mean
/2x
n
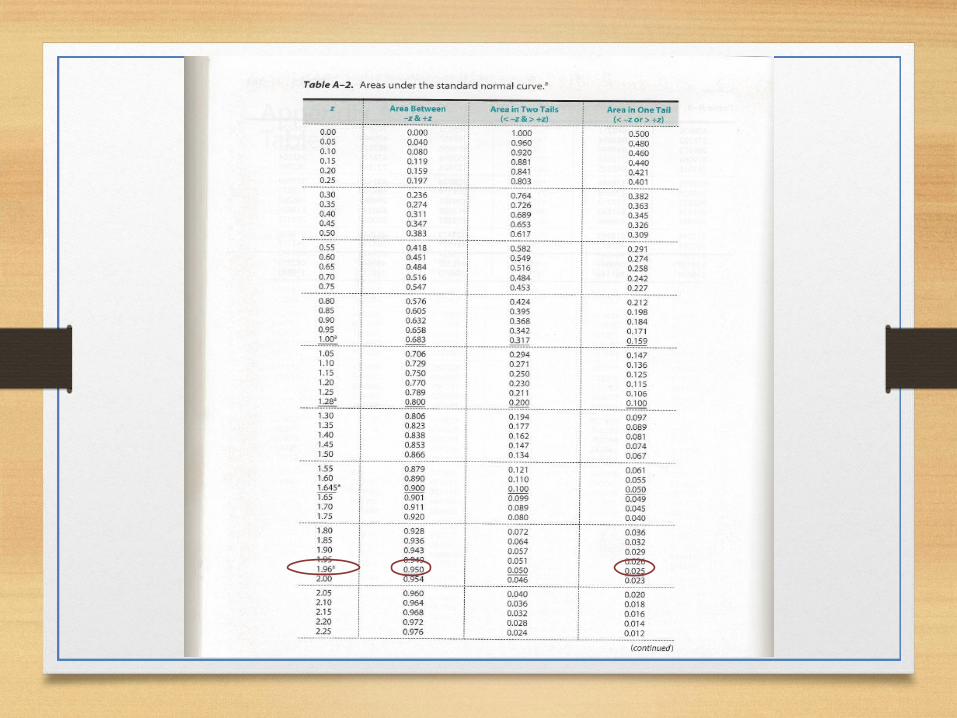
*For α = 0.05 (95% CI), we get Zα/2 = Z0.025 = 1.96.
I. Interval Estimation of Population Mean (µ) with Known Variance (σ Known)
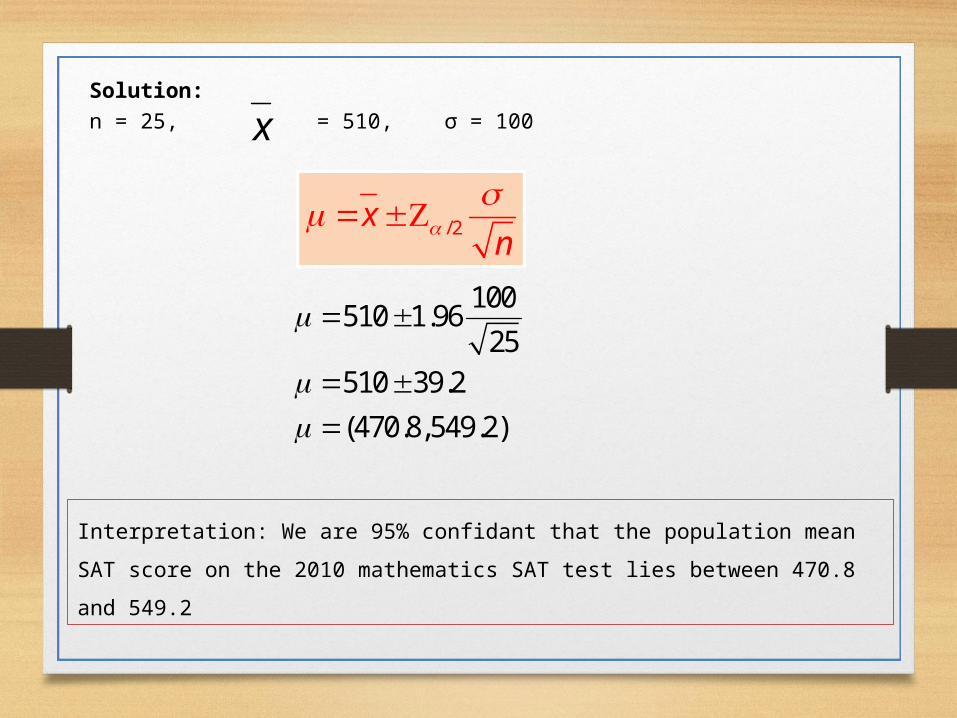
Solution:
n = 25, = 510, σ = 100
x
Interpretation: We are 95% confidant that the population mean SAT score on the
2010 mathematics SAT test lies between 470.8 and 549.2
100510 1.96
25510 39.2
(470.8,549.2)
/2xn
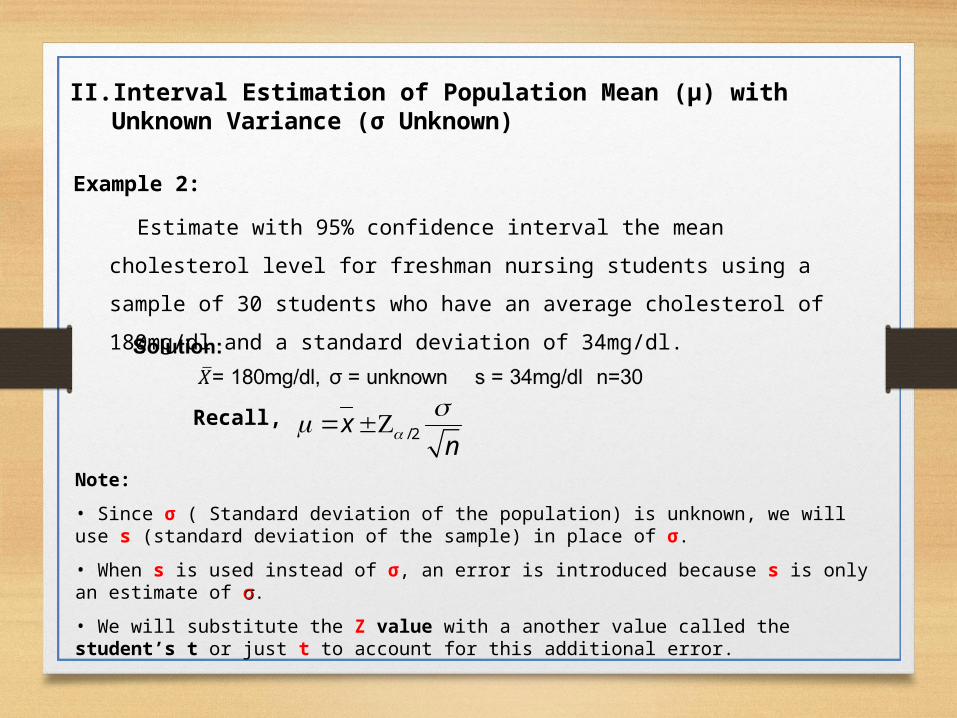
Example 2:
Estimate with 95% confidence interval the mean cholesterol level for freshman
nursing students using a sample of 30 students who have an average
cholesterol of 180mg/dl and a standard deviation of 34mg/dl.
II. Interval Estimation of Population Mean (µ) with Unknown Variance (σ Unknown)
Recall, /2xn
Note:
• Since σ ( Standard deviation of the population) is unknown, we will use s (standard deviation of the sample) in place of σ.
• When s is used instead of σ, an error is introduced because s is only an estimate of σσ.
• We will substitute the Z value with a another value called the student’s t or just t to account for this additional error.
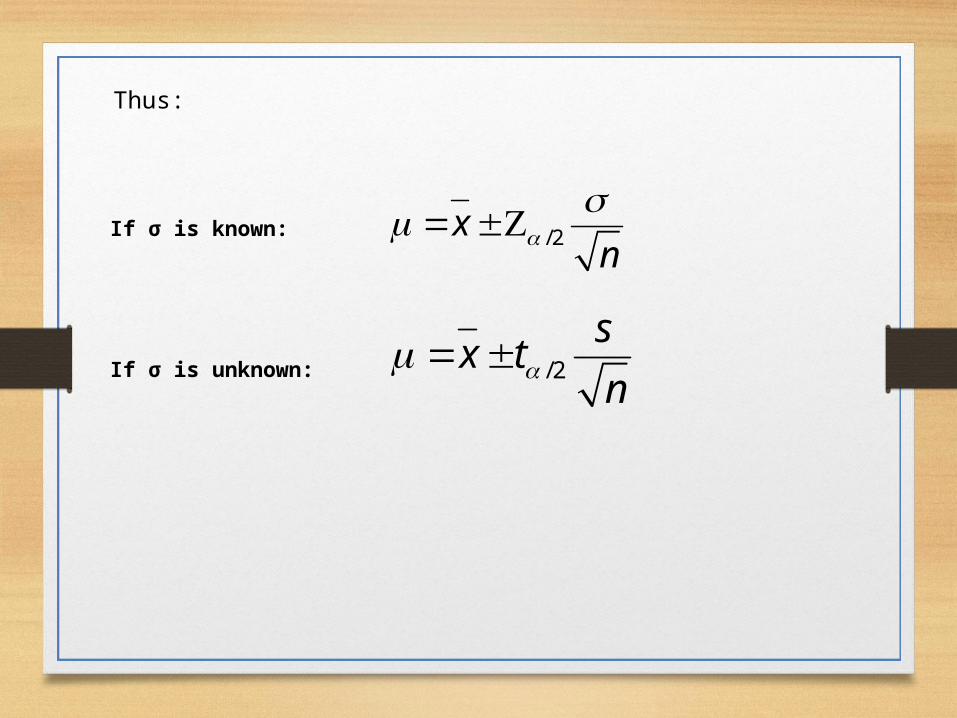
If σ is known:
If σ is unknown:
Thus:
/2xn
/2
sx t
n
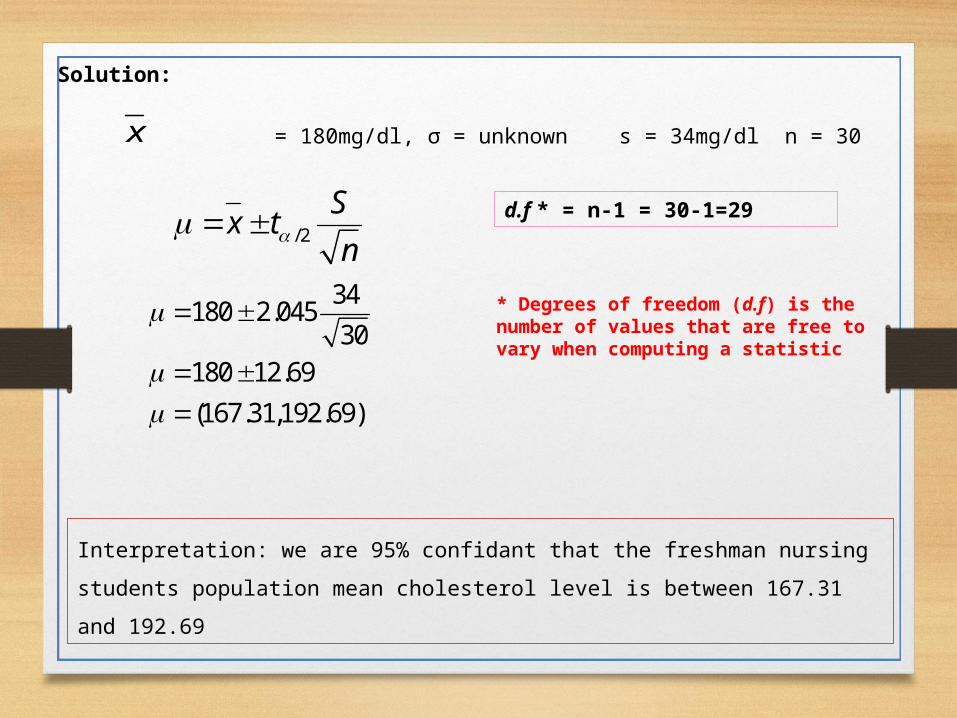
Solution:
= 180mg/dl, σ = unknown s = 34mg/dl n = 30
x
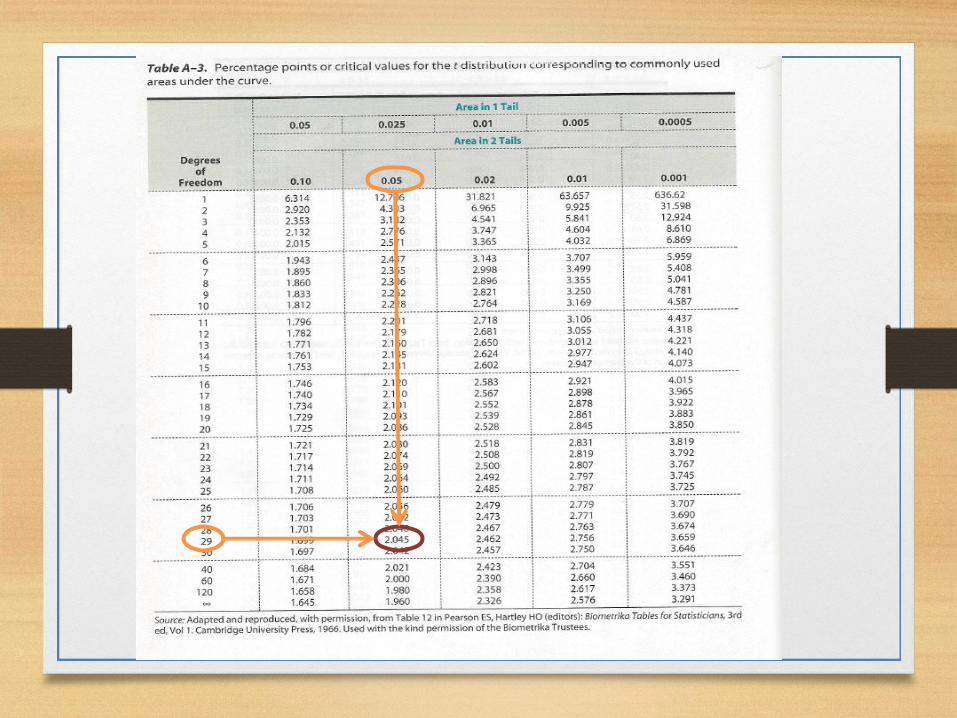
d.f * = n-1 = 30-1=29
* Degrees of freedom (d.f) is the number of values that are free to vary when computing a statistic
34180 2.045
30180 12.69
(167.31,192.69)
/2
Sx t
n
Interpretation: we are 95% confidant that the freshman nursing students population
mean cholesterol level is between 167.31 and 192.69
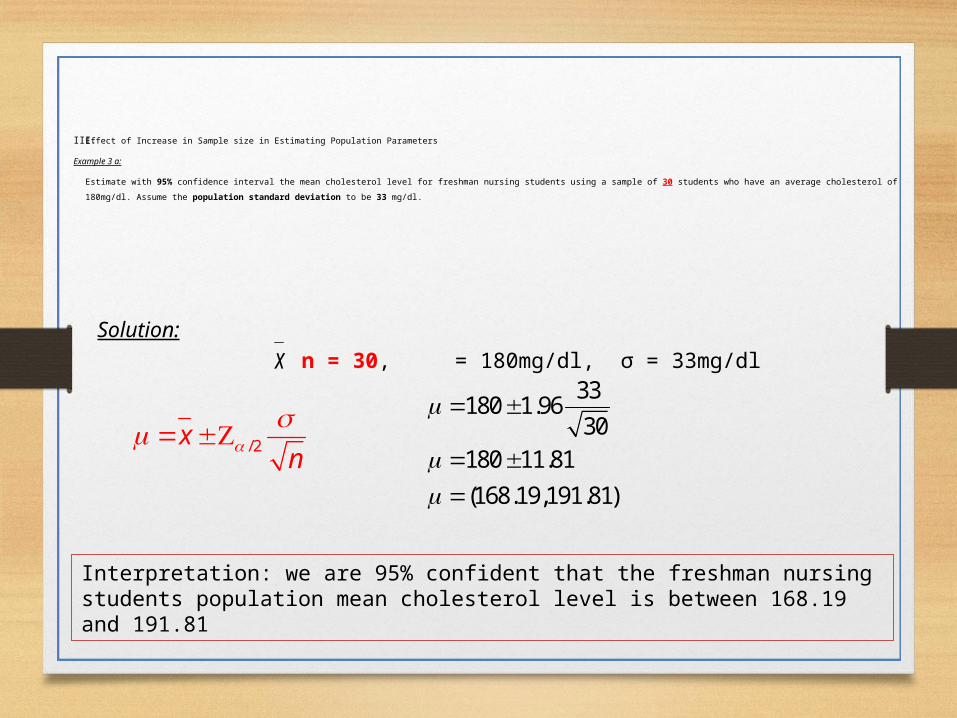
III.Effect of Increase in Sample size in Estimating Population Parameters
Example 3 a:
Estimate with 95% confidence interval the mean cholesterol level for freshman nursing students using a sample of 30 students who have an average cholesterol of 180mg/dl. Assume the population standard
deviation to be 33 mg/dl.
Solution:
n = 30, = 180mg/dl, σ = 33mg/dl
x
/2xn
33180 1.96
30180 11.81
(168.19,191.81)
Interpretation: we are 95% confident that the freshman nursing students population mean cholesterol level is between 168.19 and 191.81
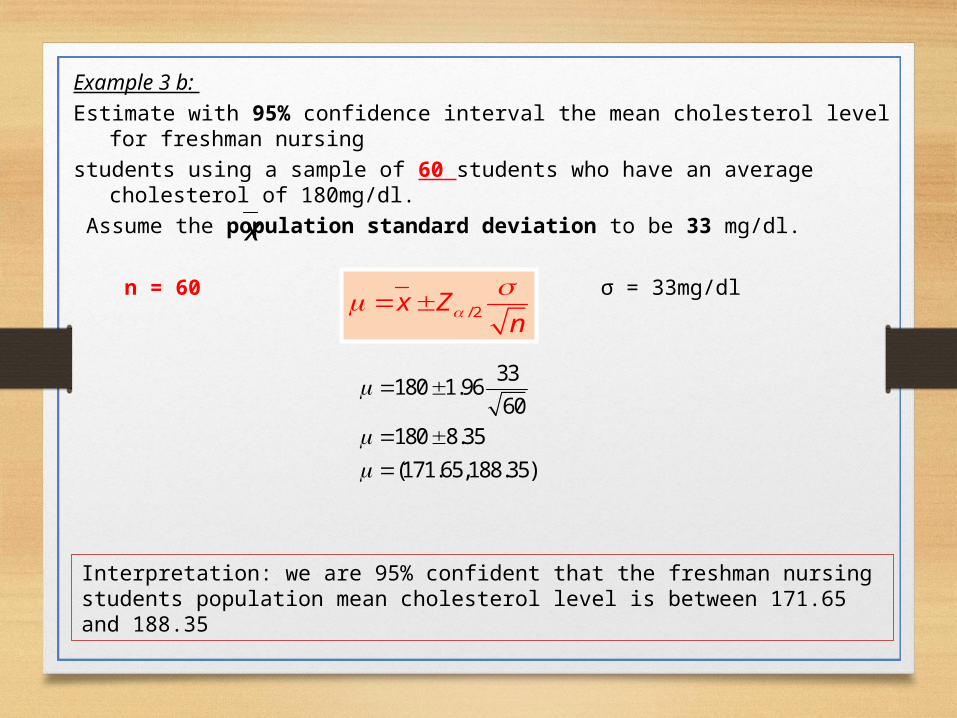
Example 3 b:
Estimate with 95% confidence interval the mean cholesterol level for freshman nursing
students using a sample of 60 students who have an average cholesterol of 180mg/dl.
Assume the population standard deviation to be 33 mg/dl.
n = 60 = 180mg/dl σ = 33mg/dl
x
Interpretation: we are 95% confident that the freshman nursing students population mean cholesterol level is between 171.65 and 188.35
33180 1.96
60180 8.35
(171.65,188.35)
/2x Zn
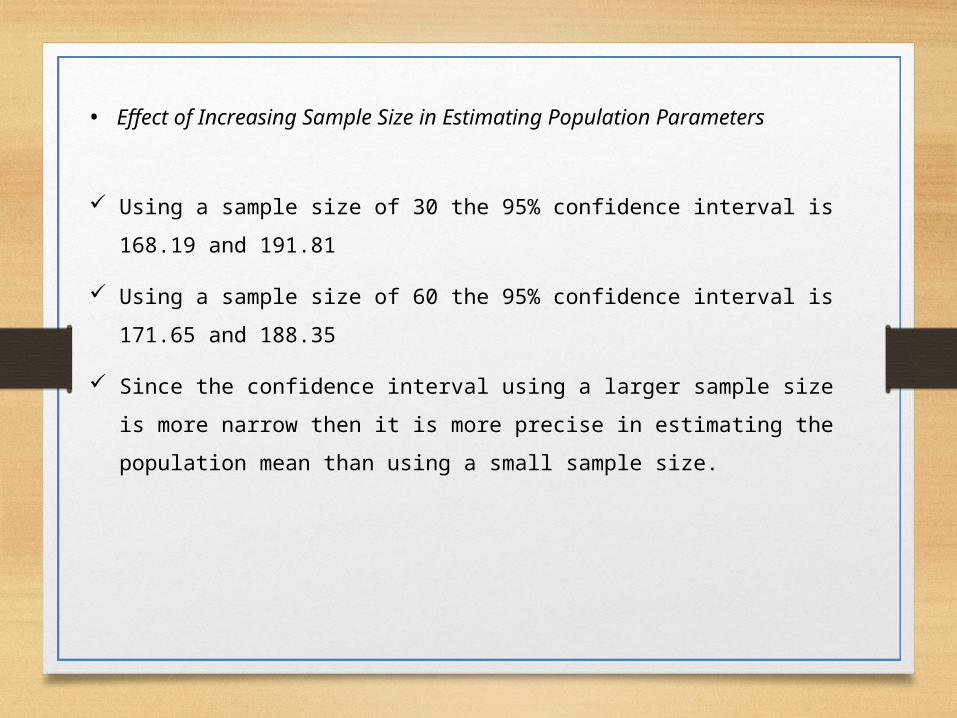
• Effect of Increasing Sample Size in Estimating Population Parameters
Using a sample size of 30 the 95% confidence interval is 168.19 and 191.81
Using a sample size of 60 the 95% confidence interval is 171.65 and 188.35
Since the confidence interval using a larger sample size is more narrow then
it is more precise in estimating the population mean than using a small
sample size.
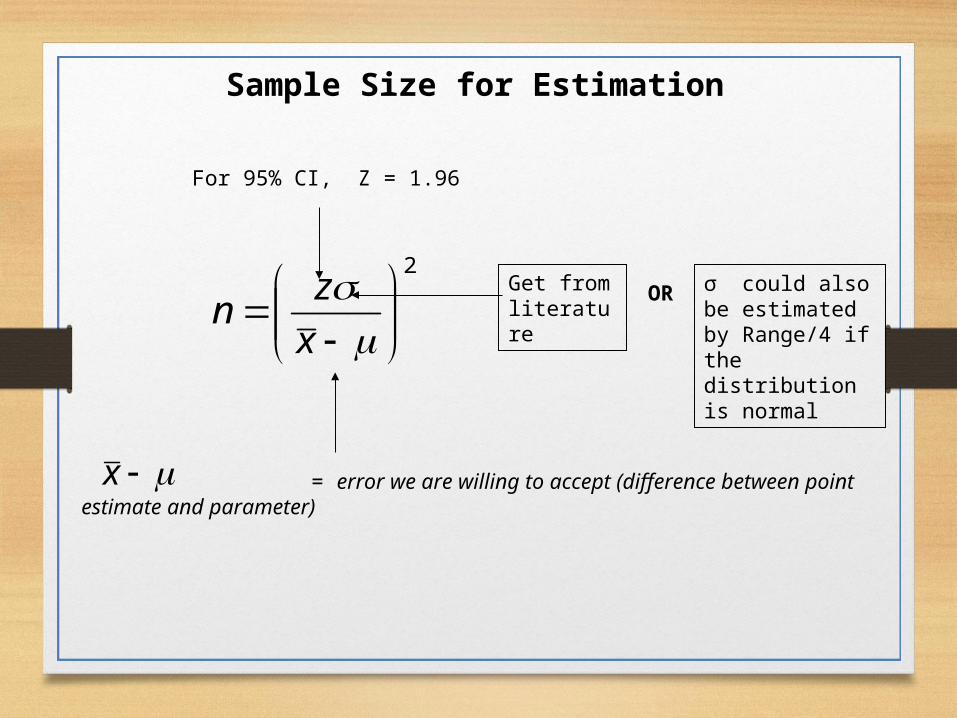
2
x
zn
For 95% CI, Z = 1.96
Sample Size for Estimation
Get from literature
σ could also be estimated by Range/4 if the distribution is normal
OR
= error we are willing to accept (difference between point estimate and parameter)
x
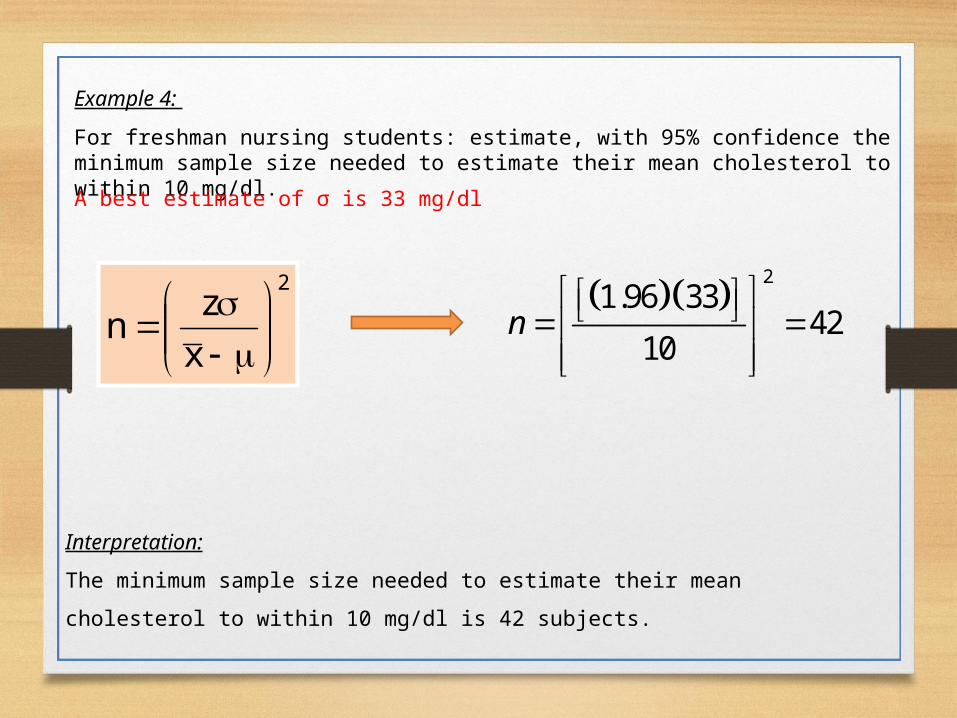
Example 4:
For freshman nursing students: estimate, with 95% confidence the minimum sample size needed to estimate their mean cholesterol to within 10 mg/dl.
A best estimate of σ is 33 mg/dl
2
x
zn
2
1.96 3342
10n
Interpretation:
The minimum sample size needed to estimate their mean cholesterol to within 10
mg/dl is 42 subjects.
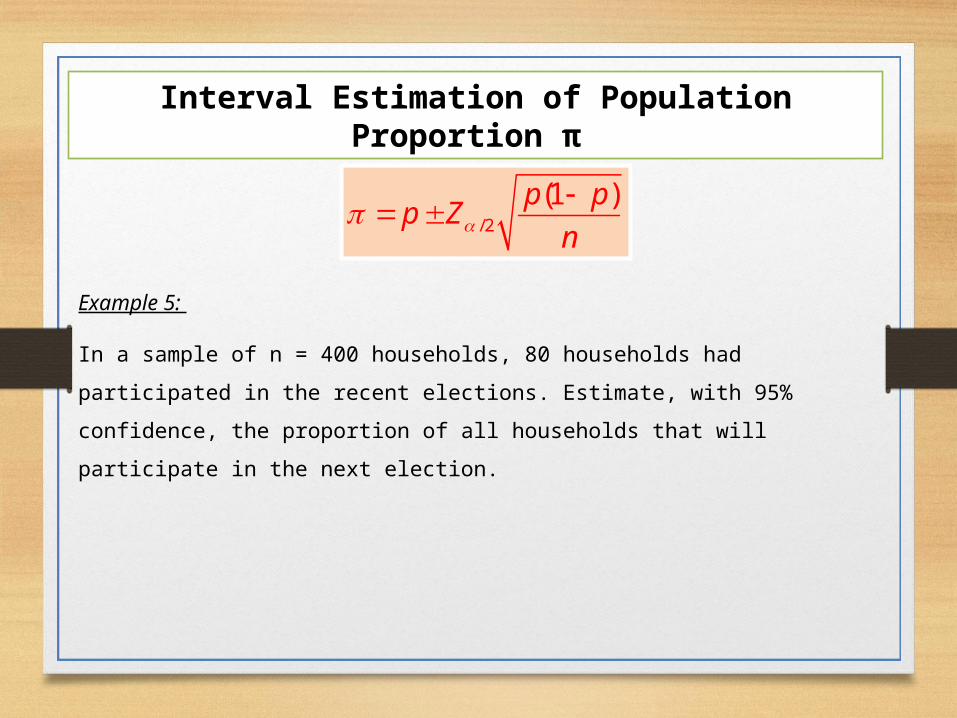
Interval Estimation of Population Proportion π
/2
(1 )p pp Z
n
Example 5:
In a sample of n = 400 households, 80 households had participated in the recent
elections. Estimate, with 95% confidence, the proportion of all households that will
participate in the next election.
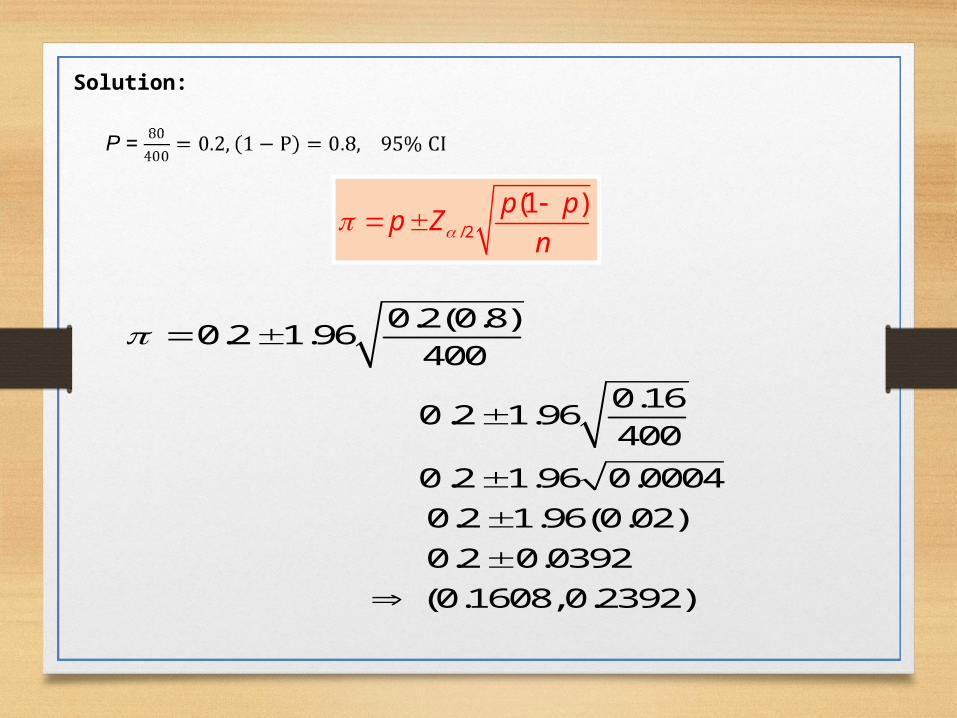
0.2(0.8)0.2 1.96
400
0.160.2 1.96
400
0.2 1.96 0.0004
0.2 1.96(0.02)
0.2 0.0392
(0.1608,0.2392)
/2
(1 )p pp Z
n
Solution:
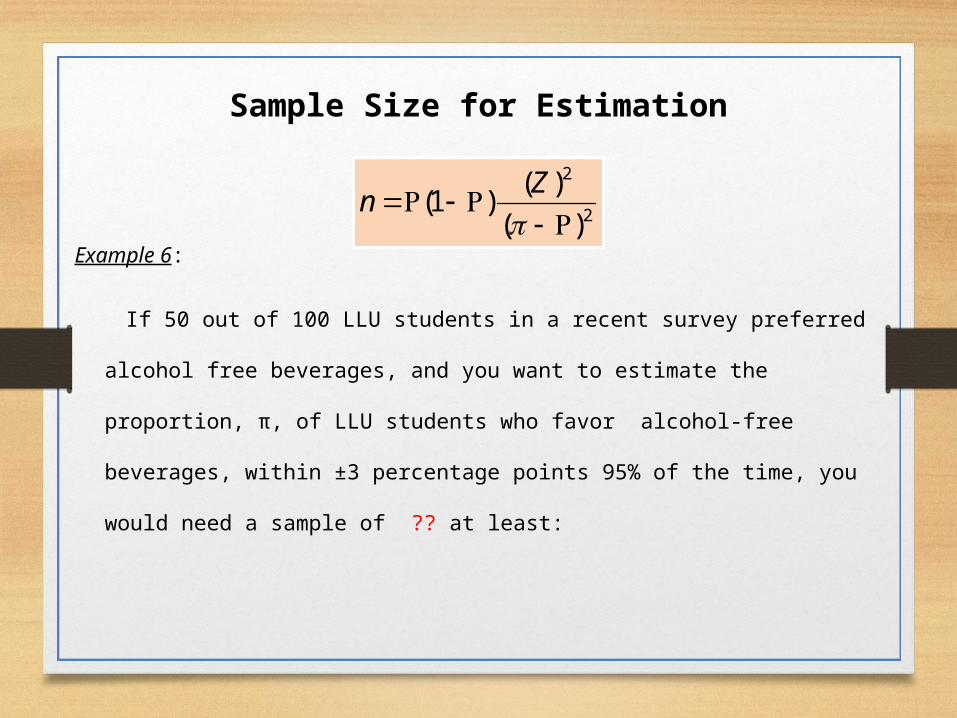
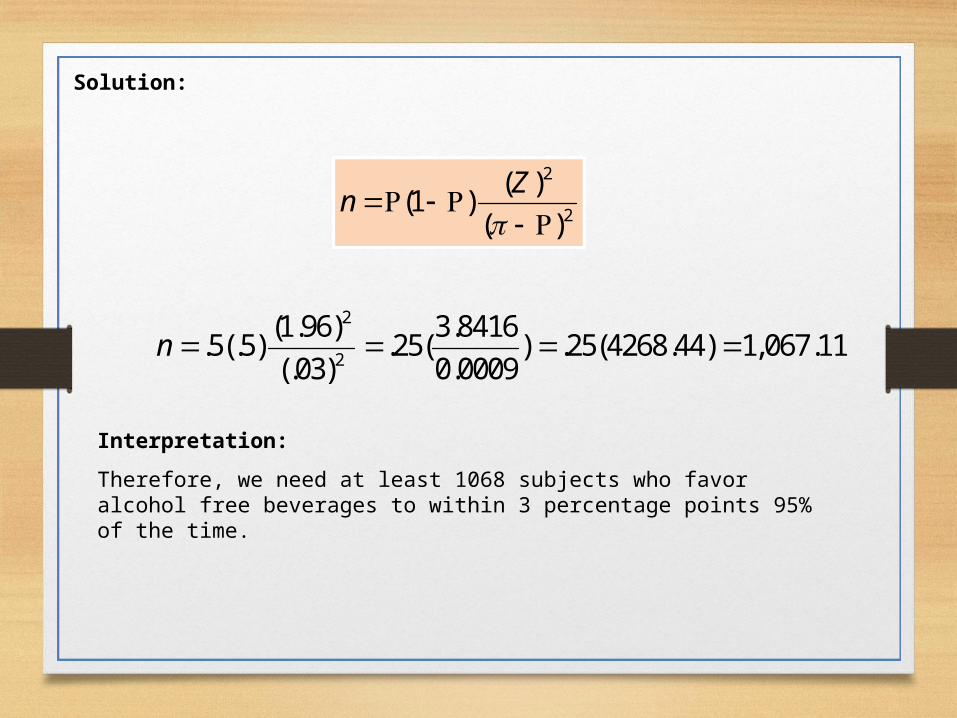
Example 6:
If 50 out of 100 LLU students in a recent survey preferred alcohol free beverages,
and you want to estimate the proportion, π, of LLU students who favor alcohol-
free beverages, within ±3 percentage points 95% of the time, you would need a
sample of ?? at least:
Sample Size for Estimation
2
2
( )(1 )
( )
Zn
Interpretation:
Therefore, we need at least 1068 subjects who favor alcohol free beverages to within 3 percentage points 95% of the time.
2
2
( )(1 )
( )
Zn
2
2
(1.96) 3.8416.5(.5) .25( ) .25(4268.44) 1,067.11
(.03) 0.0009n
Solution: