Embed Size (px)
Citation preview
5/11/2018 Understanding Histogram Ppt - slidepdf.com
http://slidepdf.com/reader/full/understanding-histogram-ppt-55a35c0ba99b8 1/28
Understanding Histograms in the
Oracle Database
Robert GaydosR Wave [email protected]
Copyright © R WaveSolutions 2008 All rightsreserved
5/11/2018 Understanding Histogram Ppt - slidepdf.com
http://slidepdf.com/reader/full/understanding-histogram-ppt-55a35c0ba99b8 2/28
Addenda
What is a Histogram?
Types of Histograms
How to create Histograms How to identify existing Histograms
Rules and tips when creating Histograms
Q & A
Copyright © R Wave Solutions 2008 All rights reserved
5/11/2018 Understanding Histogram Ppt - slidepdf.com
http://slidepdf.com/reader/full/understanding-histogram-ppt-55a35c0ba99b8 3/28
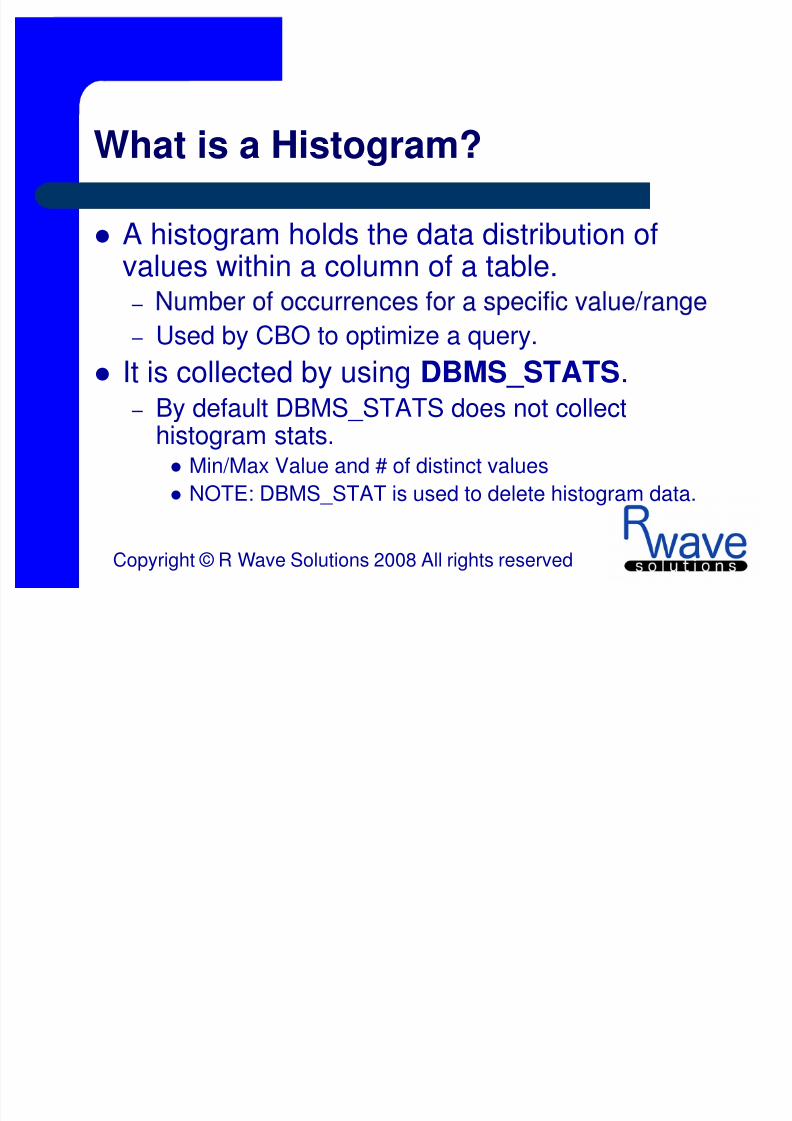
What is a Histogram?
A histogram holds the data distribution ofvalues within a column of a table.
–
– Used by CBO to optimize a query.
It is collected by using DBMS_STATS. – By default DBMS_STATS does not collect
histogram stats. Min/Max Value and # of distinct values
NOTE: DBMS_STAT is used to delete histogram data.
Copyright © R Wave Solutions 2008 All rights reserved
5/11/2018 Understanding Histogram Ppt - slidepdf.com
http://slidepdf.com/reader/full/understanding-histogram-ppt-55a35c0ba99b8 4/28
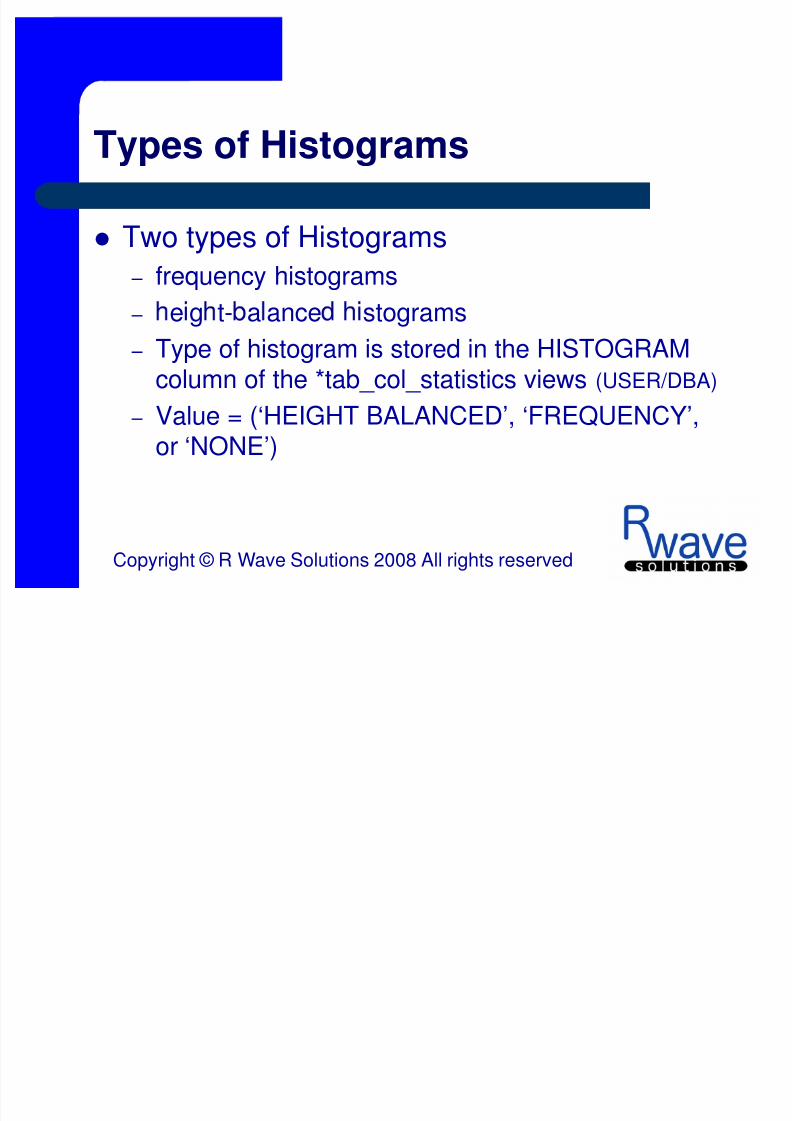
Types of Histograms
Two types of Histograms
– frequency histograms
– e g t- a ance stograms – Type of histogram is stored in the HISTOGRAM
column of the *tab_col_statistics views (USER/DBA)
– Value = (‘HEIGHT BALANCED’, ‘FREQUENCY’,or ‘NONE’)
Copyright © R Wave Solutions 2008 All rights reserved
5/11/2018 Understanding Histogram Ppt - slidepdf.com
http://slidepdf.com/reader/full/understanding-histogram-ppt-55a35c0ba99b8 5/28
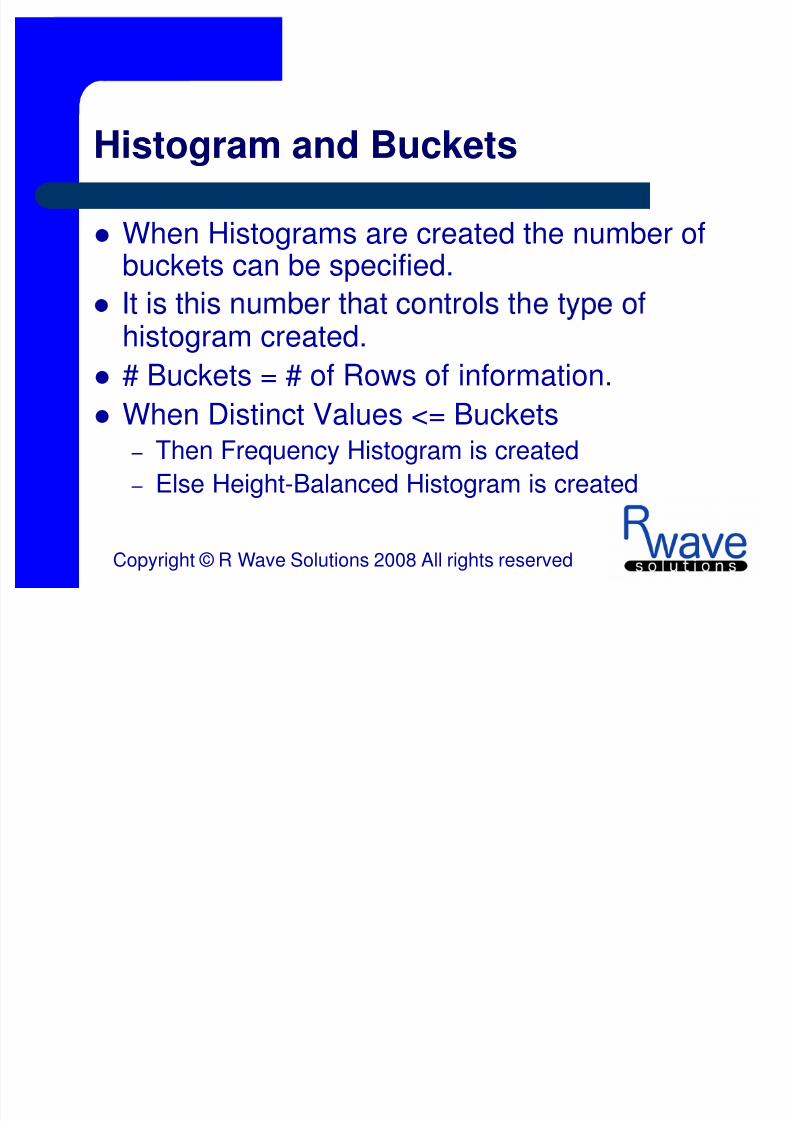
Histogram and Buckets
When Histograms are created the number ofbuckets can be specified.
histogram created.
# Buckets = # of Rows of information.
When Distinct Values <= Buckets – Then Frequency Histogram is created
– Else Height-Balanced Histogram is created
Copyright © R Wave Solutions 2008 All rights reserved
5/11/2018 Understanding Histogram Ppt - slidepdf.com
http://slidepdf.com/reader/full/understanding-histogram-ppt-55a35c0ba99b8 6/28
Frequency Histograms
Each value of the column corresponds to asingle bucket of the histogram.
Each bucket contains the number ofoccurrences of that single value.
Copyright © R Wave Solutions 2008 All rights reserved
5/11/2018 Understanding Histogram Ppt - slidepdf.com
http://slidepdf.com/reader/full/understanding-histogram-ppt-55a35c0ba99b8 7/28
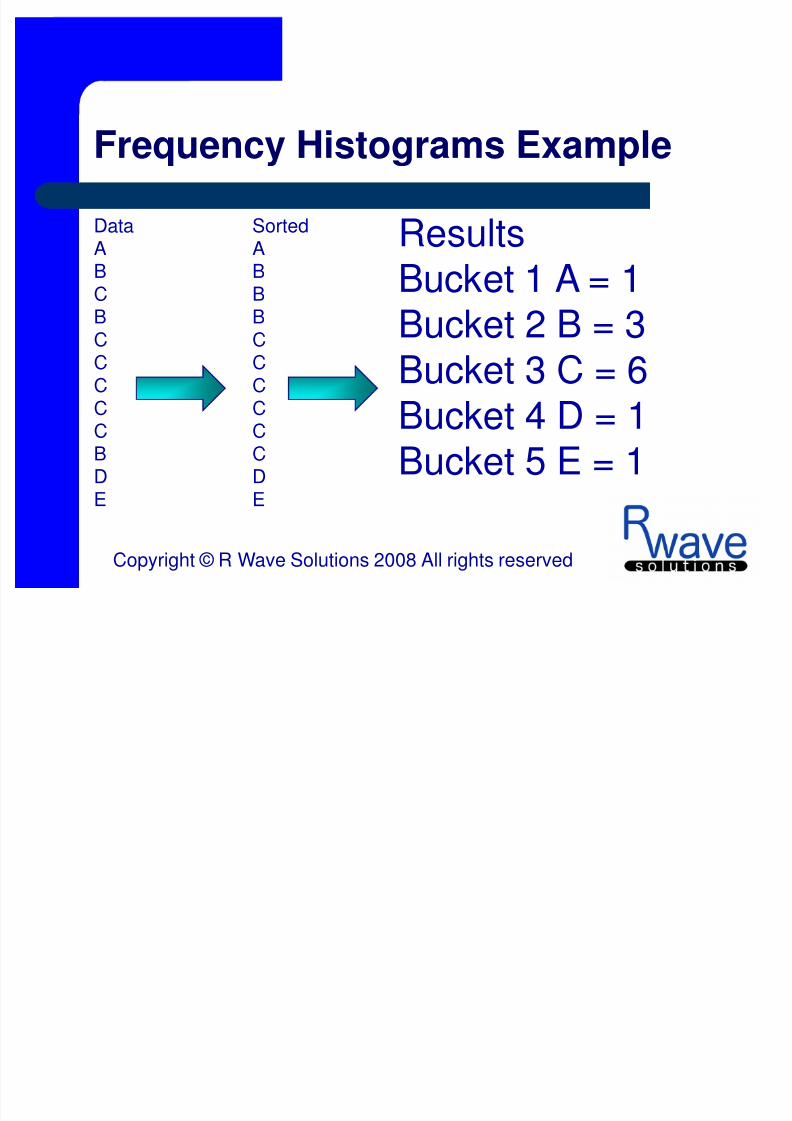
Frequency Histograms Example
DataABC
SortedABB
ResultsBucket 1 A = 1
BCCCC
CBDE
BCCCC
CCDE
Bucket 2 B = 3Bucket 3 C = 6
Bucket 4 D = 1Bucket 5 E = 1
Copyright © R Wave Solutions 2008 All rights reserved
5/11/2018 Understanding Histogram Ppt - slidepdf.com
http://slidepdf.com/reader/full/understanding-histogram-ppt-55a35c0ba99b8 8/28
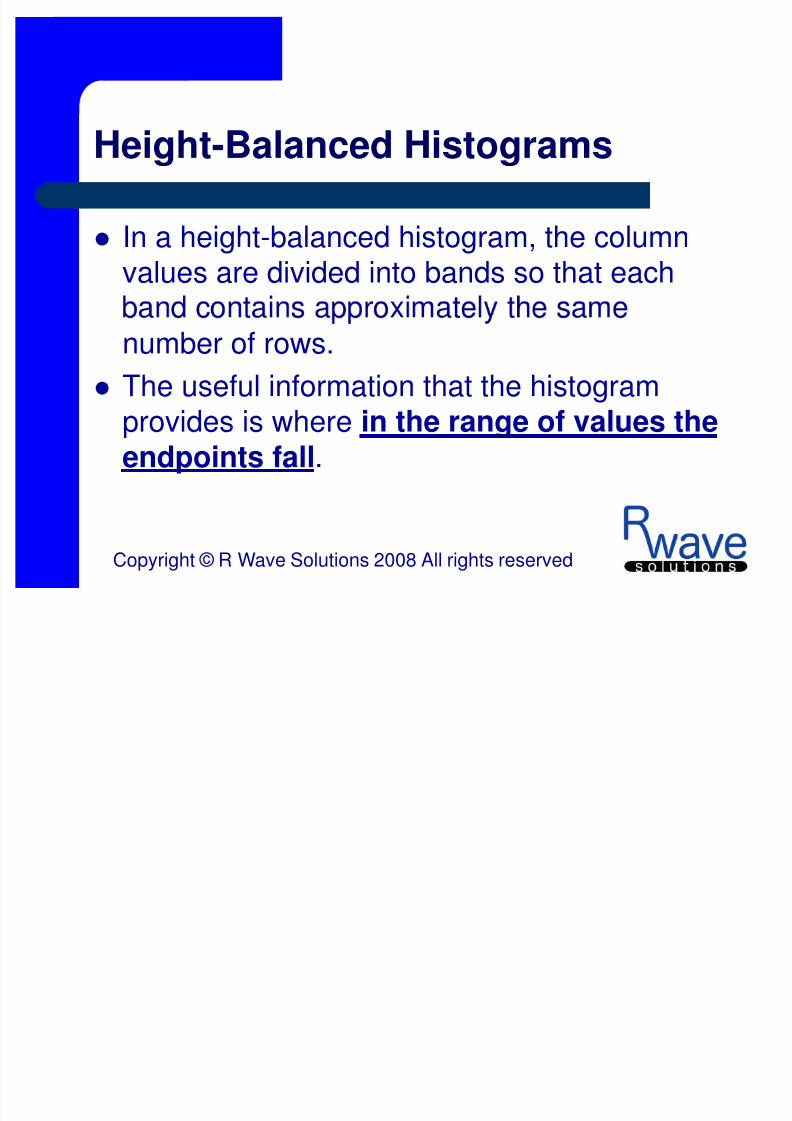
Height-Balanced Histograms
In a height-balanced histogram, the columnvalues are divided into bands so that each
number of rows.
The useful information that the histogram
provides is where in the range of values theendpoints fall.
Copyright © R Wave Solutions 2008 All rights reserved
5/11/2018 Understanding Histogram Ppt - slidepdf.com
http://slidepdf.com/reader/full/understanding-histogram-ppt-55a35c0ba99b8 9/28
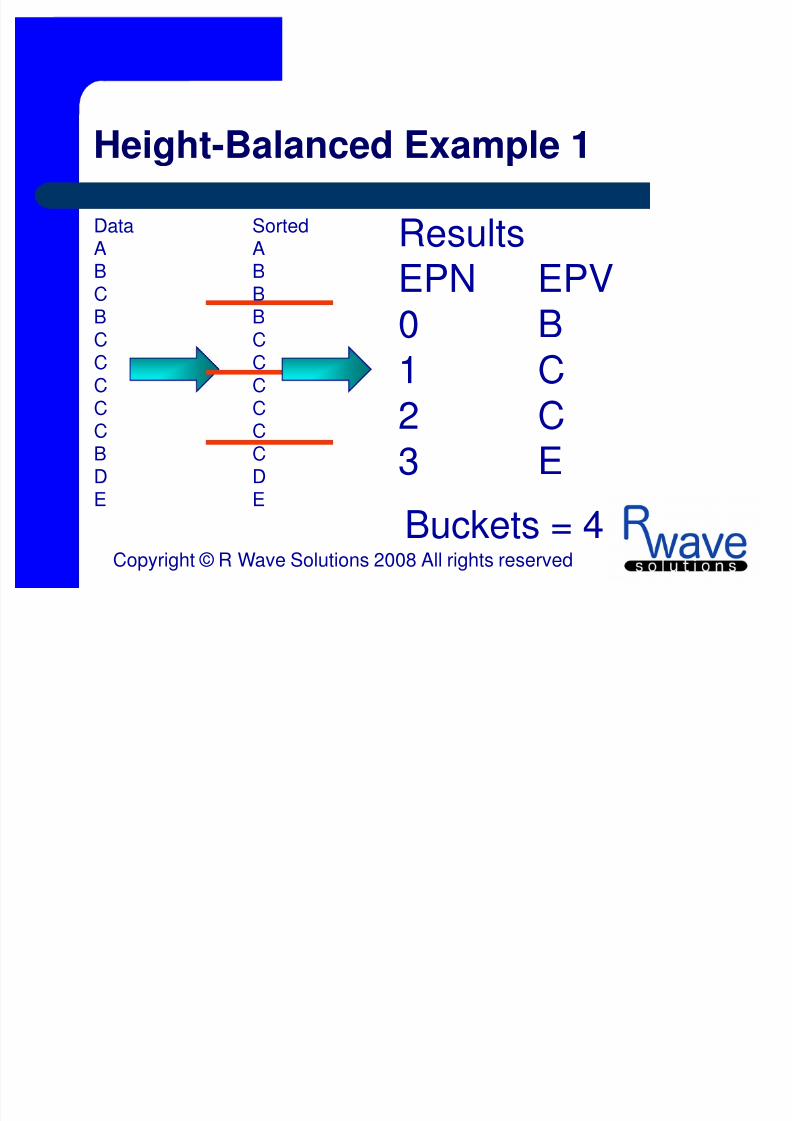
Height-Balanced Example 1
DataABC
SortedABB
ResultsEPN EPV
BCCCC
CBDE
BCCCC
CCDE
Buckets = 4
01
23
BC
CE
Copyright © R Wave Solutions 2008 All rights reserved
5/11/2018 Understanding Histogram Ppt - slidepdf.com
http://slidepdf.com/reader/full/understanding-histogram-ppt-55a35c0ba99b8 10/28
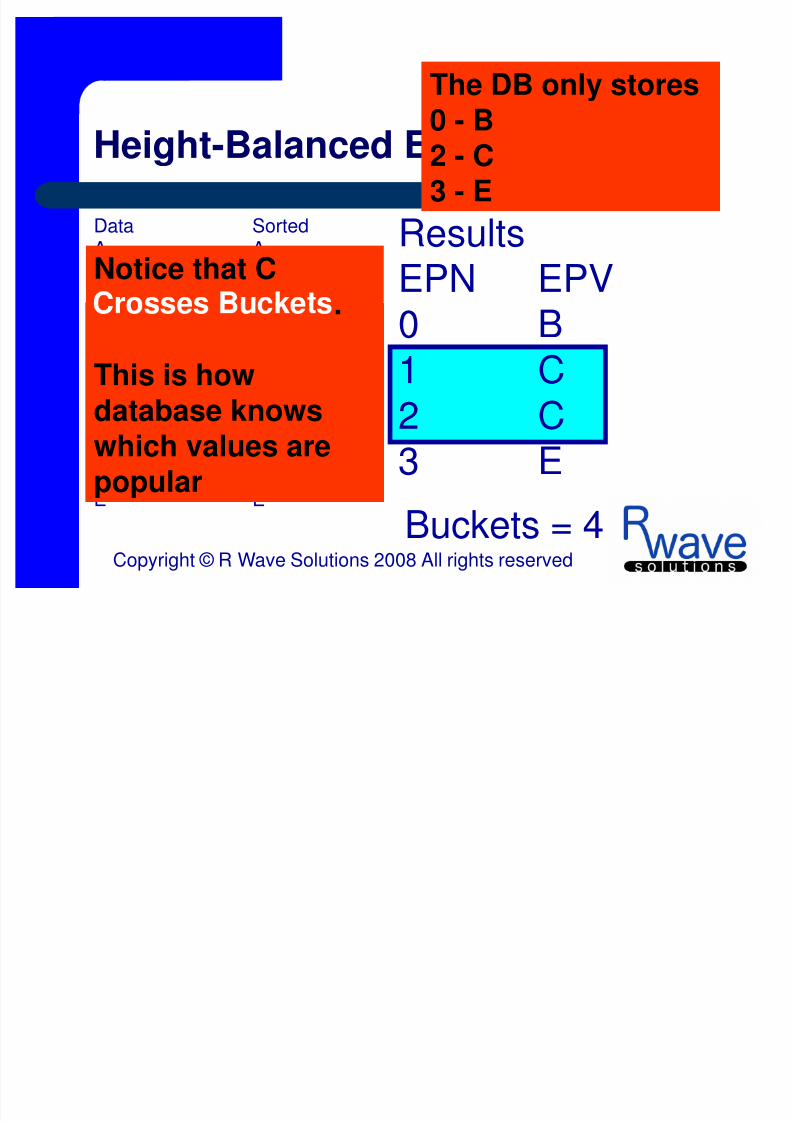
Height-Balanced Example 1
DataABC
SortedABB
ResultsEPN EPVNotice that C
The DB only stores
0 - B2 - C3 - E
BCCCC
CBDE
BCCCC
CCDE
01
23
Buckets = 4
BC
CE
.
This is howdatabase knowswhich values arepopular
Copyright © R Wave Solutions 2008 All rights reserved
5/11/2018 Understanding Histogram Ppt - slidepdf.com
http://slidepdf.com/reader/full/understanding-histogram-ppt-55a35c0ba99b8 11/28
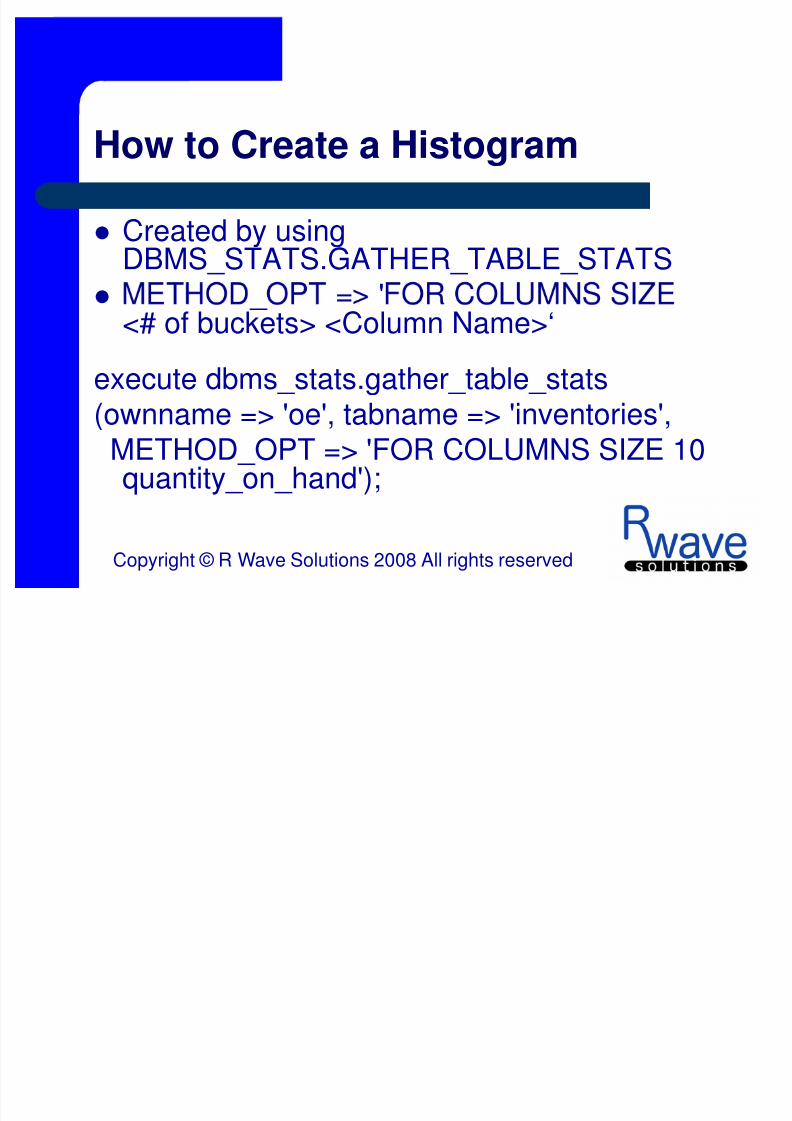
How to Create a Histogram
Created by usingDBMS_STATS.GATHER_TABLE_STATS
= ' _
<# of buckets> <Column Name>‘
execute dbms_stats.gather_table_stats
(ownname => 'oe', tabname => 'inventories',METHOD_OPT => 'FOR COLUMNS SIZE 10quantity_on_hand');
Copyright © R Wave Solutions 2008 All rights reserved

5/11/2018 Understanding Histogram Ppt - slidepdf.com
http://slidepdf.com/reader/full/understanding-histogram-ppt-55a35c0ba99b8 12/28
Identify Existing Histograms
In 10g – HISTOGRAM column of the *tab_col_statistics views
(USER/DBA)
In 9select owner, table_name, column_name, count(*)
buckets
from dba_histograms
where endpoint_number not in (0,1)
group by owner,
table_name, column_name
Copyright © R Wave Solutions 2008 All rights reserved
5/11/2018 Understanding Histogram Ppt - slidepdf.com
http://slidepdf.com/reader/full/understanding-histogram-ppt-55a35c0ba99b8 13/28
Rules On When To Create Histograms
First there are no rules of thumb that arealways correct.
When creating using dbms_stats, the use ofthe DEGREE (for parallel) can skew the
value of density
Running dbms_stats can drop histograms – Use method_opt==>'REPEAT‘
Copyright © R Wave Solutions 2008 All rights reserved
5/11/2018 Understanding Histogram Ppt - slidepdf.com
http://slidepdf.com/reader/full/understanding-histogram-ppt-55a35c0ba99b8 14/28
Rules On When To Create Histograms
Index maintenance overhead is performedduring update, insert and delete operations.
performed during the analyze/dbms_statsprocess.
Histograms are NOT just for indexedcolumns. – Adding a histogram to an un-indexed column that is used in
a where clause can improve performance.
Copyright © R Wave Solutions 2008 All rights reserved
5/11/2018 Understanding Histogram Ppt - slidepdf.com
http://slidepdf.com/reader/full/understanding-histogram-ppt-55a35c0ba99b8 15/28
Histogram Example
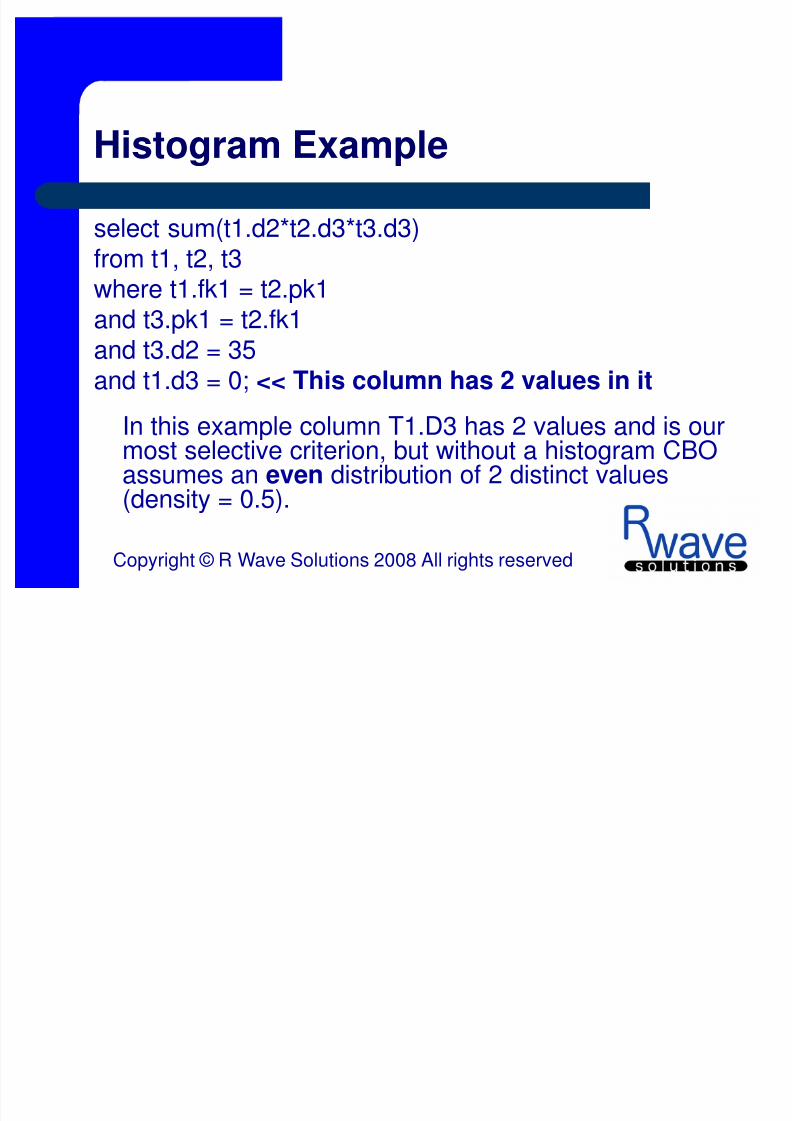
select sum(t1.d2*t2.d3*t3.d3)from t1, t2, t3where t1.fk1 = t2.pk1
and t3.pk1 = t2.fk1and t3.d2 = 35and t1.d3 = 0; << This column has 2 values in it
In this example column T1.D3 has 2 values and is ourmost selective criterion, but without a histogram CBOassumes an even distribution of 2 distinct values(density = 0.5).
Copyright © R Wave Solutions 2008 All rights reserved
5/11/2018 Understanding Histogram Ppt - slidepdf.com
http://slidepdf.com/reader/full/understanding-histogram-ppt-55a35c0ba99b8 16/28
SQL*Plan Without Histogram
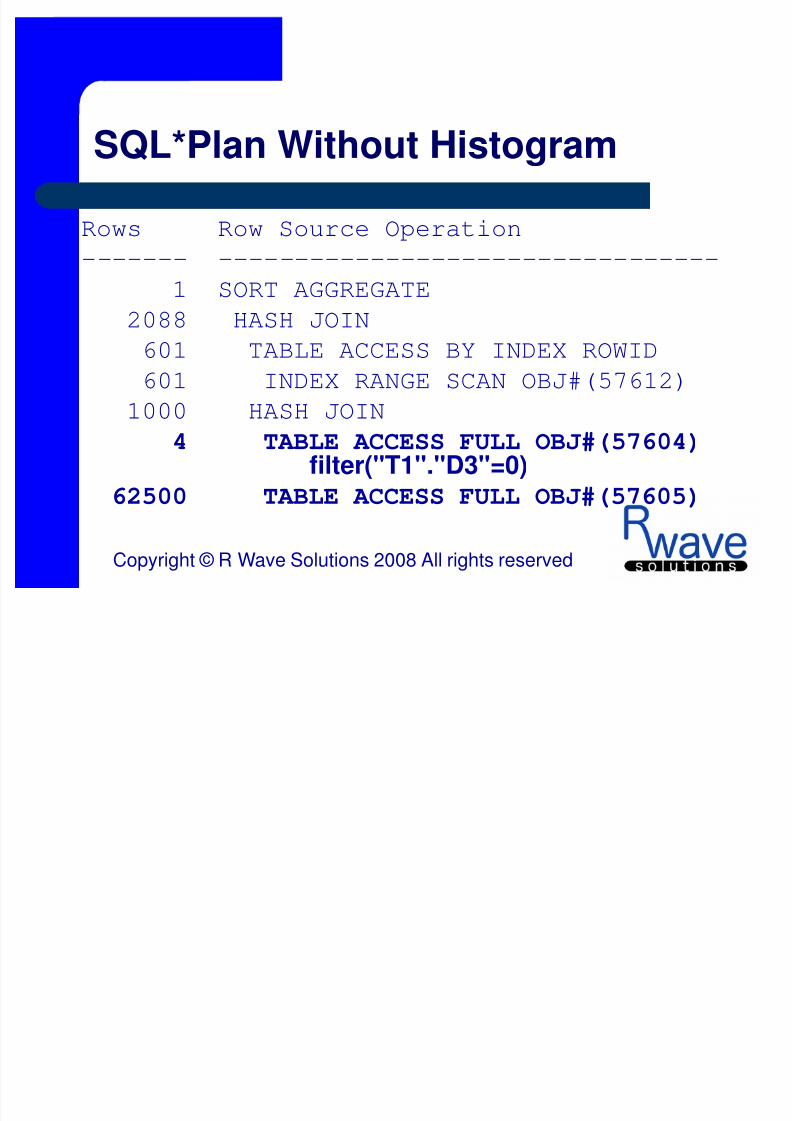
Rows Row Source Operation
------- ---------------------------------
1 SORT AGGREGATE
2088 HASH JOIN601 TABLE ACCESS BY INDEX ROWID
601 INDEX RANGE SCAN OBJ#(57612)
1000 HASH JOIN
4 TABLE ACCESS FULL OBJ#(57604)filter("T1"."D3"=0)
62500 TABLE ACCESS FULL OBJ#(57605)
Copyright © R Wave Solutions 2008 All rights reserved
5/11/2018 Understanding Histogram Ppt - slidepdf.com
http://slidepdf.com/reader/full/understanding-histogram-ppt-55a35c0ba99b8 17/28
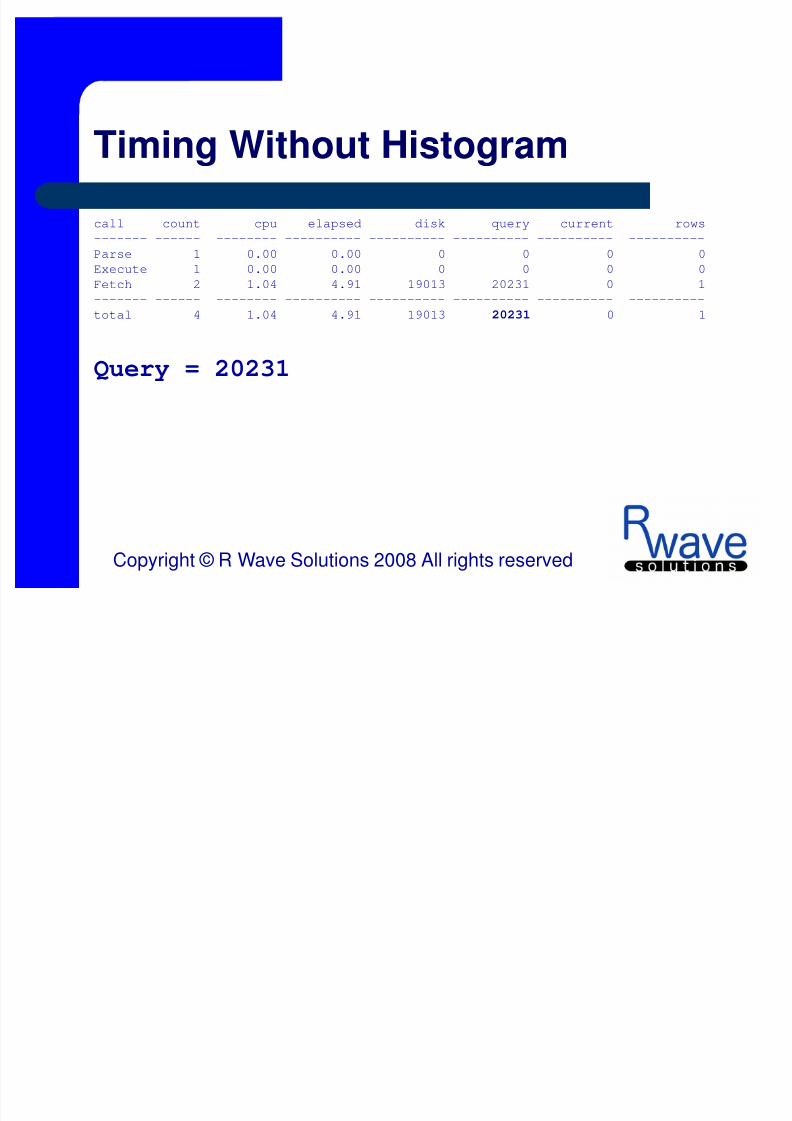
Timing Without Histogram
call count cpu elapsed disk query current rows
------- ------ -------- ---------- ---------- ---------- ---------- ----------
Parse 1 0.00 0.00 0 0 0 0
Execute 1 0.00 0.00 0 0 0 0
Fetch 2 1.04 4.91 19013 20231 0 1
------- ------ -------- ---------- ---------- ---------- ---------- ----------
total 4 1.04 4.91 19013 20231 0 1
Query = 20231
Copyright © R Wave Solutions 2008 All rights reserved

5/11/2018 Understanding Histogram Ppt - slidepdf.com
http://slidepdf.com/reader/full/understanding-histogram-ppt-55a35c0ba99b8 18/28
Use DBMS_STATS to Add Histogram
execute dbms_stats.gather_table_stats(NULL,'T1', estimate_percent=>null,
_ =>d3');
Copyright © R Wave Solutions 2008 All rights reserved
5/11/2018 Understanding Histogram Ppt - slidepdf.com
http://slidepdf.com/reader/full/understanding-histogram-ppt-55a35c0ba99b8 19/28
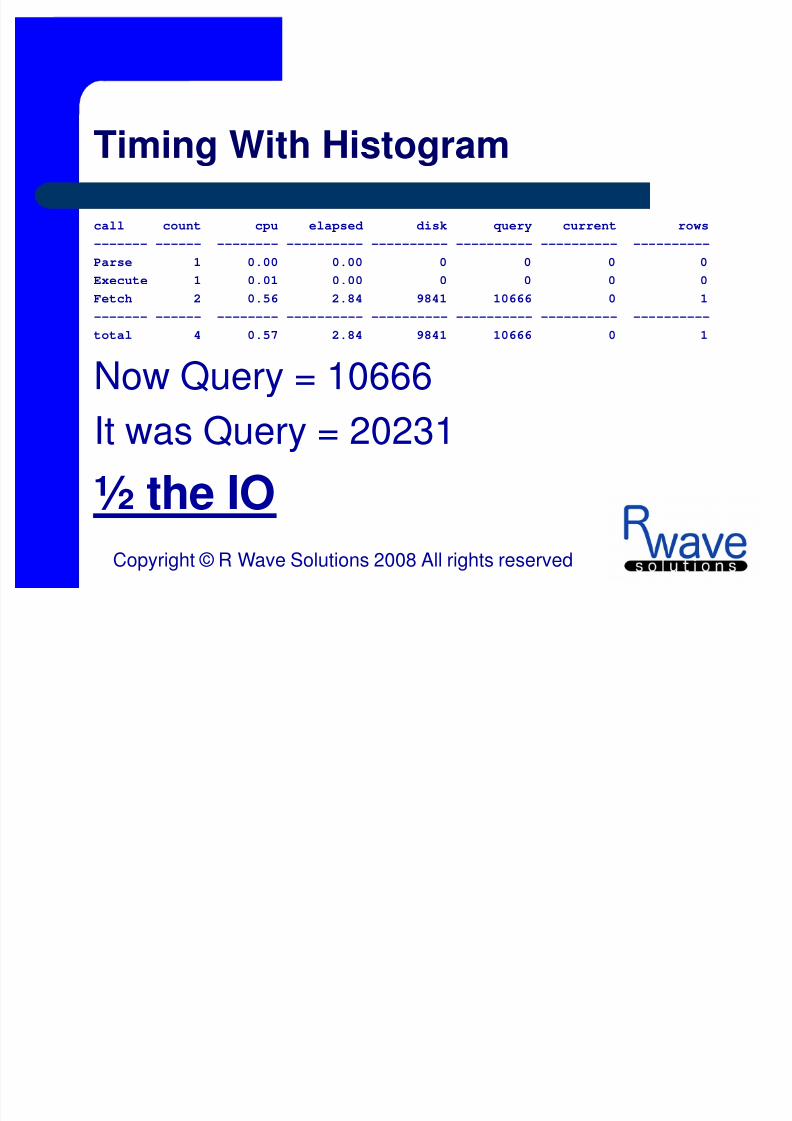
Timing With Histogram
call count cpu elapsed disk query current rows
------- ------ -------- ---------- ---------- ---------- ---------- ----------
Parse 1 0.00 0.00 0 0 0 0
Execute 1 0.01 0.00 0 0 0 0
Fetch 2 0.56 2.84 9841 10666 0 1
------- ------ -------- ---------- ---------- ---------- ---------- ----------
total 4 0.57 2.84 9841 10666 0 1
Now Query = 10666
It was Query = 20231
½ the IO
Copyright © R Wave Solutions 2008 All rights reserved
5/11/2018 Understanding Histogram Ppt - slidepdf.com
http://slidepdf.com/reader/full/understanding-histogram-ppt-55a35c0ba99b8 20/28
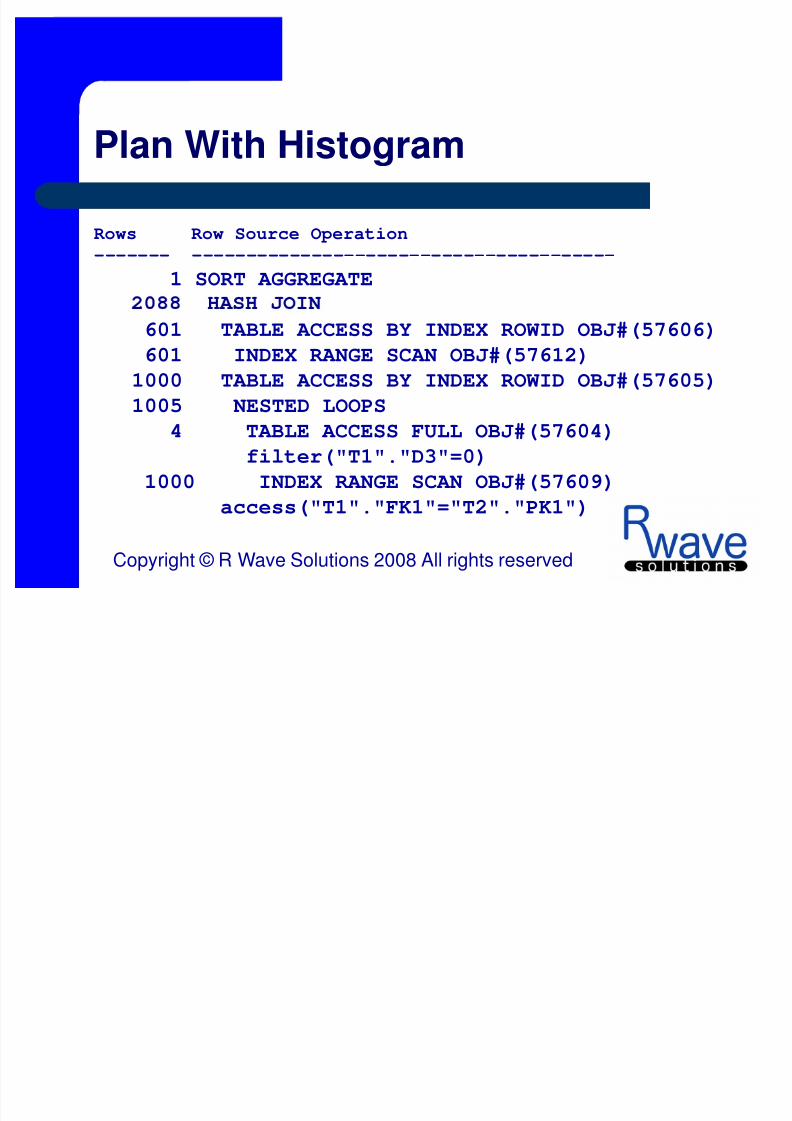
Plan With Histogram
Rows Row Source Operation
------- ---------------------------------------
1 SORT AGGREGATE
601 TABLE ACCESS BY INDEX ROWID OBJ#(57606)601 INDEX RANGE SCAN OBJ#(57612)
1000 TABLE ACCESS BY INDEX ROWID OBJ#(57605)
1005 NESTED LOOPS
4 TABLE ACCESS FULL OBJ#(57604)filter("T1"."D3"=0)
1000 INDEX RANGE SCAN OBJ#(57609)
access("T1"."FK1"="T2"."PK1")
Copyright © R Wave Solutions 2008 All rights reserved
5/11/2018 Understanding Histogram Ppt - slidepdf.com
http://slidepdf.com/reader/full/understanding-histogram-ppt-55a35c0ba99b8 21/28
Histograms Opportunities
Any column used in a where clause withskewed data
Columns that are not queried all the time Reduced overhead for insert, update, delete
Copyright © R Wave Solutions 2008 All rights reserved
5/11/2018 Understanding Histogram Ppt - slidepdf.com
http://slidepdf.com/reader/full/understanding-histogram-ppt-55a35c0ba99b8 22/28
When Not To Create A Histogram
No rule of thumb is ever perfect.
Do not create Histograms
– Evenly distributed data in the column – Columns that are not queried
– Do not create them on every column of
every table. – PK of a table
Copyright © R Wave Solutions 2008 All rights reserved

5/11/2018 Understanding Histogram Ppt - slidepdf.com
http://slidepdf.com/reader/full/understanding-histogram-ppt-55a35c0ba99b8 23/28
Creating / Maintaining Histograms
Table maintenance procedures areimportant.
– cc enta y e et ng stogram ata s poss e.
– Histogram data is ONLY Collected/Maintainedwhen stats are collected (DBMS_STATS).
– Changing data in the table does not change datastored in the histogram.
Copyright © R Wave Solutions 2008 All rights reserved
5/11/2018 Understanding Histogram Ppt - slidepdf.com
http://slidepdf.com/reader/full/understanding-histogram-ppt-55a35c0ba99b8 24/28
Maintaining Histograms
Always check if histogram exists on tablebefore DBMS_STATS is run.
– o not orget to note t e # o uc ets.
– Create tables to hold information.
Use METHOD_OPT FOR ALL COLUMNS
REPEAT to prevent deletion of histogramsdata.
Distribution ratio change -> Recollect
Copyright © R Wave Solutions 2008 All rights reserved
5/11/2018 Understanding Histogram Ppt - slidepdf.com
http://slidepdf.com/reader/full/understanding-histogram-ppt-55a35c0ba99b8 25/28
Creating Histograms
What is the best way to start out creatingHistograms? Three popular ways to create.
– a t an epper - reate t em as you nee t em.
– Little Hammer DBMS_STATS usingMETHOD_OPT AUTO
Should NOT be used after fresh restarted database
– Big Hammer DBMS_STATS using SKEWONLY
– Over Kill Hammer - FOR ALL COLUMNS
Copyright © R Wave Solutions 2008 All rights reserved
5/11/2018 Understanding Histogram Ppt - slidepdf.com
http://slidepdf.com/reader/full/understanding-histogram-ppt-55a35c0ba99b8 26/28
Other Comments
It is the Density of a column that theoptimizer considers when accessing a table.
Changing the number of buckets changesthe density.
More Buckets DOES NOT mean better
density. Using degree != 1 can affect density.
Copyright © R Wave Solutions 2008 All rights reserved
5/11/2018 Understanding Histogram Ppt - slidepdf.com
http://slidepdf.com/reader/full/understanding-histogram-ppt-55a35c0ba99b8 27/28
Review
What is a Histogram?
Two types of Histograms in the database
How to create Histograms Data is collected by running DBMS_STATS.
Different methods to create histograms
Bucket size affects density of column.
Density of the column affects CBO.
Copyright © R Wave Solutions 2008 All rights reserved
5/11/2018 Understanding Histogram Ppt - slidepdf.com
http://slidepdf.com/reader/full/understanding-histogram-ppt-55a35c0ba99b8 28/28
Thank You for Your Time
Copyright © R Wave Solutions 2008 All rights reserved


![Histogram [Www.nikonians.org]](https://img.pdfslide.us/doc/110x75/577cd8911a28ab9e78a17d60/histogram-wwwnikoniansorg.jpg)

![New gTLDs - Understanding the RFP [PPT]](https://img.pdfslide.us/doc/110x75/554bc1cbb4c90530298b5198/new-gtlds-understanding-the-rfp-ppt.jpg)