Embed Size (px)
Citation preview
Introduction Defining LF liquidity proxy Hypothesis Extras
Understanding FX liquidity
Nina Karnaukh, Angelo Ranaldo, Paul Söderlind
10th Annual Central Bank Workshopon the Microstructure of Financial Markets
2-3 October 2014, Rome
1 / 32
Introduction Defining LF liquidity proxy Hypothesis Extras
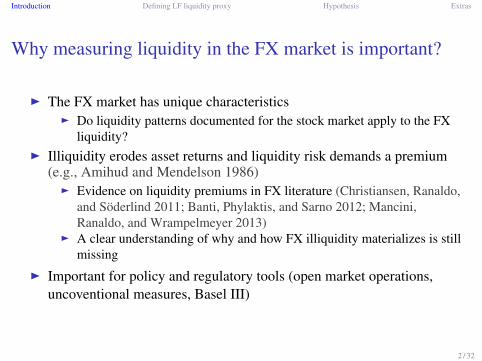
Why measuring liquidity in the FX market is important?
I The FX market has unique characteristicsI Do liquidity patterns documented for the stock market apply to the FX
liquidity?I Illiquidity erodes asset returns and liquidity risk demands a premium
(e.g., Amihud and Mendelson 1986)I Evidence on liquidity premiums in FX literature (Christiansen, Ranaldo,
and Söderlind 2011; Banti, Phylaktis, and Sarno 2012; Mancini,Ranaldo, and Wrampelmeyer 2013)
I A clear understanding of why and how FX illiquidity materializes is stillmissing
I Important for policy and regulatory tools (open market operations,uncoventional measures, Basel III)
2 / 32
Introduction Defining LF liquidity proxy Hypothesis Extras
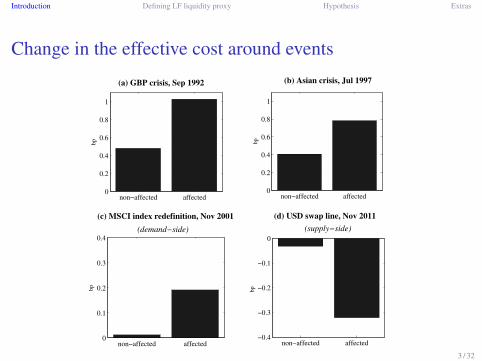
Change in the effective cost around events
non−affected affected0
0.2
0.4
0.6
0.8
1
bp
non−affected affected0
0.2
0.4
0.6
0.8
1
bp
non−affected affected−0.4
−0.3
−0.2
−0.1
0
bp
non−affected affected0
0.1
0.2
0.3
0.4
bp
(a) GBP crisis, Sep 1992
(c) MSCI index redefinition, Nov 2001 (d) USD swap line, Nov 2011
(b) Asian crisis, Jul 1997
(supply−side)(demand−side)
3 / 32
Introduction Defining LF liquidity proxy Hypothesis Extras
Contribution
I The first comprehensive study of FX liquidity and common patterns inFX liquidities ("commonality")
I Long sample (1991-) and many FX pairs (40)I Study drivers of FX liquidity
I Demand-side and supply-side explanationsI Comoves with stock and bond liquiditiesI Some currencies are more exposed to liquidity drops
I Analyze commonality in FX liquiditiesI Demand-side explanationsI Stronger commonality in distressed markets
I Methodological contributionI Show that it is possible to measure FX market liquidity from price data
that are readily available at daily frequency
4 / 32

Introduction Defining LF liquidity proxy Hypothesis Extras
Literature survey on measuring liquidity
I Large literature on measuring liquidity on the stock, bond, andcommodity markets over long periods (Lesmond, Ogden, and Trzcinka1999; Amihud 2002; Pastor and Stambaugh 2003; Hasbrouck 2009;Corwin and Schultz 2012; Goyenko, Holden, and Trzcinka 2009;Marshall, Nguyen, and Visaltanachoti 2001)
I FX marketI order flow (e.g. Evans and Lyons 2002; Marsh and O’Rourke 2011;
Breedom and Ranaldo 2012)I indicative bid-ask spread (e.g. Bessembinder 1994)I exception: Mancini, Ranaldo, and Wrampelmeyer (2013) on 9 FX pairs
and over 3 years (2007–2009)
5 / 32
Introduction Defining LF liquidity proxy Hypothesis Extras
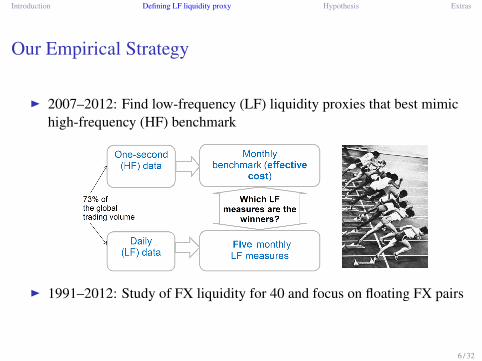
Our Empirical Strategy
I 2007–2012: Find low-frequency (LF) liquidity proxies that best mimichigh-frequency (HF) benchmark
I 1991–2012: Study of FX liquidity for 40 and focus on floating FX pairs
6 / 32

Introduction Defining LF liquidity proxy Hypothesis Extras
Effective cost (HF) benchmark
Data: one-second mid, best bid/ask (EBS) over Jan 2007 – May 2012
EC D�.PT � P/=P; for buyer-initiated trades,.P � PT/=P; for seller-initiated trades,
(1)
PT is transaction price and P is mid price (.PA C PB/=2)
-EC (liquidity)
7 / 32
Introduction Defining LF liquidity proxy Hypothesis Extras
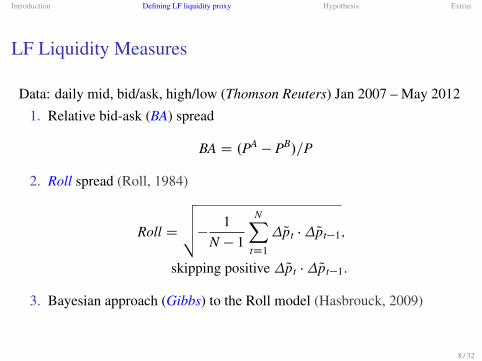
LF Liquidity Measures
Data: daily mid, bid/ask, high/low (Thomson Reuters) Jan 2007 – May 2012
1. Relative bid-ask (BA) spread
BA D .PA� PB/=P
2. Roll spread (Roll, 1984)
Roll D
vuut� 1N � 1
NXtD1
�Qpt ��Qpt�1;
skipping positive �Qpt ��Qpt�1:
3. Bayesian approach (Gibbs) to the Roll model (Hasbrouck, 2009)
8 / 32
Introduction Defining LF liquidity proxy Hypothesis Extras
LF Liquidity Measures II
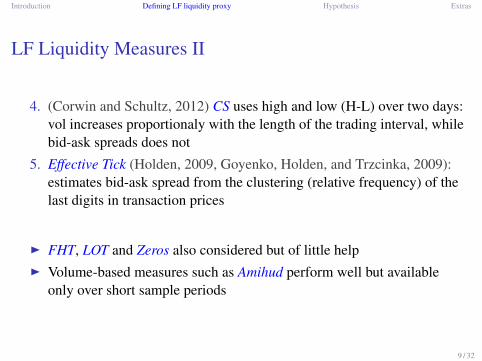
4. (Corwin and Schultz, 2012) CS uses high and low (H-L) over two days:vol increases proportionaly with the length of the trading interval, whilebid-ask spreads does not
5. Effective Tick (Holden, 2009, Goyenko, Holden, and Trzcinka, 2009):estimates bid-ask spread from the clustering (relative frequency) of thelast digits in transaction prices
I FHT, LOT and Zeros also considered but of little helpI Volume-based measures such as Amihud perform well but available
only over short sample periods
9 / 32

Introduction Defining LF liquidity proxy Hypothesis Extras
Comparing FX rate LF liquidities and the EC
BA Roll Gibbs CS EffTick
Panel A. Correlations of changes in liquidity measures of individual currenciesAUD/USD 0.353 0.782 0.649 0.593 0.024EUR/CHF 0.180 0.580 0.548 0.699 0.021EUR/GBP 0.226 0.304 0.257 0.484 -0.080EUR/JPY 0.143 0.506 0.446 0.614 -0.024EUR/USD 0.197 0.460 0.340 0.372 0.093GBP/USD 0.253 0.413 0.213 0.630 0.025USD/CAD 0.034 0.301 0.353 0.406 0.029USD/CHF 0.231 0.154 0.374 0.528 -0.018USD/JPY 0.349 0.462 0.399 0.411 -0.223Panel B. Average correlationsCorrelation, changes 0.219 0.440 0.398 0.526 -0.017Correlation, levels 0.548 0.713 0.696 0.779 0.050
Result: CS, Roll, and Gibbs have the highest correlation with the EC
10 / 32
Introduction Defining LF liquidity proxy Hypothesis Extras
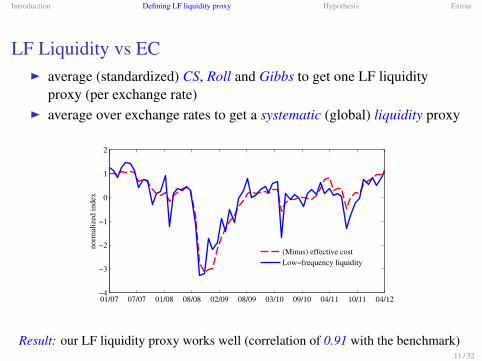
LF Liquidity vs ECI average (standardized) CS, Roll and Gibbs to get one LF liquidity
proxy (per exchange rate)I average over exchange rates to get a systematic (global) liquidity proxy
01/07 07/07 01/08 08/08 02/09 08/09 03/10 09/10 04/11 10/11 04/12−4
−3
−2
−1
0
1
2
norm
aliz
ed i
ndex
(Minus) effective cost
Low−frequency liquidity
Result: our LF liquidity proxy works well (correlation of 0.91 with the benchmark)11 / 32

Introduction Defining LF liquidity proxy Hypothesis Extras
Systematic LF liquidity over 1991–2012Data: daily mid, bid/ask, high/low prices on 30 currencies
12 / 32
Introduction Defining LF liquidity proxy Hypothesis Extras
Drivers of FX liquidity
I How FX liquidity relates to broad market conditions?I return and volatility on the FX, stock and bond markets (Stoll 1978;
Black 1976)I What are demand- and supply-side factors explaining FX liquidity?
I demand-side: traditional portfolio approach (Kouri 1976; Hau and Rey2006), reserve currencies (Maggiori 2012), "rush to exit" (Pedersen2009) and sentiment
I supply-side: funding conditions (Brunnermeier and Pedersen 2009;Garleanu and Pedersen 2007; Gromb and Vayanos 2002; Kyle andXiong 2001), monetary conditions (Lukas 1982), banking (Gabaix andMaggiori 2014)
I Is there a spillover effect from liquidity of stock and bond markets?I Are some currencies more exposed to liquidity dry-ups?
13 / 32
Introduction Defining LF liquidity proxy Hypothesis Extras
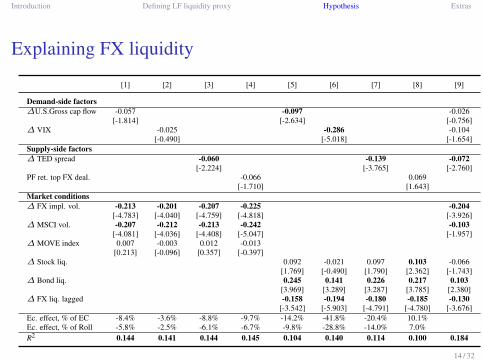
Explaining FX liquidity
[1] [2] [3] [4] [5] [6] [7] [8] [9]
Demand-side factors�U.S.Gross cap flow -0.057 -0.097 -0.026
[-1.814] [-2.634] [-0.756]� VIX -0.025 -0.286 -0.104
[-0.490] [-5.018] [-1.654]Supply-side factors� TED spread -0.060 -0.139 -0.072
[-2.224] [-3.765] [-2.760]PF ret. top FX deal. -0.066 0.069
[-1.710] [1.643]Market conditions� FX impl. vol. -0.213 -0.201 -0.207 -0.225 -0.204
[-4.783] [-4.040] [-4.759] [-4.818] [-3.926]� MSCI vol. -0.207 -0.212 -0.213 -0.242 -0.103
[-4.081] [-4.036] [-4.408] [-5.047] [-1.957]� MOVE index 0.007 -0.003 0.012 -0.013
[0.213] [-0.096] [0.357] [-0.397]� Stock liq. 0.092 -0.021 0.097 0.103 -0.066
[1.769] [-0.490] [1.790] [2.362] [-1.743]� Bond liq. 0.245 0.141 0.226 0.217 0.103
[3.969] [3.289] [3.287] [3.785] [2.380]� FX liq. lagged -0.158 -0.194 -0.180 -0.185 -0.130
[-3.542] [-5.903] [-4.791] [-4.780] [-3.676]Ec. effect, % of EC -8.4% -3.6% -8.8% -9.7% -14.2% -41.8% -20.4% 10.1%Ec. effect, % of Roll -5.8% -2.5% -6.1% -6.7% -9.8% -28.8% -14.0% 7.0%R2 0.144 0.141 0.144 0.145 0.104 0.140 0.114 0.100 0.184
14 / 32
Introduction Defining LF liquidity proxy Hypothesis Extras
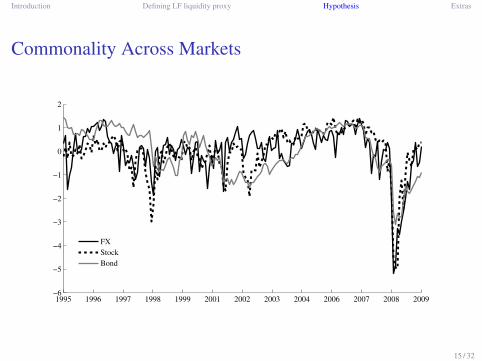
Commonality Across Markets
1995 1996 1997 1998 1999 2001 2002 2003 2004 2006 2007 2008 2009−6
−5
−4
−3
−2
−1
0
1
2
FX
Stock
Bond
15 / 32
Introduction Defining LF liquidity proxy Hypothesis Extras
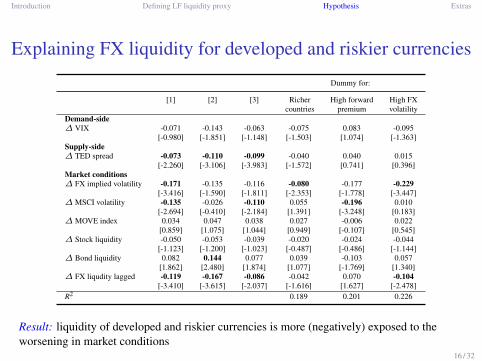
Explaining FX liquidity for developed and riskier currencies
Dummy for:
[1] [2] [3] Richer High forward High FXcountries premium volatility
Demand-side� VIX -0.071 -0.143 -0.063 -0.075 0.083 -0.095
[-0.980] [-1.851] [-1.148] [-1.503] [1.074] [-1.363]Supply-side� TED spread -0.073 -0.110 -0.099 -0.040 0.040 0.015
[-2.260] [-3.106] [-3.983] [-1.572] [0.741] [0.396]Market conditions� FX implied volatility -0.171 -0.135 -0.116 -0.080 -0.177 -0.229
[-3.416] [-1.590] [-1.811] [-2.353] [-1.778] [-3.447]� MSCI volatility -0.135 -0.026 -0.110 0.055 -0.196 0.010
[-2.694] [-0.410] [-2.184] [1.391] [-3.248] [0.183]� MOVE index 0.034 0.047 0.038 0.027 -0.006 0.022
[0.859] [1.075] [1.044] [0.949] [-0.107] [0.545]� Stock liquidity -0.050 -0.053 -0.039 -0.020 -0.024 -0.044
[-1.123] [-1.200] [-1.023] [-0.487] [-0.486] [-1.144]� Bond liquidity 0.082 0.144 0.077 0.039 -0.103 0.057
[1.862] [2.480] [1.874] [1.077] [-1.769] [1.340]� FX liqudity lagged -0.119 -0.167 -0.086 -0.042 0.070 -0.104
[-3.410] [-3.615] [-2.037] [-1.616] [1.627] [-2.478]R2 0.189 0.201 0.226
Result: liquidity of developed and riskier currencies is more (negatively) exposed to theworsening in market conditions
16 / 32

Introduction Defining LF liquidity proxy Hypothesis Extras
Commonality of FX LiquidityR2 from regression (Chordia, Roll, and Subrahmanyam 2005):
4Lj;t D j C j4LM;t C "j;t
0
0.1
0.2
0.3
0.4
0.5
0.6
0.7
0.8
EU
R/U
SD
JPY
/US
D
GB
P/U
SD
AU
D/U
SD
CA
D/U
SD
CH
F/U
SD
JPY
/EU
R
GB
P/E
UR
CH
F/E
UR
SE
K/U
SD
CA
D/E
UR
AU
D/E
UR
AU
D/G
BP
CA
D/G
BP
CH
F/G
BP
JPY
/GB
P
NO
K/E
UR
NO
K/G
BP
NO
K/U
SD
NZ
D/E
UR
NZ
D/G
BP
NZ
D/U
SD
SE
K/G
BP
INR
/US
D
MX
N/U
SD
SG
D/E
UR
SG
D/G
BP
SG
D/U
SD
ZA
R/G
BP
ZA
R/U
SD
R2
Emerging,
mean R2 = 0.22
Developed and less liquid,
mean R2 = 0.38
Developed and liquid,
mean R2 = 0.44
Result: higher commonality than on equity markets; stronger for developed currencies17 / 32
Introduction Defining LF liquidity proxy Hypothesis Extras
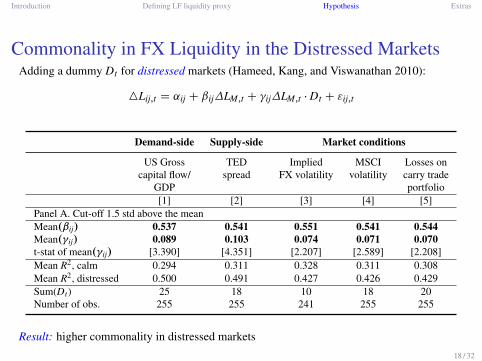
Commonality in FX Liquidity in the Distressed MarketsAdding a dummy Dt for distressed markets (Hameed, Kang, and Viswanathan 2010):
4Lij;t D ˛ij C ˇij�LM;t C ij�LM;t � Dt C "ij;t
Demand-side Supply-side Market conditions
US Gross TED Implied MSCI Losses oncapital flow/ spread FX volatility volatility carry trade
GDP portfolio[1] [2] [3] [4] [5]
Panel A. Cut-off 1.5 std above the meanMean.ˇij/ 0.537 0.541 0.551 0.541 0.544Mean. ij/ 0.089 0.103 0.074 0.071 0.070t-stat of mean. ij/ [3.390] [4.351] [2.207] [2.589] [2.208]Mean R2, calm 0.294 0.311 0.328 0.311 0.308Mean R2, distressed 0.500 0.491 0.427 0.426 0.429Sum(Dt) 25 18 10 18 20Number of obs. 255 255 241 255 255
Result: higher commonality in distressed markets
18 / 32
Introduction Defining LF liquidity proxy Hypothesis Extras
Determinants of Cross-sectional Differences inCommonality
Cross-sectional regressions:
lnŒR2ij=.1 � R2
ij/� D aC bzij C uij
Two groups of factors zij:I Demand-side explanations: capital and trade flows, portfolio positions
(Pavlova and Rigobon 2007; Hau and Hey 2004; Froot and Ramodai2005; Hau, Massa, and Peress 2010), investor protection andtransparency (Morck, Yeung, and Wu 2000)
I Supply-side explanations: funding and monetary conditions, banking(Brunnermeier and Pedersen 2009; Kyle and Xiong 2001; Cespa andFouclault 2014)
19 / 32

Introduction Defining LF liquidity proxy Hypothesis Extras
Explaining Commonality in FX liquidity
[1] [2] [3] [3]b [4] [5]
Demand-side factorsExport BC to QC / GDP BC -0.130
[-1.902]Good government index 0.229 0.236
[2.225] [2.626]Supply-side factorsInflation -0.124
[-1.242]Local money market interest rate -0.010
[-0.079]Bank deposits / GDP 0.081
[1.270]Controlsln (GDP pro capita) 0.715 0.471 0.565 0.647 0.634 0.471
[4.805] [3.164] [3.111] [3.396] [4.379] [3.194]Stock market cap / GDP 0.036 0.026 0.029 0.043 0.023
[0.540] [0.377] [0.405] [0.523] [0.327]Economic effect I -0.029 0.053 -0.028 -0.002 0.018Economic effect II -0.216 0.402 -0.207 -0.018 0.139R2 0.663 0.669 0.653 0.644 0.652 0.668
Result: good governance (high investor protection and transparency) and high GDP percapita are associated with stronger commonality
20 / 32
Introduction Defining LF liquidity proxy Hypothesis Extras
Concluding remarks
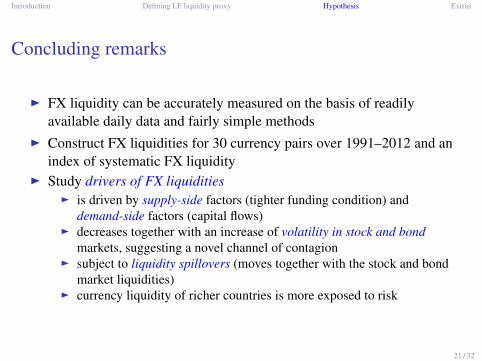
I FX liquidity can be accurately measured on the basis of readilyavailable daily data and fairly simple methods
I Construct FX liquidities for 30 currency pairs over 1991–2012 and anindex of systematic FX liquidity
I Study drivers of FX liquiditiesI is driven by supply-side factors (tighter funding condition) and
demand-side factors (capital flows)I decreases together with an increase of volatility in stock and bond
markets, suggesting a novel channel of contagionI subject to liquidity spillovers (moves together with the stock and bond
market liquidities)I currency liquidity of richer countries is more exposed to risk
21 / 32
Introduction Defining LF liquidity proxy Hypothesis Extras
Concluding remarks
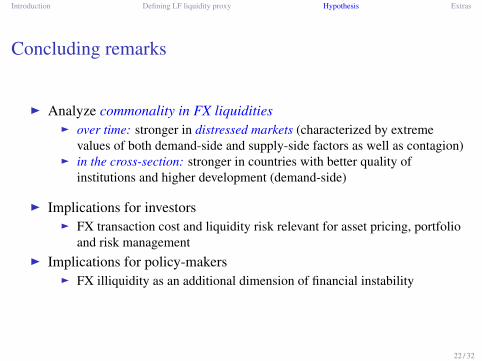
I Analyze commonality in FX liquiditiesI over time: stronger in distressed markets (characterized by extreme
values of both demand-side and supply-side factors as well as contagion)I in the cross-section: stronger in countries with better quality of
institutions and higher development (demand-side)
I Implications for investorsI FX transaction cost and liquidity risk relevant for asset pricing, portfolio
and risk managementI Implications for policy-makers
I FX illiquidity as an additional dimension of financial instability
22 / 32

Introduction Defining LF liquidity proxy Hypothesis Extras
Thank you very much for your attention
23 / 32
Introduction Defining LF liquidity proxy Hypothesis Extras
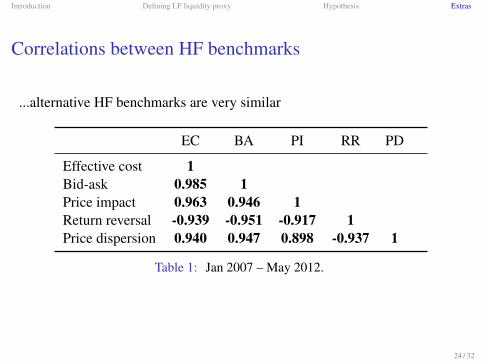
Correlations between HF benchmarks
...alternative HF benchmarks are very similar
EC BA PI RR PD
Effective cost 1Bid-ask 0.985 1Price impact 0.963 0.946 1Return reversal -0.939 -0.951 -0.917 1Price dispersion 0.940 0.947 0.898 -0.937 1
Table 1: Jan 2007 – May 2012.
24 / 32
Introduction Defining LF liquidity proxy Hypothesis Extras
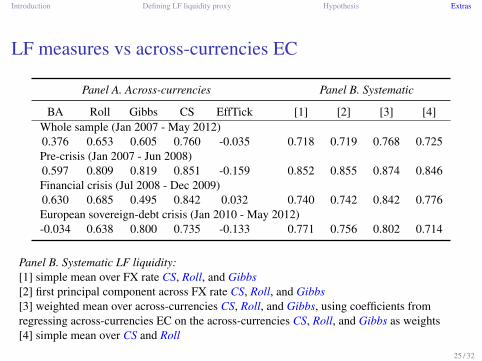
LF measures vs across-currencies EC
Panel A. Across-currencies Panel B. Systematic
BA Roll Gibbs CS EffTick [1] [2] [3] [4]Whole sample (Jan 2007 - May 2012)0.376 0.653 0.605 0.760 -0.035 0.718 0.719 0.768 0.725Pre-crisis (Jan 2007 - Jun 2008)0.597 0.809 0.819 0.851 -0.159 0.852 0.855 0.874 0.846Financial crisis (Jul 2008 - Dec 2009)0.630 0.685 0.495 0.842 0.032 0.740 0.742 0.842 0.776European sovereign-debt crisis (Jan 2010 - May 2012)-0.034 0.638 0.800 0.735 -0.133 0.771 0.756 0.802 0.714
Panel B. Systematic LF liquidity:[1] simple mean over FX rate CS, Roll, and Gibbs[2] first principal component across FX rate CS, Roll, and Gibbs[3] weighted mean over across-currencies CS, Roll, and Gibbs, using coefficients fromregressing across-currencies EC on the across-currencies CS, Roll, and Gibbs as weights[4] simple mean over CS and Roll
25 / 32
Introduction Defining LF liquidity proxy Hypothesis Extras
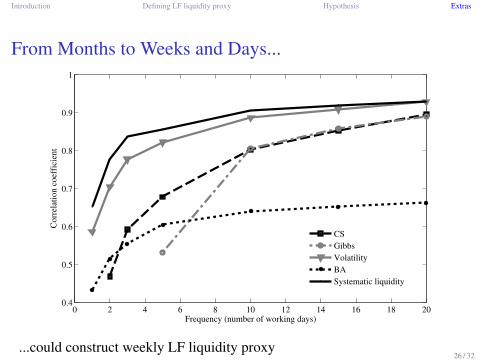
From Months to Weeks and Days...
0 2 4 6 8 10 12 14 16 18 200.4
0.5
0.6
0.7
0.8
0.9
1
Frequency (number of working days)
Co
rrel
atio
n c
oef
fici
ent
CS
Gibbs
Volatility
BA
Systematic liquidity
...could construct weekly LF liquidity proxy26 / 32
Introduction Defining LF liquidity proxy Hypothesis Extras
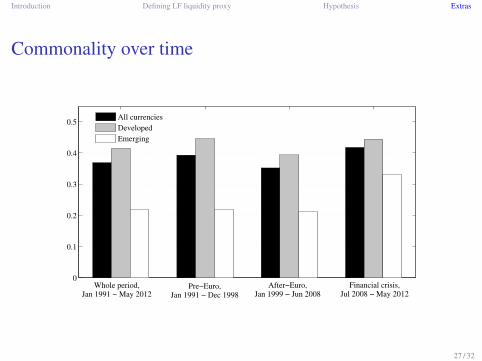
Commonality over time
0
0.1
0.2
0.3
0.4
0.5
All currencies
Developed
Emerging
Whole period,Jan 1991 − May 2012
Pre−Euro,Jan 1991 − Dec 1998
Financial crisis,Jul 2008 − May 2012
After−Euro,Jan 1999 − Jun 2008
27 / 32
Introduction Defining LF liquidity proxy Hypothesis Extras
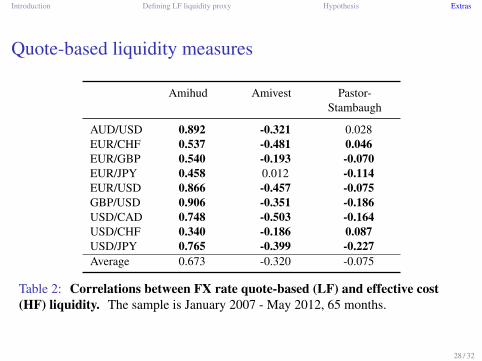
Quote-based liquidity measures
Amihud Amivest Pastor-Stambaugh
AUD/USD 0.892 -0.321 0.028EUR/CHF 0.537 -0.481 0.046EUR/GBP 0.540 -0.193 -0.070EUR/JPY 0.458 0.012 -0.114EUR/USD 0.866 -0.457 -0.075GBP/USD 0.906 -0.351 -0.186USD/CAD 0.748 -0.503 -0.164USD/CHF 0.340 -0.186 0.087USD/JPY 0.765 -0.399 -0.227Average 0.673 -0.320 -0.075
Table 2: Correlations between FX rate quote-based (LF) and effective cost(HF) liquidity. The sample is January 2007 - May 2012, 65 months.
28 / 32

Introduction Defining LF liquidity proxy Hypothesis Extras
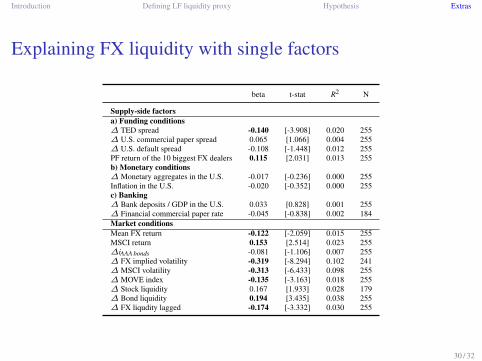
Explaining FX liquidity with single factors
beta t-stat R2 N
Demand-side factorsa) Current account� U.S. (Export+Import)/GDP 0.047 [0.887] 0.002 255� U.S. Export/GDP 0.070 [1.378] 0.005 255b) Portfolio balances� U.S. CB reserves / GDP 0.006 [0.195] 0.000 255� U.S. Gross capital flow / GDP -0.151 [-4.349] 0.023 255� Gross foreigners purchases of the U.S. treasuries / GDP -0.129 [-3.300] 0.017 255� Gross U.S. citizens purchases of the foreign stocks and bonds / GDP -0.092 [-3.049] 0.008 255Losses on the 3 best investment currencies -0.165 [-2.725] 0.027 255Losses on the 3 best funding currencies -0.008 [-0.164] 0.000 255� Carry trade return 0.161 [3.713] 0.026 255c) Sentiments� U.S. investor sentiment index 0.001 [0.030] 0.000 238� Global country fund discounts 0.008 [0.169] 0.000 179� VIX -0.278 [-6.191] 0.077 255
29 / 32
Introduction Defining LF liquidity proxy Hypothesis Extras
Explaining FX liquidity with single factors
beta t-stat R2 N
Supply-side factorsa) Funding conditions� TED spread -0.140 [-3.908] 0.020 255� U.S. commercial paper spread 0.065 [1.066] 0.004 255� U.S. default spread -0.108 [-1.448] 0.012 255PF return of the 10 biggest FX dealers 0.115 [2.031] 0.013 255b) Monetary conditions� Monetary aggregates in the U.S. -0.017 [-0.236] 0.000 255Inflation in the U.S. -0.020 [-0.352] 0.000 255c) Banking� Bank deposits / GDP in the U.S. 0.033 [0.828] 0.001 255� Financial commercial paper rate -0.045 [-0.838] 0.002 184Market conditionsMean FX return -0.122 [-2.059] 0.015 255MSCI return 0.153 [2.514] 0.023 255�iAAA bonds -0.081 [-1.106] 0.007 255� FX implied volatility -0.319 [-8.294] 0.102 241� MSCI volatility -0.313 [-6.433] 0.098 255� MOVE index -0.135 [-3.163] 0.018 255� Stock liquidity 0.167 [1.933] 0.028 179� Bond liquidity 0.194 [3.435] 0.038 255� FX liqudity lagged -0.174 [-3.332] 0.030 255
30 / 32
Introduction Defining LF liquidity proxy Hypothesis Extras
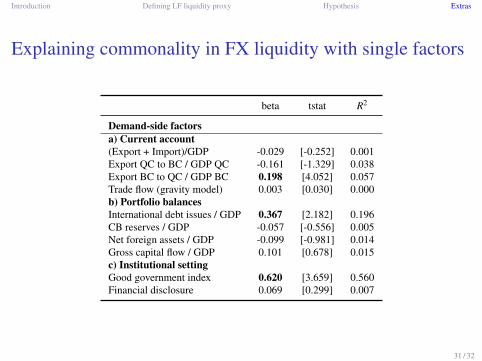
Explaining commonality in FX liquidity with single factors
beta tstat R2
Demand-side factorsa) Current account(Export + Import)/GDP -0.029 [-0.252] 0.001Export QC to BC / GDP QC -0.161 [-1.329] 0.038Export BC to QC / GDP BC 0.198 [4.052] 0.057Trade flow (gravity model) 0.003 [0.030] 0.000b) Portfolio balancesInternational debt issues / GDP 0.367 [2.182] 0.196CB reserves / GDP -0.057 [-0.556] 0.005Net foreign assets / GDP -0.099 [-0.981] 0.014Gross capital flow / GDP 0.101 [0.678] 0.015c) Institutional settingGood government index 0.620 [3.659] 0.560Financial disclosure 0.069 [0.299] 0.007
31 / 32
Introduction Defining LF liquidity proxy Hypothesis Extras
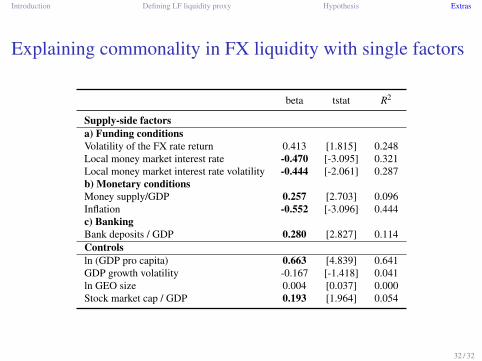
Explaining commonality in FX liquidity with single factors
beta tstat R2
Supply-side factorsa) Funding conditionsVolatility of the FX rate return 0.413 [1.815] 0.248Local money market interest rate -0.470 [-3.095] 0.321Local money market interest rate volatility -0.444 [-2.061] 0.287b) Monetary conditionsMoney supply/GDP 0.257 [2.703] 0.096Inflation -0.552 [-3.096] 0.444c) BankingBank deposits / GDP 0.280 [2.827] 0.114Controlsln (GDP pro capita) 0.663 [4.839] 0.641GDP growth volatility -0.167 [-1.418] 0.041ln GEO size 0.004 [0.037] 0.000Stock market cap / GDP 0.193 [1.964] 0.054
32 / 32