Embed Size (px)
Citation preview
Understanding future water demand outside of the
water industry
Final Report
Wood Environment & Infrastructure Solutions UK Limited – February 2020
2 © Wood Environment & Infrastructure Solutions UK Limited
February 2020
Doc Ref. 41296-WOD-XX-XX-J-TR-0006i2 Final Report
Report for
Jess Phoenix/ Anna Rios Wilks
Head of Floods & Water Research
Analysis & Evidence for Floods, Water & Contamination
Floods & Water
Defra
Floor 3
Seacole Block
2 Marsham Street
London
SW1P 4DF
Main contributors
Ben Fitzsimons (Wood)
Aimee Fraser (Wood)
Michael Green (Wood)
Chris Fawcett (Wood)
Stuart Ballinger (Ricardo)
Sandra Fischer (Ricardo)
Jerry Knox (Cranfield University)
Tim Hess (Cranfield University)
Issued by
.................................................................................
Ben Fitzsimons
Approved by
.................................................................................
Chris Fawcett
Wood
Doc Ref. 41296-WOD-XX-XX-J-TR-0006i2 Final Report
r:\projects\41296 understanding future water
demand\docs\reporting\41296-wod-xx-xx-j-tr-0006i2 final
report.docx
Copyright and non-disclosure notice
The contents and layout of this report are subject to copyright
owned by Wood (© Wood Environment & Infrastructure
Solutions UK Limited 2019) save to the extent that copyright
has been legally assigned by us to another party or is used by
Wood under licence. To the extent that we own the copyright
in this report, it may not be copied or used without our prior
written agreement for any purpose other than the purpose
indicated in this report. The methodology (if any) contained in
this report is provided to you in confidence and must not be
disclosed or copied to third parties without the prior written
agreement of Wood. Disclosure of that information may
constitute an actionable breach of confidence or may
otherwise prejudice our commercial interests. Any third party
who obtains access to this report by any means will, in any
event, be subject to the Third Party Disclaimer set out below.
Third party disclaimer
Any disclosure of this report to a third party is subject to this
disclaimer. The report was prepared by Wood at the instruction
of, and for use by, our client named on the front of the report.
It does not in any way constitute advice to any third party who
is able to access it by any means. Wood excludes to the fullest
extent lawfully permitted all liability whatsoever for any loss or
damage howsoever arising from reliance on the contents of
this report. We do not however exclude our liability (if any) for
personal injury or death resulting from our negligence, for
fraud or any other matter in relation to which we cannot legally
exclude liability.
Management systems
This document has been produced by Wood Environment &
Infrastructure Solutions UK Limited in full compliance with our
management systems, which have been certified to ISO 9001,
ISO 14001 and OHSAS 18001 by LRQA.
Document revisions
No. Details Date
1 Draft report 06/12/2019
2 Final report 02/02/2020
3 Revised Final Report 28/02/2020

3 © Wood Environment & Infrastructure Solutions UK Limited
January 2020
Doc Ref. 41296-WOD-XX-XX-J-TR-0006 Final Report Page | 3
Purpose of this report
This report has been produced for the purpose of supporting the development of the first iteration of the
Water Resources National Framework. The content and findings set out in this report have been informed by
data and information provided by the client and the project’s steering group in addition to published peer
reviewed literature and grey literature and personal communications with stakeholders. All information,
reports and data supplied to Wood in this regard are assumed to be accurate, complete and not misleading.
4 © Wood Environment & Infrastructure Solutions UK Limited
February 2020
Doc Ref. 41296-WOD-XX-XX-J-TR-0006i2 Final Report Page | 4
Contents
Project overview 7
Context 7 Project rationale - Understanding water demand beyond the water industry 7 Project aims: Developing datasets, supporting national modelling and policy decisions 7 Structure of this report 7
1. Baseline and sector prioritisation 9
1.1 Introduction and data background 9
1.2 Water industry-supplied non-household demand 10
1.3 Baseline abstraction 10 Regional data 11
1.4 National Overview 12 Total abstraction 12 Consumptive abstraction 14 The balance of water industry and non-water industry abstraction 14
1.5 Regional overview 16 Focusing on abstraction beyond the Public Water Supply Sector 16
1.6 Agricultural overview 18 Seasonal variation in spray irrigation 21
1.7 Industrial and commercial uses 23
2. Sub-sector prioritisation 27
3. Future changes in water demand 29
Quantifying change in demand out to 2050 29 Water company non-household demand forecasts 29
4. Sector summaries 31
5. Sector summary: Spray irrigation 32
5.1 Sub-sector overview 32
5.2 Water use within the sub-sector 32
5.3 Factors affecting water use within the sub-sector 33
5.4 Key pressures and drivers affecting sector’s water use 35 Projecting future demand 39
5.5 Gaps in knowledge 41
6. Sector summary: Livestock 43
6.1 Sub-sector overview 43
5 © Wood Environment & Infrastructure Solutions UK Limited
February 2020
Doc Ref. 41296-WOD-XX-XX-J-TR-0006i2 Final Report Page | 5
6.2 Water use within the sub-sector 44
6.3 Factors affecting water use within the sub-sector 47
6.4 Key pressures and drivers affecting sector’s water use 49
6.5 Future water use in the sector 51 Projecting future demand 51
6.6 Gaps in knowledge 51
7. Sector summary: Protected Edibles and Ornamentals 52
7.1 Sub-sector overview 52
7.2 Water use within the sub-sector 53
7.3 Factors affecting water use within the sub-sector 55
7.4 Key pressures and drivers affecting sector’s water use 58
7.5 Future water use in the sector 59 Projecting future demand 59
7.6 Gaps in knowledge 59
8. Sector summary: Electricity production 61
8.1 Sub-sector overview 61 Water use within the sub-sector 62
8.2 Factors affecting water use within the sub-sector 66
8.3 Key pressures and drivers affecting and expected to affect the sector’s water use 68
8.4 The future and water use in the sector 70
8.5 Future narratives 75
8.6 Gaps in knowledge 77
9. Sector summary: Paper and Pulp manufacturing 78
9.1 Sub-sector overview 78
9.2 Water use within the sub-sector 78 Recent trends in water use 80
9.3 Factors affecting water use within the sub-sector 81
9.4 Key pressures and drivers affecting and expected to affect the sector’s water use 83
9.5 The future and water use in the sector 84
9.6 Future narratives 85
9.7 Gaps in knowledge 86
10. Sector summary: Chemicals manufacturing 88
10.1 Sub-sector overview 88 Water use within the sub-sector 89 Recent trends in water use 90
10.2 Factors affecting water use within the sub-sector 90
6 © Wood Environment & Infrastructure Solutions UK Limited
February 2020
Doc Ref. 41296-WOD-XX-XX-J-TR-0006i2 Final Report Page | 6
10.3 Key pressures and drivers affecting sector’s water use 92
10.4 The future and water use in the sector 93
10.5 Future narratives 95
10.6 Gaps in knowledge 97
11. Sector summary: Food and Drink manufacturing 98
11.1 Sub-sector overview 98 Water use within the sub-sector 99
11.2 Factors affecting water use within the sub-sector 102
11.3 Key pressures and drivers affecting sector’s water use 104
11.4 The future and water use in the sector 105
11.5 Future narratives 107
11.6 Gaps in knowledge 109
12. Quantifying Change in Water Demand 110
12.1 Developing growth factors 110 The use of future scenarios 111 Driver trajectories 113 Developing a “best estimate” growth factor 113 Quantifying the change in water demand 114 Quantifying the degree of uncertainty in the growth factors 117 Electricity production growth factors 119
13. Application of growth factors 120
13.1 Approach and assumptions 120
13.2 Demonstration of growth factor use 121 Regional level 121 Sector view 126 Spray irrigation 128 Chemicals manufacturing 129 Paper and pulp 130 Food and drink 131 Electricity production 132
14. Concluding remarks and recommendations 133
Gaps in knowledge and potential for further work 133
15. References 136
16. Appendices 139
7 © Wood Environment & Infrastructure Solutions UK Limited
February 2020
Doc Ref. 41296-WOD-XX-XX-J-TR-0006i2 Final Report Page | 7
Project overview
Context
The Environment Agency and Defra are currently developing the first iteration of a Water Resources National
Framework that will aim to provide strategic direction in water resources planning, to steer the water industry
towards greater collaboration at a regional and national scale, and to give far stronger consideration to a
wider range of water users. Outputs are expected by the end of March 2020. Five regional water company
groups are now formally recognised and will be working with their member water companies and other
water-using sectors to improve water resources planning and management.
Project rationale - Understanding water demand beyond the water industry
A key component to developing the National Framework is understanding future changes in water demands
from major water abstractors across the country, including those arising from the water industry and beyond.
While evidence on future demands from the water industry is well structured and undergoes cyclical and
statutory review, information on current and future water demands from sectors outside the water industry is
not always available, collated or disseminated effectively for use by those involved in water resources
modelling and planning.
This project seeks to deliver an up to date view for a multi-sectoral audience of the key drivers for and
uncertainties in water demand outside the water industry, focusing on a selection of prioritised water-using
sub-sectors spanning agriculture, manufacturing and electricity production.
This will feed directly into the English regulator’s developing Water Resources National Framework which will
steer investment, planning and stronger collaboration.
Project aims: Developing datasets, supporting national modelling and policy decisions
The overall aim of this project is to
Build on previous and existing work;
Better understand the baseline of water demand across sectors;
Collate existing information and research into future water demand;
Identify future scenarios and datasets that can be used to assess impacts on water demand;
Identify gaps in knowledge and data; and
Where possible, compile datasets that inform modelling under the Water Resources National
Framework.
Structure of this report
Section 1 of this report begins by exploring the baseline of abstraction in England, focusing on consumptive
freshwater demand across sectors. This leads to a better understanding of the make-up of water demand at a
national and regional scale, highlighting where an awareness of variation might support collaboration across
sectors.
Section 2 then sets out how seven water-using sub-sectors were identified through this baseline review for a
more in-depth review of available literature, research and evidence that is brought together to build a picture

8 © Wood Environment & Infrastructure Solutions UK Limited
February 2020
Doc Ref. 41296-WOD-XX-XX-J-TR-0006i2 Final Report Page | 8
for each sub-sector of the nature of water demand, the key pressures affecting it, now and potentially out to
2050. The research and outputs of associated targeted stakeholder engagement for each sector is
summarised in separate chapters as “sector summaries” (sections 4 to 11).
Our approach to exploring the possibility of compiling datasets to inform Environment Agency modelling is
outlined in section 0. Where available, evidence and data are brought together to develop growth factors
and a view of the ranges of uncertainty around them for each sector. Section 13 shows how these growth
factors are then applied to baseline datasets held by the Environment Agency and improved as part of this
project, to reveal the magnitude of change in water demand that might be expected within each sector and
across each region. Section 14 provides selected recommendations and important considerations for
subsequent work.
9 © Wood Environment & Infrastructure Solutions UK Limited
February 2020
Doc Ref. 41296-WOD-XX-XX-J-TR-0006i2 Final Report Page | 9
1. Baseline and sector prioritisation
This section presents an overview of the relative magnitude of current, direct freshwater
abstraction from water-using sectors outside the water industry. This supports an
understanding of the variable contribution that water-using sectors use across the country
and therefore lead to a greater awareness of potential for collaboration across sectors in
water resources planning and management.
1.1 Introduction and data background
Figures and statistics presented within this section are based on abstraction data contained within the
Environment Agency’s Water Resources GIS (WRGIS) – updated version February 2019. The WRGIS is the
Environment Agency’s primary tool for conducting national and regional scale water balance and screening
assessments, linking water resource availability and abstraction datasets. The abstraction datasets presented
in this report include both Recent Actual and Fully Licenced abstractions.
Some uses of water that return a large proportion of the water initially abstracted, directly and locally to the
environment with little or no treatment are considered to be “non-consumptive”. For example, run-of-river
hydropower schemes, or very low loss uses such as some industrial cooling processes. Uses of water that do
not directly and locally return a very high proportion of water initially abstracted back to the environment are
considered either wholly or partially consumptive. It is the consumptive element of abstraction that is
deemed to affect the overall local water balance and water availability within catchments.
Both total and estimated consumptive abstraction figures are presented through this report.
Data availability relating to the actual volume of water returned directly to the environment is highly variable
between sectors and between individual users. As such, for the purposes of this report, consumptive
abstraction is estimated based on assumptions specific to broad types of water use.
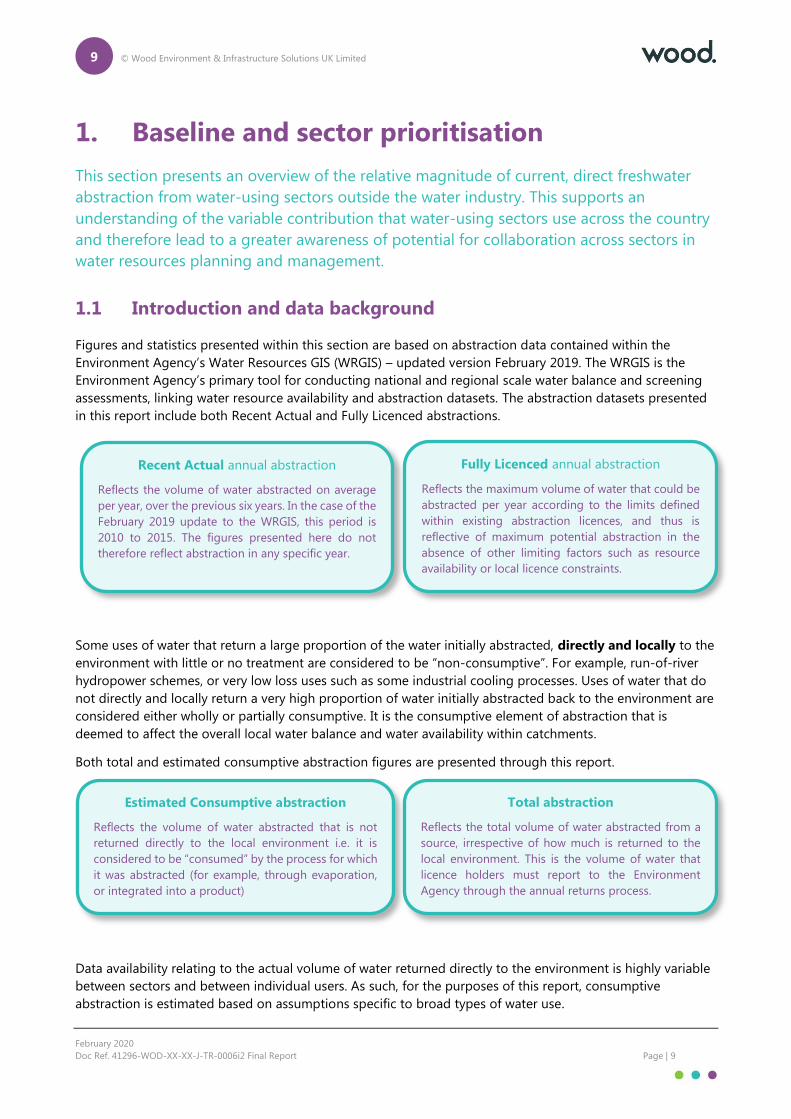
Recent Actual annual abstraction
Reflects the volume of water abstracted on average
per year, over the previous six years. In the case of the
February 2019 update to the WRGIS, this period is
2010 to 2015. The figures presented here do not
therefore reflect abstraction in any specific year.
Fully Licenced annual abstraction
Reflects the maximum volume of water that could be
abstracted per year according to the limits defined
within existing abstraction licences, and thus is
reflective of maximum potential abstraction in the
absence of other limiting factors such as resource
availability or local licence constraints.
Total abstraction
Reflects the total volume of water abstracted from a
source, irrespective of how much is returned to the
local environment. This is the volume of water that
licence holders must report to the Environment
Agency through the annual returns process.
Estimated Consumptive abstraction
Reflects the volume of water abstracted that is not
returned directly to the local environment i.e. it is
considered to be “consumed” by the process for which
it was abstracted (for example, through evaporation,
or integrated into a product)
10 © Wood Environment & Infrastructure Solutions UK Limited
February 2020
Doc Ref. 41296-WOD-XX-XX-J-TR-0006i2 Final Report Page | 10
With the exception of hydropower and aquaculture uses, which are considered to be wholly non-
consumptive for the purposes of this project, consumptive abstraction is estimated based on the
Environment Agency’s standard loss factors assigned to abstraction licence purpose codes (see Appendix A).
These loss factors range from very low loss, to high loss. However, within the WRGIS, individual abstractions
are often adjusted with specific values by local area staff according to their unique circumstances or
additional information. Further details can be found in Appendix A.
1.2 Water industry-supplied non-household demand
It is important to note that water demand amongst non-household water users is met not only through
direct abstraction (the primary consideration of this project), but also by mains supply (water industry).
Direct abstraction from a source of supply (groundwater or surface water) is that which is managed and
operated by the end user either within the limits of an abstraction licence issued by the Environment Agency
or operated legally without a licence in accordance with legal exemptions. There are many reasons why a
water user may choose or need to abstract water directly or receive mains supply.
Datasets collected in the most recent study by the Waste and Resources Action Programme (WRAP, 2011)
revealed that the manufacturing sector was the largest non-household user of mains water (27% of total
non-household demand). Water used in the manufacture of food and beverages was drawn primarily from
mains supply (79%) rather than direct abstraction. In contrast, water demand from the paper manufacturing
sector was found to be met principally through direct abstraction. Agriculture accounted for the second
largest user of mains-supplied non-household demand in 2006/07 (11%). The authors of this report are not
aware of more up to date study of this type at a national scale, but these figures are presented as indicative
of the variability across sectors.
Environment Agency-compiled data from draft water company planning tables gives an overview of the
relative importance of non-household demand for each water company operating in England.
By volume, Thames Water hosts the largest non-household demand within the country, followed by United
Utilities and Severn Trent, Anglian and Yorkshire Water. As a proportion of each company’s total distribution
input however there is significant variability. For example, Bournemouth Water (now part of South West
Water) is most heavily skewed by non-household demand (~40% of total distribution input – note however
that this is dominated by a single large industrial user). Non-household demand for Thames Water
represents only around 17% of total distribution input. Cambridge Water, United Utilities, Yorkshire Water
and Wessex Water indicate that 20-25% of their supply is to non-household users.
1.3 Baseline abstraction
Reviewing the baseline data provides an indication of the current make up of abstraction and water demand
across sectors nationally and regionally. This will help regional water company groups and other water users
understand the relative pressures and priorities for collaboration or further work.
As noted above, data contained within the WRGIS (reflecting a rolling 6-year annual average abstraction) has
been used in this project. This should not be confused with annual return data which reflects actual
abstraction within specific years and is far more variable, depending on a multitude of factors ranging from
prevailing weather to individual business choices. The Environment Agency uses the WRGIS as the basis for
many national water resources assessments and will use it to support modelling ahead of the Water
Resources National Framework. The derivation of theoretical baseline abstraction datasets for specific years is
well developed in some sub-sectors of agriculture, but this is not the case for all water-using sectors. As such,
baseline WRGIS abstraction data is adopted here.
11 © Wood Environment & Infrastructure Solutions UK Limited
February 2020
Doc Ref. 41296-WOD-XX-XX-J-TR-0006i2 Final Report Page | 11
Note that as the WRGIS base data reflects the average annual abstraction over the period 2010-15), the data
cannot be directly compared to other publicly presented abstraction datasets, which are produced for a variety
of purposes using a range of associated data transformations and assumptions.
Additional information relating to data selections, sector groupings and assumptions applied in the
presentation of figures that follow are detailed within Appendix A.
Regional data
An important element of this project is to provide regional insights, to facilitate collaboration between water
companies and other water-using sectors at the regional scale.
Five Regional Water Company Groups are now formally recognised within the context of water resources
planning in England. These are:
Water Resources North
Water Resources West
Water Resources East
West Country Water Resources
Water Resources South East
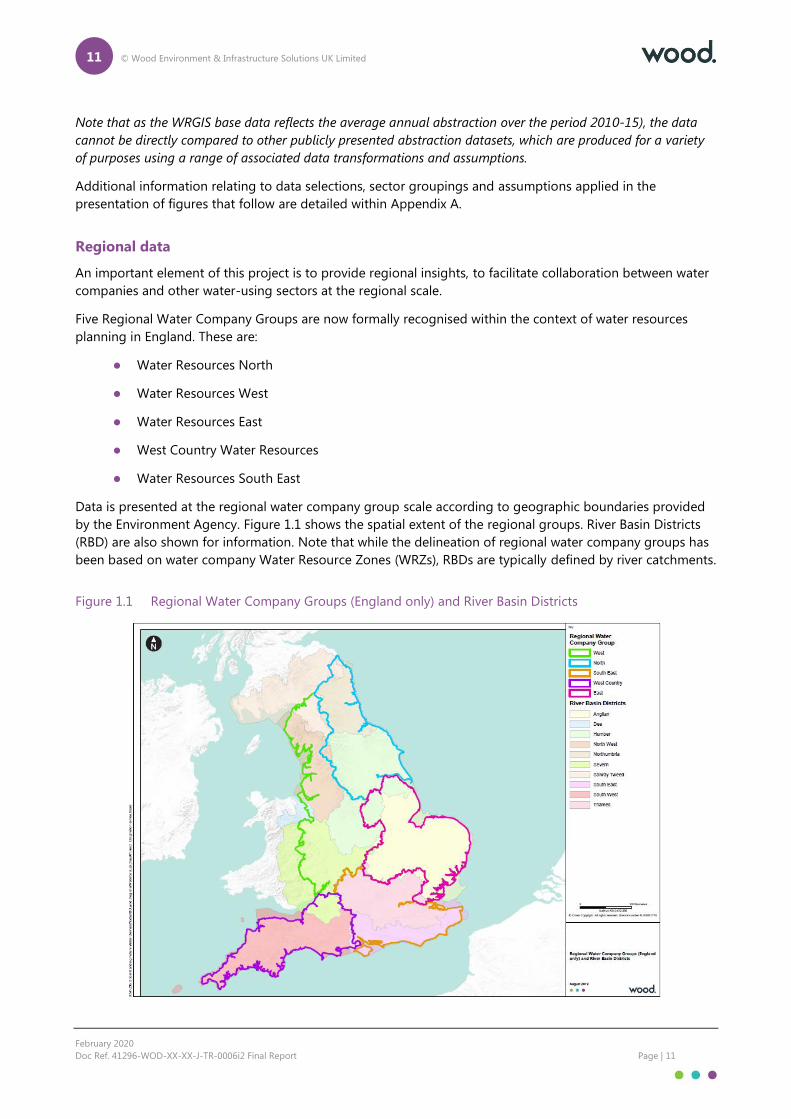
Data is presented at the regional water company group scale according to geographic boundaries provided
by the Environment Agency. Figure 1.1 shows the spatial extent of the regional groups. River Basin Districts
(RBD) are also shown for information. Note that while the delineation of regional water company groups has
been based on water company Water Resource Zones (WRZs), RBDs are typically defined by river catchments.
Figure 1.1 Regional Water Company Groups (England only) and River Basin Districts
12 © Wood Environment & Infrastructure Solutions UK Limited
February 2020
Doc Ref. 41296-WOD-XX-XX-J-TR-0006i2 Final Report Page | 12
1.4 National Overview
Total abstraction
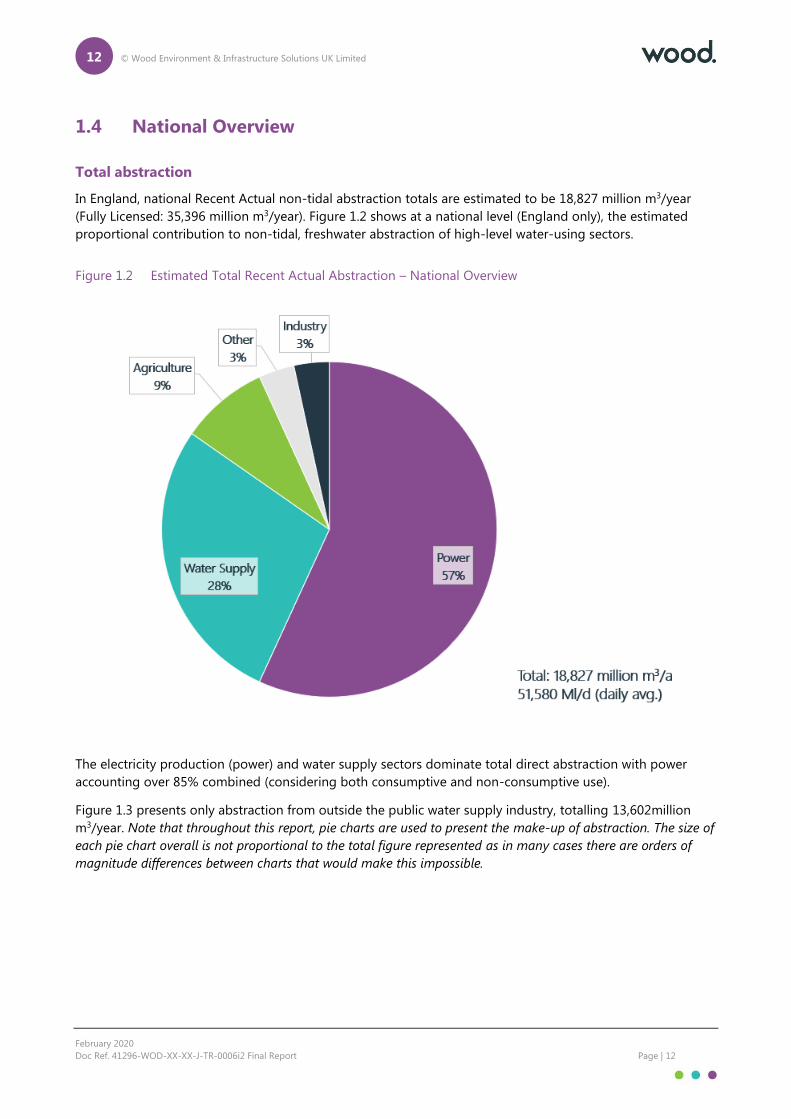
In England, national Recent Actual non-tidal abstraction totals are estimated to be 18,827 million m3/year
(Fully Licensed: 35,396 million m3/year). Figure 1.2 shows at a national level (England only), the estimated
proportional contribution to non-tidal, freshwater abstraction of high-level water-using sectors.
Figure 1.2 Estimated Total Recent Actual Abstraction – National Overview
The electricity production (power) and water supply sectors dominate total direct abstraction with power
accounting over 85% combined (considering both consumptive and non-consumptive use).
Figure 1.3 presents only abstraction from outside the public water supply industry, totalling 13,602million
m3/year. Note that throughout this report, pie charts are used to present the make-up of abstraction. The size of
each pie chart overall is not proportional to the total figure represented as in many cases there are orders of
magnitude differences between charts that would make this impossible.

13 © Wood Environment & Infrastructure Solutions UK Limited
February 2020
Doc Ref. 41296-WOD-XX-XX-J-TR-0006i2 Final Report Page | 13
Figure 1.3 Estimated Total Recent Actual Non-Public Water Supply Abstraction – National Overview
Focussing on demand from outside of the water industry, the electricity generation sector accounts for three
quarters of freshwater abstractions. This figure is dominated by abstractions for hydropower.
Table 1.1 Sector definitions
Overview
Water supply (as labelled in
Figure 1.2)
All water industry abstraction, which includes water supplied by water companies
to both household and non-household users.
Also includes abstractions for private water supply which could be a mixture of
both household and non-household uses, but it treated as a drinking water
source.
Power All abstractions associated with the production of electricity, including thermal
power stations and water used in the generation of hydropower.
Agriculture All abstractions associated with agriculture.
Also includes abstractions for amenity purposes.
Industry Includes abstractions for a wide range of industrial and commercial purposes in
addition to direct abstractions for public services.
Other Crown and government abstractions, and abstractions for environmental
purposes.
14 © Wood Environment & Infrastructure Solutions UK Limited
February 2020
Doc Ref. 41296-WOD-XX-XX-J-TR-0006i2 Final Report Page | 14
Consumptive abstraction
As discussed, a large proportion of both the power and agricultural sectors’ abstraction is considered to be
non-consumptive. For example, abstractions for the purposes of non-evaporative cooling, hydropower
production and aquaculture (fish farm and cress bed through flow) are often very large, but the net loss of
water to the local environment is very low. Over 80% of total freshwater abstraction outside of the public
water supply industry is accounted for by non-consumptive hydropower and aquaculture uses.
Estimating consumptive abstraction (using Environment Agency loss factors as described above) is
challenging but is explored here as it provides an indication of the volume of abstraction affecting local water
resource availability.
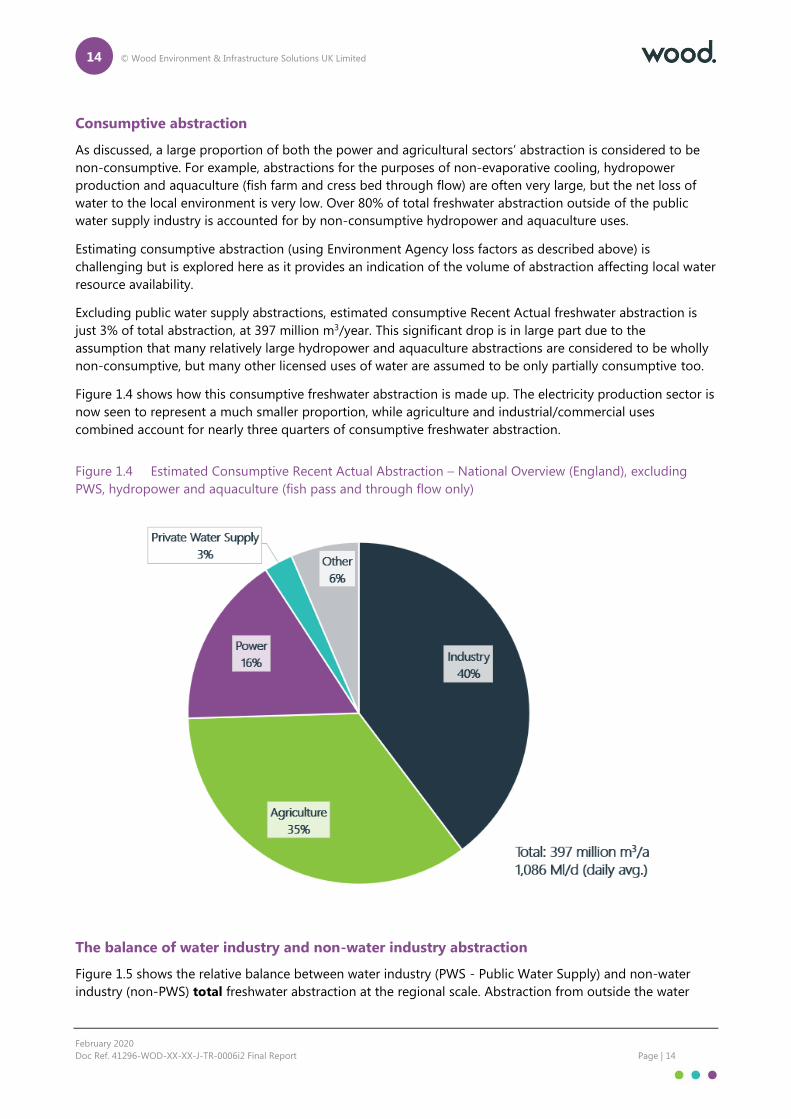
Excluding public water supply abstractions, estimated consumptive Recent Actual freshwater abstraction is
just 3% of total abstraction, at 397 million m3/year. This significant drop is in large part due to the
assumption that many relatively large hydropower and aquaculture abstractions are considered to be wholly
non-consumptive, but many other licensed uses of water are assumed to be only partially consumptive too.
Figure 1.4 shows how this consumptive freshwater abstraction is made up. The electricity production sector is
now seen to represent a much smaller proportion, while agriculture and industrial/commercial uses
combined account for nearly three quarters of consumptive freshwater abstraction.
Figure 1.4 Estimated Consumptive Recent Actual Abstraction – National Overview (England), excluding
PWS, hydropower and aquaculture (fish pass and through flow only)
The balance of water industry and non-water industry abstraction
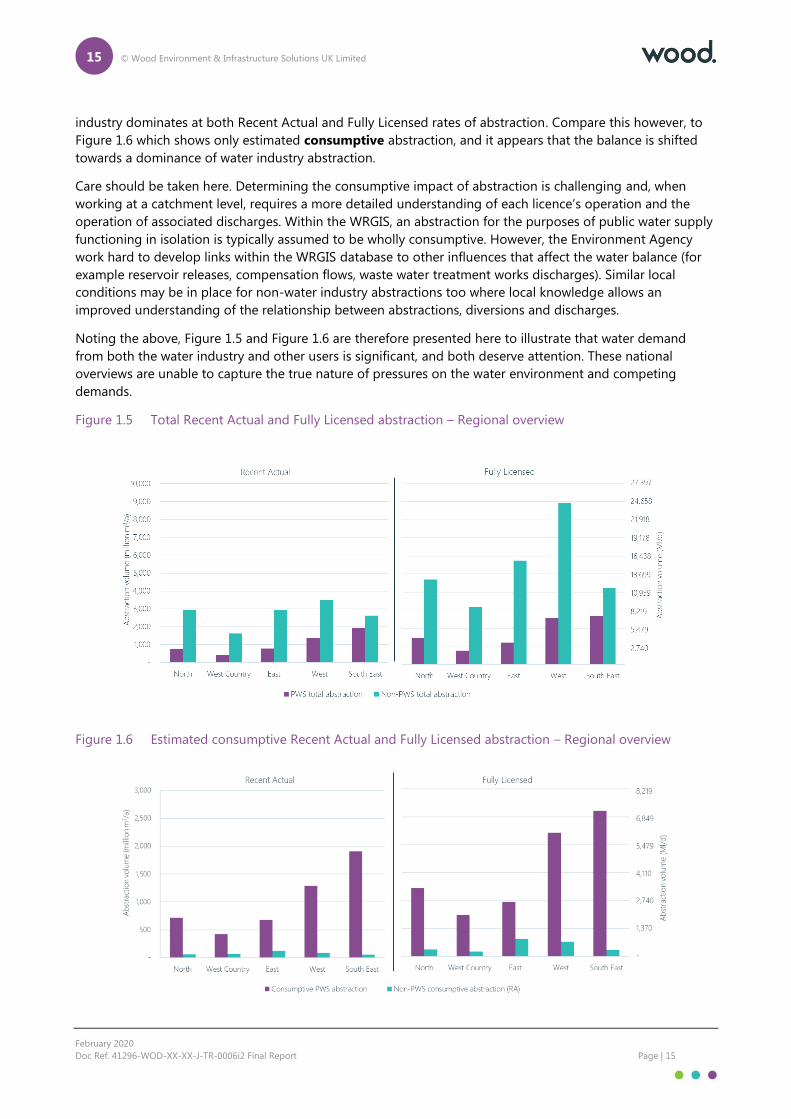
Figure 1.5 shows the relative balance between water industry (PWS - Public Water Supply) and non-water
industry (non-PWS) total freshwater abstraction at the regional scale. Abstraction from outside the water
15 © Wood Environment & Infrastructure Solutions UK Limited
February 2020
Doc Ref. 41296-WOD-XX-XX-J-TR-0006i2 Final Report Page | 15
industry dominates at both Recent Actual and Fully Licensed rates of abstraction. Compare this however, to
Figure 1.6 which shows only estimated consumptive abstraction, and it appears that the balance is shifted
towards a dominance of water industry abstraction.
Care should be taken here. Determining the consumptive impact of abstraction is challenging and, when
working at a catchment level, requires a more detailed understanding of each licence’s operation and the
operation of associated discharges. Within the WRGIS, an abstraction for the purposes of public water supply
functioning in isolation is typically assumed to be wholly consumptive. However, the Environment Agency
work hard to develop links within the WRGIS database to other influences that affect the water balance (for
example reservoir releases, compensation flows, waste water treatment works discharges). Similar local
conditions may be in place for non-water industry abstractions too where local knowledge allows an
improved understanding of the relationship between abstractions, diversions and discharges.
Noting the above, Figure 1.5 and Figure 1.6 are therefore presented here to illustrate that water demand
from both the water industry and other users is significant, and both deserve attention. These national
overviews are unable to capture the true nature of pressures on the water environment and competing
demands.
Figure 1.5 Total Recent Actual and Fully Licensed abstraction – Regional overview
Figure 1.6 Estimated consumptive Recent Actual and Fully Licensed abstraction – Regional overview
16 © Wood Environment & Infrastructure Solutions UK Limited
February 2020
Doc Ref. 41296-WOD-XX-XX-J-TR-0006i2 Final Report Page | 16
1.5 Regional overview
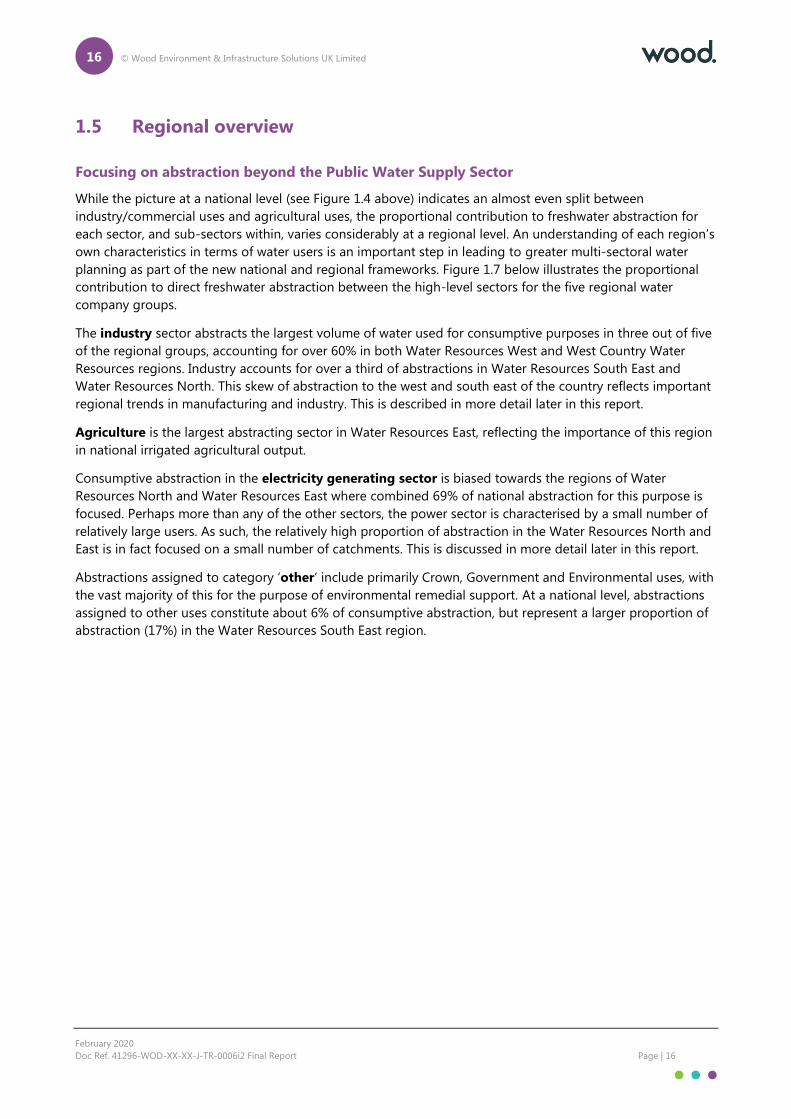
Focusing on abstraction beyond the Public Water Supply Sector
While the picture at a national level (see Figure 1.4 above) indicates an almost even split between
industry/commercial uses and agricultural uses, the proportional contribution to freshwater abstraction for
each sector, and sub-sectors within, varies considerably at a regional level. An understanding of each region’s
own characteristics in terms of water users is an important step in leading to greater multi-sectoral water
planning as part of the new national and regional frameworks. Figure 1.7 below illustrates the proportional
contribution to direct freshwater abstraction between the high-level sectors for the five regional water
company groups.
The industry sector abstracts the largest volume of water used for consumptive purposes in three out of five
of the regional groups, accounting for over 60% in both Water Resources West and West Country Water
Resources regions. Industry accounts for over a third of abstractions in Water Resources South East and
Water Resources North. This skew of abstraction to the west and south east of the country reflects important
regional trends in manufacturing and industry. This is described in more detail later in this report.
Agriculture is the largest abstracting sector in Water Resources East, reflecting the importance of this region
in national irrigated agricultural output.
Consumptive abstraction in the electricity generating sector is biased towards the regions of Water
Resources North and Water Resources East where combined 69% of national abstraction for this purpose is
focused. Perhaps more than any of the other sectors, the power sector is characterised by a small number of
relatively large users. As such, the relatively high proportion of abstraction in the Water Resources North and
East is in fact focused on a small number of catchments. This is discussed in more detail later in this report.
Abstractions assigned to category ‘other’ include primarily Crown, Government and Environmental uses, with
the vast majority of this for the purpose of environmental remedial support. At a national level, abstractions
assigned to other uses constitute about 6% of consumptive abstraction, but represent a larger proportion of
abstraction (17%) in the Water Resources South East region.
17 © Wood Environment & Infrastructure Solutions UK Limited
February 2020
Doc Ref. 41296-WOD-XX-XX-J-TR-0006i2 Final Report Page | 17
Figure 1.7 Estimated regional variation in consumptive Recent Actual freshwater abstraction, excluding
PWS

18 © Wood Environment & Infrastructure Solutions UK Limited
February 2020
Doc Ref. 41296-WOD-XX-XX-J-TR-0006i2 Final Report Page | 18
1.6 Agricultural overview
The largest amount of direct freshwater abstraction for agriculture is in Water Resources East, as shown in
Table 1.2.
Table 1.2 Regional estimated consumptive freshwater abstraction for the agricultural sector
Regional water
company group
Abstraction volume
(million m3/year)
Abstraction proportion, of national agriculture
abstraction (%)
West 21 15
West Country 16 11
North 12 9
East 74 54
South East 15 11
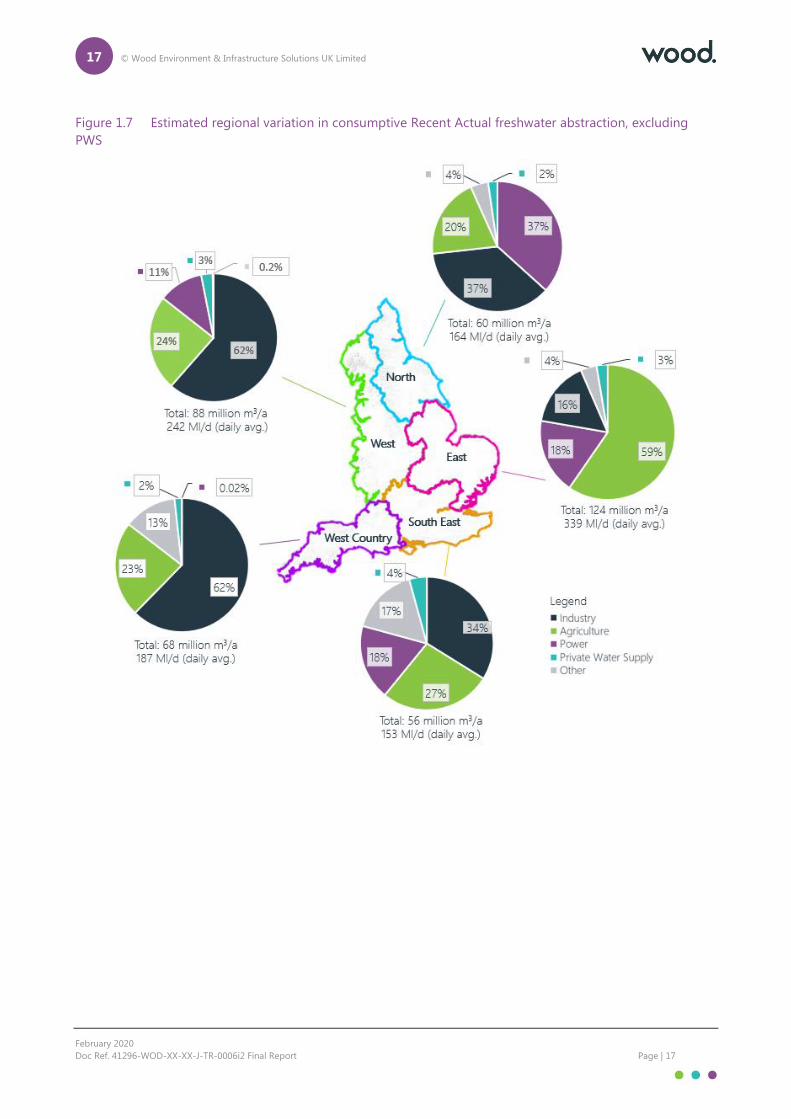
Figure 1.8 shows the national breakdown of agricultural direct abstraction. Estimated Recent Actual
consumptive freshwater agricultural abstraction in England is 138 million m3/year. Three quarters of this is for
spray irrigation.
Note, abstractions assigned to ‘other’ within the agriculture sector capture forestry, zoos, orchards, as well as
amenity uses. ‘General’ agriculture takes in a range of uses including and most likely dominated by livestock
watering – noting that a large proportion of livestock water is also sourced from mains supply.
A much smaller proportion of consumptive abstraction nationally (less than 2% combined) is represented by
abstraction for horticulture and aquaculture. It is important to recognise that some horticultural uses will
fall into the spray irrigation category (for example potato crops), and a significant proportion of covered
cropping utilises mains supply as a primary source. In England, direct abstraction for this horticultural
classification is estimated to be 439,196 m3/year. 61% of national abstraction for horticulture is found in
Water Resources South East.
Abstraction within the category “Other Agriculture” is dominated by abstractions for amenity (94%).
Amenity purposes have been grouped with agriculture here for alignment to other reported abstraction
statistics.
19 © Wood Environment & Infrastructure Solutions UK Limited
February 2020
Doc Ref. 41296-WOD-XX-XX-J-TR-0006i2 Final Report Page | 19
Figure 1.8 Estimated Consumptive Recent Actual Agricultural Abstraction – National overview (England)
20 © Wood Environment & Infrastructure Solutions UK Limited
February 2020
Doc Ref. 41296-WOD-XX-XX-J-TR-0006i2 Final Report Page | 20
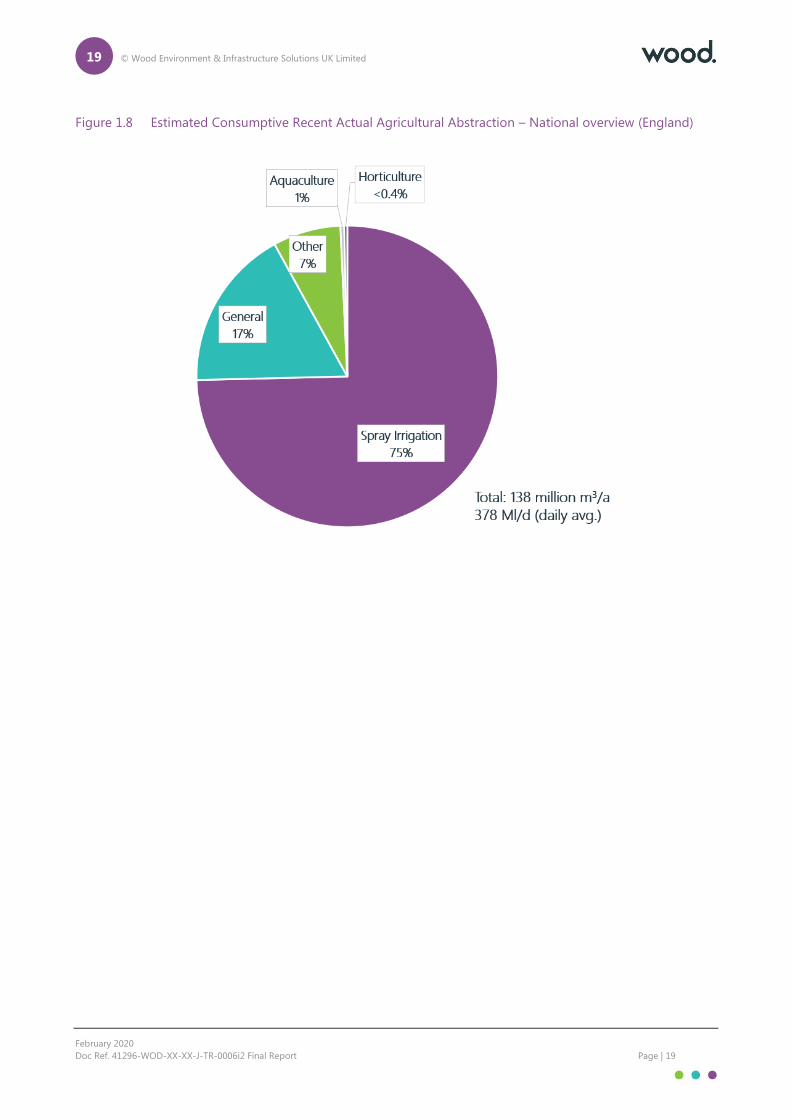
Figure 1.9 Regional variation in estimated consumptive Recent Actual agricultural abstraction
Figure 1.9 shows the breakdown of abstraction per agricultural sub-sector at a regional level. In four out of
five of the regional groups spray irrigation constitutes the highest abstraction proportion. Conversely, spray
irrigation accounts for only 8% of direct agricultural abstraction in West Country Water Resources. Over 90%
of abstractions in this regional group are assigned to either “other” agriculture or general agriculture.
Previous studies (e.g. King et al., 2006) have determined that at a national level, livestock production has a
similar annual water demand to spray irrigation, with this demand being met by a mixture of sources,
including significant contribution form mains supply. Figure 1.10 below (taken from Knox et al., 2013) shows
how the balance between livestock and irrigation demand is highly variable between regions. In this Figure

21 © Wood Environment & Infrastructure Solutions UK Limited
February 2020
Doc Ref. 41296-WOD-XX-XX-J-TR-0006i2 Final Report Page | 21
we see that demand for irrigated cropping only exceeds that of livestock production in the Environment
Agency’s former Anglian region (falling within Water Resources East).
The primary datasets presented here, based on the WRGIS and Environment Agency information relating to
abstraction purpose, limits our ability to reflect livestock demand in its own right. Considering the intention
for this work to support the developing Water Resources National Framework, this is viewed as a data
limitation worthy of further attention.
Figure 1.10 Total Volumetric water demand (Million m3) for agriculture, by sub-sector, by EA region (Knox et
al., 2013)
Seasonal variation in spray irrigation
Perhaps of greater significance for agriculture than other water-using sectors, water use varies significantly
through the year and links to prevailing water availability are highly variable both between years and within
years. Data held within the WRGIS is limited in its ability to represent peak periods of demand. During short
periods in some catchments, water demand for irrigated agriculture can increase dramatically, surpassing
demand from other users including public water supply. As greater collaboration between water companies
and other sectors increases, it is expected that these critical periods will become increasing important in
water resources and catchment planning.
The WRGIS can tell us something about season variation in irrigation demand in relation to the distinction
between the licence purpose codes:
Spray irrigation Direct – abstraction during the traditional irrigation season for direct application to
crops and land;
Spray Irrigation Storage – abstraction typically during the autumn and winter months for reservoir
storage and later use during the following growing season. Many factors influence an individual or
group of growers’ decisions to invest in storage (e.g. licence constraints, water availability, cost).
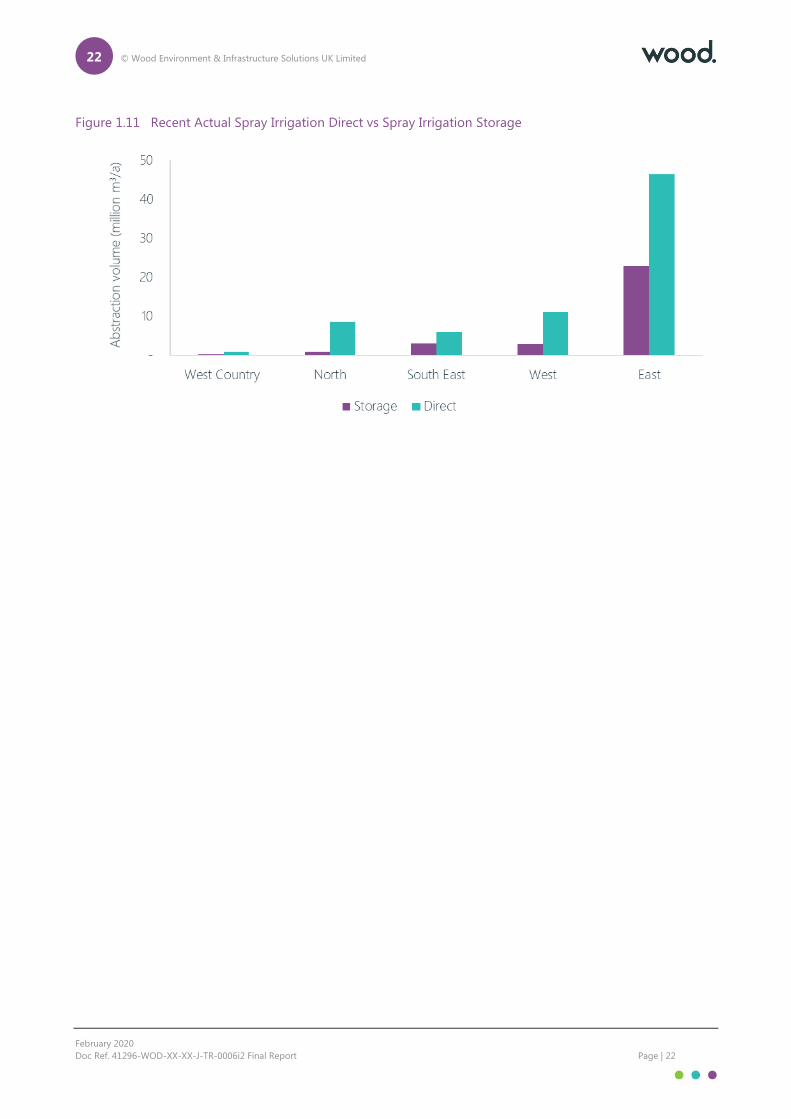
At a national level, 29% of Recent Actual abstractions for spray irrigation are for storage and subsequent use
during the irrigation season. This percentage varies between regions, from 9% in Water Resources North to
33% in both Water Resources South East and Water Resources East.
22 © Wood Environment & Infrastructure Solutions UK Limited
February 2020
Doc Ref. 41296-WOD-XX-XX-J-TR-0006i2 Final Report Page | 22
Figure 1.11 Recent Actual Spray Irrigation Direct vs Spray Irrigation Storage
23 © Wood Environment & Infrastructure Solutions UK Limited
February 2020
Doc Ref. 41296-WOD-XX-XX-J-TR-0006i2 Final Report Page | 23
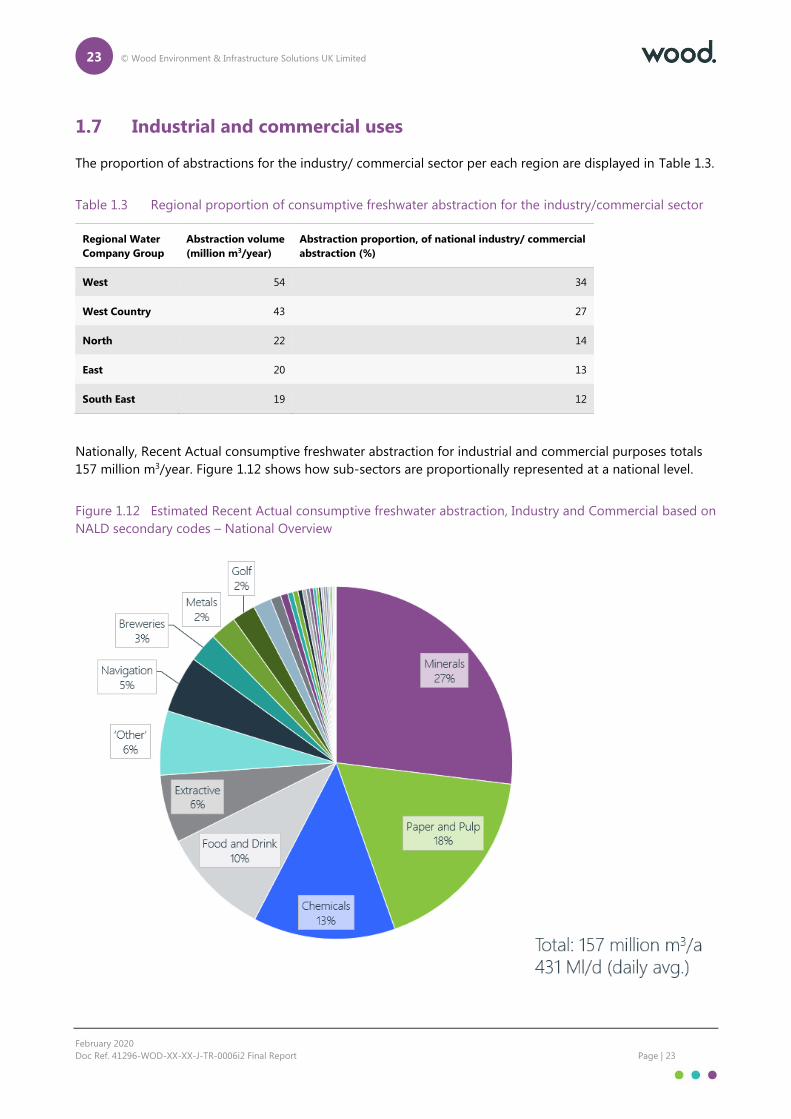
1.7 Industrial and commercial uses
The proportion of abstractions for the industry/ commercial sector per each region are displayed in Table 1.3.
Table 1.3 Regional proportion of consumptive freshwater abstraction for the industry/commercial sector
Regional Water
Company Group
Abstraction volume
(million m3/year)
Abstraction proportion, of national industry/ commercial
abstraction (%)
West 54 34
West Country 43 27
North 22 14
East 20 13
South East 19 12
Nationally, Recent Actual consumptive freshwater abstraction for industrial and commercial purposes totals
157 million m3/year. Figure 1.12 shows how sub-sectors are proportionally represented at a national level.
Figure 1.12 Estimated Recent Actual consumptive freshwater abstraction, Industry and Commercial based on
NALD secondary codes – National Overview

24 © Wood Environment & Infrastructure Solutions UK Limited
February 2020
Doc Ref. 41296-WOD-XX-XX-J-TR-0006i2 Final Report Page | 24
Figure 1.12 above demonstrates the wide range of sub-sectors captured within the high-level
industrial/commercial category. Note that due to the number of sub-categories, not all have been labelled.
At a national level, 6% of Recent Actual abstraction is unclassified and falls under the category of ‘other’
(code OTI) industry. Data presented here has benefitted from a rapid review of tertiary National Abstraction
Licensing Database (NALD) use codes and licence holder details to improve upon existing datasets. Prior to
this exercise, 22% of industrial abstractions by volume, we assigned to the “other” category. The rapid review
allowed many abstractions within the WRGIS to be re-assigned to representative sub-sectors. These re-
assignments have been carried out for the purposes of this project only in order to gain a better
understanding of the regional distribution of water-using sectors and their demand. The changes have not
been assimilated into the Environment Agency’s official licence database.
The largest consumptive water user in the industry and commercial sector on a national scale is for the
production of mineral products (code MIN - water used in mineral-based products e.g. bricks, glass, tiles,
concrete etc). If this is combined with the closely related extractive industry (code EXT), this accounts for
approximately 33% of consumptive freshwater abstraction within the industrial and commercial category.
Abstraction for the paper and pulp sub-sector (code PAP) accounts for 18% of national abstraction within the
industrial/commercial group.
Overall, the food and drink sector (code FAD) generates around 10% of national abstraction within the
industrial/commercial group. Furthermore, if breweries (code BRW) and dairies (code DAR) are included
along with food and drink manufacturing this would total 13%.
These sectors, or at least their respective consumptive freshwater demands, are by no means evenly spread
across the country as shown in Figure 1.13.
25 © Wood Environment & Infrastructure Solutions UK Limited
February 2020
Doc Ref. 41296-WOD-XX-XX-J-TR-0006i2 Final Report Page | 25
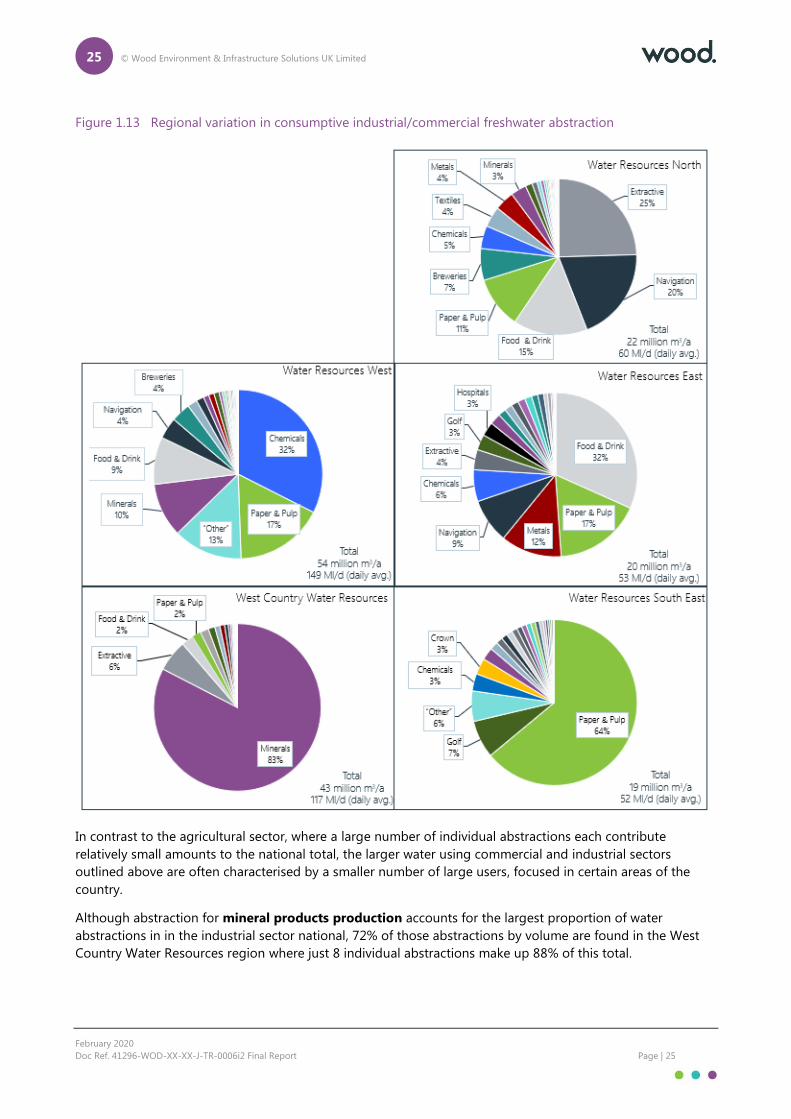
Figure 1.13 Regional variation in consumptive industrial/commercial freshwater abstraction
In contrast to the agricultural sector, where a large number of individual abstractions each contribute
relatively small amounts to the national total, the larger water using commercial and industrial sectors
outlined above are often characterised by a smaller number of large users, focused in certain areas of the
country.
Although abstraction for mineral products production accounts for the largest proportion of water
abstractions in in the industrial sector national, 72% of those abstractions by volume are found in the West
Country Water Resources region where just 8 individual abstractions make up 88% of this total.
26 © Wood Environment & Infrastructure Solutions UK Limited
February 2020
Doc Ref. 41296-WOD-XX-XX-J-TR-0006i2 Final Report Page | 26
Within the paper and pulp manufacturing sector, 30 abstractions constitute 80% of total consumptive water
use. 44% of the sector’s consumptive demand is in Water Resources South East (focused in the Thames River
Basin District), and 33% in Water Resources West (focused in the North West).
Although a relatively small contributor to national water demand (2%), the metals manufacturing sector is
focused in the north east of the country (Humber RBD), split between Water Resources East (62%) and Water
Resources North (24%) Just 18 individual abstractions make up 90% of the national water demand for this
sector.
The chemicals manufacturing sector is focused on two locations – the north west around Merseyside,
Runcorn and Manchester, and around Bristol and Avonmouth. A cluster of pesticide and pharmaceutical
manufacturers is also found in East Anglia, while plastics manufacturing is concentrated in the south along
the Thames corridor and London, and in Kent. 85% of consumptive freshwater demand is sourced in the
Water Resources West.
Consumptive freshwater abstraction associated with the food and drink sector is more evenly spread
amongst a larger number of diverse water users. In contrast to other industries consisting of a smaller
number of large users, 85 individual abstractions make up 70% of the national total of consumptive
freshwater abstraction in the food and drink sector, and there are in excess of 900 licences in total. 36% and
31% of abstraction by volume are within Water Resources West and Water Resources East respectively. The
brewing sub-sector is focused in Water Resources North (34%) and Water Resources West (48%), while the
majority of direct abstraction for dairies is found in Water Resources West (75%) and West Country Water
Resources (18%) coinciding with areas responsible for livestock production. The diversity in this sector and
the number of users, poses an additional challenge in characterising water demand now and in the future.
Certainly, worth of note is the navigation sector (canals and waterways), which represents the second largest
consumptive user (based on the approach adopted here) in the Water Resources North region. Significant,
but smaller volumes of abstraction are also associated within this purpose in Water Resources West and East.
The data here for the navigation sector represents licensed abstractions. As the Environment Agency’s New
Authorisations work (following the Water Act 2003) progresses for previously exempt abstractions, it is
expected that these figures will increase as more is understood. The same will be true in the extractive
industry (albeit more likely to be non-consumptive) and through previously exempt trickle irrigation in the
agricultural sector.
27 © Wood Environment & Infrastructure Solutions UK Limited
February 2020
Doc Ref. 41296-WOD-XX-XX-J-TR-0006i2 Final Report Page | 27
2. Sub-sector prioritisation
The wide variety in water uses between, and even within sectors outside of the water industry means it is
infeasible and beyond the scope of this project, to carry out detailed review of every sector and yield valuable
insights. The sections above highlighted the fact that on a national scale, and more so at a regional level, a
relatively small sub-set of water-using sectors make up a large proportion of overall baseline freshwater non-
public water supply abstraction. This project’s scope allowed for the prioritisation of a small number of water-
using sub-sectors with the intention that significant improvements to the knowledge base, or at least wider
cross-sectoral awareness of the current state of knowledge, could be made while still covering a large portion
of baseline water use.
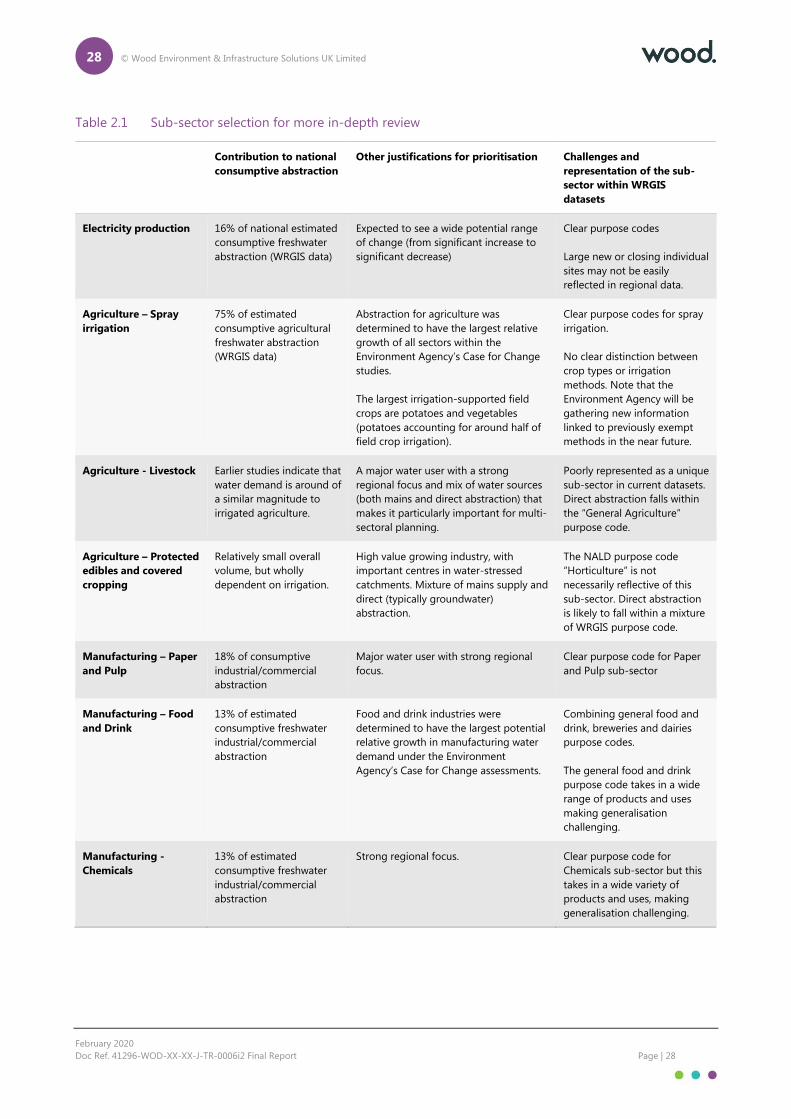
Three sectors, broken into 7 sub-sectors were identified early in this project for further review as shown in
Table 2.1. These were identified following an initial literature review and consultation with this project’s
steering group. Drawing on available literature and data, and targeted stakeholder engagement, each of
these 7 sub-sectors is described in more detail in dedicated sections later in this report presenting a view of
the key factors affecting water use currently and, in the future, along with knowledge gaps and uncertainties.
Agriculture:
Spray irrigation
Livestock
Protected edibles/Covered cropping
Industry/Manufacturing:
Paper and pulp
Chemicals manufacturing
Food and drink
Electricity generation
Combined, these 7 sub-sectors are estimated to account for in excess of 60% of consumptive freshwater
direct abstraction arising from outside the water industry, nationally.
Other sub-sectors worthy of further review, but beyond the direct scope of this project include:
Minerals and extractive industries
Metals manufacturing
Private water supply
Navigation
28 © Wood Environment & Infrastructure Solutions UK Limited
February 2020
Doc Ref. 41296-WOD-XX-XX-J-TR-0006i2 Final Report Page | 28
Table 2.1 Sub-sector selection for more in-depth review
Contribution to national
consumptive abstraction
Other justifications for prioritisation Challenges and
representation of the sub-
sector within WRGIS
datasets
Electricity production 16% of national estimated
consumptive freshwater
abstraction (WRGIS data)
Expected to see a wide potential range
of change (from significant increase to
significant decrease)
Clear purpose codes
Large new or closing individual
sites may not be easily
reflected in regional data.
Agriculture – Spray
irrigation
75% of estimated
consumptive agricultural
freshwater abstraction
(WRGIS data)
Abstraction for agriculture was
determined to have the largest relative
growth of all sectors within the
Environment Agency’s Case for Change
studies.
The largest irrigation-supported field
crops are potatoes and vegetables
(potatoes accounting for around half of
field crop irrigation).
Clear purpose codes for spray
irrigation.
No clear distinction between
crop types or irrigation
methods. Note that the
Environment Agency will be
gathering new information
linked to previously exempt
methods in the near future.
Agriculture - Livestock Earlier studies indicate that
water demand is around of
a similar magnitude to
irrigated agriculture.
A major water user with a strong
regional focus and mix of water sources
(both mains and direct abstraction) that
makes it particularly important for multi-
sectoral planning.
Poorly represented as a unique
sub-sector in current datasets.
Direct abstraction falls within
the “General Agriculture”
purpose code.
Agriculture – Protected
edibles and covered
cropping
Relatively small overall
volume, but wholly
dependent on irrigation.
High value growing industry, with
important centres in water-stressed
catchments. Mixture of mains supply and
direct (typically groundwater)
abstraction.
The NALD purpose code
“Horticulture” is not
necessarily reflective of this
sub-sector. Direct abstraction
is likely to fall within a mixture
of WRGIS purpose code.
Manufacturing – Paper
and Pulp
18% of consumptive
industrial/commercial
abstraction
Major water user with strong regional
focus.
Clear purpose code for Paper
and Pulp sub-sector
Manufacturing – Food
and Drink
13% of estimated
consumptive freshwater
industrial/commercial
abstraction
Food and drink industries were
determined to have the largest potential
relative growth in manufacturing water
demand under the Environment
Agency’s Case for Change assessments.
Combining general food and
drink, breweries and dairies
purpose codes.
The general food and drink
purpose code takes in a wide
range of products and uses
making generalisation
challenging.
Manufacturing -
Chemicals
13% of estimated
consumptive freshwater
industrial/commercial
abstraction
Strong regional focus. Clear purpose code for
Chemicals sub-sector but this
takes in a wide variety of
products and uses, making
generalisation challenging.
29 © Wood Environment & Infrastructure Solutions UK Limited
February 2020
Doc Ref. 41296-WOD-XX-XX-J-TR-0006i2 Final Report Page | 29
3. Future changes in water demand
Quantifying change in demand out to 2050
A key aim of this project is to collate datasets reflecting abstraction growth (or decrease) projections out to
2050. The project steering group agreed that the primary vehicle for utilisation of such datasets in the first
iteration of the Water Resources National Framework in 2019 would be the Environment Agency’s Water
Resources GIS (WRGIS). The majority of our prioritised sub-sectors are well defined within abstraction
datasets held within the WRGIS according to licence purpose codes assigned when an abstraction licence is
issued. This is true of spray irrigation, electricity production, chemicals manufacturing, paper and pulp
manufacturing and food a drinks manufacturing.
Previous projects exploring future non-water industry demand (e.g. the Case for Change) have generated
“Growth Factors” that represent simple proportional increases to each individual abstraction’s Recent Actual
abstraction record within the WRGIS according to their purpose defined by their sub-sector. When applied,
these have the effect of generating a scenario within the WRGIS with an increased, or decreased abstraction
that can then be used to carry out a range of national or catchment-scale assessments by the Environment
Agency.
Generating Growth Factors is not necessarily straight forward since water demand within each sub-sector,
and indeed for individual users, depends on a multitude of factors including water availability, product
market forces, economics, policy and regulation. Typically, work to develop future projections of water
demand frames assessments against a range of plausible future scenarios with associated qualitative
narratives setting out how environmental or socio-political drivers might change. These socio-economic
scenarios allow the impacts of changing pressures to be explored across different sectors in a structured and
consistent way and the differences between each scenario to be assessed – presenting a range of plausible
outcomes.
Some of the sub-sectors prioritised in the previous section have undergone assessment of this type before,
but the data and assumptions behind that work has not recently been updated in all cases or at the correct
scale. Environmental, economic, social and political drivers change in ways that aren’t easily predictable
(hence the need to review a range of scenarios) and they interact to affect outcomes in complex ways.
Therefore, it is highly likely that any single Growth Factor developed at one point in time will ultimately
require adjustment.
This project follows a similar approach to work that has gone before it in projecting (and attempting to
quantify) future demand across a range of sectors. This is described in more detail in Section 0.
The work that leads to that assessment follows in a series of “sector summaries” in which water demand for
each sub-sector is explored along with the key potential drivers for future change that can be assessed as
part of a scenario-based analysis.
Water company non-household demand forecasts
At this stage it is important to reiterate that fact that this project is focused on direct abstraction. Section 1.2
briefly explained that water companies supply a large volume of water to non-household users in addition to
household customers. While water companies do not use the same system of sector categorisation as the
Environment Agency’s licensing database (more often using Standard Industry Classification, SIC, codes to
perform analyses), in many cases sectors benefiting from water company mains supply also derive a portion
of their overall national water use from direct abstraction.
30 © Wood Environment & Infrastructure Solutions UK Limited
February 2020
Doc Ref. 41296-WOD-XX-XX-J-TR-0006i2 Final Report Page | 30
This presents a challenge when comparing information developed through projects such as this (using
Environment Agency data and a driver-pressure-state-impact approach to projecting demand) with non-
household demand forecasts from water companies. Non-household forecasts developed by water
companies use regression analysis to identify correlations between variables for which historic data and
national forecasts are widely available (e.g. population forecasts, economic output forecasts) and water
demand. Correlating historic demand with these variables allows a forecast to be developed using the
explanatory variables, often obtaining a lower, central and upper forecast or a range of uncertainty, rather
than adopting an approach in which contrasting socio-economic scenarios are used. This aligns with the
water companies’ needs in that trajectories of change need to be assessed within uncertainty bounds. An
attempt to align with this approach, while still allowing a thorough understanding of key drivers affecting
each sector through scenarios is explored in Section 0.
For most companies, trajectories for non-household demand within the planning period of the latest round
of Water Resource Management Plans (2019 - WRMP19) are expected to be relatively flat, with only a small
projected increase or decrease over the planning period (less than 5%). Southern Water indicated a more
pronounced increase in non-household demand in their draft WRMP19 along with Essex and Suffolk Water.
Wessex Water forecasts showed the most significant reduction in non-household demand to 2044/45 in their
draft WRMP19.
31 © Wood Environment & Infrastructure Solutions UK Limited
February 2020
Doc Ref. 41296-WOD-XX-XX-J-TR-0006i2 Final Report Page | 31
4. Sector summaries
The following sections take each of the selected prioritised sub-sectors in turn, providing a reference to
support cross-sectoral planning in water resources through improved understanding. Each section has been
developed following an up to date literature review (through Rapid Evidence Assessment (REA) and
enhanced by targeted stakeholder engagement within representatives from each sector to collate:
an overview of the sub-sector in the context of its water demand and use;
an overview of the geographic distribution of the sub-sector;
an overview of the key factors affecting water demand;
where evidence exists, insights into the likely drivers of change in water demand in the future;
where evidence exists, an indication of the potential change in future water demand, and
significant uncertainties and knowledge gaps.
These sector summaries seek to bring together existing evidence and intelligence from a variety of sources
that can be used to inform a view on possible future water demand and therefore the pressures that regions
may need to address over the coming decades. Where evidence is unavailable or where there are important
gaps in current knowledge, these are made clear so that regional groups or the sub-sectors themselves may
seek to fill them.
32 © Wood Environment & Infrastructure Solutions UK Limited
February 2020
Doc Ref. 41296-WOD-XX-XX-J-TR-0006i2 Final Report Page | 32
5. Sector summary: Spray irrigation
5.1 Sub-sector overview
The spray irrigation1 sub-sector of Agriculture comprises irrigation of outdoor crops and grass. In England,
irrigation is used to supplement rainfall during the summer. As such, the highest demand for spray irrigation
is in the drier parts of England and where crops that are sensitive to water stress are grown. The theoretical
demand varies from year to year, according to summer weather, notably rainfall. However, in a dry summer,
many farmers apply less water than the theoretical optimum either because they have insufficient equipment
and/or water resource constraints (limited by licensed conditions on peak rates), or simply to reduce costs
(the agronomic optimum does not always equate to the economic optimum).
5.2 Water use within the sub-sector
Most water for spray irrigation is used to supplement rainfall on potatoes (54%) and outdoor field vegetables
(e.g. carrots, onions, parsnips and salad crops) (31%) but some water is used on soft fruit (e.g. strawberries)
and orchard fruit (e.g. apples, pears), sugar beet and, occasionally, cereals and grass (Defra, 2011). A small
amount (~1% of all abstraction for spray irrigation) is used in the winter for frost-protection on outdoor fruit
(Knox et.al., 2018a).
Actual abstractions vary from year to year according to the weather, but average water demand for spray
irrigation (2005 – 2010)2 was estimated at 82 Million m3/year, peaking at 110 Million m3 in 2010 (Knox et al.,
2015). Theoretical demand (Rey et. al., 2016) in 2010 was estimated at 200 Million m3 but abstraction
restrictions and equipment limitations may have constrained the actual abstraction.
There has been an underlying downward trend in irrigation abstractions since 1990, due possibly to tighter
licence conditions, increased costs of irrigation (rising energy costs), increased efficiency and changes in
cropping (Knox et al., 2015b). For example, consumption of fresh potatoes in the UK halved between 1981
and 2010 (Hess et. al., 2016) and this was accompanied by a similar reduction in the area of potatoes and
therefore, reduced demand for irrigation water (Knox et al., 2015).
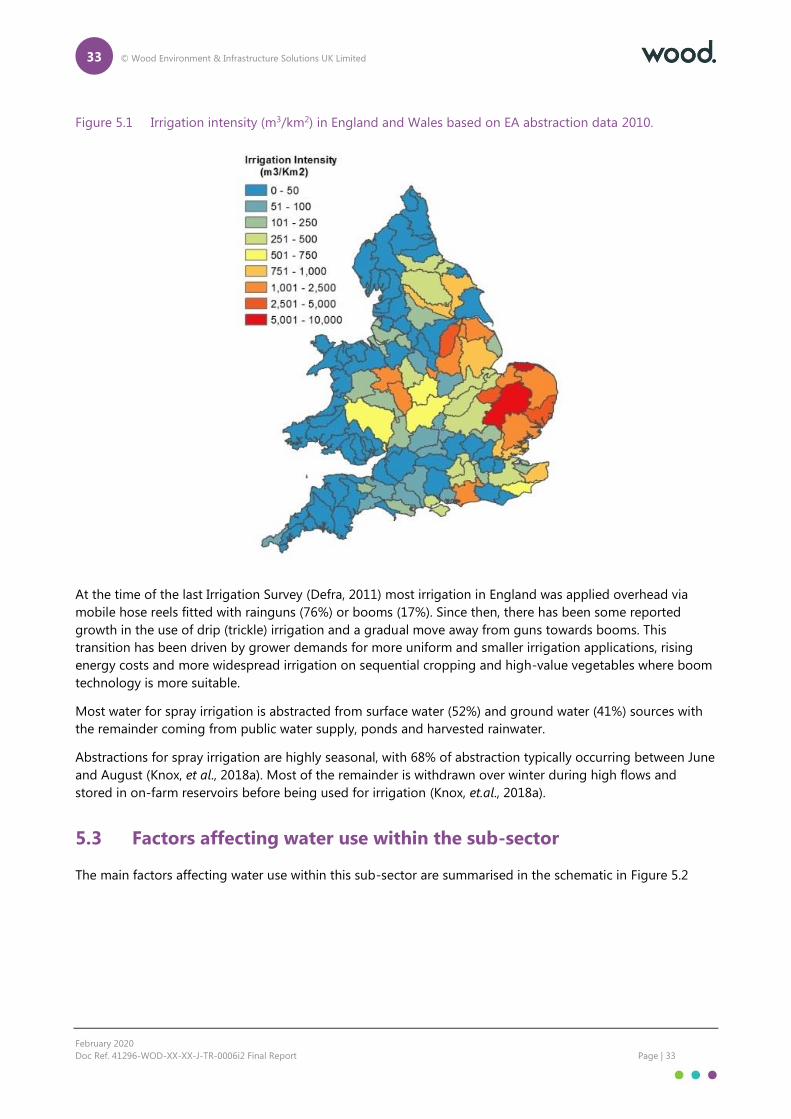
Actual water use is highest in East Anglia and Lincolnshire, with pockets of high demand in the East and West
Midlands and South East England (Figure 5.1).
1 The term ‘spray irrigation’ is used due to historical licensing reasons, but here is used to include all forms of outdoor
irrigation, including drip/trickle irrigation. 2 Although these figures are for England & Wales, 99% of the spray irrigation use is in England2
33 © Wood Environment & Infrastructure Solutions UK Limited
February 2020
Doc Ref. 41296-WOD-XX-XX-J-TR-0006i2 Final Report Page | 33
Figure 5.1 Irrigation intensity (m3/km2) in England and Wales based on EA abstraction data 2010.
At the time of the last Irrigation Survey (Defra, 2011) most irrigation in England was applied overhead via
mobile hose reels fitted with rainguns (76%) or booms (17%). Since then, there has been some reported
growth in the use of drip (trickle) irrigation and a gradual move away from guns towards booms. This
transition has been driven by grower demands for more uniform and smaller irrigation applications, rising
energy costs and more widespread irrigation on sequential cropping and high-value vegetables where boom
technology is more suitable.
Most water for spray irrigation is abstracted from surface water (52%) and ground water (41%) sources with
the remainder coming from public water supply, ponds and harvested rainwater.
Abstractions for spray irrigation are highly seasonal, with 68% of abstraction typically occurring between June
and August (Knox, et al., 2018a). Most of the remainder is withdrawn over winter during high flows and
stored in on-farm reservoirs before being used for irrigation (Knox, et.al., 2018a).
5.3 Factors affecting water use within the sub-sector
The main factors affecting water use within this sub-sector are summarised in the schematic in Figure 5.2
34 © Wood Environment & Infrastructure Solutions UK Limited
January 2020
Doc Ref. 41296-WOD-XX-XX-J-TR-0006 Final Report Page | 34
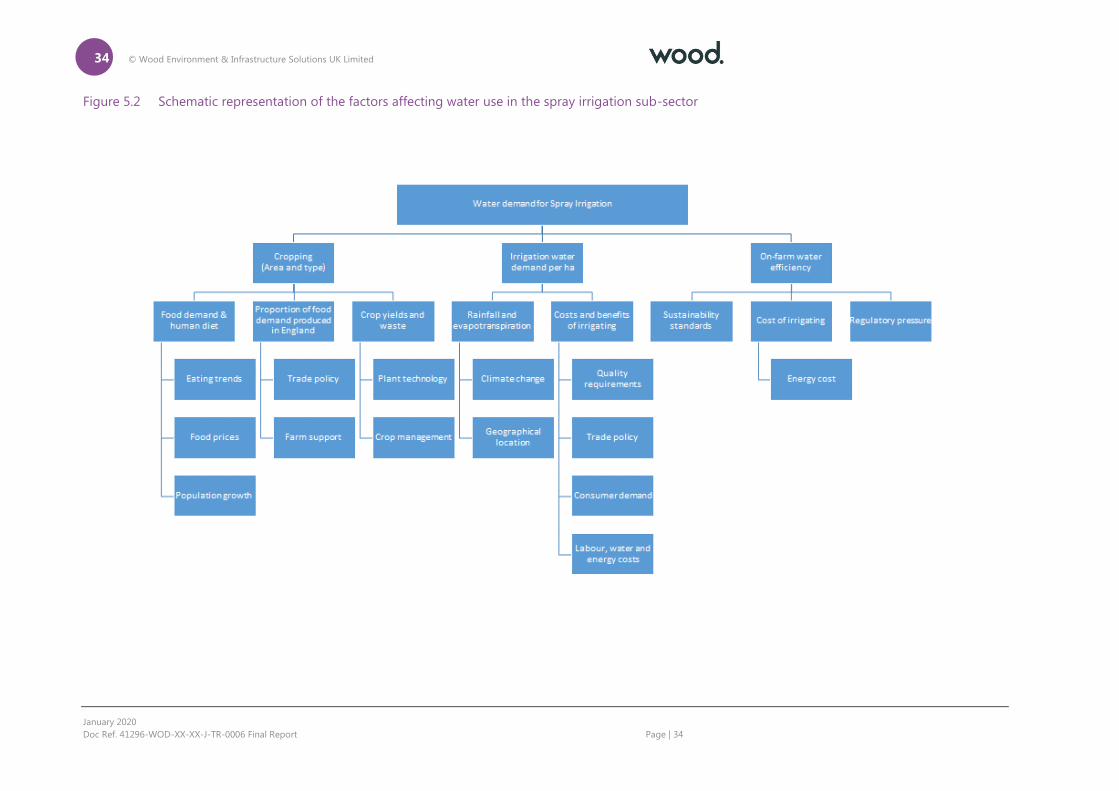
Figure 5.2 Schematic representation of the factors affecting water use in the spray irrigation sub-sector
35 © Wood Environment & Infrastructure Solutions UK Limited
January 2020
Doc Ref. 41296-WOD-XX-XX-J-TR-0006 Final Report Page | 35
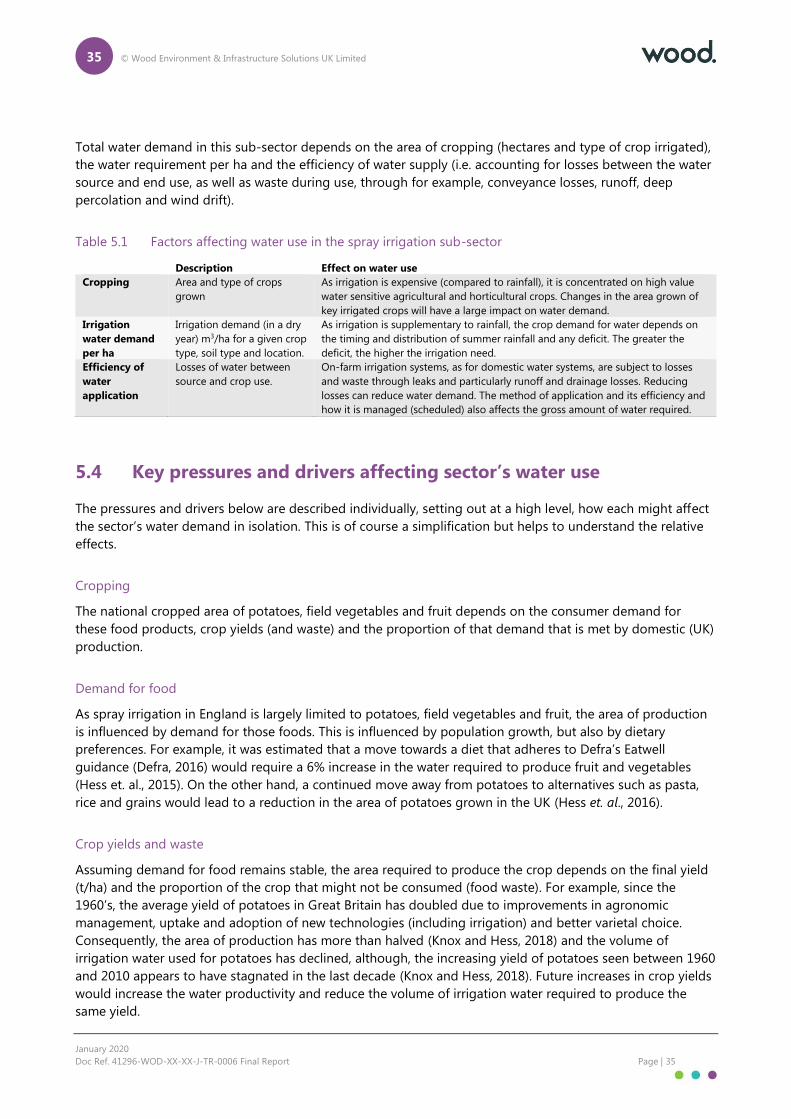
Total water demand in this sub-sector depends on the area of cropping (hectares and type of crop irrigated),
the water requirement per ha and the efficiency of water supply (i.e. accounting for losses between the water
source and end use, as well as waste during use, through for example, conveyance losses, runoff, deep
percolation and wind drift).
Table 5.1 Factors affecting water use in the spray irrigation sub-sector
Description Effect on water use
Cropping Area and type of crops
grown
As irrigation is expensive (compared to rainfall), it is concentrated on high value
water sensitive agricultural and horticultural crops. Changes in the area grown of
key irrigated crops will have a large impact on water demand.
Irrigation
water demand
per ha
Irrigation demand (in a dry
year) m3/ha for a given crop
type, soil type and location.
As irrigation is supplementary to rainfall, the crop demand for water depends on
the timing and distribution of summer rainfall and any deficit. The greater the
deficit, the higher the irrigation need.
Efficiency of
water
application
Losses of water between
source and crop use.
On-farm irrigation systems, as for domestic water systems, are subject to losses
and waste through leaks and particularly runoff and drainage losses. Reducing
losses can reduce water demand. The method of application and its efficiency and
how it is managed (scheduled) also affects the gross amount of water required.
5.4 Key pressures and drivers affecting sector’s water use
The pressures and drivers below are described individually, setting out at a high level, how each might affect
the sector’s water demand in isolation. This is of course a simplification but helps to understand the relative
effects.
Cropping
The national cropped area of potatoes, field vegetables and fruit depends on the consumer demand for
these food products, crop yields (and waste) and the proportion of that demand that is met by domestic (UK)
production.
Demand for food
As spray irrigation in England is largely limited to potatoes, field vegetables and fruit, the area of production
is influenced by demand for those foods. This is influenced by population growth, but also by dietary
preferences. For example, it was estimated that a move towards a diet that adheres to Defra’s Eatwell
guidance (Defra, 2016) would require a 6% increase in the water required to produce fruit and vegetables
(Hess et. al., 2015). On the other hand, a continued move away from potatoes to alternatives such as pasta,
rice and grains would lead to a reduction in the area of potatoes grown in the UK (Hess et. al., 2016).
Crop yields and waste
Assuming demand for food remains stable, the area required to produce the crop depends on the final yield
(t/ha) and the proportion of the crop that might not be consumed (food waste). For example, since the
1960’s, the average yield of potatoes in Great Britain has doubled due to improvements in agronomic
management, uptake and adoption of new technologies (including irrigation) and better varietal choice.
Consequently, the area of production has more than halved (Knox and Hess, 2018) and the volume of
irrigation water used for potatoes has declined, although, the increasing yield of potatoes seen between 1960
and 2010 appears to have stagnated in the last decade (Knox and Hess, 2018). Future increases in crop yields
would increase the water productivity and reduce the volume of irrigation water required to produce the
same yield.

36 © Wood Environment & Infrastructure Solutions UK Limited
February 2020
Doc Ref. 41296-WOD-XX-XX-J-TR-0006i2 Final Report Page | 36
Fresh vegetables and salads comprise 28% of wasted food and drink in the UK (Wrap, 2019). Reducing food
waste between ‘farm and fork’ would be equivalent to increasing crop yields and would reduce the water
required to produce a given volume of crop.
Proportion of demand met by domestic production
Sector stakeholders consulted by Knox et al. (2018) suggested that agro-economic policy drivers were mostly
responsible for shaping the agricultural landscape, and were thus the dominant force impacting on future
changes in water demand including the magnitude and direction of any change (Knox et al., 2018a). Most
(94%) of fresh potatoes consumed in the UK are produced locally, whereas 90% of the fruit, and half of the
vegetables are imported (Hess and Sutcliffe, 2018). Therefore, if a greater proportion of UK fruit and
vegetables were produced locally it is likely that demand for irrigation would increase. At present, farm
support and trade policy are aligned with the European Union. The UK’s departure from the EU may directly
affect the profitability of potato and vegetable farming and therefore water demand through changes in farm
support, access to labour, costs of production and trade policy (including import tariffs). The Agricultural and
Horticultural Development Board (AHDB, 2017) considered the potential impacts of plausible scenarios
following the official UK departure from the EU (post-Brexit scenarios) on production and farm incomes.
Presently, a significant proportion of processed potato products are imported from the EU. Under a scenario
where the policy and regulatory framework remain close to the status quo or there was a free-trade
agreement with the EU there would be little change. However, under a World Trade Organization (WTO)
default scenario, domestic production would increase due to the increased cost of imports AHDB (2017). For
vegetables, a scenario close to the status quo would see an increase in horticultural farm incomes, but other
scenarios see a decline in profitability due to increased labour costs (AHDB 2017) which may lead to a
reduction in domestic production.
Irrigation water demand per ha
The theoretical irrigation requirement is based on the calculated agronomic water requirements of the crops
that are irrigated, assuming they are correctly irrigated following typical scheduling recommendations.
In contrast, actual irrigation demand is based on the gross depths farmers actually apply, as reported for
example, in the EA NALD water abstraction returns and Defra Irrigation Survey data. It therefore reflects
directly the irrigation practices that farmers find realistic, and includes the effects of equipment constraints,
historical water shortages, scheduling errors, and the farmers’ scheduling assumptions on irrigation losses.
The key drivers and pressures therefore relate to:
changes in agroclimate (due to increased weather uncertainty and climate change),
the impacts of changing quality assurance requirements which influence irrigation scheduling
decisions,
decisions linked to crop rotations to maintain soil fertility,
abstraction licensing reforms (which impact on actual irrigation abstractions).
Climate
The latest climate projections for the UK (UKCP18) (UKMO, 2019) has projected an increased chance of
hotter, drier summers; an increased frequency and intensity of extremes; and increased drought risk (Watts et
al., 2016). This would have direct impacts on the future demand for irrigation in two ways: lower rainfall and
increased temperatures would increase irrigation demand on crops that are presently irrigated (changes in
the summer balance between rainfall and ET), but also, crops that are presently rain fed may need
supplemental irrigation in the future.
37 © Wood Environment & Infrastructure Solutions UK Limited
February 2020
Doc Ref. 41296-WOD-XX-XX-J-TR-0006i2 Final Report Page | 37
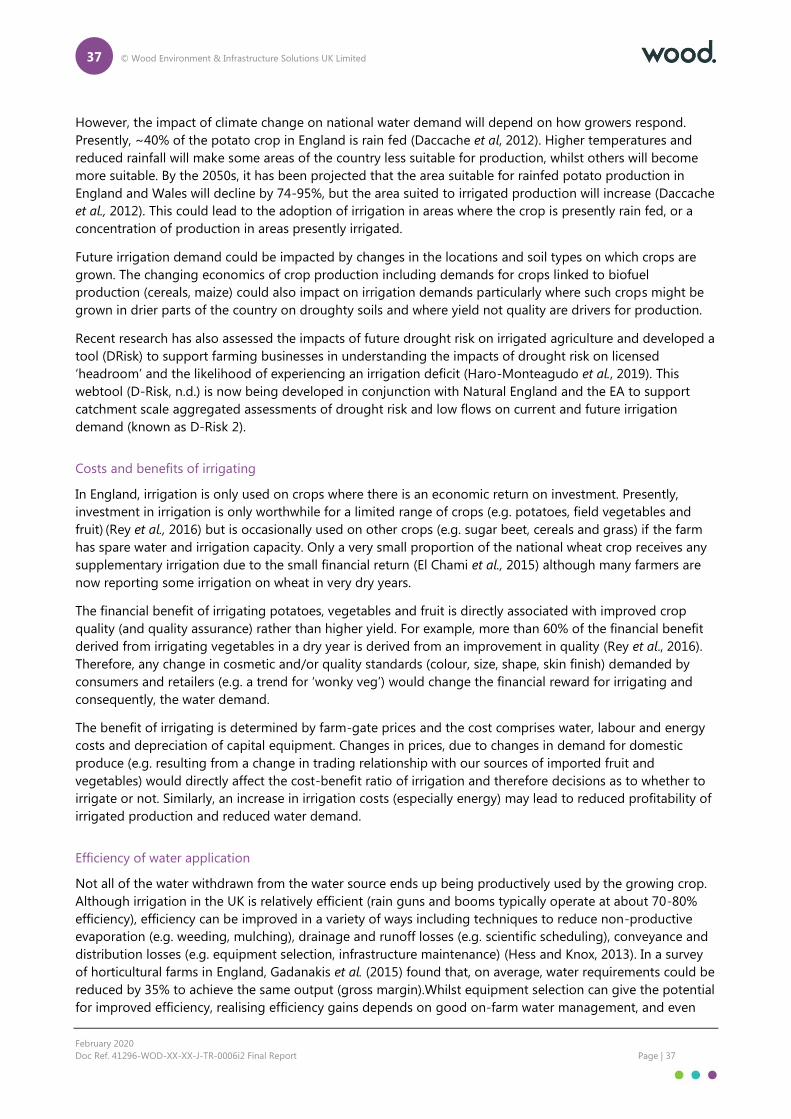
However, the impact of climate change on national water demand will depend on how growers respond.
Presently, ~40% of the potato crop in England is rain fed (Daccache et al, 2012). Higher temperatures and
reduced rainfall will make some areas of the country less suitable for production, whilst others will become
more suitable. By the 2050s, it has been projected that the area suitable for rainfed potato production in
England and Wales will decline by 74-95%, but the area suited to irrigated production will increase (Daccache
et al., 2012). This could lead to the adoption of irrigation in areas where the crop is presently rain fed, or a
concentration of production in areas presently irrigated.
Future irrigation demand could be impacted by changes in the locations and soil types on which crops are
grown. The changing economics of crop production including demands for crops linked to biofuel
production (cereals, maize) could also impact on irrigation demands particularly where such crops might be
grown in drier parts of the country on droughty soils and where yield not quality are drivers for production.
Recent research has also assessed the impacts of future drought risk on irrigated agriculture and developed a
tool (DRisk) to support farming businesses in understanding the impacts of drought risk on licensed
‘headroom’ and the likelihood of experiencing an irrigation deficit (Haro-Monteagudo et al., 2019). This
webtool (D-Risk, n.d.) is now being developed in conjunction with Natural England and the EA to support
catchment scale aggregated assessments of drought risk and low flows on current and future irrigation
demand (known as D-Risk 2).
Costs and benefits of irrigating
In England, irrigation is only used on crops where there is an economic return on investment. Presently,
investment in irrigation is only worthwhile for a limited range of crops (e.g. potatoes, field vegetables and
fruit) (Rey et al., 2016) but is occasionally used on other crops (e.g. sugar beet, cereals and grass) if the farm
has spare water and irrigation capacity. Only a very small proportion of the national wheat crop receives any
supplementary irrigation due to the small financial return (El Chami et al., 2015) although many farmers are
now reporting some irrigation on wheat in very dry years.
The financial benefit of irrigating potatoes, vegetables and fruit is directly associated with improved crop
quality (and quality assurance) rather than higher yield. For example, more than 60% of the financial benefit
derived from irrigating vegetables in a dry year is derived from an improvement in quality (Rey et al., 2016).
Therefore, any change in cosmetic and/or quality standards (colour, size, shape, skin finish) demanded by
consumers and retailers (e.g. a trend for ‘wonky veg’) would change the financial reward for irrigating and
consequently, the water demand.
The benefit of irrigating is determined by farm-gate prices and the cost comprises water, labour and energy
costs and depreciation of capital equipment. Changes in prices, due to changes in demand for domestic
produce (e.g. resulting from a change in trading relationship with our sources of imported fruit and
vegetables) would directly affect the cost-benefit ratio of irrigation and therefore decisions as to whether to
irrigate or not. Similarly, an increase in irrigation costs (especially energy) may lead to reduced profitability of
irrigated production and reduced water demand.
Efficiency of water application
Not all of the water withdrawn from the water source ends up being productively used by the growing crop.
Although irrigation in the UK is relatively efficient (rain guns and booms typically operate at about 70-80%
efficiency), efficiency can be improved in a variety of ways including techniques to reduce non-productive
evaporation (e.g. weeding, mulching), drainage and runoff losses (e.g. scientific scheduling), conveyance and
distribution losses (e.g. equipment selection, infrastructure maintenance) (Hess and Knox, 2013). In a survey
of horticultural farms in England, Gadanakis et al. (2015) found that, on average, water requirements could be
reduced by 35% to achieve the same output (gross margin).Whilst equipment selection can give the potential
for improved efficiency, realising efficiency gains depends on good on-farm water management, and even
38 © Wood Environment & Infrastructure Solutions UK Limited
February 2020
Doc Ref. 41296-WOD-XX-XX-J-TR-0006i2 Final Report Page | 38
the most high-tech irrigation system can be inefficient if too much water is applied or water is applied at the
wrong time. The use of decision support tools and micro irrigation has been shown to be associated with
higher farm-level water use efficiency (Gadanakis, 2015).
Finally, the uptake of precision irrigation technologies and the drive towards more efficient irrigation with
higher uniformity and lower energy requirements would influence irrigation demand. Variable rate irrigation
and precision irrigation technologies are starting to become more widespread internationally, but adoption
in the UK will be slower compared to more arid environments (Monaghan et al., 2013).
The drivers outlined in the following subsections may encourage growers to use water more efficiently and
reduce the potential for environmental harm, however, more efficient water use does not necessarily mean
less water use and experience world-wide has shown that when irrigation efficiency is increased, the farmers
tend to use the extra water released to increase the irrigated area rather than reduce water withdrawals
(Grafton et al., 2018).
Cost of irrigating
Being more water-efficient reduces irrigation costs (particularly energy) and therefore should be a strong
incentive and driver for water saving. However, the marginal cost of irrigation is small compared to the crop
value and is rarely a sufficient driver alone to reduce water use. Where water and equipment are
unconstrained, farmers tend to prefer to over-irrigate than risk under-irrigating due to the potential impacts
on crop quality.
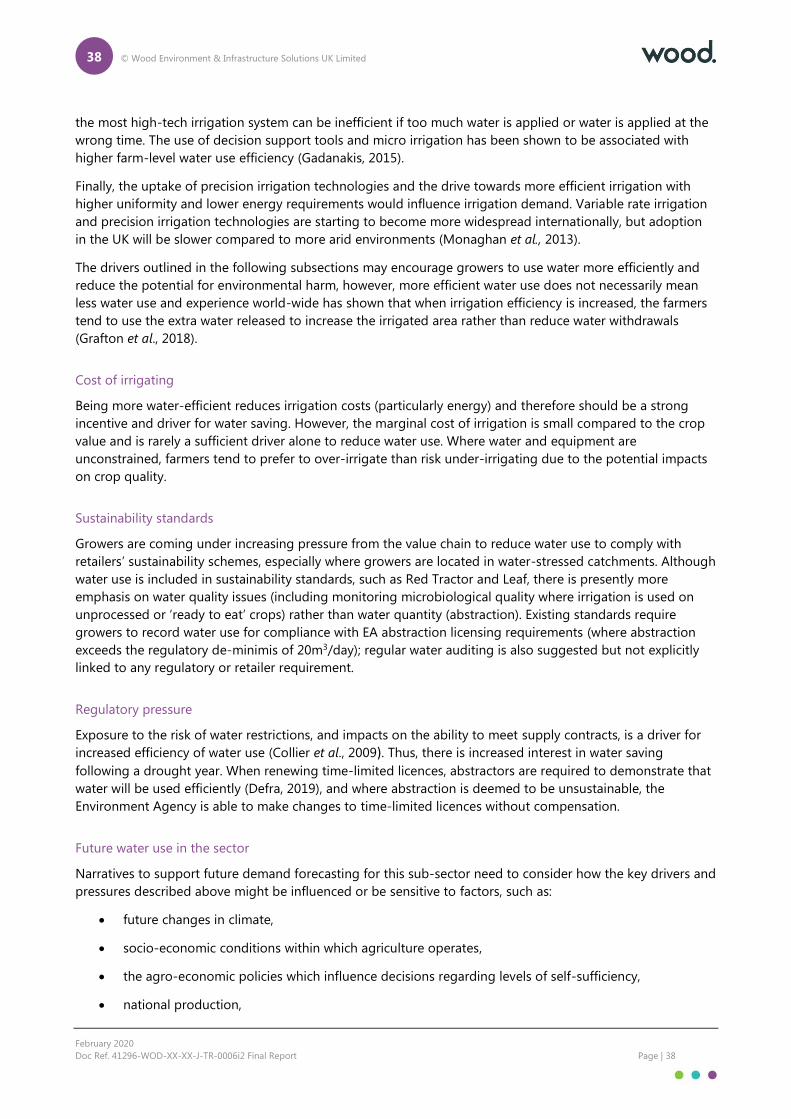
Sustainability standards
Growers are coming under increasing pressure from the value chain to reduce water use to comply with
retailers’ sustainability schemes, especially where growers are located in water-stressed catchments. Although
water use is included in sustainability standards, such as Red Tractor and Leaf, there is presently more
emphasis on water quality issues (including monitoring microbiological quality where irrigation is used on
unprocessed or ‘ready to eat’ crops) rather than water quantity (abstraction). Existing standards require
growers to record water use for compliance with EA abstraction licensing requirements (where abstraction
exceeds the regulatory de-minimis of 20m3/day); regular water auditing is also suggested but not explicitly
linked to any regulatory or retailer requirement.
Regulatory pressure
Exposure to the risk of water restrictions, and impacts on the ability to meet supply contracts, is a driver for
increased efficiency of water use (Collier et al., 2009). Thus, there is increased interest in water saving
following a drought year. When renewing time-limited licences, abstractors are required to demonstrate that
water will be used efficiently (Defra, 2019), and where abstraction is deemed to be unsustainable, the
Environment Agency is able to make changes to time-limited licences without compensation.
Future water use in the sector
Narratives to support future demand forecasting for this sub-sector need to consider how the key drivers and
pressures described above might be influenced or be sensitive to factors, such as:
future changes in climate,
socio-economic conditions within which agriculture operates,
the agro-economic policies which influence decisions regarding levels of self-sufficiency,
national production,
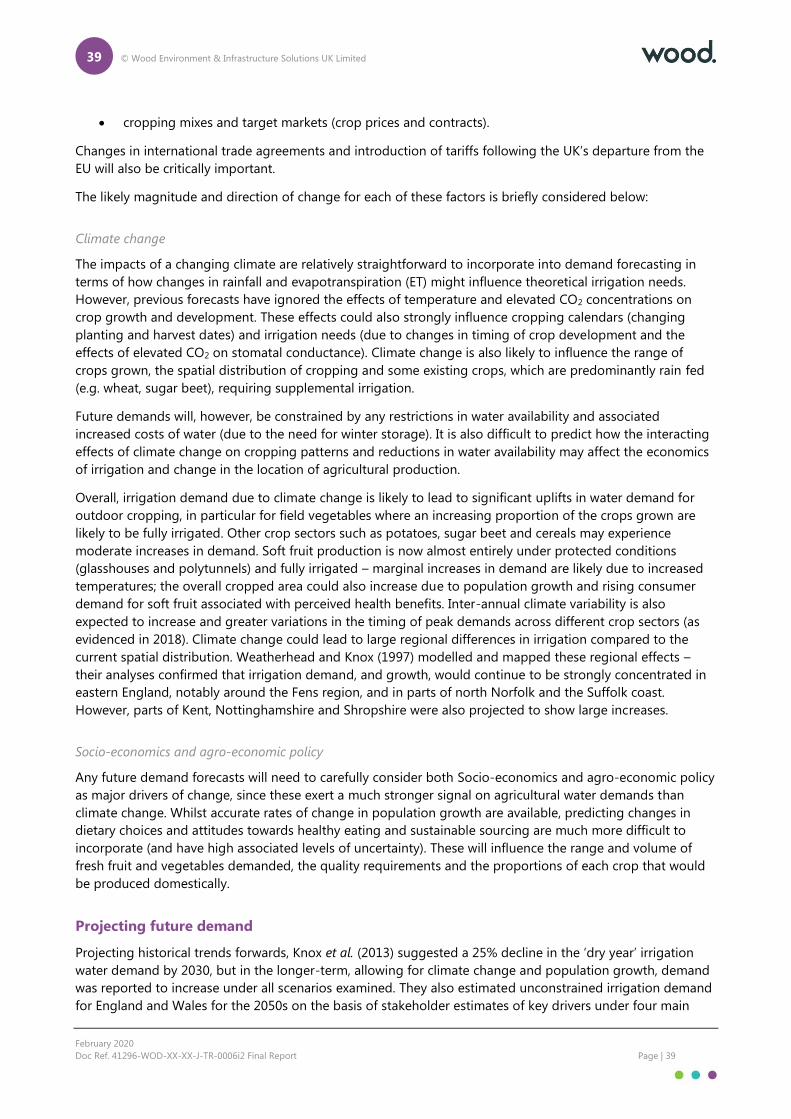
39 © Wood Environment & Infrastructure Solutions UK Limited
February 2020
Doc Ref. 41296-WOD-XX-XX-J-TR-0006i2 Final Report Page | 39
cropping mixes and target markets (crop prices and contracts).
Changes in international trade agreements and introduction of tariffs following the UK’s departure from the
EU will also be critically important.
The likely magnitude and direction of change for each of these factors is briefly considered below:
Climate change
The impacts of a changing climate are relatively straightforward to incorporate into demand forecasting in
terms of how changes in rainfall and evapotranspiration (ET) might influence theoretical irrigation needs.
However, previous forecasts have ignored the effects of temperature and elevated CO2 concentrations on
crop growth and development. These effects could also strongly influence cropping calendars (changing
planting and harvest dates) and irrigation needs (due to changes in timing of crop development and the
effects of elevated CO2 on stomatal conductance). Climate change is also likely to influence the range of
crops grown, the spatial distribution of cropping and some existing crops, which are predominantly rain fed
(e.g. wheat, sugar beet), requiring supplemental irrigation.
Future demands will, however, be constrained by any restrictions in water availability and associated
increased costs of water (due to the need for winter storage). It is also difficult to predict how the interacting
effects of climate change on cropping patterns and reductions in water availability may affect the economics
of irrigation and change in the location of agricultural production.
Overall, irrigation demand due to climate change is likely to lead to significant uplifts in water demand for
outdoor cropping, in particular for field vegetables where an increasing proportion of the crops grown are
likely to be fully irrigated. Other crop sectors such as potatoes, sugar beet and cereals may experience
moderate increases in demand. Soft fruit production is now almost entirely under protected conditions
(glasshouses and polytunnels) and fully irrigated – marginal increases in demand are likely due to increased
temperatures; the overall cropped area could also increase due to population growth and rising consumer
demand for soft fruit associated with perceived health benefits. Inter-annual climate variability is also
expected to increase and greater variations in the timing of peak demands across different crop sectors (as
evidenced in 2018). Climate change could lead to large regional differences in irrigation compared to the
current spatial distribution. Weatherhead and Knox (1997) modelled and mapped these regional effects –
their analyses confirmed that irrigation demand, and growth, would continue to be strongly concentrated in
eastern England, notably around the Fens region, and in parts of north Norfolk and the Suffolk coast.
However, parts of Kent, Nottinghamshire and Shropshire were also projected to show large increases.
Socio-economics and agro-economic policy
Any future demand forecasts will need to carefully consider both Socio-economics and agro-economic policy
as major drivers of change, since these exert a much stronger signal on agricultural water demands than
climate change. Whilst accurate rates of change in population growth are available, predicting changes in
dietary choices and attitudes towards healthy eating and sustainable sourcing are much more difficult to
incorporate (and have high associated levels of uncertainty). These will influence the range and volume of
fresh fruit and vegetables demanded, the quality requirements and the proportions of each crop that would
be produced domestically.
Projecting future demand
Projecting historical trends forwards, Knox et al. (2013) suggested a 25% decline in the ‘dry year’ irrigation
water demand by 2030, but in the longer-term, allowing for climate change and population growth, demand
was reported to increase under all scenarios examined. They also estimated unconstrained irrigation demand
for England and Wales for the 2050s on the basis of stakeholder estimates of key drivers under four main
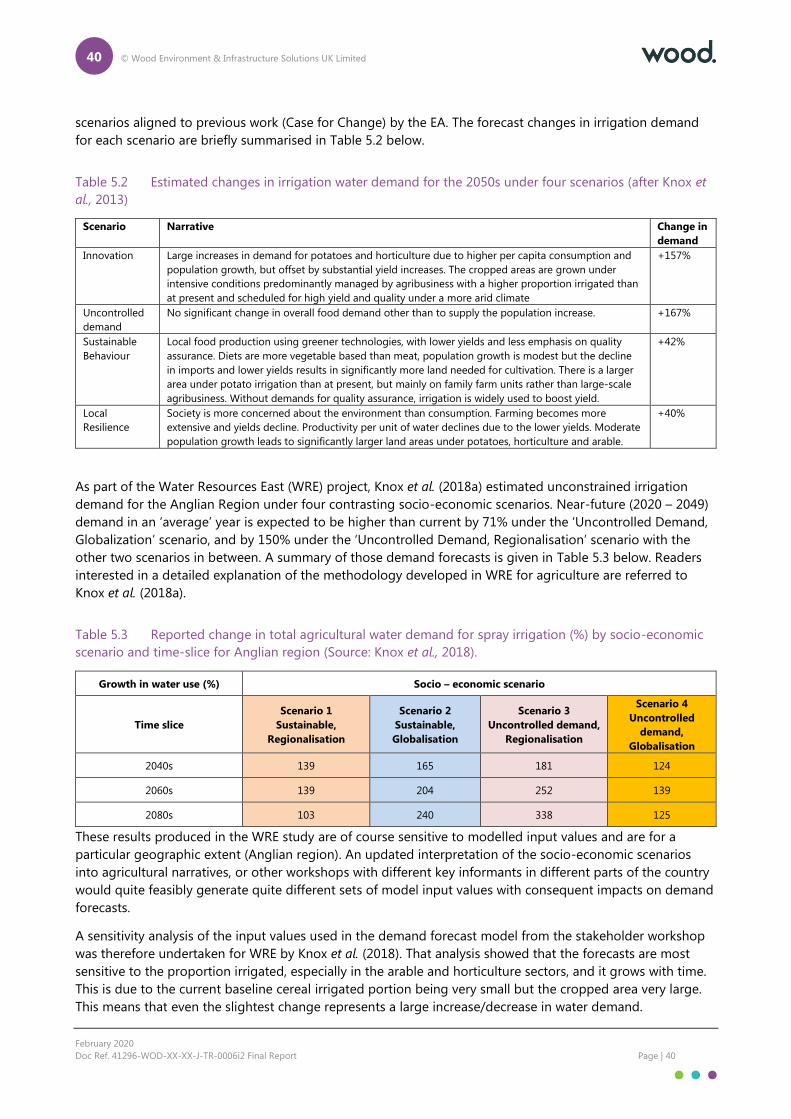
40 © Wood Environment & Infrastructure Solutions UK Limited
February 2020
Doc Ref. 41296-WOD-XX-XX-J-TR-0006i2 Final Report Page | 40
scenarios aligned to previous work (Case for Change) by the EA. The forecast changes in irrigation demand
for each scenario are briefly summarised in Table 5.2 below.
Table 5.2 Estimated changes in irrigation water demand for the 2050s under four scenarios (after Knox et
al., 2013)
Scenario Narrative Change in
demand Innovation Large increases in demand for potatoes and horticulture due to higher per capita consumption and
population growth, but offset by substantial yield increases. The cropped areas are grown under
intensive conditions predominantly managed by agribusiness with a higher proportion irrigated than
at present and scheduled for high yield and quality under a more arid climate
+157%
Uncontrolled
demand No significant change in overall food demand other than to supply the population increase. +167%
Sustainable
Behaviour Local food production using greener technologies, with lower yields and less emphasis on quality
assurance. Diets are more vegetable based than meat, population growth is modest but the decline
in imports and lower yields results in significantly more land needed for cultivation. There is a larger
area under potato irrigation than at present, but mainly on family farm units rather than large-scale
agribusiness. Without demands for quality assurance, irrigation is widely used to boost yield.
+42%
Local
Resilience Society is more concerned about the environment than consumption. Farming becomes more
extensive and yields decline. Productivity per unit of water declines due to the lower yields. Moderate
population growth leads to significantly larger land areas under potatoes, horticulture and arable.
+40%
As part of the Water Resources East (WRE) project, Knox et al. (2018a) estimated unconstrained irrigation
demand for the Anglian Region under four contrasting socio-economic scenarios. Near-future (2020 – 2049)
demand in an ‘average’ year is expected to be higher than current by 71% under the ‘Uncontrolled Demand,
Globalization’ scenario, and by 150% under the ‘Uncontrolled Demand, Regionalisation’ scenario with the
other two scenarios in between. A summary of those demand forecasts is given in Table 5.3 below. Readers
interested in a detailed explanation of the methodology developed in WRE for agriculture are referred to
Knox et al. (2018a).
Table 5.3 Reported change in total agricultural water demand for spray irrigation (%) by socio-economic
scenario and time-slice for Anglian region (Source: Knox et al., 2018).
Growth in water use (%) Socio – economic scenario
Time slice
Scenario 1
Sustainable,
Regionalisation
Scenario 2
Sustainable,
Globalisation
Scenario 3
Uncontrolled demand,
Regionalisation
Scenario 4
Uncontrolled
demand,
Globalisation
2040s 139 165 181 124
2060s 139 204 252 139
2080s 103 240 338 125
These results produced in the WRE study are of course sensitive to modelled input values and are for a
particular geographic extent (Anglian region). An updated interpretation of the socio-economic scenarios
into agricultural narratives, or other workshops with different key informants in different parts of the country
would quite feasibly generate quite different sets of model input values with consequent impacts on demand
forecasts.
A sensitivity analysis of the input values used in the demand forecast model from the stakeholder workshop
was therefore undertaken for WRE by Knox et al. (2018). That analysis showed that the forecasts are most
sensitive to the proportion irrigated, especially in the arable and horticulture sectors, and it grows with time.
This is due to the current baseline cereal irrigated portion being very small but the cropped area very large.
This means that even the slightest change represents a large increase/decrease in water demand.
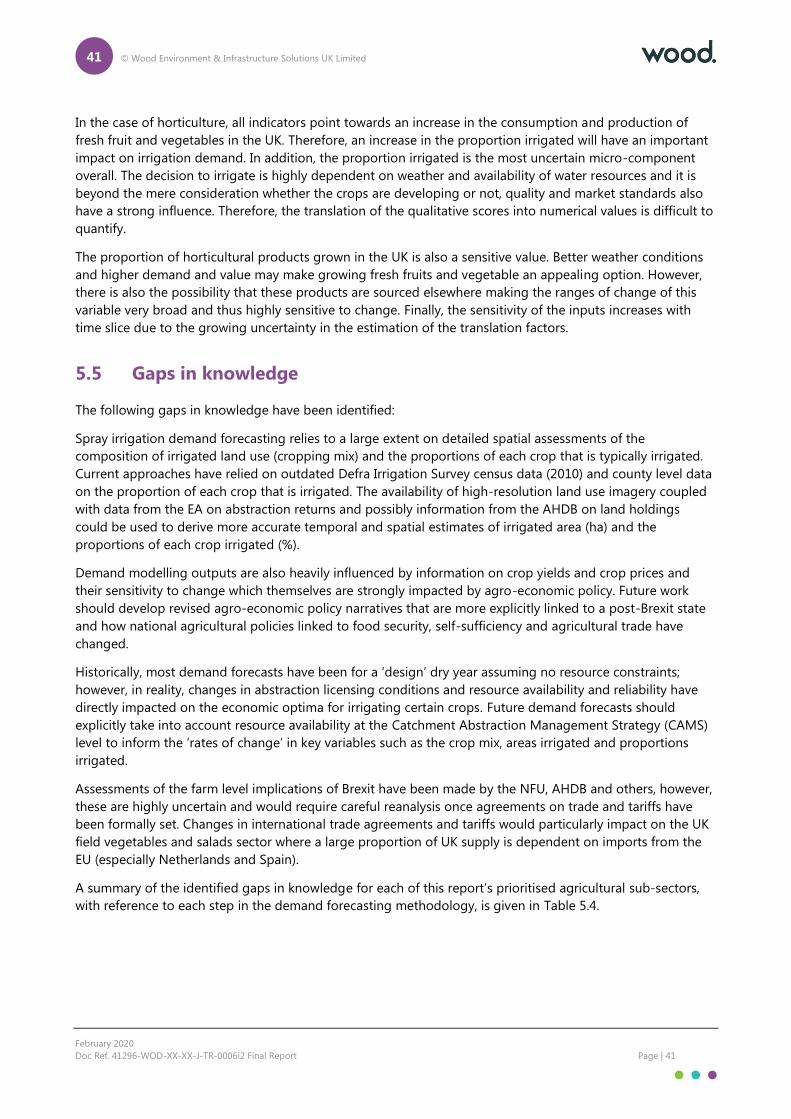
41 © Wood Environment & Infrastructure Solutions UK Limited
February 2020
Doc Ref. 41296-WOD-XX-XX-J-TR-0006i2 Final Report Page | 41
In the case of horticulture, all indicators point towards an increase in the consumption and production of
fresh fruit and vegetables in the UK. Therefore, an increase in the proportion irrigated will have an important
impact on irrigation demand. In addition, the proportion irrigated is the most uncertain micro-component
overall. The decision to irrigate is highly dependent on weather and availability of water resources and it is
beyond the mere consideration whether the crops are developing or not, quality and market standards also
have a strong influence. Therefore, the translation of the qualitative scores into numerical values is difficult to
quantify.
The proportion of horticultural products grown in the UK is also a sensitive value. Better weather conditions
and higher demand and value may make growing fresh fruits and vegetable an appealing option. However,
there is also the possibility that these products are sourced elsewhere making the ranges of change of this
variable very broad and thus highly sensitive to change. Finally, the sensitivity of the inputs increases with
time slice due to the growing uncertainty in the estimation of the translation factors.
5.5 Gaps in knowledge
The following gaps in knowledge have been identified:
Spray irrigation demand forecasting relies to a large extent on detailed spatial assessments of the
composition of irrigated land use (cropping mix) and the proportions of each crop that is typically irrigated.
Current approaches have relied on outdated Defra Irrigation Survey census data (2010) and county level data
on the proportion of each crop that is irrigated. The availability of high-resolution land use imagery coupled
with data from the EA on abstraction returns and possibly information from the AHDB on land holdings
could be used to derive more accurate temporal and spatial estimates of irrigated area (ha) and the
proportions of each crop irrigated (%).
Demand modelling outputs are also heavily influenced by information on crop yields and crop prices and
their sensitivity to change which themselves are strongly impacted by agro-economic policy. Future work
should develop revised agro-economic policy narratives that are more explicitly linked to a post-Brexit state
and how national agricultural policies linked to food security, self-sufficiency and agricultural trade have
changed.
Historically, most demand forecasts have been for a ‘design’ dry year assuming no resource constraints;
however, in reality, changes in abstraction licensing conditions and resource availability and reliability have
directly impacted on the economic optima for irrigating certain crops. Future demand forecasts should
explicitly take into account resource availability at the Catchment Abstraction Management Strategy (CAMS)
level to inform the ‘rates of change’ in key variables such as the crop mix, areas irrigated and proportions
irrigated.
Assessments of the farm level implications of Brexit have been made by the NFU, AHDB and others, however,
these are highly uncertain and would require careful reanalysis once agreements on trade and tariffs have
been formally set. Changes in international trade agreements and tariffs would particularly impact on the UK
field vegetables and salads sector where a large proportion of UK supply is dependent on imports from the
EU (especially Netherlands and Spain).
A summary of the identified gaps in knowledge for each of this report’s prioritised agricultural sub-sectors,
with reference to each step in the demand forecasting methodology, is given in Table 5.4.
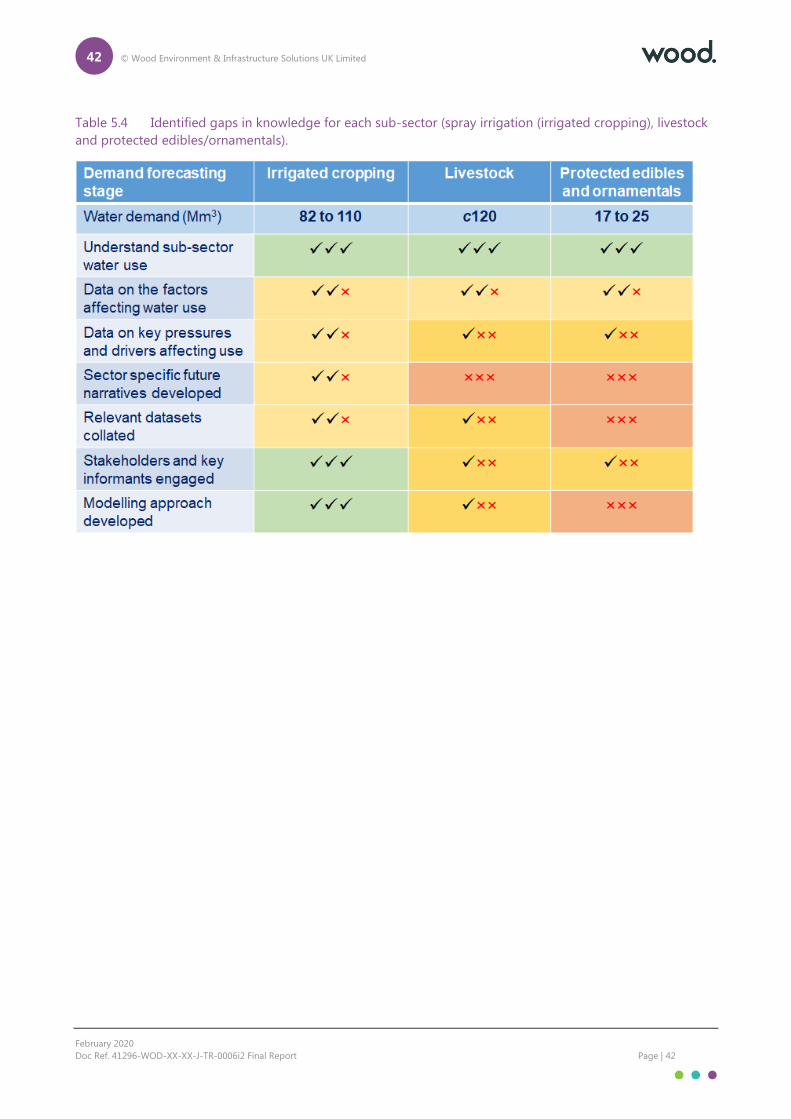
42 © Wood Environment & Infrastructure Solutions UK Limited
February 2020
Doc Ref. 41296-WOD-XX-XX-J-TR-0006i2 Final Report Page | 42
Table 5.4 Identified gaps in knowledge for each sub-sector (spray irrigation (irrigated cropping), livestock
and protected edibles/ornamentals).
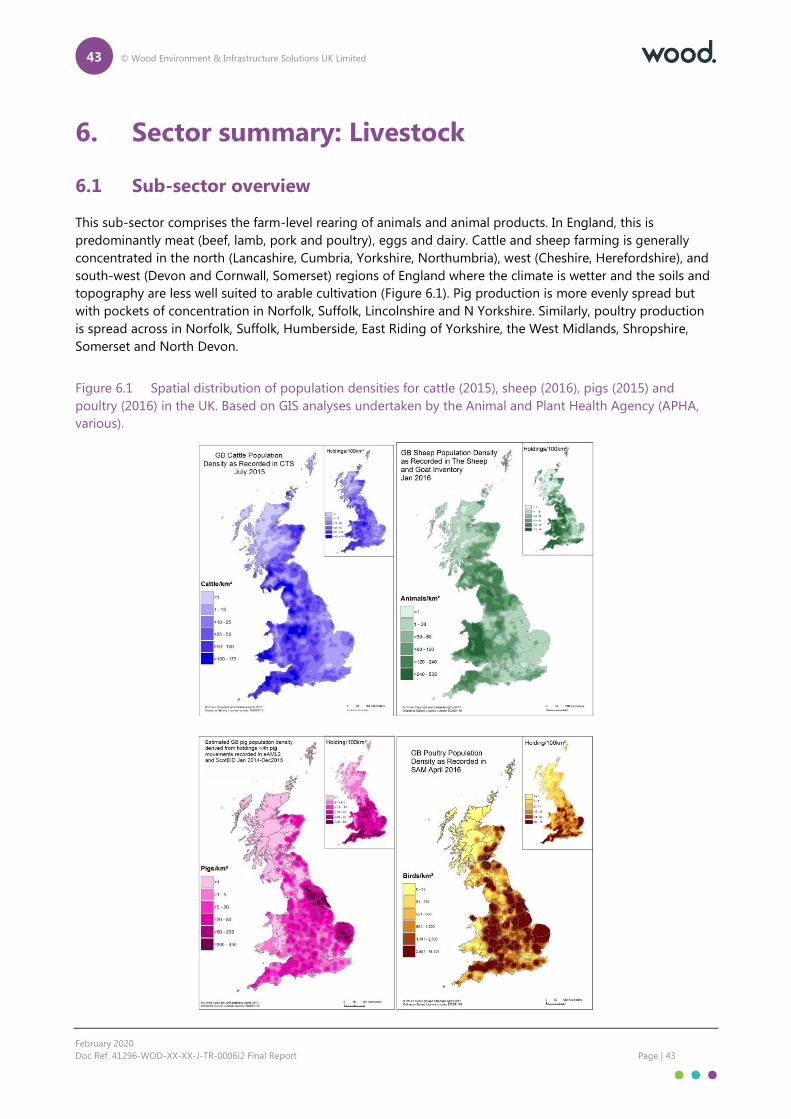
43 © Wood Environment & Infrastructure Solutions UK Limited
February 2020
Doc Ref. 41296-WOD-XX-XX-J-TR-0006i2 Final Report Page | 43
6. Sector summary: Livestock
6.1 Sub-sector overview
This sub-sector comprises the farm-level rearing of animals and animal products. In England, this is
predominantly meat (beef, lamb, pork and poultry), eggs and dairy. Cattle and sheep farming is generally
concentrated in the north (Lancashire, Cumbria, Yorkshire, Northumbria), west (Cheshire, Herefordshire), and
south-west (Devon and Cornwall, Somerset) regions of England where the climate is wetter and the soils and
topography are less well suited to arable cultivation (Figure 6.1). Pig production is more evenly spread but
with pockets of concentration in Norfolk, Suffolk, Lincolnshire and N Yorkshire. Similarly, poultry production
is spread across in Norfolk, Suffolk, Humberside, East Riding of Yorkshire, the West Midlands, Shropshire,
Somerset and North Devon.
Figure 6.1 Spatial distribution of population densities for cattle (2015), sheep (2016), pigs (2015) and
poultry (2016) in the UK. Based on GIS analyses undertaken by the Animal and Plant Health Agency (APHA,
various).

44 © Wood Environment & Infrastructure Solutions UK Limited
February 2020
Doc Ref. 41296-WOD-XX-XX-J-TR-0006i2 Final Report Page | 44
6.2 Water use within the sub-sector
Water is used in livestock production primarily for animal drinking (King and Weatherhead, 2006) but also
used for on-farm processing (e.g. milk cooling in dairy parlours), yard washing and disease control (sheep
dipping and foot baths). However, drinking water dominates demand and accounts for 79% of the total water
requirement of dairy cattle, 87-99% for pigs, >99% for sheep and 96-99% for poultry, respectively (King and
Weatherhead, 2006).
A comprehensive summary of the estimated water requirements for UK livestock for drinking and washing,
by type, are provided in Knox et al. (2015). These data were derived from gridded data on livestock numbers
(type and age) from the EDINA3 (Defra) June Agricultural Census, combined with estimates of per head water
requirements. Estimates of livestock drinking water consumption by category (cattle, pigs, sheep and poultry)
were based on existing data published in Defra projects (WU0101, WU0132 and FFG1129 produced by the
University of Warwick), ADAS (2006, 2012) and Knox et al., (2013). These take into account the age and size of
animals, the composition of their diets, production levels and ambient temperatures, all of which are known
to influence daily/annual water needs. A small survey of water use on beef and sheep farms by ADAS (2013)
concluded that on-farm water consumption was, in some cases, very close to figures reported in the
literature, but there was significant variation between farms due to local conditions.
For sheep and cattle, peak demands typically occur during the summer months, but drinking water intake by
animals reared outdoors is affected by the dry matter content of their food supply as well as by weather
conditions and, in the case of dairy cows, by milk yields4. King and Weatherhead (2006) reported that cattle
drinking requirements typically range between 20 and 104 litres per cow per day (highest for lactating dairy
herds); in contrast, water demands for pigs are much lower, typically 18 to 30 litres per pig per day (EA, 2007).
As most UK livestock are grazed or fed on conserved grass (hay and silage) and home-grown grains,
irrigation is rarely used for growing animal feed. Very little water is used for irrigating grass or crops for
animal feed due to the low profitability and returns on investment. In 2010 only 4% of the irrigation water
abstracted in England and Wales was applied to grass (Defra, 2011) (and not all of this would have been for
animal feed). Therefore, changes in livestock number do not affect demand for spray irrigation. This is very
different to somewhere like New Zealand, where a considerable area of pasture for dairy production is
irrigated.
In contrast to irrigated cropping, there are no nationally published statistics on water use for livestock in
England and Wales by volume. King and Weatherhead (2006) estimated the total water requirement for
livestock (England) to be 119 Million m3. This comprised both drinking and wash water. Similarly, Knox et al.
(2013) estimated the water demand (drinking water only) for livestock (EA England) to be 116 Million m3.
Most (44%) was used in the dairying sector, with sheep (20%) and beef (20%) also being important5. Total
demand was estimated at ~ 120 Million m3 (2000 – 2010) for the EA regions in England (Knox et al., 2015).
A historical trend analysis of total livestock water demand between 1984 and 2014 was produced by Knox et
al. (2015) (Figure 6.2). Their analysis suggested that water demand declined steadily until around 2000, and
has since stabilised at around 120 Million m3. about two-thirds (68%) is used for cattle (beef and dairy), with
sheep (16%), poultry (9%) and pigs (7%) accounting for the remainder. Since they assumed constant water
use per head, the historical reduction in water is directly related to a reduction in livestock numbers.
3 EDINA is the JISC-designated centre for digital expertise and online service delivery at the University of Edinburgh. 4 Sector: Livestock University of Warwick X30 5 Numbers adjusted for England only. Original numbers for England & Wales.
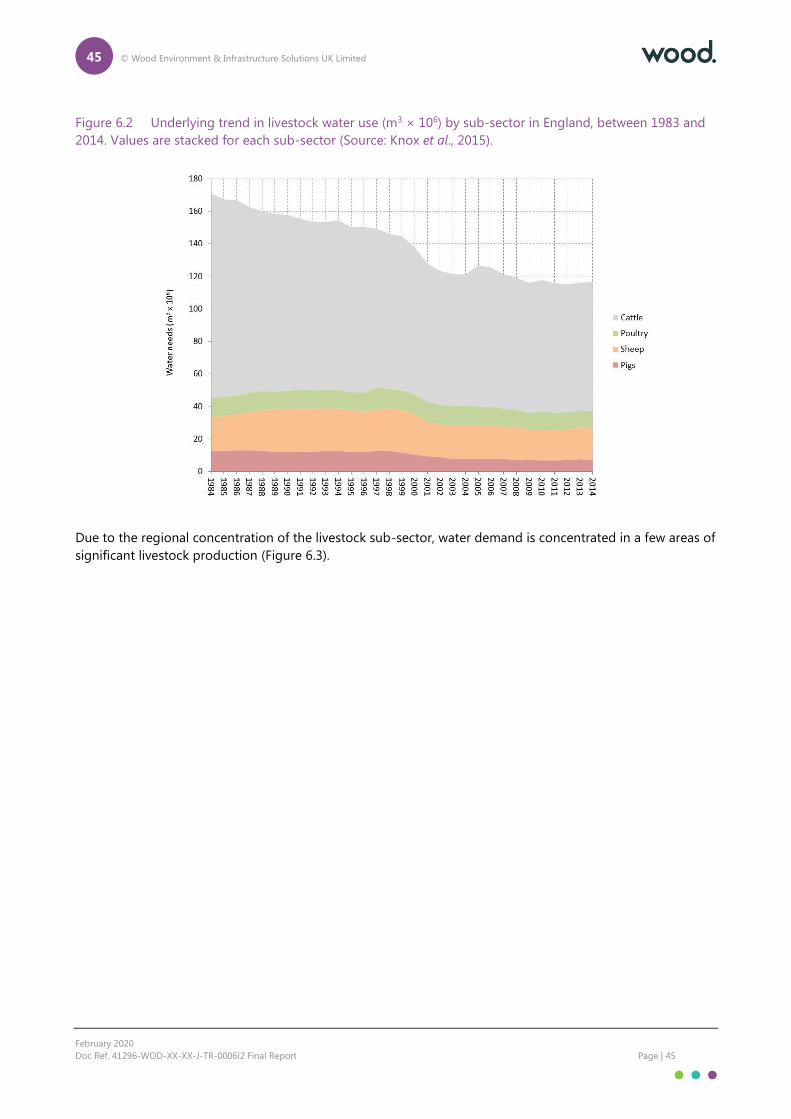
45 © Wood Environment & Infrastructure Solutions UK Limited
February 2020
Doc Ref. 41296-WOD-XX-XX-J-TR-0006i2 Final Report Page | 45
Figure 6.2 Underlying trend in livestock water use (m3 × 106) by sub-sector in England, between 1983 and
2014. Values are stacked for each sub-sector (Source: Knox et al., 2015).
Due to the regional concentration of the livestock sub-sector, water demand is concentrated in a few areas of
significant livestock production (Figure 6.3).
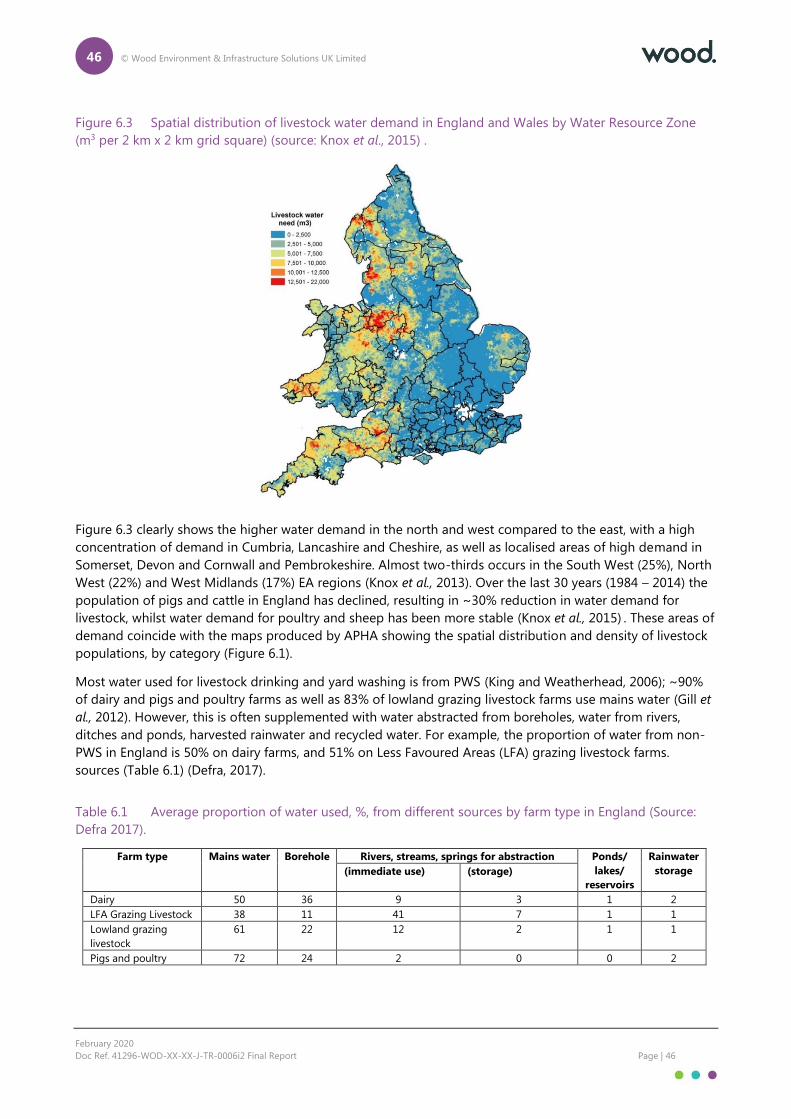
46 © Wood Environment & Infrastructure Solutions UK Limited
February 2020
Doc Ref. 41296-WOD-XX-XX-J-TR-0006i2 Final Report Page | 46
Figure 6.3 Spatial distribution of livestock water demand in England and Wales by Water Resource Zone
(m3 per 2 km x 2 km grid square) (source: Knox et al., 2015) .
Figure 6.3 clearly shows the higher water demand in the north and west compared to the east, with a high
concentration of demand in Cumbria, Lancashire and Cheshire, as well as localised areas of high demand in
Somerset, Devon and Cornwall and Pembrokeshire. Almost two-thirds occurs in the South West (25%), North
West (22%) and West Midlands (17%) EA regions (Knox et al., 2013). Over the last 30 years (1984 – 2014) the
population of pigs and cattle in England has declined, resulting in ~30% reduction in water demand for
livestock, whilst water demand for poultry and sheep has been more stable (Knox et al., 2015) . These areas of
demand coincide with the maps produced by APHA showing the spatial distribution and density of livestock
populations, by category (Figure 6.1).
Most water used for livestock drinking and yard washing is from PWS (King and Weatherhead, 2006); ~90%
of dairy and pigs and poultry farms as well as 83% of lowland grazing livestock farms use mains water (Gill et
al., 2012). However, this is often supplemented with water abstracted from boreholes, water from rivers,
ditches and ponds, harvested rainwater and recycled water. For example, the proportion of water from non-
PWS in England is 50% on dairy farms, and 51% on Less Favoured Areas (LFA) grazing livestock farms.
sources (Table 6.1) (Defra, 2017).
Table 6.1 Average proportion of water used, %, from different sources by farm type in England (Source:
Defra 2017).
Farm type Mains water Borehole Rivers, streams, springs for abstraction Ponds/
lakes/
reservoirs
Rainwater
storage (immediate use) (storage)
Dairy 50 36 9 3 1 2
LFA Grazing Livestock 38 11 41 7 1 1
Lowland grazing
livestock
61 22 12 2 1 1
Pigs and poultry 72 24 2 0 0 2
47 © Wood Environment & Infrastructure Solutions UK Limited
February 2020
Doc Ref. 41296-WOD-XX-XX-J-TR-0006i2 Final Report Page | 47
Abstractions are often below the de minimis level (<20 m3/day) and are not licensed, but these are
increasingly important in the dairy sector (Dairy Co, 2011). It is therefore difficult to estimate what proportion
of the total water demand for livestock is from non-PWS sources.
6.3 Factors affecting water use within the sub-sector
The main factors affecting water use within this sub-sector are summarised in the schematic in Figure 6.4.
Total water demand in the livestock sub-sector depends on the population of livestock (number and
composition), the drinking water requirement per head and the efficiency of water supply (i.e. accounting for
losses between the water source and end use, as well as waste during use).
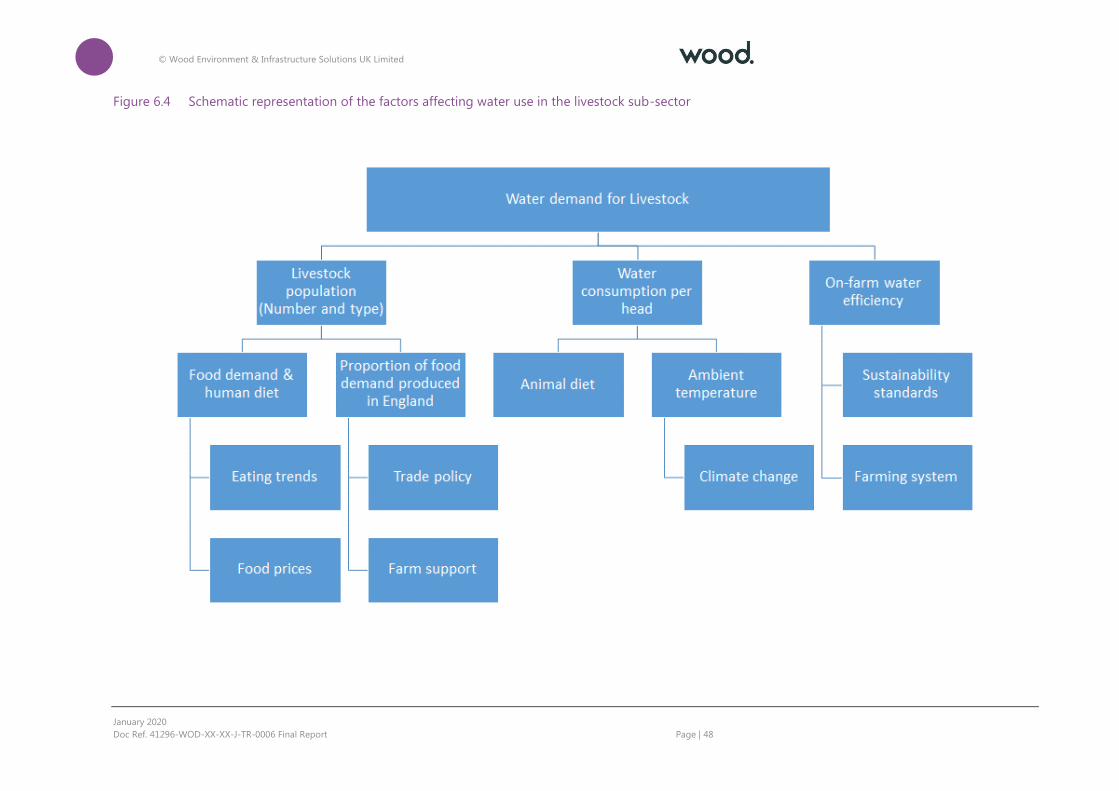
48 © Wood Environment & Infrastructure Solutions UK Limited
January 2020
Doc Ref. 41296-WOD-XX-XX-J-TR-0006 Final Report Page | 48
Figure 6.4 Schematic representation of the factors affecting water use in the livestock sub-sector
49 © Wood Environment & Infrastructure Solutions UK Limited
January 2020
Doc Ref. 41296-WOD-XX-XX-J-TR-0006 Final Report Page | 49
Table 6.2 Factors affecting water use in the livestock sub-sector
Factor Description Effect on water use
Livestock population Number and type of animals As drinking water consumption per head of stock of a particular type is
fairly conservative, an increase in livestock population will lead to an
increased water demand. Drinking water consumption per head is
greater for larger animals (e.g. dairy cattle) than smaller (e.g. poultry) and
increases as the animals grow.
Water consumption per
head
Drinking water per head of
livestock
Drinking water consumption per head increases with increasing air
temperature and the dry matter % of its feed.
On-farm efficiency Losses of water between
source and use and during
use
On-farm water systems, as for domestic water systems, are subject to
losses and waste through leaks and water use practices. Reducing
wastage through recycling and/or water harvesting can reduce overall
water demand.
6.4 Key pressures and drivers affecting sector’s water use
Livestock population
The characteristics of the national livestock population are influenced by the demand for livestock products
(predominantly meat and dairy products) and the proportion that is produced domestically.
Changing dietary preference
Global meat consumption is expected to double between 2000 and 2050 with livestock products constituting
a major source of protein. However, significant expansion of existing production systems is considered to be
unsustainable due to high resource needs and the impacts on local and global environments.
Hess et al., (2015) estimated the impact of alternative dietary scenarios on the life cycle water requirement of
our food. In a scenario in which diets adhere to Defra’s Eatwell guidance (Defra, 2016), increased
consumption of dairy products but reduced consumption of protein led to an 8% decrease in national water
use.
Farm support and trade policy
Presently, the farm support and trade policy is aligned with the European Union. The UK’s departure from the
EU affect the profitability of livestock farming and therefore livestock numbers and water demand through
changes in farm support, access to labour, profitability and trade policy. AHDB (2017) and Van Benkum et al.
(2016) considered the potential impacts of plausible post-Brexit scenarios on production and farm incomes.
Although the definition of the scenarios varies, three broad directions can be envisaged.
Under a scenario where the policy and regulatory framework remain close to the status quo and there is a
free-trade agreement with the EU there may be small increases in all livestock production, but a possible
reduction in the numbers of sheep.
Under a WTO default scenario, large increases in beef, dairy and pork production are envisaged due to
increases in domestic prices, but AHDB (2017) estimated that only the most efficient sheep producers would
remain viable. Therefore, water demand for livestock would increase under both scenarios.
Under a trade liberalisation scenario, higher feed prices and reduced market prices of animal products would
be associated with reduced production of beef, sheep and dairy, although AHDB (2017) suggested an
increase in pork production. In this case, total water demand for livestock would decrease as a result of the
trade policy.
50 © Wood Environment & Infrastructure Solutions UK Limited
February 2020
Doc Ref. 41296-WOD-XX-XX-J-TR-0006i2 Final Report Page | 50
Water consumption per head
The drinking water demand of an animal depends on a large number of factors, including body weight,
physiological state (stage of pregnancy, lactation, etc.), diet, temperature, frequency of water provision, type
of housing and environmental stress (FAO, 2018). For a given type of animal at a particular age (or stage of
lactation) the drinking water requirement varies according to ambient temperature and the composition of
feed. Animals drink more water when it is hotter and less if there is a large amount of water in the feed (e.g.
grazed grass as opposed to dry grains). Changes in climate or feed regime would therefore change the water
demand.
Climate change and water demand
Knox et al. (2013) estimated the impact of temperature change on livestock water demand and projected
increases of ~10% for sheep and beef cattle, <5% for dairying and 10-20% for poultry to the 2050s
depending on the climate change scenario.
On-farm efficiency
In order to understand potential future changes in water use in the livestock sector, it is also important to
better understand the vulnerability of livestock production to reduced water availability. Per-head water
requirements for livestock are fairly conservative - being a function of animal weight, air temperature and
farm hygiene and sanitation practices. Livestock farmers cannot compromise on drinking water, therefore,
on-farm water use per head is only affected by farm practices and efficiency. To a point, reduced water
availability may drive innovation and investment in on-farm water efficiency (reducing leaks and wastage,
water recycling and use of low water use coolers in dairy parlours), but beyond that the primary option to
cope with water shortage is to change system or reduce livestock numbers (Knox et al., 2015).
In livestock systems, efficiency of water use may be expressed as the volume of water required to perform a
given function (e.g. litres/head/day of drinking water, litres per day for wash down, etc.). Collier et al. (2009)
reviewed water saving measures for the livestock sector and identified, for example, a number of drinking
devices (for pigs in particular) which may reduce water use by as much as 40%. Increasing efficiency would
reduce the demand on the water source to meet the needs of the livestock system. However, it is also
fundamentally important to recognise the differences between measuring water use efficiency in terms of
l/head or l/kg meat produced. This is because it strongly influences what actions farmers can physically take
to reduce water use within their livestock system. Business models for livestock are based on inputs and
outputs – the animals themselves are not ‘outputs’ so consideration of l/kg output per year might be a more
appropriate measure of efficiency.
Many businesses are now installing rain water capture systems to reduce water costs and increase their
resilience to future drought risks when temporary use bans on public water supplies could be imposed on
‘non-essential use’.
As non-drinking uses of water are largely non-consumptive, with adequate treatment, wastewater could be
recycled and reused, especially for non-potable uses. This would help reduce the burden on water supplies in
stressed catchments.
System intensification
There is a relationship between the intensity of the livestock system and water use. In general, intensive
livestock systems have a higher demand for water for cooling and cleaning facilities than extensive systems,
so increasing intensification of livestock production would be expected to increase water demand. However,
this is generally more than compensated by the more efficient water use so that per kg of product, intensive
systems are more efficient (FAO, 2018).
51 © Wood Environment & Infrastructure Solutions UK Limited
February 2020
Doc Ref. 41296-WOD-XX-XX-J-TR-0006i2 Final Report Page | 51
Sustainability standards
Livestock farmers are under pressure from the value chain to reduce water use to comply with retailers’
sustainability schemes although there is presently more emphasis on the impact of farm water management
on water quality than quantity of water used.
6.5 Future water use in the sector
Narratives describing the likely future changes in key pressures and drivers and their consequent impacts on
water demands are not available for the livestock sector. A similar approach to that developed and
successfully used for the spray irrigated sector, involving key informants in a stakeholder workshop working
through the various drivers and assigning directions and magnitude of change for defined socio-economic
scenarios, is required. However, most water for livestock drinking and washing comes from the public water
supply (mains), therefore ‘hot-spots’ for water use for livestock are those areas where the public water supply
is seriously stressed, and the intensity of livestock water use is high. In general, the intensity of livestock
water use (m3/km2) is greater in water company areas that are not currently, or estimated in the short term,
to be seriously water stressed. Therefore, future livestock water use is less vulnerable to water scarcity than
irrigation water use (Knox et al., 2015).
Projecting future demand
Since there are no national datasets produced on the total water use in the livestock sector, it is very difficult
to separate water used for livestock uses from other on-farm uses and to assess underlying trends. Previous
demand estimates for livestock have therefore been based on estimated livestock numbers and per unit
(animal) water requirements, and provided estimates for a given year. Understandably, there is very limited
evidence forecasting future changes in water demand for the livestock sector.
Working with livestock specialists from ADAS, Knox et al. (2013) modelled future per-head water demands
between 2010 and 2050 for livestock, by sub-sector, for selected scenarios (low and high). Forecasts were
based on simple relationships between temperature change and water use and resulted in future increases in
demand of around c10% for sheep and beef cattle, <5% for dairying and 10-20% for poultry. However, these
figures did not consider any changes in animal diets and/or the national population of animals being reared.
6.6 Gaps in knowledge
The CCRA Agriculture sector report (Knox et al., 2012) attempted to develop a risk metric to assess climate
impacts on water abstraction for livestock, but without success. To examine impacts on direct abstraction and
public mains supply sources from different livestock systems it would be necessary to monitor each category
of water utilisation in the system (drinking, animal cooling, and equipment cooling) and then link these to
models of water requirements for each animal category. This approach has not been attempted; most studies
on climate change impacts on the livestock sector have understandably focussed on animal health, wellbeing
and changes in fertility, rather than water use per se.
Table 5.4 outlined at a high level, the gaps in knowledge that will need to be filled in order to develop
projections of future demand in a similar manner to that of irrigated agriculture.

52 © Wood Environment & Infrastructure Solutions UK Limited
February 2020
Doc Ref. 41296-WOD-XX-XX-J-TR-0006i2 Final Report Page | 52
7. Sector summary: Protected Edibles and
Ornamentals
7.1 Sub-sector overview
This sub-sector comprises edibles and ornamentals grown under highly controlled environmental conditions
in glasshouses and/or polytunnels, and hardy nursery stock (HNS). Protected edibles includes the production
of salad crops, such as tomatoes, cucumbers, lettuces, peppers, herbs, celery and aubergines, whereas the
protected ornamentals sector encompasses production of protected containerised pot plants, pack bedding
and indoor cut flowers, as well as associated plant propagators. The HNS sector is highly diverse and
encompasses numerous production systems, ranging from outdoor systems (field or container grown) to
protected systems (glasshouse or tunnel). HNS businesses vary considerably in size and the markets they
supply, with the most specialist nurseries concentrating on only a few plant species, whilst others can supply
over 1000 different plant types. In this sub-sector summary, only HNS grown under protected conditions are
included.
Figure 7.1 Representative distribution of holdings for protected horticulture (AHDB, 2016) Note this shows
only survey respondents

53 © Wood Environment & Infrastructure Solutions UK Limited
February 2020
Doc Ref. 41296-WOD-XX-XX-J-TR-0006i2 Final Report Page | 53
The total area of glasshouses6 in the UK in 2018 was reported to be 2,894 ha, with 2,242 ha for protected
edibles production. A much smaller area (475 ha) was used for flowers and foliage (Defra 2018). A small area
(154 ha) was reported to be not in use7. The ornamentals sector was reported to cover approximately 11,800
ha. Of this, 6800 ha was field grown (comprising bulbs and flowers grown in the open) and 4600 ha under
protection (HNS) (Defra, 2018). The largest portion of the total area (43%) was for HNS production with
bedding plants (38%) and herbaceous perennials (12%) also being important.
Nationally, protected cropping is known to utilise relatively small land areas in comparison to other
horticultural sectors, but is very high-value (£1.4 billion) (Defra, 2018). Most glasshouse production is
concentrated in South East England in East Sussex, Kent and Hampshire, and in Eastern England
(Hertfordshire, Bedfordshire, Lincolnshire) and South Yorkshire. There are also smaller pockets of production
in Lancashire and Cheshire and Hereford and Worcestershire. The Humber region is known for its high
intensity of cucumber production.
The area of lettuces grown under protected conditions has declined most in recent years due to the
significant increase in outdoor babyleaf salad production notably in Cambridgeshire, the Fens, West
Midlands and Hampshire. Favourable fertile soils, flat land and ideal climate conditions have resulted in
businesses now growing multiple crops (typically 3) of lettuces and salads on the same land per year.
7.2 Water use within the sub-sector
Unlike outdoor field-scale cropping, where irrigation is supplemental to rainfall, all crop water requirements
under protected cropping need to be met via irrigation. In addition, excess water is applied to wash salts out
of the confined root zones.
For protected edibles, three main types of growing system are used in glasshouse production;
Direct soil cultivation is the most widespread. In this system, the crop is grown and irrigated as if it
were a field crop. Usually the glasshouse is under-drained. Sufficient irrigation is then applied to
ensure that a continuous downward movement of salts through the system is maintained.
In rockwool systems, an artificial growing medium in the form of slabs made from a mixture of
basalt and limestone are used. These slabs are designed to hold about 60% water and 40% air.
They are widely used by tomato, pepper and cucumber growers. Due to risks of salt build-up,
irrigation is normally set at 10 to 15% above crop demand to flush salts.
Nutrient Film Technique (NFT) is a hydroponic system where the roots are bathed in a circulating
solution of nutrients and plants are supported by wires. The only water used is that required for
transpiration. The system requires high levels of management. It is mainly used on tomatoes,
peppers and some lettuce crops.
For protected ornamentals, three main types of growing system are used:
Drip irrigation of containerised stock where the size of the crop and pot size are critical in
influencing the demand for water;
NFT and rockwool systems as above, and;
6 Glasshouse includes any fixed or mobile structure high enough to walk through, which is glazed or clad with film, rigid plastics or other glass substitutes. It excludes lights, low plastic tunnels, French and Spanish tunnels. These are reported as crops grown in the open. 7 Due to the small areas grown, some UK countries do not collect data on individual crops in this category. For these countries the areas are included in this total estimate only. Therefore the total estimate does not always sum to the component parts
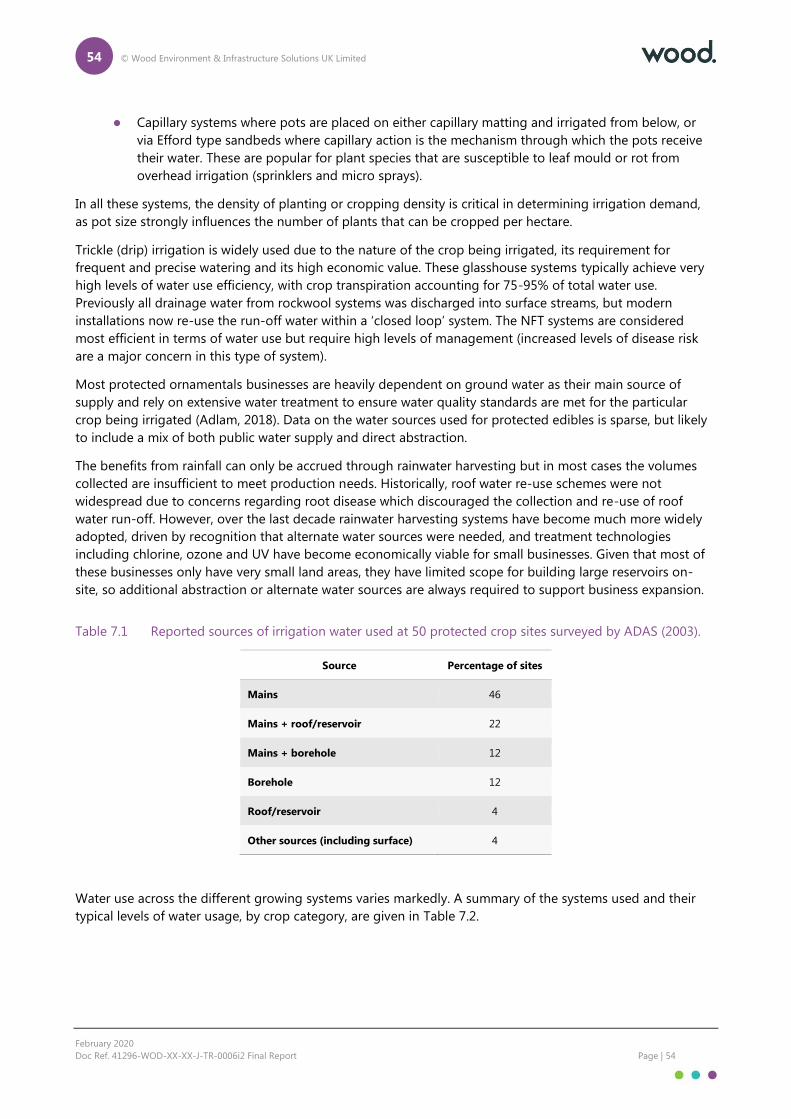
54 © Wood Environment & Infrastructure Solutions UK Limited
February 2020
Doc Ref. 41296-WOD-XX-XX-J-TR-0006i2 Final Report Page | 54
Capillary systems where pots are placed on either capillary matting and irrigated from below, or
via Efford type sandbeds where capillary action is the mechanism through which the pots receive
their water. These are popular for plant species that are susceptible to leaf mould or rot from
overhead irrigation (sprinklers and micro sprays).
In all these systems, the density of planting or cropping density is critical in determining irrigation demand,
as pot size strongly influences the number of plants that can be cropped per hectare.
Trickle (drip) irrigation is widely used due to the nature of the crop being irrigated, its requirement for
frequent and precise watering and its high economic value. These glasshouse systems typically achieve very
high levels of water use efficiency, with crop transpiration accounting for 75-95% of total water use.
Previously all drainage water from rockwool systems was discharged into surface streams, but modern
installations now re-use the run-off water within a ‘closed loop’ system. The NFT systems are considered
most efficient in terms of water use but require high levels of management (increased levels of disease risk
are a major concern in this type of system).
Most protected ornamentals businesses are heavily dependent on ground water as their main source of
supply and rely on extensive water treatment to ensure water quality standards are met for the particular
crop being irrigated (Adlam, 2018). Data on the water sources used for protected edibles is sparse, but likely
to include a mix of both public water supply and direct abstraction.
The benefits from rainfall can only be accrued through rainwater harvesting but in most cases the volumes
collected are insufficient to meet production needs. Historically, roof water re-use schemes were not
widespread due to concerns regarding root disease which discouraged the collection and re-use of roof
water run-off. However, over the last decade rainwater harvesting systems have become much more widely
adopted, driven by recognition that alternate water sources were needed, and treatment technologies
including chlorine, ozone and UV have become economically viable for small businesses. Given that most of
these businesses only have very small land areas, they have limited scope for building large reservoirs on-
site, so additional abstraction or alternate water sources are always required to support business expansion.
Table 7.1 Reported sources of irrigation water used at 50 protected crop sites surveyed by ADAS (2003).
Source Percentage of sites
Mains 46
Mains + roof/reservoir 22
Mains + borehole 12
Borehole 12
Roof/reservoir 4
Other sources (including surface) 4
Water use across the different growing systems varies markedly. A summary of the systems used and their
typical levels of water usage, by crop category, are given in Table 7.2.
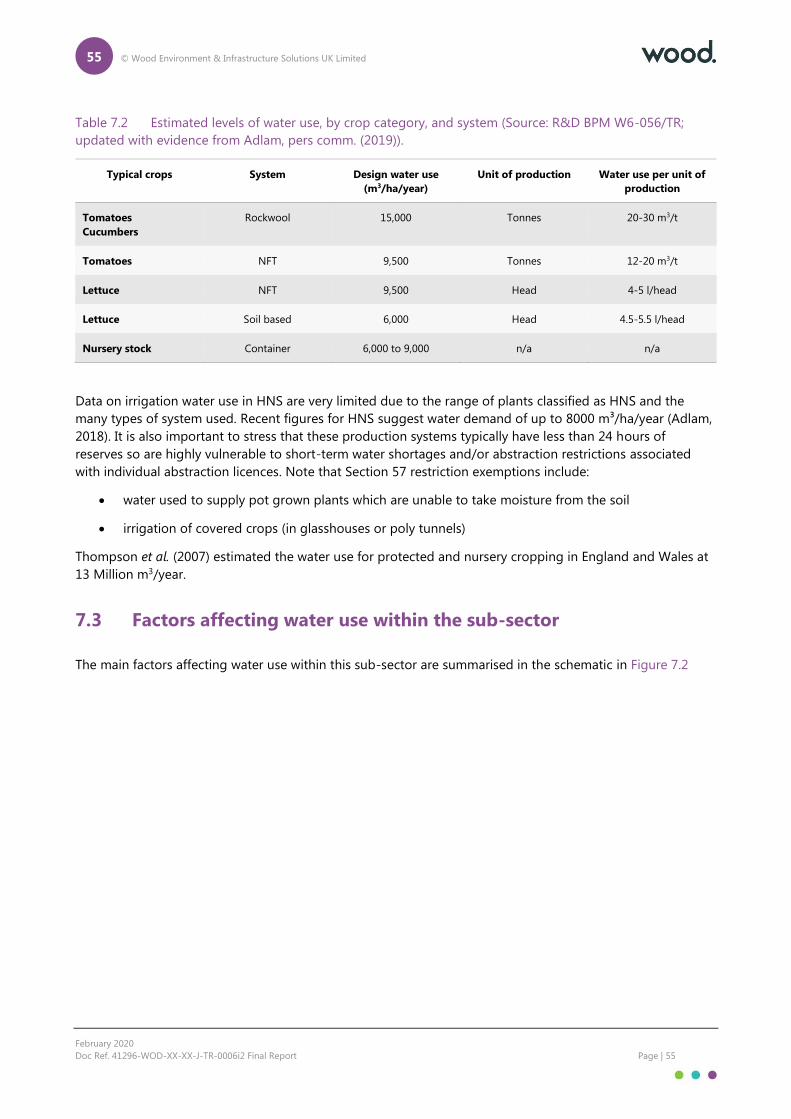
55 © Wood Environment & Infrastructure Solutions UK Limited
February 2020
Doc Ref. 41296-WOD-XX-XX-J-TR-0006i2 Final Report Page | 55
Table 7.2 Estimated levels of water use, by crop category, and system (Source: R&D BPM W6-056/TR;
updated with evidence from Adlam, pers comm. (2019)).
Typical crops System Design water use
(m3/ha/year)
Unit of production Water use per unit of
production
Tomatoes
Cucumbers
Rockwool 15,000 Tonnes 20-30 m3/t
Tomatoes NFT 9,500 Tonnes 12-20 m3/t
Lettuce NFT 9,500 Head 4-5 l/head
Lettuce Soil based 6,000 Head 4.5-5.5 l/head
Nursery stock Container 6,000 to 9,000 n/a n/a
Data on irrigation water use in HNS are very limited due to the range of plants classified as HNS and the
many types of system used. Recent figures for HNS suggest water demand of up to 8000 m³/ha/year (Adlam,
2018). It is also important to stress that these production systems typically have less than 24 hours of
reserves so are highly vulnerable to short-term water shortages and/or abstraction restrictions associated
with individual abstraction licences. Note that Section 57 restriction exemptions include:
water used to supply pot grown plants which are unable to take moisture from the soil
irrigation of covered crops (in glasshouses or poly tunnels)
Thompson et al. (2007) estimated the water use for protected and nursery cropping in England and Wales at
13 Million m3/year.
7.3 Factors affecting water use within the sub-sector
The main factors affecting water use within this sub-sector are summarised in the schematic in Figure 7.2
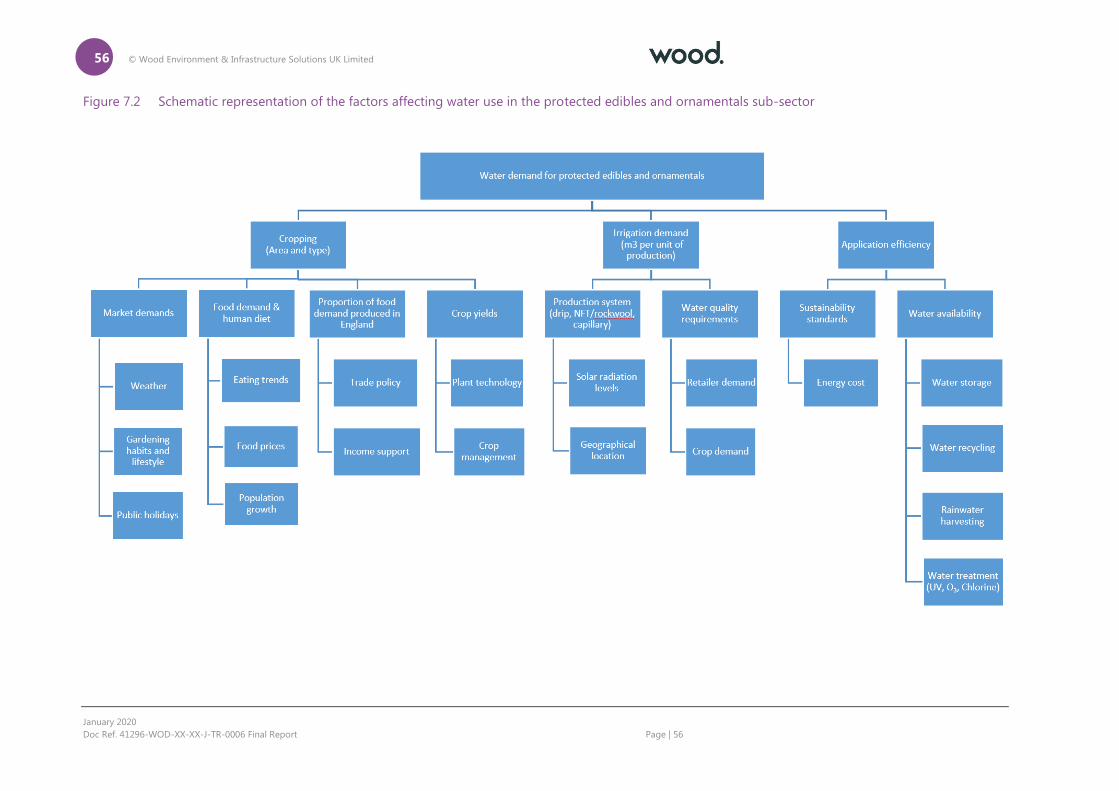
56 © Wood Environment & Infrastructure Solutions UK Limited
January 2020
Doc Ref. 41296-WOD-XX-XX-J-TR-0006 Final Report Page | 56
Figure 7.2 Schematic representation of the factors affecting water use in the protected edibles and ornamentals sub-sector
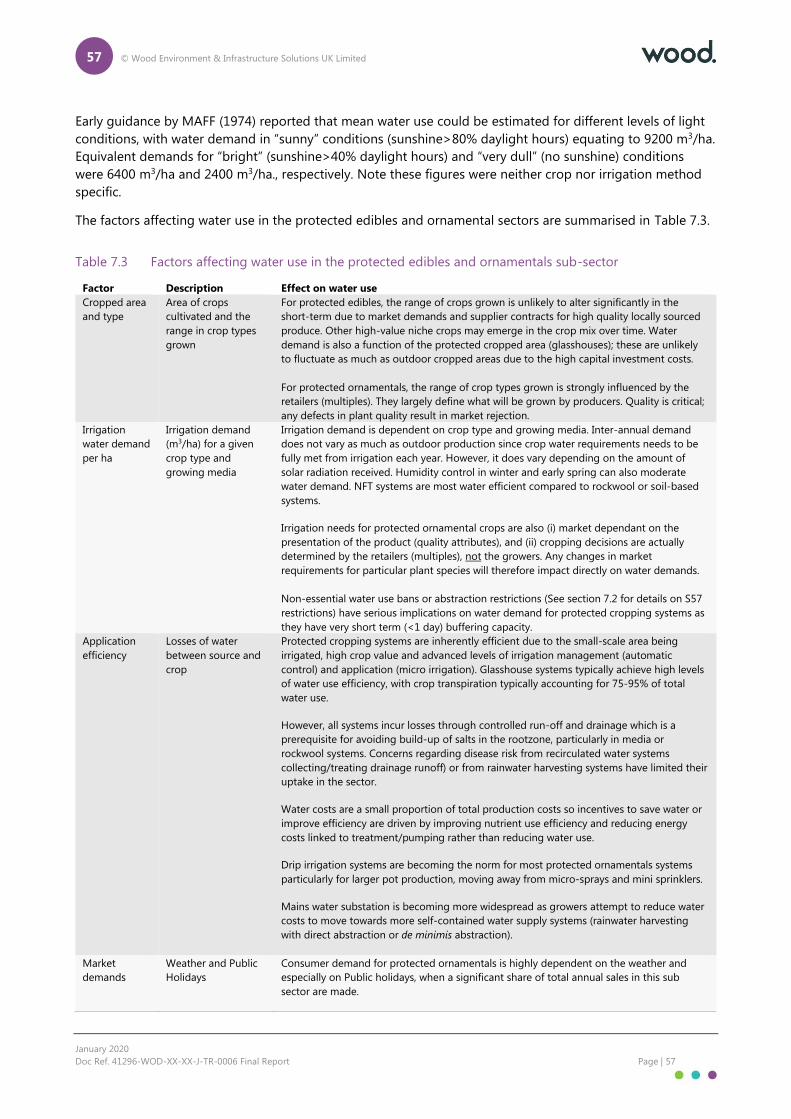
57 © Wood Environment & Infrastructure Solutions UK Limited
January 2020
Doc Ref. 41296-WOD-XX-XX-J-TR-0006 Final Report Page | 57
Early guidance by MAFF (1974) reported that mean water use could be estimated for different levels of light
conditions, with water demand in “sunny” conditions (sunshine>80% daylight hours) equating to 9200 m3/ha.
Equivalent demands for “bright” (sunshine>40% daylight hours) and “very dull” (no sunshine) conditions
were 6400 m3/ha and 2400 m3/ha., respectively. Note these figures were neither crop nor irrigation method
specific.
The factors affecting water use in the protected edibles and ornamental sectors are summarised in Table 7.3.
Table 7.3 Factors affecting water use in the protected edibles and ornamentals sub-sector
Factor Description Effect on water use
Cropped area
and type
Area of crops
cultivated and the
range in crop types
grown
For protected edibles, the range of crops grown is unlikely to alter significantly in the
short-term due to market demands and supplier contracts for high quality locally sourced
produce. Other high-value niche crops may emerge in the crop mix over time. Water
demand is also a function of the protected cropped area (glasshouses); these are unlikely
to fluctuate as much as outdoor cropped areas due to the high capital investment costs.
For protected ornamentals, the range of crop types grown is strongly influenced by the
retailers (multiples). They largely define what will be grown by producers. Quality is critical;
any defects in plant quality result in market rejection.
Irrigation
water demand
per ha
Irrigation demand
(m3/ha) for a given
crop type and
growing media
Irrigation demand is dependent on crop type and growing media. Inter-annual demand
does not vary as much as outdoor production since crop water requirements needs to be
fully met from irrigation each year. However, it does vary depending on the amount of
solar radiation received. Humidity control in winter and early spring can also moderate
water demand. NFT systems are most water efficient compared to rockwool or soil-based
systems.
Irrigation needs for protected ornamental crops are also (i) market dependant on the
presentation of the product (quality attributes), and (ii) cropping decisions are actually
determined by the retailers (multiples), not the growers. Any changes in market
requirements for particular plant species will therefore impact directly on water demands.
Non-essential water use bans or abstraction restrictions (See section 7.2 for details on S57
restrictions) have serious implications on water demand for protected cropping systems as
they have very short term (<1 day) buffering capacity.
Application
efficiency
Losses of water
between source and
crop
Protected cropping systems are inherently efficient due to the small-scale area being
irrigated, high crop value and advanced levels of irrigation management (automatic
control) and application (micro irrigation). Glasshouse systems typically achieve high levels
of water use efficiency, with crop transpiration typically accounting for 75-95% of total
water use.
However, all systems incur losses through controlled run-off and drainage which is a
prerequisite for avoiding build-up of salts in the rootzone, particularly in media or
rockwool systems. Concerns regarding disease risk from recirculated water systems
collecting/treating drainage runoff) or from rainwater harvesting systems have limited their
uptake in the sector.
Water costs are a small proportion of total production costs so incentives to save water or
improve efficiency are driven by improving nutrient use efficiency and reducing energy
costs linked to treatment/pumping rather than reducing water use.
Drip irrigation systems are becoming the norm for most protected ornamentals systems
particularly for larger pot production, moving away from micro-sprays and mini sprinklers.
Mains water substation is becoming more widespread as growers attempt to reduce water
costs to move towards more self-contained water supply systems (rainwater harvesting
with direct abstraction or de minimis abstraction).
Market
demands
Weather and Public
Holidays
Consumer demand for protected ornamentals is highly dependent on the weather and
especially on Public holidays, when a significant share of total annual sales in this sub
sector are made.
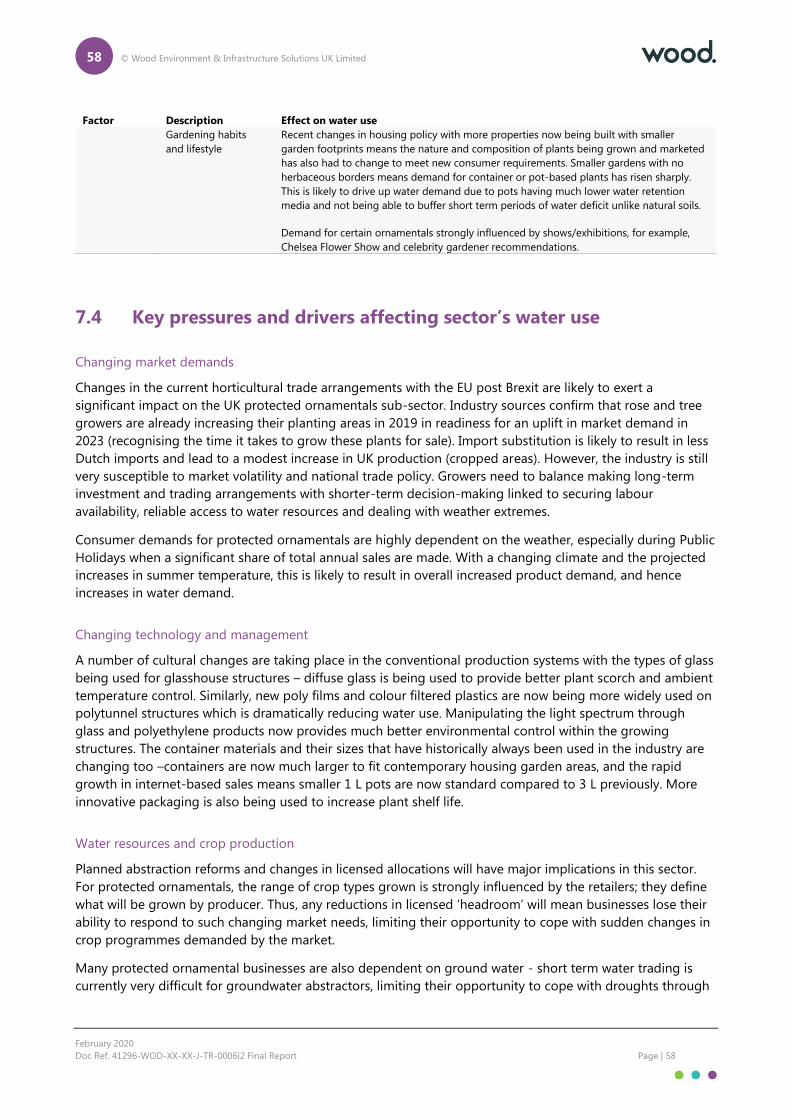
58 © Wood Environment & Infrastructure Solutions UK Limited
February 2020
Doc Ref. 41296-WOD-XX-XX-J-TR-0006i2 Final Report Page | 58
Factor Description Effect on water use
Gardening habits
and lifestyle
Recent changes in housing policy with more properties now being built with smaller
garden footprints means the nature and composition of plants being grown and marketed
has also had to change to meet new consumer requirements. Smaller gardens with no
herbaceous borders means demand for container or pot-based plants has risen sharply.
This is likely to drive up water demand due to pots having much lower water retention
media and not being able to buffer short term periods of water deficit unlike natural soils.
Demand for certain ornamentals strongly influenced by shows/exhibitions, for example,
Chelsea Flower Show and celebrity gardener recommendations.
7.4 Key pressures and drivers affecting sector’s water use
Changing market demands
Changes in the current horticultural trade arrangements with the EU post Brexit are likely to exert a
significant impact on the UK protected ornamentals sub-sector. Industry sources confirm that rose and tree
growers are already increasing their planting areas in 2019 in readiness for an uplift in market demand in
2023 (recognising the time it takes to grow these plants for sale). Import substitution is likely to result in less
Dutch imports and lead to a modest increase in UK production (cropped areas). However, the industry is still
very susceptible to market volatility and national trade policy. Growers need to balance making long-term
investment and trading arrangements with shorter-term decision-making linked to securing labour
availability, reliable access to water resources and dealing with weather extremes.
Consumer demands for protected ornamentals are highly dependent on the weather, especially during Public
Holidays when a significant share of total annual sales are made. With a changing climate and the projected
increases in summer temperature, this is likely to result in overall increased product demand, and hence
increases in water demand.
Changing technology and management
A number of cultural changes are taking place in the conventional production systems with the types of glass
being used for glasshouse structures – diffuse glass is being used to provide better plant scorch and ambient
temperature control. Similarly, new poly films and colour filtered plastics are now being more widely used on
polytunnel structures which is dramatically reducing water use. Manipulating the light spectrum through
glass and polyethylene products now provides much better environmental control within the growing
structures. The container materials and their sizes that have historically always been used in the industry are
changing too –containers are now much larger to fit contemporary housing garden areas, and the rapid
growth in internet-based sales means smaller 1 L pots are now standard compared to 3 L previously. More
innovative packaging is also being used to increase plant shelf life.
Water resources and crop production
Planned abstraction reforms and changes in licensed allocations will have major implications in this sector.
For protected ornamentals, the range of crop types grown is strongly influenced by the retailers; they define
what will be grown by producer. Thus, any reductions in licensed ‘headroom’ will mean businesses lose their
ability to respond to such changing market needs, limiting their opportunity to cope with sudden changes in
crop programmes demanded by the market.
Many protected ornamental businesses are also dependent on ground water - short term water trading is
currently very difficult for groundwater abstractors, limiting their opportunity to cope with droughts through
59 © Wood Environment & Infrastructure Solutions UK Limited
February 2020
Doc Ref. 41296-WOD-XX-XX-J-TR-0006i2 Final Report Page | 59
trading. Reliability of water supplies is directly linked to marketable quality - plants grown for their foliage
qualities are unmarketable even with dry symptoms showing due to drought stress.
Market demands for sustainability coupled with environmental regulations are exerting pressure on growers
to reduce fertiliser use and costs through improved nutrient management could lead to some reductions in
water use. Large volumes of applied water currently ‘run to waste’ as runoff from glasshouses and polytunnel
structures, particularly those involved in soft fruit production. There is strong regulatory and industry
pressure to therefore improve water and nutrient management to reduce levels of runoff and diffuse
pollution
In the protected edibles sector, next generation growing (NGG) approaches have shown that too much water
in tomato production can lead to excessive vegetative growth, reduced yields and lower quality.
Modern peat free substitutes with low water holding capacities have led to an increased frequency of
irrigation.
7.5 Future water use in the sector
Narratives describing the likely future changes in key pressures and drivers and their consequent impacts on
water demands are not available for this sub-sector. A similar approach to that developed and successfully
used for the outdoor irrigated sector involving key informants in a stakeholder workshop working through
the various drivers and assigning directions and magnitude of change for defined socio-economic scenarios
is required.
Projecting future demand
Marginal increases in demand are likely due to increased temperatures; the overall cropped area could also
increase due to population growth and rising consumer demand for soft fruit associated with perceived
health benefits. However, in contrast to outdoor irrigated agriculture and horticulture, there are no reported
studies on the likely direction and magnitude of change in water demand for this sub-sector in response to
future socio-economic development, or changes in climate or horticultural policy.
Key uncertainties for the sector include (i) the trade and tariff effects on levels of production post-Brexit
(Dutch imports), (ii) future changes in abstraction licensing and reductions in headroom, (iii) ) the reliability of
public water supplies and classification of ‘non-essential use’ (many water companies striving to reduce high
levels of ‘discretionary use’ following the 2018 drought), (iv) increased summer weather variability linked to
climate change, (v) changes in gardening habits and lifestyles (influenced by attitudes towards gardening and
garden size for new housing developments) and food diets (consumer demands for locally produced
vegetables, soft fruit and salad crops grown under glass/plastic).
7.6 Gaps in knowledge
This sub-sector has repeatedly been excluded from all previous demand forecasting studies in agriculture,
probably due to its highly specific composition and unique drivers of change. A number of important gaps in
knowledge therefore exist which need to be addressed:
Regional or catchment level data on the cropped areas and their spatial extent need to be collected. National
(Defra) published statistics are too crude for demand forecasting, particularly where enterprises are
concentrated in catchments or water resources zones that are water stressed.
Updated information on the temporal patterns of water use in the sub-sector including sources of water used
are required

60 © Wood Environment & Infrastructure Solutions UK Limited
February 2020
Doc Ref. 41296-WOD-XX-XX-J-TR-0006i2 Final Report Page | 60
Industry information on the future ‘drivers of change’ and how socio-economic and agro-economic policies
are likely to impact on the sub-sector are required, including effects of trade and tariffs on imports and likely
sector expansion and/or contraction.
Understanding the impacts of climate change on the sub-sector, and how this might affect production, the
composition of plants offered and target market. Assessing the impacts of abstraction reform and how this
might influence the future choice of water sources and investment options in the sub-sector.
Table 5.4 outlined at a high level, the gaps in knowledge that will need to be filled in order to develop
projections of future demand in a similar manner to that of irrigated agriculture.
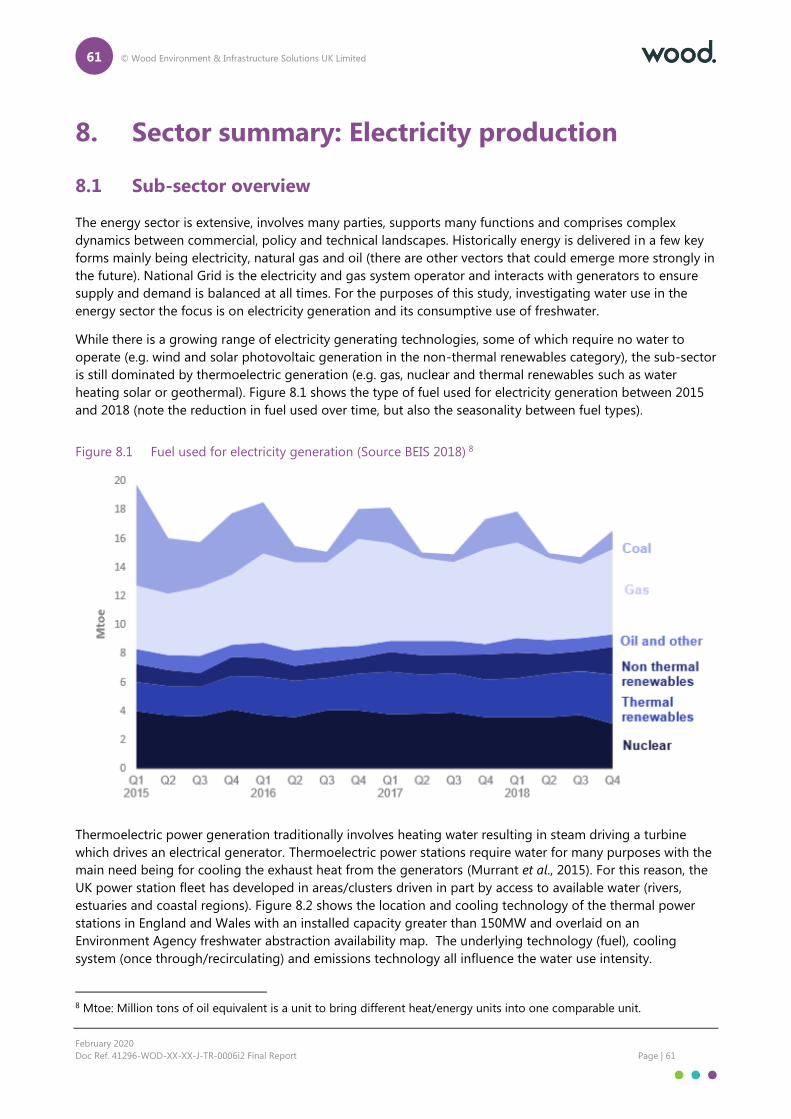
61 © Wood Environment & Infrastructure Solutions UK Limited
February 2020
Doc Ref. 41296-WOD-XX-XX-J-TR-0006i2 Final Report Page | 61
8. Sector summary: Electricity production
8.1 Sub-sector overview
The energy sector is extensive, involves many parties, supports many functions and comprises complex
dynamics between commercial, policy and technical landscapes. Historically energy is delivered in a few key
forms mainly being electricity, natural gas and oil (there are other vectors that could emerge more strongly in
the future). National Grid is the electricity and gas system operator and interacts with generators to ensure
supply and demand is balanced at all times. For the purposes of this study, investigating water use in the
energy sector the focus is on electricity generation and its consumptive use of freshwater.
While there is a growing range of electricity generating technologies, some of which require no water to
operate (e.g. wind and solar photovoltaic generation in the non-thermal renewables category), the sub-sector
is still dominated by thermoelectric generation (e.g. gas, nuclear and thermal renewables such as water
heating solar or geothermal). Figure 8.1 shows the type of fuel used for electricity generation between 2015
and 2018 (note the reduction in fuel used over time, but also the seasonality between fuel types).
Figure 8.1 Fuel used for electricity generation (Source BEIS 2018) 8
Thermoelectric power generation traditionally involves heating water resulting in steam driving a turbine
which drives an electrical generator. Thermoelectric power stations require water for many purposes with the
main need being for cooling the exhaust heat from the generators (Murrant et al., 2015). For this reason, the
UK power station fleet has developed in areas/clusters driven in part by access to available water (rivers,
estuaries and coastal regions). Figure 8.2 shows the location and cooling technology of the thermal power
stations in England and Wales with an installed capacity greater than 150MW and overlaid on an
Environment Agency freshwater abstraction availability map. The underlying technology (fuel), cooling
system (once through/recirculating) and emissions technology all influence the water use intensity.
8 Mtoe: Million tons of oil equivalent is a unit to bring different heat/energy units into one comparable unit.
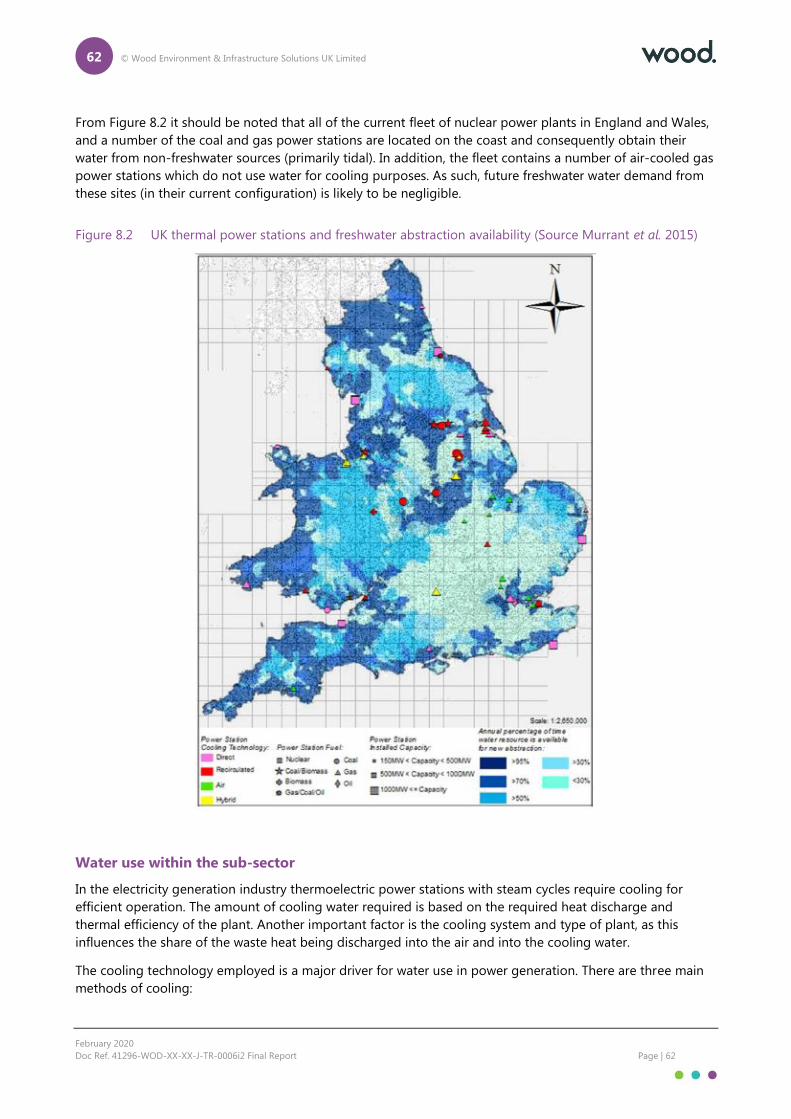
62 © Wood Environment & Infrastructure Solutions UK Limited
February 2020
Doc Ref. 41296-WOD-XX-XX-J-TR-0006i2 Final Report Page | 62
From Figure 8.2 it should be noted that all of the current fleet of nuclear power plants in England and Wales,
and a number of the coal and gas power stations are located on the coast and consequently obtain their
water from non-freshwater sources (primarily tidal). In addition, the fleet contains a number of air-cooled gas
power stations which do not use water for cooling purposes. As such, future freshwater water demand from
these sites (in their current configuration) is likely to be negligible.
Figure 8.2 UK thermal power stations and freshwater abstraction availability (Source Murrant et al. 2015)
Water use within the sub-sector
In the electricity generation industry thermoelectric power stations with steam cycles require cooling for
efficient operation. The amount of cooling water required is based on the required heat discharge and
thermal efficiency of the plant. Another important factor is the cooling system and type of plant, as this
influences the share of the waste heat being discharged into the air and into the cooling water.
The cooling technology employed is a major driver for water use in power generation. There are three main
methods of cooling:
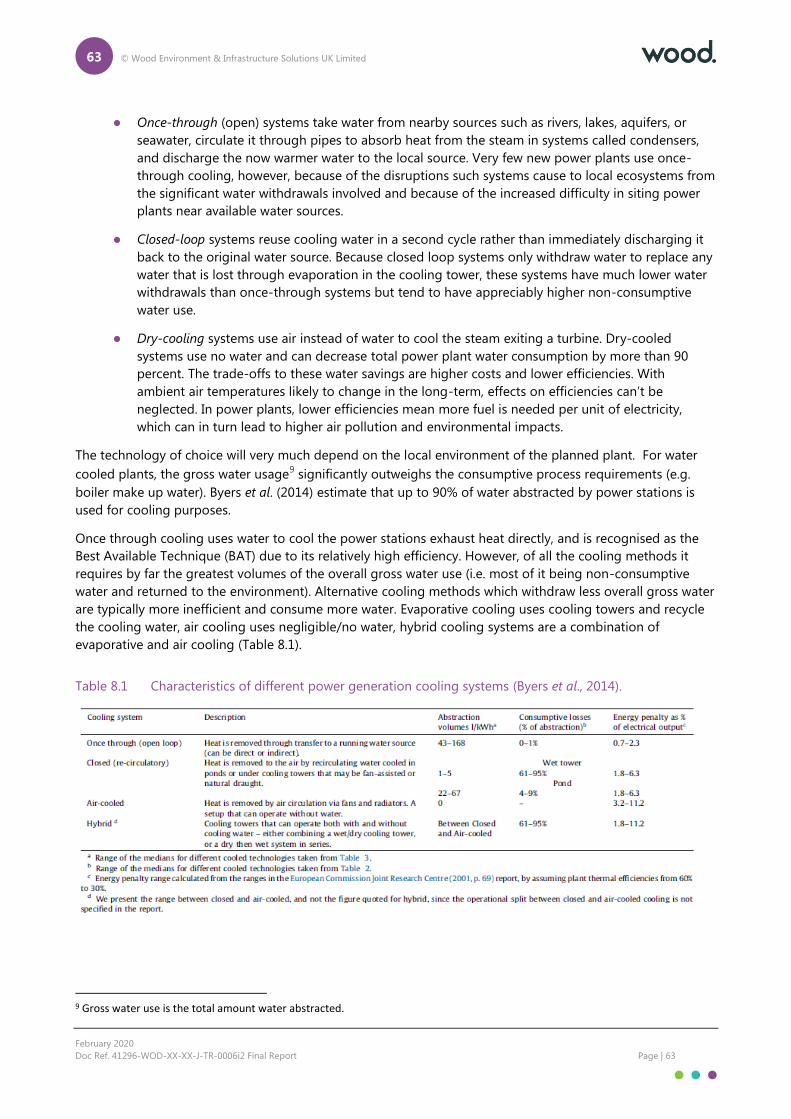
63 © Wood Environment & Infrastructure Solutions UK Limited
February 2020
Doc Ref. 41296-WOD-XX-XX-J-TR-0006i2 Final Report Page | 63
Once-through (open) systems take water from nearby sources such as rivers, lakes, aquifers, or
seawater, circulate it through pipes to absorb heat from the steam in systems called condensers,
and discharge the now warmer water to the local source. Very few new power plants use once-
through cooling, however, because of the disruptions such systems cause to local ecosystems from
the significant water withdrawals involved and because of the increased difficulty in siting power
plants near available water sources.
Closed-loop systems reuse cooling water in a second cycle rather than immediately discharging it
back to the original water source. Because closed loop systems only withdraw water to replace any
water that is lost through evaporation in the cooling tower, these systems have much lower water
withdrawals than once-through systems but tend to have appreciably higher non-consumptive
water use.
Dry-cooling systems use air instead of water to cool the steam exiting a turbine. Dry-cooled
systems use no water and can decrease total power plant water consumption by more than 90
percent. The trade-offs to these water savings are higher costs and lower efficiencies. With
ambient air temperatures likely to change in the long-term, effects on efficiencies can’t be
neglected. In power plants, lower efficiencies mean more fuel is needed per unit of electricity,
which can in turn lead to higher air pollution and environmental impacts.
The technology of choice will very much depend on the local environment of the planned plant. For water
cooled plants, the gross water usage9 significantly outweighs the consumptive process requirements (e.g.
boiler make up water). Byers et al. (2014) estimate that up to 90% of water abstracted by power stations is
used for cooling purposes.
Once through cooling uses water to cool the power stations exhaust heat directly, and is recognised as the
Best Available Technique (BAT) due to its relatively high efficiency. However, of all the cooling methods it
requires by far the greatest volumes of the overall gross water use (i.e. most of it being non-consumptive
water and returned to the environment). Alternative cooling methods which withdraw less overall gross water
are typically more inefficient and consume more water. Evaporative cooling uses cooling towers and recycle
the cooling water, air cooling uses negligible/no water, hybrid cooling systems are a combination of
evaporative and air cooling (Table 8.1).
Table 8.1 Characteristics of different power generation cooling systems (Byers et al., 2014).
9 Gross water use is the total amount water abstracted.
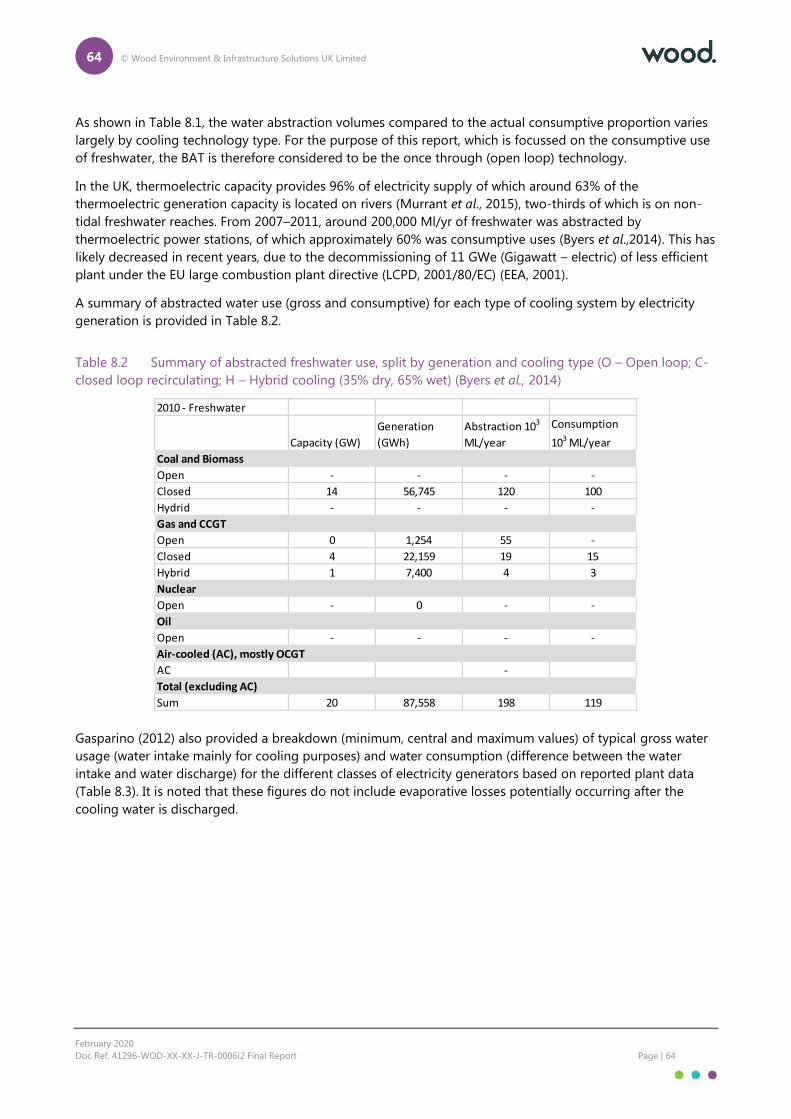
64 © Wood Environment & Infrastructure Solutions UK Limited
February 2020
Doc Ref. 41296-WOD-XX-XX-J-TR-0006i2 Final Report Page | 64
As shown in Table 8.1, the water abstraction volumes compared to the actual consumptive proportion varies
largely by cooling technology type. For the purpose of this report, which is focussed on the consumptive use
of freshwater, the BAT is therefore considered to be the once through (open loop) technology.
In the UK, thermoelectric capacity provides 96% of electricity supply of which around 63% of the
thermoelectric generation capacity is located on rivers (Murrant et al., 2015), two-thirds of which is on non-
tidal freshwater reaches. From 2007–2011, around 200,000 Ml/yr of freshwater was abstracted by
thermoelectric power stations, of which approximately 60% was consumptive uses (Byers et al.,2014). This has
likely decreased in recent years, due to the decommissioning of 11 GWe (Gigawatt – electric) of less efficient
plant under the EU large combustion plant directive (LCPD, 2001/80/EC) (EEA, 2001).
A summary of abstracted water use (gross and consumptive) for each type of cooling system by electricity
generation is provided in Table 8.2.
Table 8.2 Summary of abstracted freshwater use, split by generation and cooling type (O – Open loop; C-
closed loop recirculating; H – Hybrid cooling (35% dry, 65% wet) (Byers et al., 2014)
Gasparino (2012) also provided a breakdown (minimum, central and maximum values) of typical gross water
usage (water intake mainly for cooling purposes) and water consumption (difference between the water
intake and water discharge) for the different classes of electricity generators based on reported plant data
(Table 8.3). It is noted that these figures do not include evaporative losses potentially occurring after the
cooling water is discharged.
2010 - Freshwater
Capacity (GW)
Generation
(GWh)
Abstraction 103
ML/year
Consumption
103 ML/year
Coal and Biomass
Open - - - -
Closed 14 56,745 120 100
Hydrid - - - -
Gas and CCGT
Open 0 1,254 55 -
Closed 4 22,159 19 15
Hybrid 1 7,400 4 3
Nuclear
Open - 0 - -
Oil
Open - - - -
Air-cooled (AC), mostly OCGT
AC -
Total (excluding AC)
Sum 20 87,558 198 119
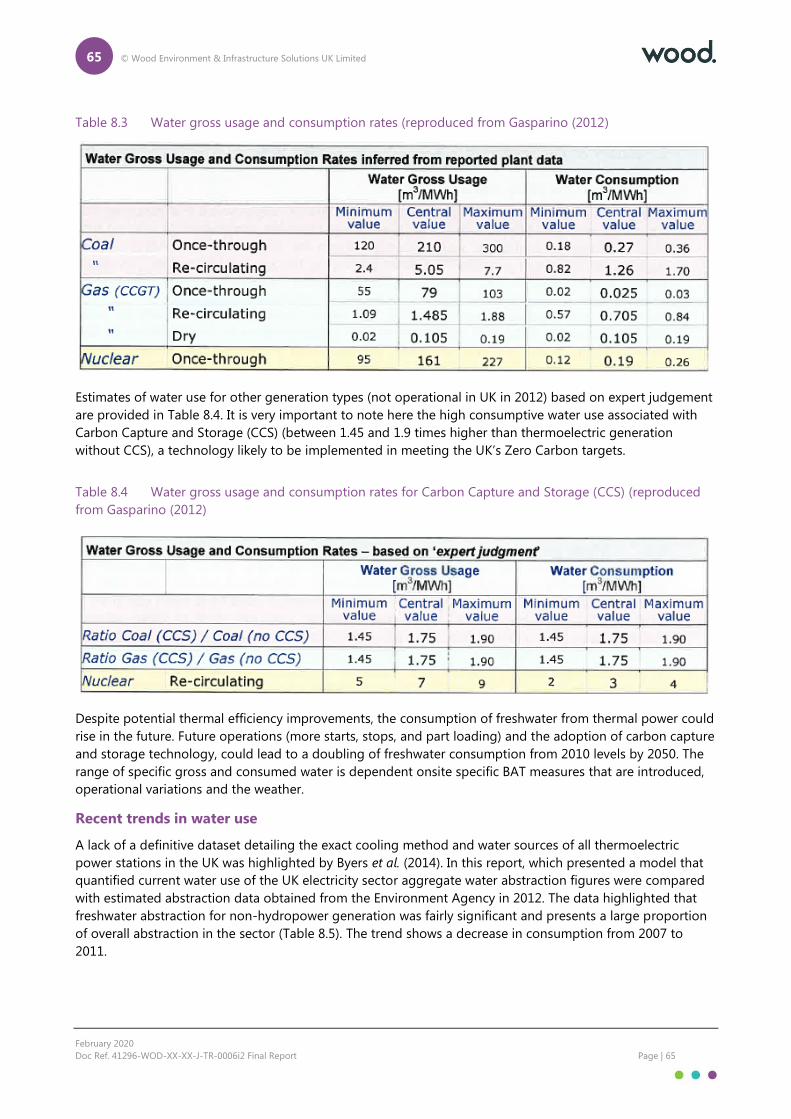
65 © Wood Environment & Infrastructure Solutions UK Limited
February 2020
Doc Ref. 41296-WOD-XX-XX-J-TR-0006i2 Final Report Page | 65
Table 8.3 Water gross usage and consumption rates (reproduced from Gasparino (2012)
Estimates of water use for other generation types (not operational in UK in 2012) based on expert judgement
are provided in Table 8.4. It is very important to note here the high consumptive water use associated with
Carbon Capture and Storage (CCS) (between 1.45 and 1.9 times higher than thermoelectric generation
without CCS), a technology likely to be implemented in meeting the UK’s Zero Carbon targets.
Table 8.4 Water gross usage and consumption rates for Carbon Capture and Storage (CCS) (reproduced
from Gasparino (2012)
Despite potential thermal efficiency improvements, the consumption of freshwater from thermal power could
rise in the future. Future operations (more starts, stops, and part loading) and the adoption of carbon capture
and storage technology, could lead to a doubling of freshwater consumption from 2010 levels by 2050. The
range of specific gross and consumed water is dependent onsite specific BAT measures that are introduced,
operational variations and the weather.
Recent trends in water use
A lack of a definitive dataset detailing the exact cooling method and water sources of all thermoelectric
power stations in the UK was highlighted by Byers et al. (2014). In this report, which presented a model that
quantified current water use of the UK electricity sector aggregate water abstraction figures were compared
with estimated abstraction data obtained from the Environment Agency in 2012. The data highlighted that
freshwater abstraction for non-hydropower generation was fairly significant and presents a large proportion
of overall abstraction in the sector (Table 8.5). The trend shows a decrease in consumption from 2007 to
2011.
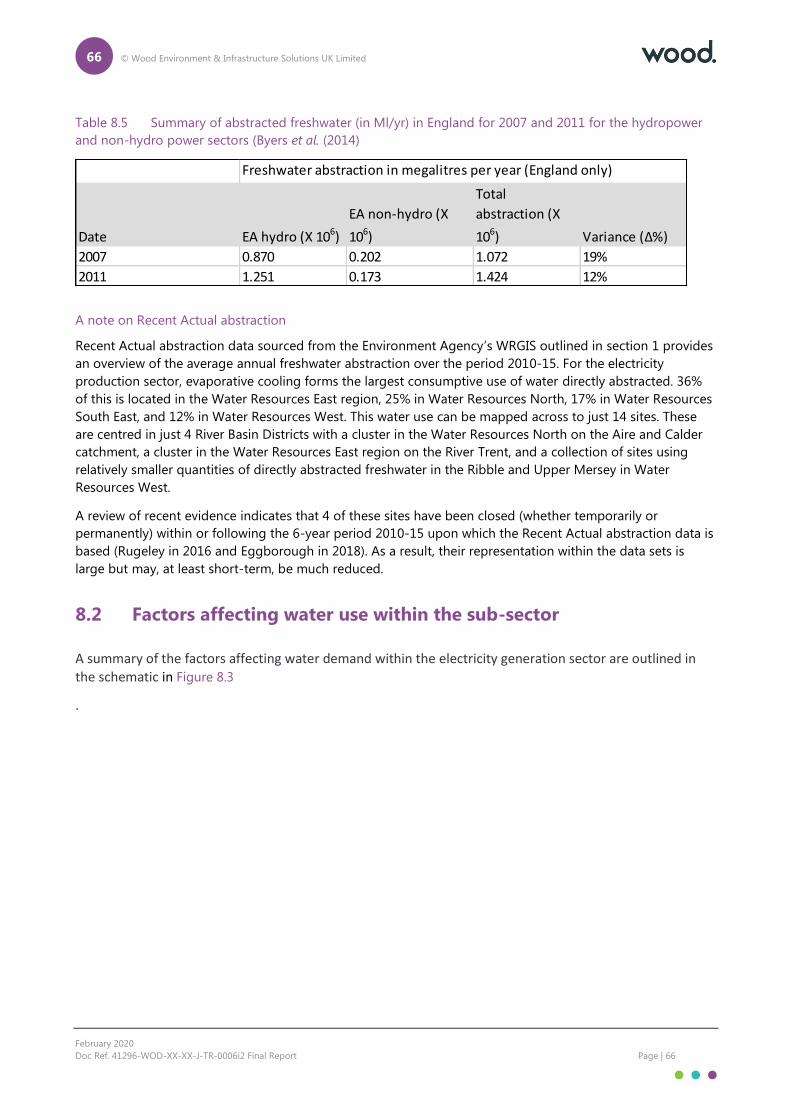
66 © Wood Environment & Infrastructure Solutions UK Limited
February 2020
Doc Ref. 41296-WOD-XX-XX-J-TR-0006i2 Final Report Page | 66
Table 8.5 Summary of abstracted freshwater (in Ml/yr) in England for 2007 and 2011 for the hydropower
and non-hydro power sectors (Byers et al. (2014)
A note on Recent Actual abstraction
Recent Actual abstraction data sourced from the Environment Agency’s WRGIS outlined in section 1 provides
an overview of the average annual freshwater abstraction over the period 2010-15. For the electricity
production sector, evaporative cooling forms the largest consumptive use of water directly abstracted. 36%
of this is located in the Water Resources East region, 25% in Water Resources North, 17% in Water Resources
South East, and 12% in Water Resources West. This water use can be mapped across to just 14 sites. These
are centred in just 4 River Basin Districts with a cluster in the Water Resources North on the Aire and Calder
catchment, a cluster in the Water Resources East region on the River Trent, and a collection of sites using
relatively smaller quantities of directly abstracted freshwater in the Ribble and Upper Mersey in Water
Resources West.
A review of recent evidence indicates that 4 of these sites have been closed (whether temporarily or
permanently) within or following the 6-year period 2010-15 upon which the Recent Actual abstraction data is
based (Rugeley in 2016 and Eggborough in 2018). As a result, their representation within the data sets is
large but may, at least short-term, be much reduced.
8.2 Factors affecting water use within the sub-sector
A summary of the factors affecting water demand within the electricity generation sector are outlined in the schematic in Figure 8.3
.
Date EA hydro (X 106)
EA non-hydro (X
106)
Total
abstraction (X
106) Variance (Δ%)
2007 0.870 0.202 1.072 19%
2011 1.251 0.173 1.424 12%
Freshwater abstraction in megalitres per year (England only)
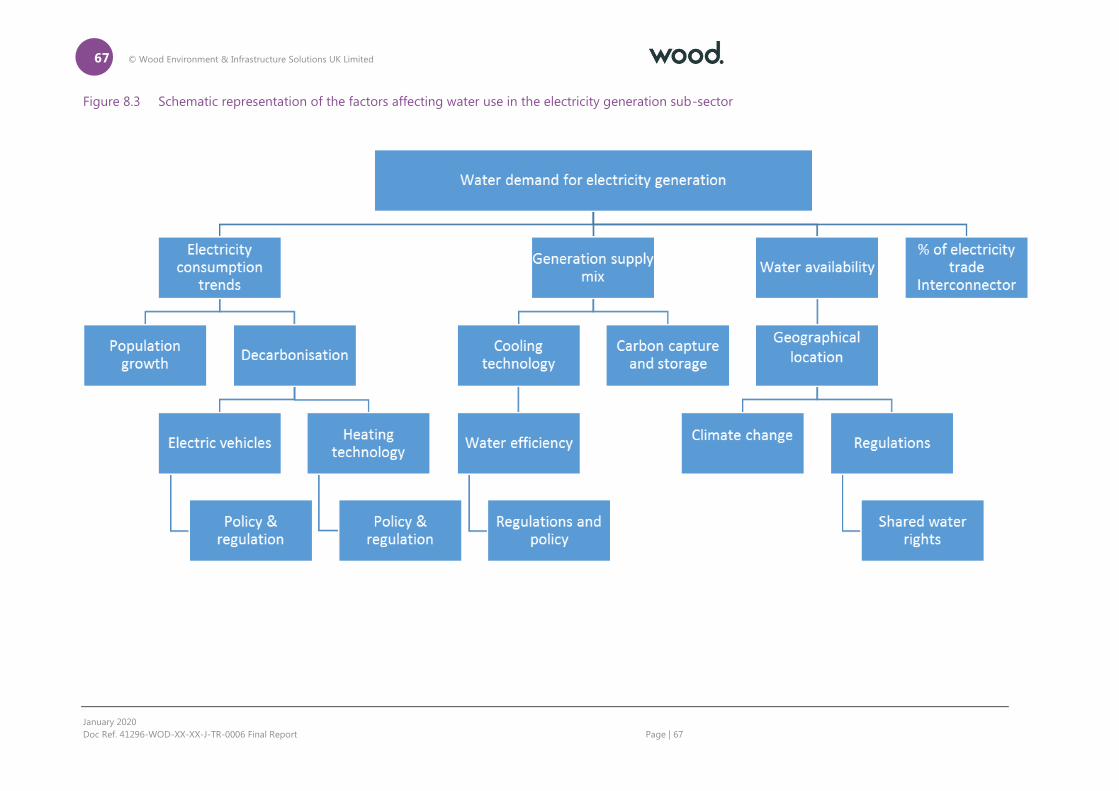
67 © Wood Environment & Infrastructure Solutions UK Limited
January 2020
Doc Ref. 41296-WOD-XX-XX-J-TR-0006 Final Report Page | 67
Figure 8.3 Schematic representation of the factors affecting water use in the electricity generation sub-sector
68 © Wood Environment & Infrastructure Solutions UK Limited
January 2020
Doc Ref. 41296-WOD-XX-XX-J-TR-0006 Final Report Page | 68
Total water demand in the sector is primarily driven by electricity demand and the generation supply mix.
The factors affecting water use in the sector are further explored in Table 4.
Table 8.6 Factors affecting water use in the electricity generation sub-sector
Factor Description Effect on water use
Electricity Supply Mix
Percentage of electricity generation technology is the overall supply mix by 2050
Dependent on cooling technology, Nuclear and Conventional Thermal Power Generation high non-consumptive water use (see Table 1 and Table 3). Their share in the overall supply mix will drive water usage. Freshwater demand will depend on location with any new nuclear plan likely to be located at the coast.
Gas Supply Qualitative and quantitative Cost/ Benefit of Gas
Competitive fuel supply for electricity generation and prices will lead to increase in the attractiveness of conventional thermal (bearing in mind the competitive element of the generation sector being unregulated)
CSS - Carbon capture and storage
Eliminating any CO2 emissions from thermal generation sites
There would be an increase in the use of water due to the increase in the attractiveness of conventional thermal power. In addition, the deployment of CCS to abate carbon emissions is reported to require a noteworthy increase in a thermal power station’s water demand - approximately double the non-CCS equivalent (Murrant et al., 2015)
This will be one of the main drivers of higher water demand in the future.
Climate Change Policies/Decarbonization
Increase in clean energy solutions. Productivity gains through water efficiency measures
Overall decarbonization of the UK will likely mean higher electricity demand and this is associated with higher water demand (depending on energy mix) Increase in electricity demand due to decarbonization and switching (e.g. transport (Electric vehicles (EVs)), heating etc). This could lead to increased water demand which may be offset by cooling technology.
Transport Policy The increased use of EVs will drive electricity demand
High electricity demand may imply high usage of water if conventional technologies take on large percentage in the supply mix.
Cooling Technology
Type of cooling technology employed at the power plant: Once-through; Closed-loop; and Dry-cooling
Closed loop technology is likely to be the technology of choice as it is best for efficient plant operations and for least consumptive water use.
8.3 Key pressures and drivers affecting and expected to affect the
sector’s water use
The key pressures affecting the energy sector’s water use is the estimated generation supply mix. It stands in direct
relationship to the use of water associated with the proportion of thermal generation technology and
nuclear. As outlined above, both nuclear and CCS are likely to require significantly more water than
conventional coal or gas thermoelectric power stations.
Political
The sector in the UK has been operating in a liberalised market for a long time and as it is only driven my
market forces it has become a very efficient sector operating in the overall electricity supply industry. Being a
69 © Wood Environment & Infrastructure Solutions UK Limited
February 2020
Doc Ref. 41296-WOD-XX-XX-J-TR-0006i2 Final Report Page | 69
non-regulated sector, political influence on power generation capacity installations have been limited to
policy incentives such as feed-in tariffs which have made renewable energy viable for a long time.
Unlike the distribution and the supply sector, planning for the electricity generation industry is not a joint
exercise. Hence policy decisions can have huge impacts on the financial decision making of the energy
sector. There is also still a missing coherent discussion on a multi sector level regarding optimizing resource
use (including water).
However, the electricity sector and the historical perspective described above that still dominates today is
undergoing unprecedented change. Legislation to reduce greenhouse gas emissions GHGs (e.g. Climate
Change Act 2008), decarbonisation and the policy incentives to facilitate and accelerate the development of
low-carbon electricity supply are driving change. For example, electricity demand is expected to grow
significantly by 2050, driven by increased electrification of transport and heating. There could be as many as
36 million electric vehicles (EVs) by 2050 (National Grid, 2019). The expected growth of low carbon and
decentralised generation means the electricity system will need to change. Capacity could increase from 103
GW today to between 175 GW and 233 GW by 2050 (National Grid, 2019). While demand is projected to
increase, ultimately it will be the energy supply mix, the plant load factor profiles and overall the plant
location that will determine the future water demand within the sector.
The UKs departure from the EU will also result in changes to trade regulations and policies which could
present changes to the interconnector activities and hence changes in the gas supply. The interconnector is a
pipeline, providing the physical capability to move gas from Bacton in the UK, to Zeebrugge in Belgium, and
vice versa. To date it has been a key factor in the liberation of energy markets across Europe - enabling
energy trading and creating economic activity in the process.
The political will to make Carbon Capture and Storage (CCS) a driving force in the future to reach carbon
neutrality by 2050 (or earlier) will have a very large effect on the extent to which thermal power generation
technology can remain attractive. Hence increased CCS will have a direct relative effect on cooling water
needs and hence on the demand for the ideal geographic location and water availability.
Economic
A lot more electricity is needed at competitive prices if the decarbonisation process is to reach carbon
neutrality by 2050. Therefore, the investment conditions must be right to provide the generation capacity to
be able to cope with such extended demand.
The electricity sector is purely market driven (apart from the distribution network which is regulated). There is
no power sector master plan and the UK power station fleet mix evolves through decisions on investment
based on individual company views on the UK market (e.g. risk/reward versus other opportunities). The
generation mix will depend on investment decisions and on the least cost option available for a certain
supply arrangement. Since the sector is a competitive liberalised business, its entire cost base is driven by
market prices. The Levelized Cost of Electricity calculation, which forms the corner stone of any investment
decision, is based on a CAPEX and OPEX calculations available at the time. For the Thermal Power Generation
business, next to access to financing, this largely depends on fuel price assumptions and fuel supply
availability. It is therefore difficult to put any confidence behind predicted energy mixes that will support the
future electricity demand beyond any investment decision horizon.
Social
Providing low-cost and environmentally benign electricity has an immense positive social impact. This
combined with being the enabler of the whole decarbonisation future and hence the driving force behind
clean air, new transport initiatives, new industries creating new jobs etc. needs to outweigh the negative
70 © Wood Environment & Infrastructure Solutions UK Limited
February 2020
Doc Ref. 41296-WOD-XX-XX-J-TR-0006i2 Final Report Page | 70
impact this may have on the environment. Increased demand-side measures will also be a factor in the future
(e.g. smart grids and internet of things etc).
Environmental and Technological
A key future challenge with respect to water use is its availability. Growing pressure on water resources from
impacts of climate change are set to increase and managing the varied needs of multiple sector abstractors
and maintaining environmental flows will be key in the abstraction reform process.
Demand for cooling water abstractions from rivers is likely to increase with the possible uptake of CCS. CCS
may prove to be essential if the UK is to achieve its carbon dioxide and greenhouse gas emission targets. In a
scenario of high CCS, demands for water greatly exceed current and future availability in the north-west (NW)
England, Humber, East (E) Midlands and Thames regions, which leads in to the careful consideration of
potential geographic regions for sitting new plant (Byers et al., 2015). Although in many cases current
locations with generation facilities may be extended and existing plants may get replaced or at least
upgraded, new locations will need to be made available if demand is met by a large proportion of
conventional and/or nuclear power.
As discussed in detail above, the choice of cooling technology diploid for new plants will mostly likely be
determined by the local environment and its water availability.
Finally, the concept of shared water rights needs also to be investigated further. Multi-Sector agreements on
the shared use of water could have significant effects on optimizing non-consumptive water demand while
keeping the production output of the industry (or electricity of the generator) at optimal levels. This
optimization process can function on many levels and can vary throughout the day, seasonally or consider
planned outage times.
8.4 The future and water use in the sector
There are three main factors that will influence future water demand in the electricity generation sector;
Electricity demand
The mix of electricity generation plants
The types of cooling systems that are employed at thermal plants
A further influencing factor on the future freshwater demand will be the location of the electricity
generation fleet.
Driven by decarbonisation it will be the energy supply mix and the nature of its technological approach that
will determine the future water demand within the sector. Once the electricity supply mix is presented in a
future scenario, the associated water demand can be estimated more accurately. However, it needs to be
stressed that there is a large uncertainty attached to estimating future water demand in the electricity sector.
Too many uncertainties regarding its drivers (Table 8.6) and their quantitative impact in the long-term future
are currently present. The power industry, and its competitive unregulated nature, will adjust to policies along
the way. It will be driven by the right investment decision at the time and within its technical constraints
(which could mean availability of water at a certain location)
In its 2018 report, Future Energy Scenarios (National Grid, 2018), the National Grid provided a ‘refreshed’
scenario framework to reflect the increasing importance of decentralisation and decarbonisation in the
sector. The report provides an outline of the different pathways for future of energy to 2050 and beyond.
Four scenarios based on ‘consumer evolution’; ‘community renewables’; ‘steady progression’ and ‘two
degrees’ are aligned to axes considering:
71 © Wood Environment & Infrastructure Solutions UK Limited
February 2020
Doc Ref. 41296-WOD-XX-XX-J-TR-0006i2 Final Report Page | 71
The speed of decarbonisation in the sector (driven by policy, economics and customer attitudes)
The level of decentralisation of the sector (highlights how close production and management of
energy is to the end consumer)
While not specifically focussing on water demand the underlying scenarios and assumptions could also be
applied in developing future water demand narratives and modelling scenarios. From these only the
‘community renewables’ and ‘two degrees’ scenarios enable the sector to meet the UKs 2050 carbon
reduction target. The key findings from the report are:
Electricity demand is expected to grow significantly by 2050, driven by increased electrification of
transport and heating. For example, there could be as many as 11 million electric vehicles (EVs) by
2030, and 36 million by 2040 (National Grid, 2018). Electric vehicle growth goes hand-in-hand with
electricity decarbonisation. Smart charging and vehicle-to-grid technology will actively support the
decarbonisation of electricity.
The expected growth of low carbon and decentralised generation means the electricity system will
need to change. Capacity could increase from 103 GW today to between 189 GW and 268 GW by
2050, with the more decarbonised scenarios requiring the highest capacities. Up to 65 per cent of
generation could be local by 2050 (Byers et al., 2014).
Gas will continue to play a role in providing reliable, flexible energy supplies for the foreseeable
future. New technologies and sources of low carbon gas can decarbonise the whole energy sector.
Its usage patterns will change, providing flexibility for both heat and generation complementing
renewables. Hydrogen could also play a key part in a decarbonised energy world, either produced
from natural gas alongside carbon capture utilisation and storage (CCUS) or by electrolysis using
surplus renewable generation.
In 2014, Byers et al., presented a model that quantified current water use of the UK electricity sector and used
it to test six decarbonisation pathways to 2050 in meeting demand of 520 to 752 TWh/yr. The pathways
consist of a variety of generation technologies, with associated cooling methods, water use factors and
cooling water sources.
The findings from the model highlighted that up to 2030, water use across the six pathways is fairly
consistent and all achieve significant reductions in both carbon and water intensity, based upon a transition
to closed loop and hybrid cooling systems (Figure 8.4 and Figure 8.5). From 2030 to 2050 results diverge.
Pathways with high levels of carbon capture and storage result in freshwater consumption that exceeds
current levels (37–107%), and a consumptive intensity that is 30–69% higher (Figure 8.4 and Figure 8.5). Risks
to the aquatic environment will be intensified if generation with carbon capture and storage is clustered.
Pathways of high nuclear capacity result in tidal and coastal abstraction that exceed current levels by 148–
399%.

72 © Wood Environment & Infrastructure Solutions UK Limited
February 2020
Doc Ref. 41296-WOD-XX-XX-J-TR-0006i2 Final Report Page | 72
Figure 8.4 Water abstraction and consumption over all sources for the six pathways from 2007 to 2050
(Byers et al., 2014)
Figure 8.4 shows the water abstraction scenarios for the six pathways used in the Byers paper. It gives a good
overview of the variability of seawater and tidal water abstraction depending on the scenario used (i.e.
energy supply mix and min /max demand by 2050) and highlights how small freshwater abstraction is in
comparison. The graphics in the second row of Figure 8.4 show the water consumption rates associated with
each scenario. Again, this clearly shows the anticipated increase in freshwater consumption for the CCS
pathways from 2030 and a reduction in freshwater consumption which approaches zero by 2050 in the
nuclear option.
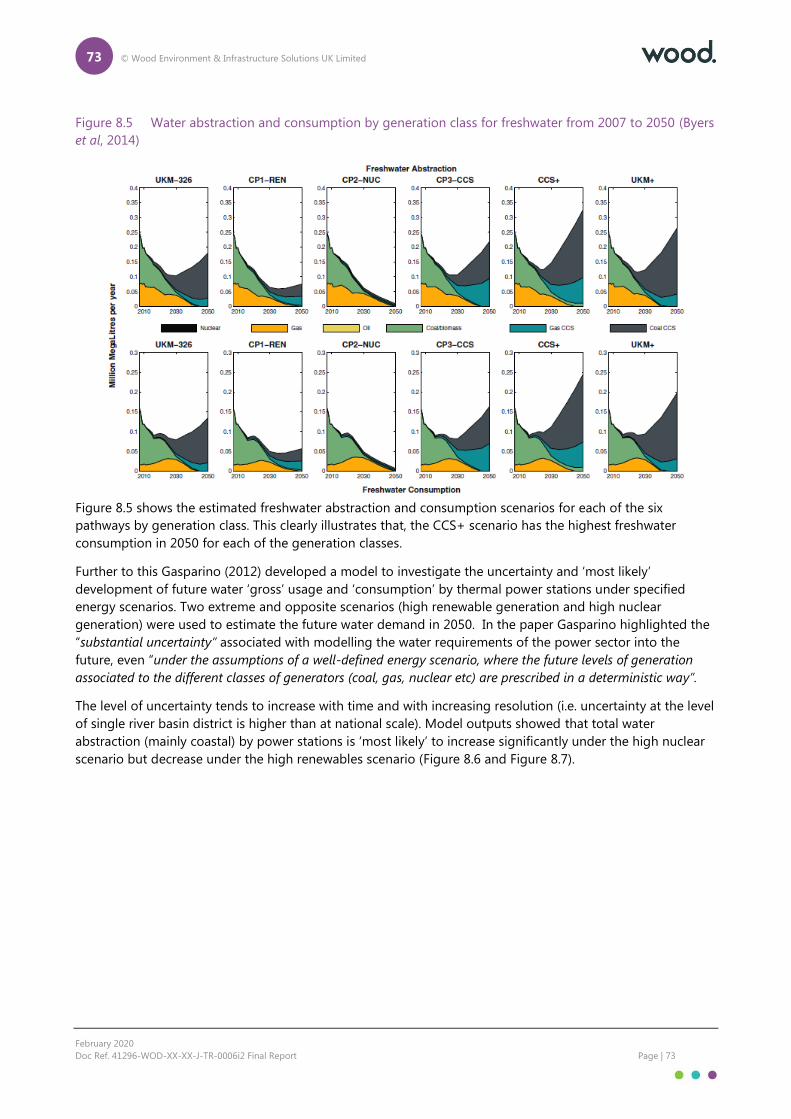
73 © Wood Environment & Infrastructure Solutions UK Limited
February 2020
Doc Ref. 41296-WOD-XX-XX-J-TR-0006i2 Final Report Page | 73
Figure 8.5 Water abstraction and consumption by generation class for freshwater from 2007 to 2050 (Byers
et al, 2014)
Figure 8.5 shows the estimated freshwater abstraction and consumption scenarios for each of the six
pathways by generation class. This clearly illustrates that, the CCS+ scenario has the highest freshwater
consumption in 2050 for each of the generation classes.
Further to this Gasparino (2012) developed a model to investigate the uncertainty and ‘most likely’
development of future water ‘gross’ usage and ‘consumption’ by thermal power stations under specified
energy scenarios. Two extreme and opposite scenarios (high renewable generation and high nuclear
generation) were used to estimate the future water demand in 2050. In the paper Gasparino highlighted the
“substantial uncertainty” associated with modelling the water requirements of the power sector into the
future, even “under the assumptions of a well-defined energy scenario, where the future levels of generation
associated to the different classes of generators (coal, gas, nuclear etc) are prescribed in a deterministic way”.
The level of uncertainty tends to increase with time and with increasing resolution (i.e. uncertainty at the level
of single river basin district is higher than at national scale). Model outputs showed that total water
abstraction (mainly coastal) by power stations is ‘most likely’ to increase significantly under the high nuclear
scenario but decrease under the high renewables scenario (Figure 8.6 and Figure 8.7).
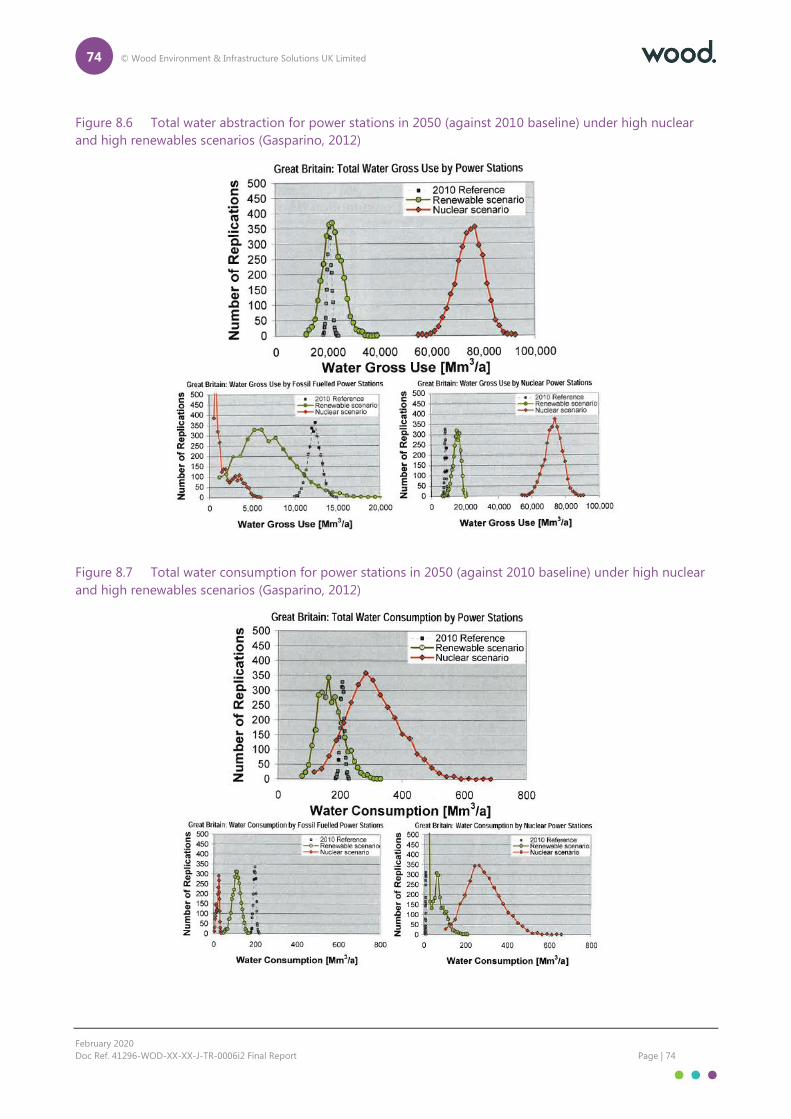
74 © Wood Environment & Infrastructure Solutions UK Limited
February 2020
Doc Ref. 41296-WOD-XX-XX-J-TR-0006i2 Final Report Page | 74
Figure 8.6 Total water abstraction for power stations in 2050 (against 2010 baseline) under high nuclear
and high renewables scenarios (Gasparino, 2012)
Figure 8.7 Total water consumption for power stations in 2050 (against 2010 baseline) under high nuclear
and high renewables scenarios (Gasparino, 2012)
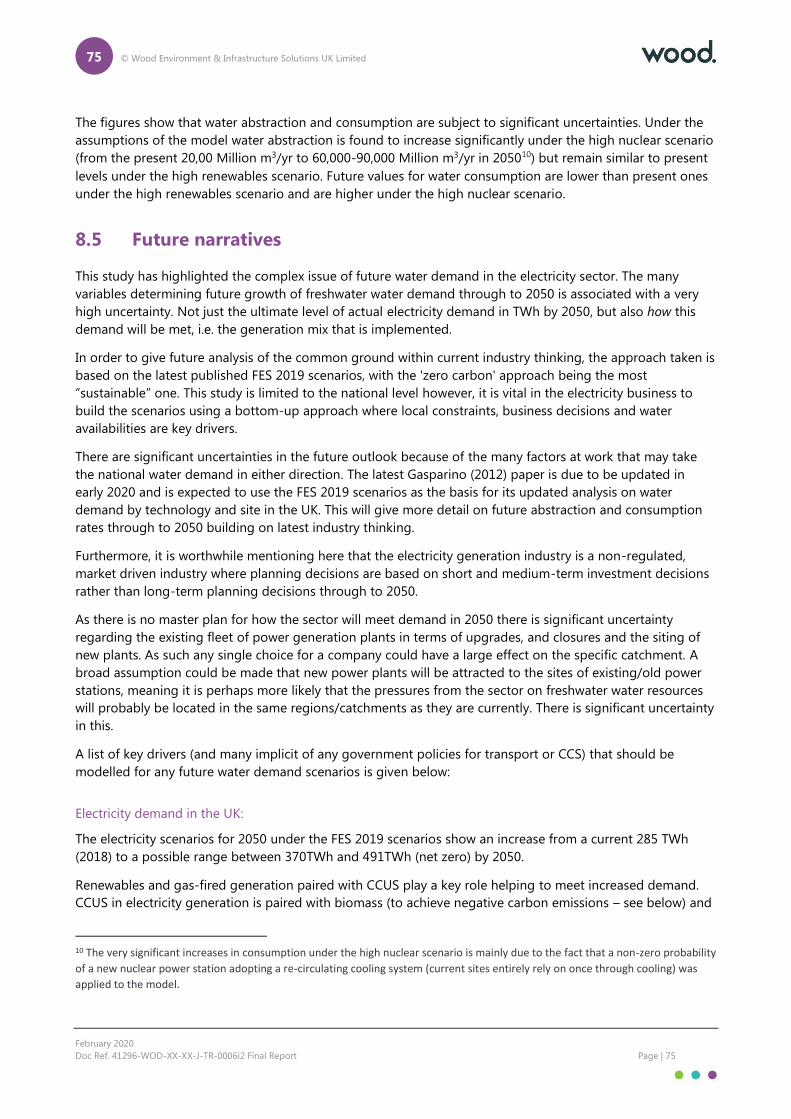
75 © Wood Environment & Infrastructure Solutions UK Limited
February 2020
Doc Ref. 41296-WOD-XX-XX-J-TR-0006i2 Final Report Page | 75
The figures show that water abstraction and consumption are subject to significant uncertainties. Under the
assumptions of the model water abstraction is found to increase significantly under the high nuclear scenario
(from the present 20,00 Million m3/yr to 60,000-90,000 Million m3/yr in 205010) but remain similar to present
levels under the high renewables scenario. Future values for water consumption are lower than present ones
under the high renewables scenario and are higher under the high nuclear scenario.
8.5 Future narratives
This study has highlighted the complex issue of future water demand in the electricity sector. The many
variables determining future growth of freshwater water demand through to 2050 is associated with a very
high uncertainty. Not just the ultimate level of actual electricity demand in TWh by 2050, but also how this
demand will be met, i.e. the generation mix that is implemented.
In order to give future analysis of the common ground within current industry thinking, the approach taken is
based on the latest published FES 2019 scenarios, with the 'zero carbon' approach being the most
“sustainable” one. This study is limited to the national level however, it is vital in the electricity business to
build the scenarios using a bottom-up approach where local constraints, business decisions and water
availabilities are key drivers.
There are significant uncertainties in the future outlook because of the many factors at work that may take
the national water demand in either direction. The latest Gasparino (2012) paper is due to be updated in
early 2020 and is expected to use the FES 2019 scenarios as the basis for its updated analysis on water
demand by technology and site in the UK. This will give more detail on future abstraction and consumption
rates through to 2050 building on latest industry thinking.
Furthermore, it is worthwhile mentioning here that the electricity generation industry is a non-regulated,
market driven industry where planning decisions are based on short and medium-term investment decisions
rather than long-term planning decisions through to 2050.
As there is no master plan for how the sector will meet demand in 2050 there is significant uncertainty
regarding the existing fleet of power generation plants in terms of upgrades, and closures and the siting of
new plants. As such any single choice for a company could have a large effect on the specific catchment. A
broad assumption could be made that new power plants will be attracted to the sites of existing/old power
stations, meaning it is perhaps more likely that the pressures from the sector on freshwater water resources
will probably be located in the same regions/catchments as they are currently. There is significant uncertainty
in this.
A list of key drivers (and many implicit of any government policies for transport or CCS) that should be
modelled for any future water demand scenarios is given below:
Electricity demand in the UK:
The electricity scenarios for 2050 under the FES 2019 scenarios show an increase from a current 285 TWh
(2018) to a possible range between 370TWh and 491TWh (net zero) by 2050.
Renewables and gas-fired generation paired with CCUS play a key role helping to meet increased demand.
CCUS in electricity generation is paired with biomass (to achieve negative carbon emissions – see below) and
10 The very significant increases in consumption under the high nuclear scenario is mainly due to the fact that a non-zero probability
of a new nuclear power station adopting a re-circulating cooling system (current sites entirely rely on once through cooling) was
applied to the model.
76 © Wood Environment & Infrastructure Solutions UK Limited
February 2020
Doc Ref. 41296-WOD-XX-XX-J-TR-0006i2 Final Report Page | 76
also with natural gas. By 2050, 43 TWh of electricity is produced via biomass paired with CCUS each year, and
gas-fired generation is only used in conjunction with CCUS. Further, post 2030 interconnectors may result in
a net export from UK which could mean an increased water footprint in UK linked to the UK generation
sources not associated with UK end user demand. The higher the gas-fired power generation capacity paired
with CCS, the higher the water consumption.
Electricity generation capacity/Electricity Supply Mix:
FES Scenarios 2019 show an increase by 2050 of between 218 GW to 263 GW. How this increase will be
generated will be crucial in determining the water demand within the sector. The more thermal generation
capacity is needed, the higher the water consumption.
Nuclear Generation Capacity: For nuclear sites it may be reasonable to assume non-SMR/AMR
(Small/Advanced Modular Reactor) nuclear plant would be coastal/estuarine. Hence an increase in
overall water abstraction (primarily tidal) but freshwater consumption should be limited.
Thermal Generation Capacity: Conventional thermal generation capacity to be replaced by CCGT
plus CCUS.
Natural Gas including CCS (Carbon Capture Storage): Given the high capex that CCGT-CCUS
plant would require, the mechanism by which the economics of such options would be attractive
to investors is unclear. National Grid (in FES) do not deal with this as part of the scenario
construction but assume that sufficient ‘policy incentive’ will be in place. Various CCS technologies
are currently being developed. Some lead to additional water demand within process. All lead to
an overall significant reduction in the thermal efficiency of the CCGT-CCS compared with the CCGT
without CC(U)S leading to increased specific use of water (m3/MWhe). More research needs to go
into scenario building with CCS and water demand.
Location of power plant
The location of future power plant is highly uncertain. Although there is a tendency for new generation to be
attracted to existing or historical sites, there are a variety of new locational signals likely to develop in the
next few decades, and capacity and generation would respond to them. As such, simple assumptions that
resource pressures will remain where they are now may not be appropriate.
Historically, nuclear power plant have been located on UK estuaries and coastal sites and therefore have not
exerted a demand on freshwater for cooling. Depending on plant arrangement specifics, sites in these coastal
locations may yet exert an appreciable non-household demand on Public Water Supply infrastructure if
steam cycle make up water is sourced from public supply. Furthermore, in future scenarios with a greater role
of decentralised supply, Small Modular Reactors and Advanced Modular Reactors may offer the potential for
different locations than those historically used by nuclear power plant – potentially bringing demand for
water inland to fresh water sources.
Flexibility and resilience
Flexibility in the future system is key. Higher generation by renewables with greater variability in output
means that installed generation capacity needs to provide added resilience. Under higher renewable
scenarios, there remains a requirement (likely via the gas fleet (with CCUS)) to generate electricity on demand
during “stress conditions” in which peak demand coincides with low wind and/or solar generation. The
resilience of the electricity system depends therefore on the capability to generate, on request. As such, even
if the annual average load factors for gas plant (under some of the FES19 scenarios) might be small, it is
possible that a high proportion of installed gas capacity could operate ‘simultaneously’ (when a ‘stress event’
occurs) resulting in high short-term water consumption.
77 © Wood Environment & Infrastructure Solutions UK Limited
February 2020
Doc Ref. 41296-WOD-XX-XX-J-TR-0006i2 Final Report Page | 77
Magnitude and direction of change in water use under each scenario
In considering the key drivers for water demand set out above an overall trend or narrative for the sector can
be established. In general, the energy supply mix will ultimately determine (or vice versa) the water
consumption in the future. Future government policies, whether they are transport related to force EVs or
zero carbon emissions, it all comes with an increase in electricity demand which if not carefully managed can
put pressure on the UK’s water resources.
8.6 Gaps in knowledge
In the short to medium term there remains considerable uncertainty on the future growth in water demand
and direction of the sector due to:
Difficulties the industry is facing (i.e. nuclear investment decisions, no coherent sector planning,
etc, alignment electricity industry with water industry)
Government direction on transport and emissions policies, water consumption policies (water
rights/trading) which will determine the demand for electricity to be generated and with this the
water needed
Without having yet undertaken a thorough analysis of the Future Energy Scenarios 2019 (FES 2019), Energy
UK believes that the uncertainty range is likely to be greater than that seen in earlier research and their
previous analyses (e.g. Gasparino, 2012). This is a result of the nature of the FES 2019 scenarios and the high
degree of uncertainty in the energy mix needed to meet Climate Change Act 2008 2050 targets, or Net Zero
targets. Uptake of natural gas with Carbon Capture Usage and Storage (CCUS) varies considerably between
scenarios and could have a large impact on water demand.
Given that the Net Zero scenario developed within FES 2019 could correspond to the highest potential water
demand (based on the need for more biomass and gas-CCUS plant) it may be necessary to further develop
the assumptions around this and explore the implications further as part of Energy UK’s planned work in
2020.
However, the sector is currently very engaged in this area with new research planned over the coming
months based on the FES 2019 data, and work amongst regional water resources planning groups will push
the agenda forward. More stakeholder engagement and a common purpose driven outlook will need to take
place to be able to determine with more certainty and future outlook for water demand to 2050 in a
sustainable way.
78 © Wood Environment & Infrastructure Solutions UK Limited
February 2020
Doc Ref. 41296-WOD-XX-XX-J-TR-0006i2 Final Report Page | 78
9. Sector summary: Paper and Pulp
manufacturing
9.1 Sub-sector overview
There are three broad sub-sectors within the paper industries: paper production; paper processors; and
corrugators and convertors. The primary water using sector within the industry is paper production (paper
mills). There are currently 34 mills in operation in England (5 in Wales and 4 in Scotland) which produce a
number of different paper types which are commonly categorised as follows:
Speciality papers (a catch all term including medical, security and filter papers)
Recycled packaging
Tissue / hygiene
Newsprint (now only two mills in operation in UK)
In 2017, the UK produced around 3.85 million tonnes of paper (Pita, 2018). About half of that paper was for
packaging uses, with the rest divided between tissue, graphics and speciality papers. However, the majority
of paper and board consumed in the UK in 2016, more than 6 million tonnes (60%), was imported for direct
use as paper or conversion into other paper products. Competition in the sector is high, particularly in
commoditised paper grades where margins are small. Competition is global, with UK mills competing with
mills both in Europe and further afield (BEIS, 2017).
The pulp and paper sector in the UK is dominated by 17 companies. Geographically paper mills are located
across England with the primary clusters in the South East (North Kent) and North West (Greater
Manchester). Mills are also dispersed across the South West, Lake District, Northumberland and the Midlands
(D, Stringer pers. comm.).
The paper life cycle is complex and made up of a number of individual but interrelated processes, each with
specific inputs and outputs. Put simply, fibres are suspended in water to form a pulp, this is laid down to form
a sheet which is then dewatered and dried into paper in the paper machine. Finally, the paper is treated in
the finishing line to have a paper of desired quality (BEIS, 2015). In 2018 Consumer Price Index (CPI) reported
that 68% of all raw materials used in UK papermaking is recovered fibre, while 26% is virgin fibre sourced
from sustainably managed forests. In addition to raw materials, energy and water are required to make paper
and in addition to paper products the industry also produces waste and emissions to air and water.
Virgin paper production and paper recycling are fully dependent on each other for paper production to
remain sustainable. There is a minimum fibre length requirement for recycling of paper to be feasible and
since the re-pulping process shortens the paper fibre, virgin fibre or high-quality recovered fibre (RCF) must
be introduced to the paper loop to compensate for the loss of fibre. Newsprint manufacturing uses the
highest percentage of RCF, with almost 100% of newsprint produced in the UK made from recovered fibre.
The lowest recycled contents, on the other hand, are found in printings and writings (P&W) and tissue paper,
mostly because of customer perceptions and requirements.
9.2 Water use within the sub-sector
Water is an important resource in the paper industry. It is used in the processing stage of papermaking (e.g.
for pulping and as steam for drying the paper), but it is also used to cool down the mill equipment. The

79 © Wood Environment & Infrastructure Solutions UK Limited
February 2020
Doc Ref. 41296-WOD-XX-XX-J-TR-0006i2 Final Report Page | 79
significant water involved in the process is either sourced by local surface water or groundwater abstraction
(41% in 2009) or mains supply (59% in 2009) (Defra, 2012). The source of water depends on geographic
location of the mill. The 2011 WRAP study (WRAP, 2011) to determine where and how freshwater resources
are used by non-household sectors across the UK presents a summary of the total abstracted water use from
non-tidal sources in England excluding major non-consumptive uses (based on 2006 data sourced from the
National Abstraction Licensing Database (NALD)). The reported volume for the ‘Manufacture of paper and
paper products’ was 51,356Ml/d (51 Million m3).
In 2015 CPI reported that the 77 Million m3 of abstracted water was involved in the UK paper industry,
however, the majority (86%) of this water is recirculated and ultimately returned to the environment
following treatment. There are other reports of up to 95% ultimately being returned to the environment
(PITA, 2018). Consumptive water use (14% of water abstracted in 2015) is water that evaporates or water that
is incorporated into the product and varies considerably for each product type and the associated processes
employed within any give mill. Water use in the paper industry is summarised in Figure 9.1 below.
Figure 9.1 Water use for papermaking (source CPI 2018)
Defra (2012) presented a breakdown of the flows in water use (similar to those shown in Figure 1) for 2009
(as reported by Environment Agency’s Pollution Inventory Database based on data from 39 mills) and 2010
(as calculated by CPI based on a survey of the paper industry with responses from 21 mills representing 73%
of the industry). These data are shown in Table 9.1 below.
Table 9.1 Water use of the UK paper Industry in 2009 and 2010
2009 (‘000m3) 2010 (‘000m3)
Total Production 4,292,619 4,299,996
Freshwater intake
- Abstracted by source and other water received at the mill
83,616 79,290
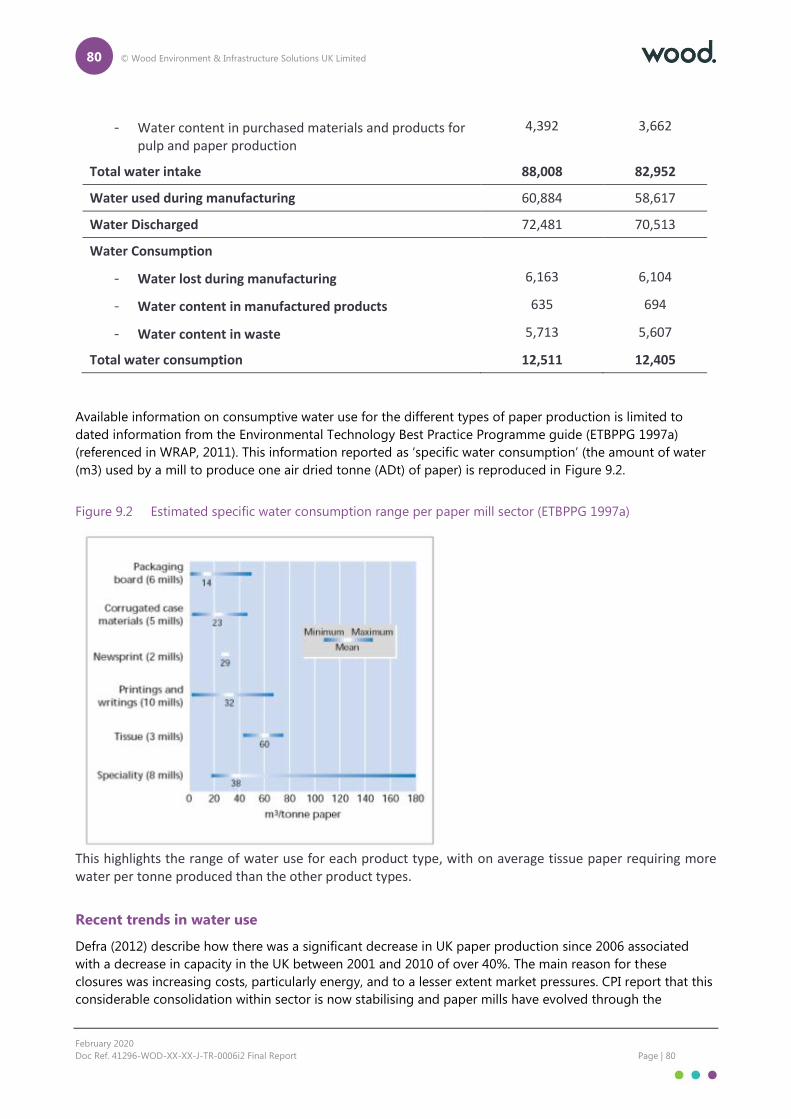
80 © Wood Environment & Infrastructure Solutions UK Limited
February 2020
Doc Ref. 41296-WOD-XX-XX-J-TR-0006i2 Final Report Page | 80
- Water content in purchased materials and products for pulp and paper production
4,392 3,662
Total water intake 88,008 82,952
Water used during manufacturing 60,884 58,617
Water Discharged 72,481 70,513
Water Consumption
- Water lost during manufacturing 6,163 6,104
- Water content in manufactured products 635 694
- Water content in waste 5,713 5,607
Total water consumption 12,511 12,405
Available information on consumptive water use for the different types of paper production is limited to
dated information from the Environmental Technology Best Practice Programme guide (ETBPPG 1997a)
(referenced in WRAP, 2011). This information reported as ‘specific water consumption’ (the amount of water
(m3) used by a mill to produce one air dried tonne (ADt) of paper) is reproduced in Figure 9.2.
Figure 9.2 Estimated specific water consumption range per paper mill sector (ETBPPG 1997a)
This highlights the range of water use for each product type, with on average tissue paper requiring more water per tonne produced than the other product types.
Recent trends in water use
Defra (2012) describe how there was a significant decrease in UK paper production since 2006 associated
with a decrease in capacity in the UK between 2001 and 2010 of over 40%. The main reason for these
closures was increasing costs, particularly energy, and to a lesser extent market pressures. CPI report that this
considerable consolidation within sector is now stabilising and paper mills have evolved through the
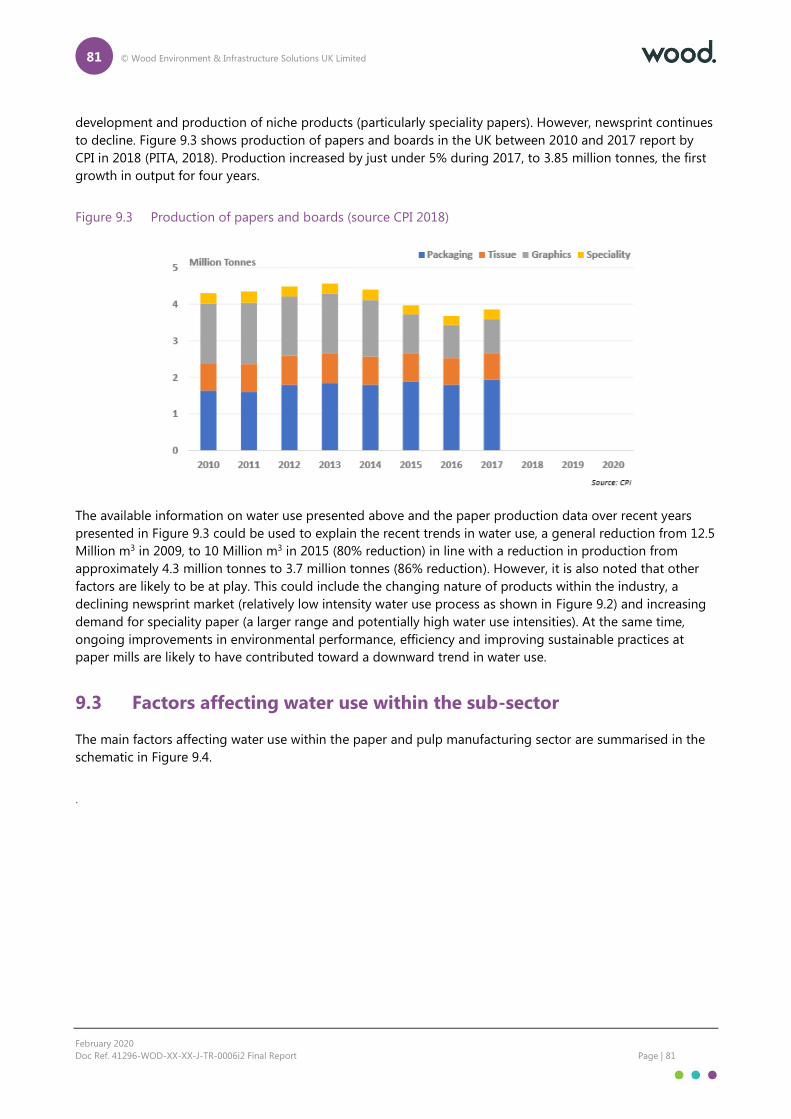
81 © Wood Environment & Infrastructure Solutions UK Limited
February 2020
Doc Ref. 41296-WOD-XX-XX-J-TR-0006i2 Final Report Page | 81
development and production of niche products (particularly speciality papers). However, newsprint continues
to decline. Figure 9.3 shows production of papers and boards in the UK between 2010 and 2017 report by
CPI in 2018 (PITA, 2018). Production increased by just under 5% during 2017, to 3.85 million tonnes, the first
growth in output for four years.
Figure 9.3 Production of papers and boards (source CPI 2018)
The available information on water use presented above and the paper production data over recent years
presented in Figure 9.3 could be used to explain the recent trends in water use, a general reduction from 12.5
Million m3 in 2009, to 10 Million m3 in 2015 (80% reduction) in line with a reduction in production from
approximately 4.3 million tonnes to 3.7 million tonnes (86% reduction). However, it is also noted that other
factors are likely to be at play. This could include the changing nature of products within the industry, a
declining newsprint market (relatively low intensity water use process as shown in Figure 9.2) and increasing
demand for speciality paper (a larger range and potentially high water use intensities). At the same time,
ongoing improvements in environmental performance, efficiency and improving sustainable practices at
paper mills are likely to have contributed toward a downward trend in water use.
9.3 Factors affecting water use within the sub-sector
The main factors affecting water use within the paper and pulp manufacturing sector are summarised in the
schematic in Figure 9.4.
.
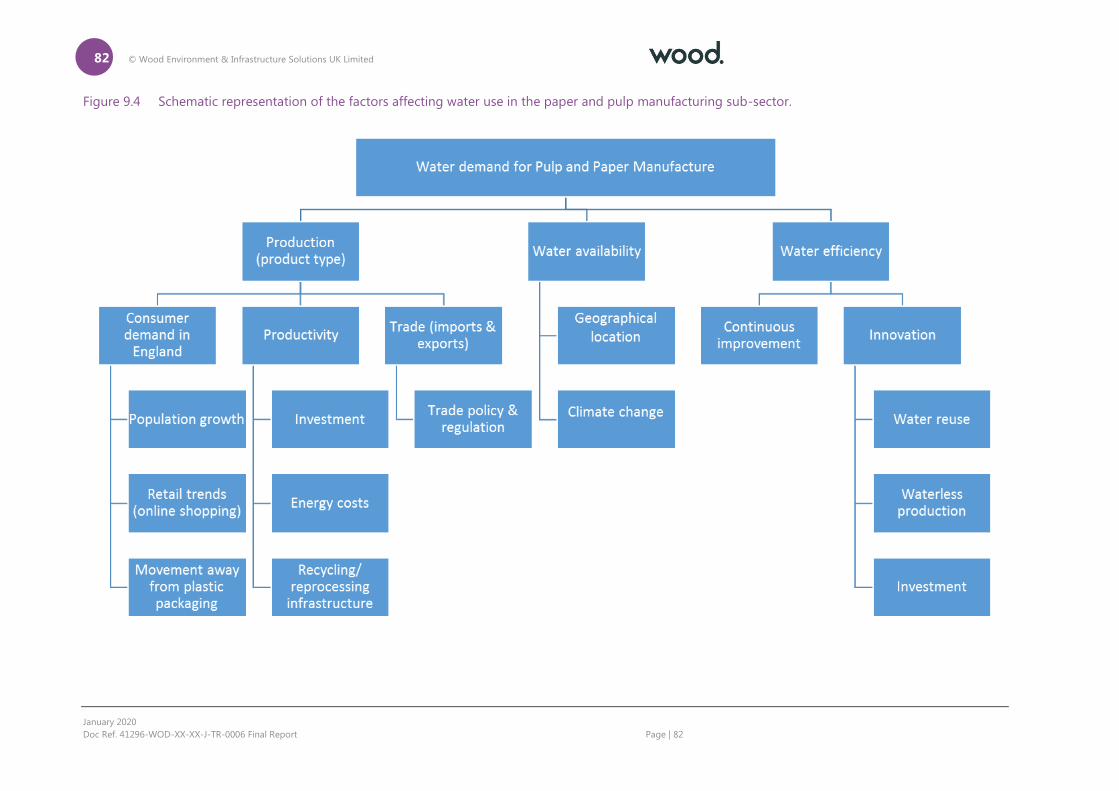
82 © Wood Environment & Infrastructure Solutions UK Limited
January 2020
Doc Ref. 41296-WOD-XX-XX-J-TR-0006 Final Report Page | 82
Figure 9.4 Schematic representation of the factors affecting water use in the paper and pulp manufacturing sub-sector.

83 © Wood Environment & Infrastructure Solutions UK Limited
January 2020
Doc Ref. 41296-WOD-XX-XX-J-TR-0006 Final Report Page | 83
Total water demand in the sector depends on product type, the availability of a consistent water supply and
the level of water efficiency that has been introduced into the production process. The factors affecting water
use in the sector are further explored in Table 9.2.
Table 9.2 Factors affecting water use in the paper manufacturing sub-sector
Description Effect on water use
Consumer demand for paper products
Changes in production driven by demand
The industry is already relatively efficient regarding water used therefore likely to be well correlated with demand which is also predicted to remain relatively stable (assuming the balance of imported and exported products remains the same). Changes in demand across the different product types could have a small effect on water use due to the different processes involved. For example, the demand for cardboard packaging and the move towards online retailing.
Sustainability, recycling and plastic use trends
A change in perception and move away from plastic products
Changing social habits are creating opportunity. After widespread media focus on plastic pollution a number of retailers are reported to have expressed a desire to switch packaging medium. Paper is perceived to be the leading biobased, sustainable, renewable, and recyclable option.
Continuous improvement
Best practice in efficient water use and corporate wide sustainability strategies.
The industry works with regulators to ensure sustainable abstraction and best practice in efficient water use. There is no specific Best Available Technique (BAT) for water use there are associated environmental performance levels (AEPL) for the amount of waste water the site generates per tonne of production. This is one key driver for the sector to reduce consumption. CPI environmental footprint and water abstraction were particularly important in 2017.
9.4 Key pressures and drivers affecting and expected to affect the
sector’s water use
Political and Legal
Of the UK’s major papermakers, only one is headquartered in the UK, and most are pan-European businesses
where decisions are taken outside the UK (CPI, 2018a). The current status of Brexit has meant the Boards of
those companies to target their investments in economies where the policy and trading environment is more
stable.
All of the paper mills in England are permitted through the Environmental Permitting (England and Wales)
Regulations 2010 which are enforced by the Environment Agency. Permits are generally based on the EU
BREF (Best Available Techniques (BAT) reference document) for the Production of Pulp, Paper and Board.
While there is no specific BAT for water use there are associated environmental performance levels (AEPL)11
for the amount of waste water the site generates per tonne of production. This is one key driver for the
sector to reduce consumption. Once the outcome of Brexit becomes clear long-term effects associated with
update to the sector BREF when it is revised again, currently scheduled for 2022, could be a driver for change.
For example, the development of a UK alternative BREF could create an unlevel playing field globally and
lead to a reduction in investment in the UK (D, Stringer pers. comm.) and therefore water demand may
reduce in line with a potentially declining sector output.
11 AEPLs do not apply for speciality papers as the specific consumption varies considerably.
84 © Wood Environment & Infrastructure Solutions UK Limited
February 2020
Doc Ref. 41296-WOD-XX-XX-J-TR-0006i2 Final Report Page | 84
Economic
In addition to those described above there are other drivers affecting the level of investment in the UK paper
industry. Making paper is intrinsically energy intensive and therefore energy pricing is a major issue. Where
investments are made it’s generally in energy saving measures, which are also driven by sector Climate
Change Act (CCA) agreement and EU emissions trading system (EU ETS). With paper being internationally
traded, it follows that access to competitively priced energy is a major driver for the UK papermaking
industry (CPI, 2018b).
Currency rate fluctuation could also be a driver with potential challenges and opportunities that could
affecting the industry’s water use. For example, a declining value of the pound (perhaps in light of the Brexit
outcome) would make exports cheaper but imports more expensive (most UK mills using virgin fibre import
the commodity as well as the majority of papermaking chemicals). Currency combined with other macro-
economic fundamentals (e.g. Chinese and US economies trading and any associated restrictions) are
reported to be dominant drivers in the paper making business (PITA, 2018). In 2015 the UK exported 0.81
million tonnes and imported 6.1 million tonnes of paper and board making it UK’s largest net importer of
paper in the world (CPI, 2018a).
Social
A relatively predictable driver for demand of paper products and therefore associated water use in their
production is population growth and the consumer demand, for hygiene /tissue paper for example. More
recent potential drivers for change in demand include the growth of online retailing which could (further)
increase demand for cardboard packaging and the fact that paper is ideally positioned as a replacement for
plastic packaging. The CPI is promoting paper packaging as a sustainable choice for the 21st century (being
renewable, recyclable, reusable and biodegradable). A 2018 CPI publication ‘Paper: the sustainable,
renewable and recyclable choice’ highlights the recent social response to the exposure of marine plastic
pollution. The publication also references 25-year Environment Plan, the success of the 5p plastic bag charge
and government plan to achieve ‘zero avoidable plastic waste by 2042’. It is noted that there are likely to be
some recyclability issues with paper packaging replacing plastic particularly when products are laminated and
to fully benefit better infrastructure/recycling networks are required to ensure higher rates of recycling (D,
Stringer pers. comm.).
Environmental and Technological
A key future challenge with respect to water use is the availability of water in a consistent manner with
growing pressures/risks such as climate change, varied needs of multiple sector abstractors and government
policy on water abstraction. While there is a currently good level of water efficiency within UK paper mills and
there is progress regarding long-term, multi-sector, regional water resource planning there is some potential
to reduce water consumption further both through behavioural measures and technological advances. For
example, driven by water scarcity, Spanish paper mills have invested in increased water reuse within their
mills and research undertaken by SAPPI (a leading global provider of sustainable woodfibre products and
solutions) into solvent based (water less) production methods is currently being undertaken at the European
level.
9.5 The future and water use in the sector
This study has highlighted a number of factors which affect water use within the UK Paper and Pulp
manufacturing sector, however, unlike the food and drink and energy sectors there is no information nor
data in the public domain regarding future water demand. Further to this there is also limited information on
future growth scenarios of the sector.
85 © Wood Environment & Infrastructure Solutions UK Limited
February 2020
Doc Ref. 41296-WOD-XX-XX-J-TR-0006i2 Final Report Page | 85
In its study to assess the potential for a low-carbon future across the most energy intensive industrial sectors
in the UK, the Department for Business, Energy and Industrial Strategy (BEIS) and the Department of Energy
and Climate Change (DECC) (here on in referred to as the BEIS) set a number of decarbonisation pathways for
the sector which were tested under three future growth scenarios (BEIS, 2015):
Current trends: This would represent a future world very similar to our world today with low
continuous growth of the industry in the UK.
Challenging world: This would represent a future world with a more challenging economic climate
and where decarbonisation is not a priority and the industry is declining in the UK.
Collaborative growth: This would represent a future world with a positive economic climate and
where there is collaboration across the globe to decarbonise and where the industry has a higher
growth rate in the UK.
The BEIS study and modelling reported that future production for the UK pulp and paper sector is projected
to grow somewhat and certain subsectors will either grow or decline: Tissue and Hygiene is likely to grow;
Speciality will either grow slightly or stay the same; Printing and Writing, including Newsprint and Packaging,
is expected stay the same or decline. Due to the high level of imports to the UK market, it could technically
be possible for UK production to increase, even if overall UK consumption were to fall. Depending on the
scenario, the overall sector is estimated to decline or grow annually by -0.5%, 1% and 2% for the challenging
world, current trends and collaborative growth scenarios, respectively.
While the study provided no detail on how the overall sector growth rates were established it is assumed that
they were based on assumptions regarding sector economics, trade, exports etc. As such could provide a
proxy reference point to check any estimates of the likely magnitude and direction of change in future water
demand within the sector.
9.6 Future narratives
This study has highlighted a number of mutually exclusive drivers which are likely to affect water demand
within the sector. Narratives to support future demand forecasting need to consider how these key drivers
(described above) might be influenced or be sensitive to future changes in socio-economic conditions and
trade. Changes in international trade agreements and introduction of tariffs following the UK’s departure
from the EU will also be critically important. However, it must also be noted that the significant diversity
within the paper and pulp manufacturing sector makes it difficult to generalise about trends at the sector
level. As a starting point, the following narratives around the likely magnitude and direction of change for
each of the drivers which are likely to affect future water demand are starting to emerge (note that the
following narratives focus on the hypothetical effects of drivers acting in isolation):
Population growth: Demand for paper across all product types is anticipated to increase in line with
increasing UK population. Assuming a direct correlation between the demand for paper and water use
associated with the increase in production, and based on this demand being met entirely by domestic
production, the future water demand within the sector could increase by 30% against the current baseline.
However, at present only 25% (CPI, 2015) of the UK paper demand is met by domestic production with the
remainder being imported, if this level were, maintained future water demand within the sector would
increase by 7.5%.
Process efficiency: The paper and pulp manufacturing sector is considered to be relatively efficient
regarding water use. In 2015, CPI reported that 86% of water abstracted for production is recirculated and
ultimately returned to the environment following treatment (consumptive water use 14%). However,
86 © Wood Environment & Infrastructure Solutions UK Limited
February 2020
Doc Ref. 41296-WOD-XX-XX-J-TR-0006i2 Final Report Page | 86
consumptive use on some sites is reported to be as low as 5% (there is a limit due to water bound up in
products). If all paper production operated at 5% consumptive water use the overall maximum reduction in
consumptive water demand would be as much as 35%.
Proportion produced in UK: The UK is the biggest net importer of paper in the world and domestic
production for UK demand is relatively low (25%), therefore future changes to domestic production could be
relatively significant in terms of changes in water use. Considering the globalised nature of the market and
customer price sensitivity the magnitude of potential change could be considered limited in some scenarios
with the proportion of paper produced in the UK declining as imports rise.
However, the global paper market is expected to grow in the short term (i.e. 2017 to 2022) (Menke, 2018) at
a compound annual growth rate (CAGR) of 5.8 percent, and global paper production is set to increase. Under
certain socio-economic conditions this is expected to result in greater domestic production to meet the
increased demand for paper in the UK and abroad (greater exports). In the best-case scenario this could
result in a maximum increase in domestic production of 30% by 2050 and an equivalent uplift in the
associated water demand.
Product demand per capita: The UK is in the top five of EU countries in terms of its consumption of paper
per capita at 175kg. E-commerce and the move towards online retail suggests demand for paper and paper
products (cardboard packaging) could increase in the future. As such it is feasible that UK demand could rise
to similar levels to those in the United States, which currently has the highest per capita consumption at
221kg which would represent a 30% increase. As outlined above, if this was met by increased domestic
production it could result in a 7.5% increase in baseline water demand by 2050.
Proportion of paper-based packaging: Globally paper and plastic currently make up 34% and 37% of the
consumer packaging market respectively. The recent shift away from single use plastic has resulted in the
paper industry promoting paper to be the leading bio-based, sustainable, renewable, and recyclable option.
However, a transition away from traditional fossil-based plastic consumer packaging towards paper has
limitations. More sustainable plastic-alternative products (e.g. plant based) and changing consumer
behaviours is likely to absorb some of the shift away from traditional plastic packaging.
If a 50% increase in paper packaging production is considered, and assuming the increase in demand will be
met by the same proportion of domestic and imported paper as reported in information available (25% (CPI
2015)), the maximum plausible change caused to baseline water demand by 2050 would be in the region of
12.5%.
Magnitude and direction of change
In considering the key drivers for water demand set out above an overall trend or narrative for the sector can
be established. Despite a rising trend for paper to replace plastic and for the UK to seek to reduce imports
and increase exports (i.e. all increasing paper production in the UK), increased efficiencies in water use during
the production process could offset a proportion of this, resulting in a fairly modest growth in water demand
for the sector.
9.7 Gaps in knowledge
While annual water consumption data is collated by the Confederation of Paper Industries this is reliant on
member sites responding to direct requests for the information and historically has not covered every UK
site. It does however, provide a reasonable baseline of annual consumption. Further to this all paper mills in
England are permitted through the Environmental Permitting (England and Wales) Regulations 2010 and
have to report total consumption and discharges to the environment. While this information is in the public
domain it has not been collated at the sector level.

87 © Wood Environment & Infrastructure Solutions UK Limited
February 2020
Doc Ref. 41296-WOD-XX-XX-J-TR-0006i2 Final Report Page | 87
There is currently no data or information directly related to future water demand of the sector. For the
purposes of this study a direct correlation between demand for paper and water use associated with the
increase in production has been assumed. However, growth forecasts for the paper sector are largely short-
term and there are varying degrees of uncertainty around the future drivers for the sector.
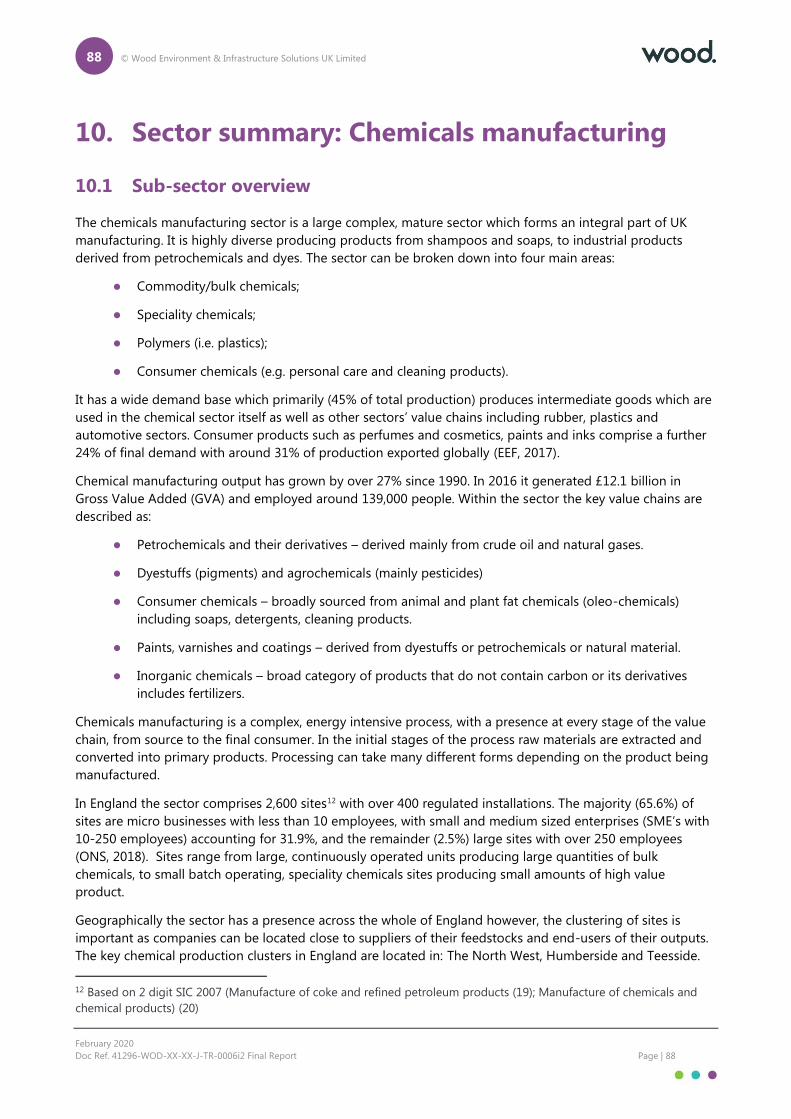
88 © Wood Environment & Infrastructure Solutions UK Limited
February 2020
Doc Ref. 41296-WOD-XX-XX-J-TR-0006i2 Final Report Page | 88
10. Sector summary: Chemicals manufacturing
10.1 Sub-sector overview
The chemicals manufacturing sector is a large complex, mature sector which forms an integral part of UK
manufacturing. It is highly diverse producing products from shampoos and soaps, to industrial products
derived from petrochemicals and dyes. The sector can be broken down into four main areas:
Commodity/bulk chemicals;
Speciality chemicals;
Polymers (i.e. plastics);
Consumer chemicals (e.g. personal care and cleaning products).
It has a wide demand base which primarily (45% of total production) produces intermediate goods which are
used in the chemical sector itself as well as other sectors’ value chains including rubber, plastics and
automotive sectors. Consumer products such as perfumes and cosmetics, paints and inks comprise a further
24% of final demand with around 31% of production exported globally (EEF, 2017).
Chemical manufacturing output has grown by over 27% since 1990. In 2016 it generated £12.1 billion in
Gross Value Added (GVA) and employed around 139,000 people. Within the sector the key value chains are
described as:
Petrochemicals and their derivatives – derived mainly from crude oil and natural gases.
Dyestuffs (pigments) and agrochemicals (mainly pesticides)
Consumer chemicals – broadly sourced from animal and plant fat chemicals (oleo-chemicals)
including soaps, detergents, cleaning products.
Paints, varnishes and coatings – derived from dyestuffs or petrochemicals or natural material.
Inorganic chemicals – broad category of products that do not contain carbon or its derivatives
includes fertilizers.
Chemicals manufacturing is a complex, energy intensive process, with a presence at every stage of the value
chain, from source to the final consumer. In the initial stages of the process raw materials are extracted and
converted into primary products. Processing can take many different forms depending on the product being
manufactured.
In England the sector comprises 2,600 sites12 with over 400 regulated installations. The majority (65.6%) of
sites are micro businesses with less than 10 employees, with small and medium sized enterprises (SME’s with
10-250 employees) accounting for 31.9%, and the remainder (2.5%) large sites with over 250 employees
(ONS, 2018). Sites range from large, continuously operated units producing large quantities of bulk
chemicals, to small batch operating, speciality chemicals sites producing small amounts of high value
product.
Geographically the sector has a presence across the whole of England however, the clustering of sites is
important as companies can be located close to suppliers of their feedstocks and end-users of their outputs.
The key chemical production clusters in England are located in: The North West, Humberside and Teesside.
12 Based on 2 digit SIC 2007 (Manufacture of coke and refined petroleum products (19); Manufacture of chemicals and
chemical products) (20)
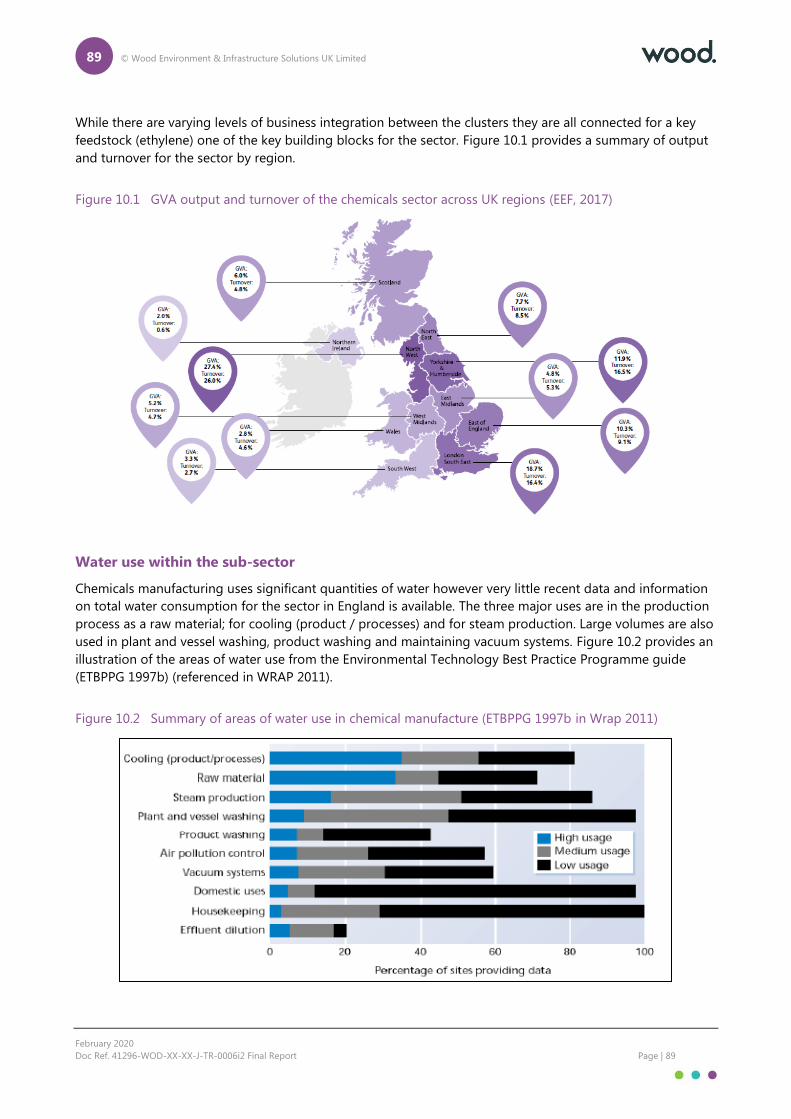
89 © Wood Environment & Infrastructure Solutions UK Limited
February 2020
Doc Ref. 41296-WOD-XX-XX-J-TR-0006i2 Final Report Page | 89
While there are varying levels of business integration between the clusters they are all connected for a key
feedstock (ethylene) one of the key building blocks for the sector. Figure 10.1 provides a summary of output
and turnover for the sector by region.
Figure 10.1 GVA output and turnover of the chemicals sector across UK regions (EEF, 2017)
Water use within the sub-sector
Chemicals manufacturing uses significant quantities of water however very little recent data and information
on total water consumption for the sector in England is available. The three major uses are in the production
process as a raw material; for cooling (product / processes) and for steam production. Large volumes are also
used in plant and vessel washing, product washing and maintaining vacuum systems. Figure 10.2 provides an
illustration of the areas of water use from the Environmental Technology Best Practice Programme guide
(ETBPPG 1997b) (referenced in WRAP 2011).
Figure 10.2 Summary of areas of water use in chemical manufacture (ETBPPG 1997b in Wrap 2011)
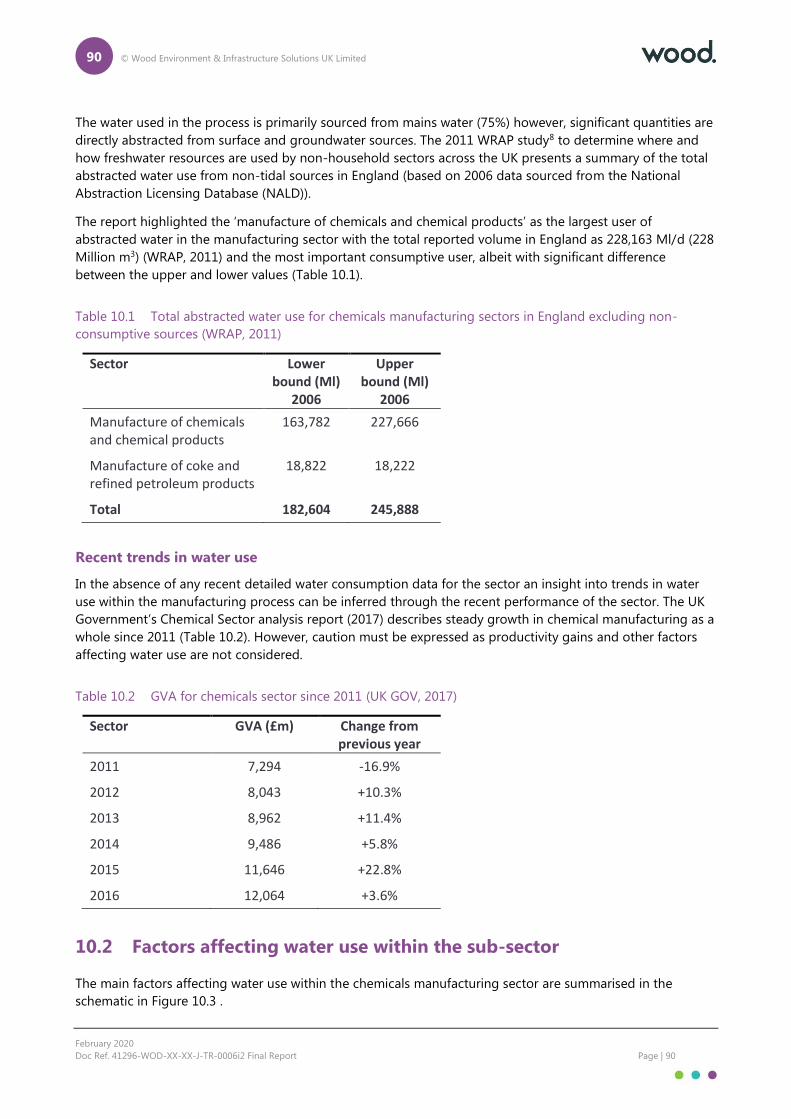
90 © Wood Environment & Infrastructure Solutions UK Limited
February 2020
Doc Ref. 41296-WOD-XX-XX-J-TR-0006i2 Final Report Page | 90
The water used in the process is primarily sourced from mains water (75%) however, significant quantities are
directly abstracted from surface and groundwater sources. The 2011 WRAP study8 to determine where and
how freshwater resources are used by non-household sectors across the UK presents a summary of the total
abstracted water use from non-tidal sources in England (based on 2006 data sourced from the National
Abstraction Licensing Database (NALD)).
The report highlighted the ‘manufacture of chemicals and chemical products’ as the largest user of
abstracted water in the manufacturing sector with the total reported volume in England as 228,163 Ml/d (228
Million m3) (WRAP, 2011) and the most important consumptive user, albeit with significant difference
between the upper and lower values (Table 10.1).
Table 10.1 Total abstracted water use for chemicals manufacturing sectors in England excluding non-
consumptive sources (WRAP, 2011)
Sector Lower bound (Ml)
2006
Upper bound (Ml)
2006
Manufacture of chemicals and chemical products
163,782 227,666
Manufacture of coke and refined petroleum products
18,822 18,222
Total 182,604 245,888
Recent trends in water use
In the absence of any recent detailed water consumption data for the sector an insight into trends in water
use within the manufacturing process can be inferred through the recent performance of the sector. The UK
Government’s Chemical Sector analysis report (2017) describes steady growth in chemical manufacturing as a
whole since 2011 (Table 10.2). However, caution must be expressed as productivity gains and other factors
affecting water use are not considered.
Table 10.2 GVA for chemicals sector since 2011 (UK GOV, 2017)
Sector GVA (£m) Change from previous year
2011 7,294 -16.9%
2012 8,043 +10.3%
2013 8,962 +11.4%
2014 9,486 +5.8%
2015 11,646 +22.8%
2016 12,064 +3.6%
10.2 Factors affecting water use within the sub-sector
The main factors affecting water use within the chemicals manufacturing sector are summarised in the
schematic in Figure 10.3 .
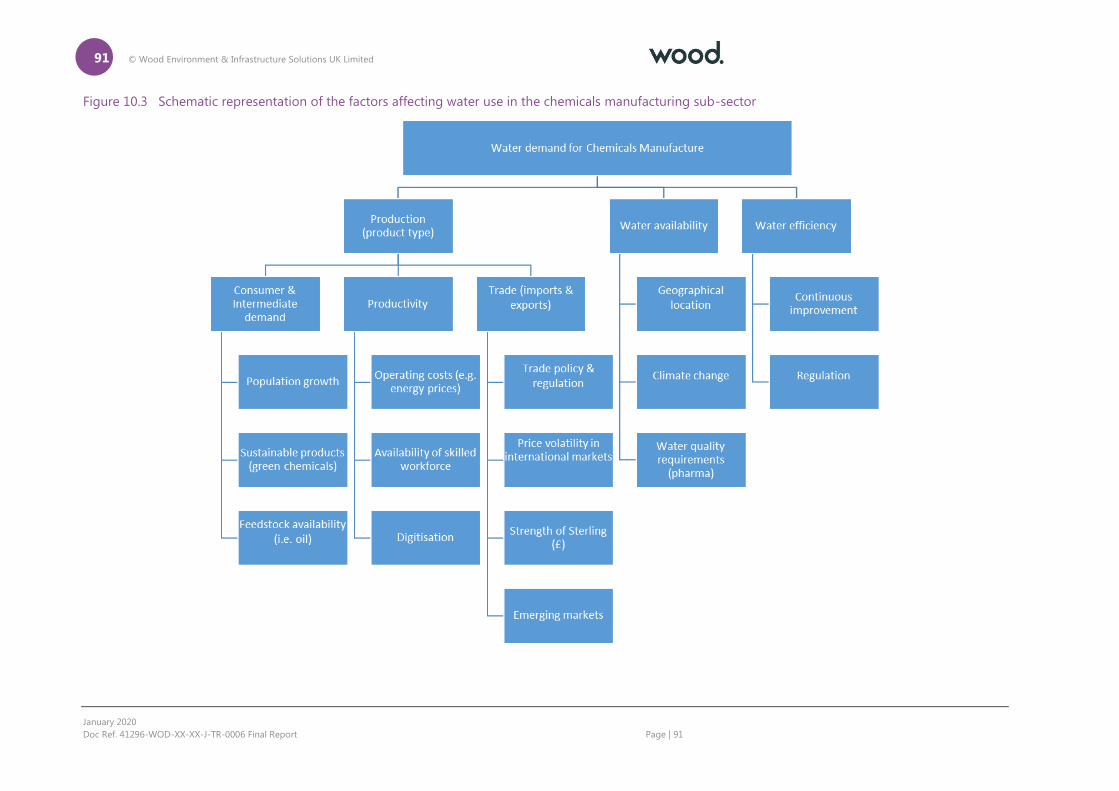
91 © Wood Environment & Infrastructure Solutions UK Limited
January 2020
Doc Ref. 41296-WOD-XX-XX-J-TR-0006 Final Report Page | 91
Figure 10.3 Schematic representation of the factors affecting water use in the chemicals manufacturing sub-sector
92 © Wood Environment & Infrastructure Solutions UK Limited
January 2020
Doc Ref. 41296-WOD-XX-XX-J-TR-0006 Final Report Page | 92
Total water demand in the sector depends on product type, the availability of a consistent water supply and
the level of water efficiency that has been introduced into the production process. A summary of the factors
affecting water demand within the chemicals and petrochemicals manufacturing sectors are outlined in Table
10.3.
Table 10.3 Factors affecting water use in the chemicals and petrochemicals manufacturing sub-sectors
Factor Description Effect on water use
Consumer demand The chemicals sector operates in a global market. Any changes in production will be driven by global demand.
Increasing demand for chemical feedstocks, intermediate and consumer products will continue to drive water demand.
Energy prices Cost of energy and sector competitiveness
Increasing energy prices in the UK could impact sector competitiveness and trade. Any stagnation in growth may have a direct impact on production.
Continuous improvement
Productivity gains through water efficiency measures
Driven by initiatives such as Responsible Care, which commits the sector to continuously improve the environmental performance of technologies, processes and products, resource efficiency and waste minimisation.
10.3 Key pressures and drivers affecting sector’s water use
Political
While the chemicals sector in the UK has remained an integral part of UK manufacturing its diversity and
opportunities for growth have resulted in the sector becoming increasingly foreign owned with over 10% of
enterprises having owners outside of the UK. Recent uncertainty regarding the UKs departure from the
European Union has impacted investment decisions with potential preference in economies where the policy
and trading environment is more stable.
The UKs departure from the EU will also result in changes to trade regulations and policies which present
significant risks to the sector. At present around 59% of chemical exports are to the EU. While tariff
impositions, reduced access to EU labour, continuity of supply and receipt of raw materials are a concern for
the sector one of the greatest risks that has arisen is regulatory based.
The UK currently participates in the EU wide Registration, Evaluation, Authorisation and Restriction of
Chemicals (REACH) system which aims protect human health and the environment from the use of chemicals.
Retaining access to this system is vital to the chemicals sector in the UK given the potential administrative
and infrastructure costs associated with leaving it. As such there is significant uncertainty over the validity of
the current REACH registrations once the UK leaves the EU, and thus, the prospect of reduced ability to trade
with the EU.
Economic
A large proportion of the chemicals sector (specifically petrochemicals) is linked to the oil and gas sector.
With the decline in North Sea oil reserves the UK is becoming increasingly reliant on imports of crude oil and
natural gas from Europe (Russia) and the Middle East. This presents a number of risks including price
volatility and supply constraints. Growing geo-political tensions have recently been inflated across the globe
93 © Wood Environment & Infrastructure Solutions UK Limited
February 2020
Doc Ref. 41296-WOD-XX-XX-J-TR-0006i2 Final Report Page | 93
and there is concern that supplies could be restricted if tensions escalate. This would have a negative effect
on the UK chemicals manufacturing sector, in particular its ability to produce petrochemicals.
Fluctuations in commodity prices also impact the supply and demand economics and can cause companies
to postpone investments or change business models. The chemicals sector is particularly exposed to this risk
as much of production is dependent on the feedstocks produced from oil and natural gas.
The chemicals sector is the most energy intensive manufacturing sector in the UK accounting for 16.5% of all
industrial energy used in the UK in 2012 (BEIS 2015). High energy prices are therefore a concern for the
sector as they directly hit profitability and competitiveness. Currently lower energy prices in the US, China
and India, are facilitating investment away from the UK into these countries.
Social
With global population set to increase by 1 billion, to 8.5 billion by 2030, demand for products derived from
the chemicals sector will continue to rise. The global demand for plastics has doubled since 2000, and already
outstrips all other bulk materials, with advanced countries such as the US and in Europe, currently using 20
times more plastic and 10 times more fertilizer than countries such as India, Indonesia and other developing
economies. In contrast some areas of plastics demand (e.g. plastic packaging) could also decline in the future
as consumer awareness of its environmental impact grows and a move towards more sustainable
alternatives.
Long term growth in the UK chemicals sector therefore hinges on its ability to harness the opportunities that
emerging markets present. The globalisation of the industry has occurred at a rapid pace and there has been
a considerable shift towards manufacturing in the Far East. However, while this represents a risk to the UK
sector continued investment in R&D and innovation can ensure the UK remains competitive.
Environmental and Technological
A key future challenge with respect to water use is its availability. Growing pressure on water resources from
impacts of climate change are set to increase and managing the varied needs of multiple sector abstractors
and maintaining environmental flows will be key in the abstraction reform process.
The development of alternative products and processes will continue to present new opportunities for the
sector. For example, the move towards bio-based feedstocks and green chemistry will reduce sector
emissions and waste however, it is currently unclear how these will impact on future water demand.
10.4 The future and water use in the sector
Unlike the food and drink and energy sectors there is very little information and data in the public domain
regarding future water demand in the UK chemicals sector. In its 2018 report the Chemistry Council highlight
a 50% increase in sector production by 2030, on 2016 levels (Figure 10.4). This growth is to be driven by three
priority workstreams identified as innovation, supply chains, regions and infrastructure. However, the impact
on water demand was not covered in the report, but if a direct correlation between the demand for
chemicals and water consumption is assumed it could be fairly significant.
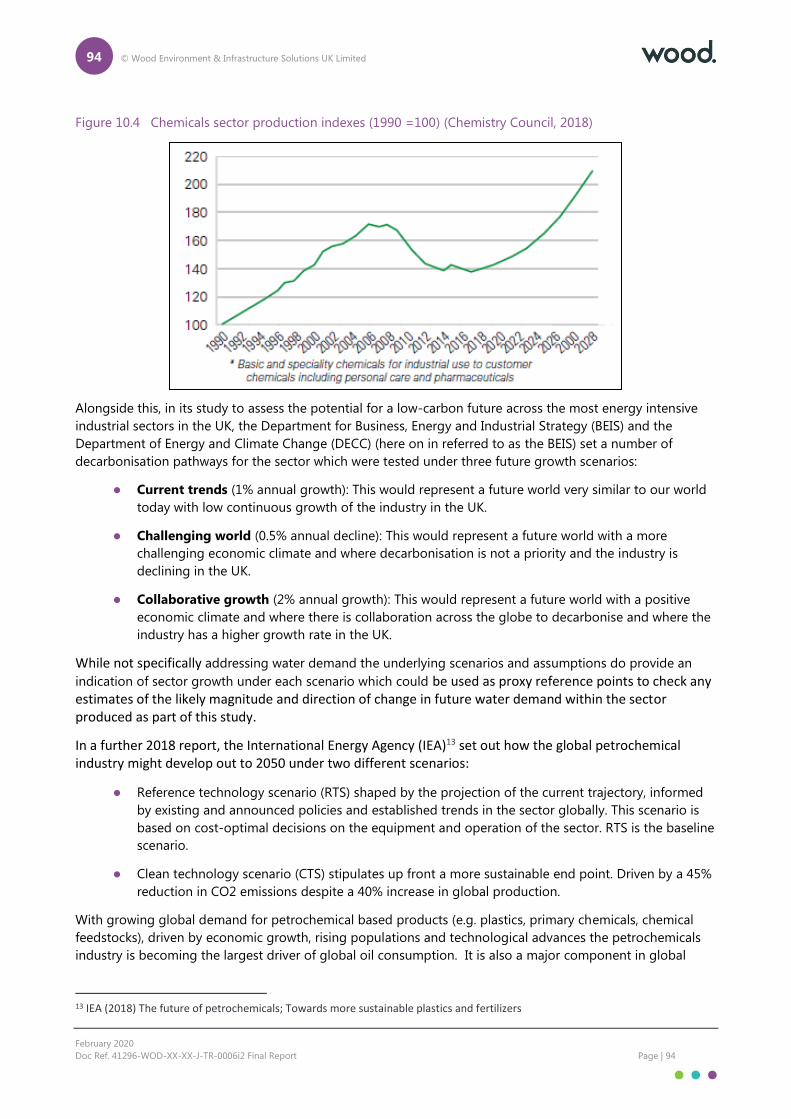
94 © Wood Environment & Infrastructure Solutions UK Limited
February 2020
Doc Ref. 41296-WOD-XX-XX-J-TR-0006i2 Final Report Page | 94
Figure 10.4 Chemicals sector production indexes (1990 =100) (Chemistry Council, 2018)
Alongside this, in its study to assess the potential for a low-carbon future across the most energy intensive
industrial sectors in the UK, the Department for Business, Energy and Industrial Strategy (BEIS) and the
Department of Energy and Climate Change (DECC) (here on in referred to as the BEIS) set a number of
decarbonisation pathways for the sector which were tested under three future growth scenarios:
Current trends (1% annual growth): This would represent a future world very similar to our world
today with low continuous growth of the industry in the UK.
Challenging world (0.5% annual decline): This would represent a future world with a more
challenging economic climate and where decarbonisation is not a priority and the industry is
declining in the UK.
Collaborative growth (2% annual growth): This would represent a future world with a positive
economic climate and where there is collaboration across the globe to decarbonise and where the
industry has a higher growth rate in the UK.
While not specifically addressing water demand the underlying scenarios and assumptions do provide an
indication of sector growth under each scenario which could be used as proxy reference points to check any estimates of the likely magnitude and direction of change in future water demand within the sector produced as part of this study.
In a further 2018 report, the International Energy Agency (IEA)13 set out how the global petrochemical industry might develop out to 2050 under two different scenarios:
Reference technology scenario (RTS) shaped by the projection of the current trajectory, informed
by existing and announced policies and established trends in the sector globally. This scenario is
based on cost-optimal decisions on the equipment and operation of the sector. RTS is the baseline
scenario.
Clean technology scenario (CTS) stipulates up front a more sustainable end point. Driven by a 45%
reduction in CO2 emissions despite a 40% increase in global production.
With growing global demand for petrochemical based products (e.g. plastics, primary chemicals, chemical
feedstocks), driven by economic growth, rising populations and technological advances the petrochemicals
industry is becoming the largest driver of global oil consumption. It is also a major component in global
13 IEA (2018) The future of petrochemicals; Towards more sustainable plastics and fertilizers

95 © Wood Environment & Infrastructure Solutions UK Limited
February 2020
Doc Ref. 41296-WOD-XX-XX-J-TR-0006i2 Final Report Page | 95
energy systems. Globally, the production of primary chemicals is forecast to grow by 30% by 2030, and 60%
by 2050 (IEA, 2018).
At present primary chemicals production accounts for around 1% of total global water withdrawals and 4% of
industry consumption. In Europe primary chemical production currently accounts for 15-20% and 15% of
total water withdrawals and consumption respectively.
Under the RTS scenario global freshwater withdrawals for primary chemical production are set to triple to
12BCM from 2017 to 2050. Water consumption in the sector also substantially increases from 2 billion cubic
meters (BCM) in 2017 to nearly 5BCM in 2050 (Figure 5), however the majority (80%) of the global demand is
expected to be in the Asia Pacific region.
Under the CTS scenario annual water withdrawals for primary chemical production rise to almost 9 BCM in
2050 which consumption rises to roughly 3BCM. Relative to the RTS scenario total cumulative water
withdrawals for primary chemical production are 8% lower, while water consumption is around 20% lower
(Figure 10.5).
Figure 10.5 Water demand for primary chemical production by scenario (reproduced from IEA, 2018)
In England, the overall chemicals manufacturing sector accounts for around 8% of total consumptive
abstraction with primary chemical production accounting for a proportion (unknown) of this. While global
production of primary chemicals is set to increase substantially out to 2050, the majority of this demand will
be met by increased production in Asia. In Europe water consumption is due to fall under the RTS scenario by
~ 35%. As such, while the UK will play a part in meeting this increase demand for primary chemicals the
impact of the two scenarios outlined above is likely to be more limited.
10.5 Future narratives
This study has highlighted a number of mutually exclusive drivers which are likely to affect water demand
within the sector. Narratives to support future demand forecasting need to consider how these key drivers
(described above) might be influenced or be sensitive to future changes in socio-economic conditions and
trade. Changes in international trade agreements and introduction of tariffs following the UK’s departure
from the EU will also be critically important. However, it must also be noted that the significant diversity
within the chemicals sector makes it difficult to generalise about trends at the sector level. As a starting point,
the following narratives around the likely magnitude and direction of change for each of the drivers, which
96 © Wood Environment & Infrastructure Solutions UK Limited
February 2020
Doc Ref. 41296-WOD-XX-XX-J-TR-0006i2 Final Report Page | 96
are likely to affect future water demand, are starting to emerge (note that the following narratives focus
on the hypothetical effects of drivers acting in isolation):
Population growth: Demand for chemicals across all product types is anticipated to increase in line with
increasing UK population. Assuming a direct correlation between the demand and water use associated with
production, and based on this demand being met entirely by domestic production, future water demand
within the sector could increase by 30% against the current baseline. At present around 69% (Engineering
Employers’ Federation - EEF, 2018) of the UK chemicals production is consumed within the UK, with the
remainder being exported. If this level were maintained future water demand within the sector would
increase by 21%. However, it is likely to be more complex than this, as while for certain chemical product
groups (consumer products e.g. soaps and detergents etc) this will be true, others such as petrochemicals,
dyestuffs etc. the correlation is unlikely to be one to one. Further to this the UK is also running trade deficit in
majority of the chemicals sub-sectors, thus any increase in demand for products may be met by increased
imports.
Demand for petrochemical derived products (e.g. plastics): Global demand for petrochemicals and
petrochemical derived products is set to increase with primary chemical production expected to grow by 30%
by 2030, and 60% by 2050 globally (IEA, 2018). However, as the majority of this increased demand will
primarily be met by increased production in Asia, water demand in Europe is likely to reduce. Estimates given
in the IEA 2018 report suggest that water consumption in Europe could fall under the business as usual (RTS)
scenario by around 35%).
In 2016, petrochemical sector production in the UK generated gross value added of around £3.5 billion,
however, the sub-sector was also running at £0.9B trade deficit. As such while the UK will play a part in
helping meet the increased demand growth is likely to be small at best. Therefore, it is assumed that the
future water demand for UK production will follow Europe and could decline by around 35%.
Proportion of UK production which is exported: At present around 31% of UK chemicals production is
exported. However, over the last decade the sector has increasingly imported goods and raw materials at a
faster rate than it has managed to export. In 2017 the sector was running a trade deficit in the region of £1
billion.
At present around 59% of chemical exports are to the EU. While opportunities to increase exports to new and
emerging markets are anticipated the UKs departure from the EU presents a significant risk to the sector. It is
therefore anticipated that there will be a small (10%) uplift in water demand as a consequence of increased
exports from the UK.
Process efficiency: It is considered that the UK chemicals sector is typically less water efficient than other
manufacturing sectors. Sector-level initiatives such as Responsible Care, which are driving continuous
improvement in environmental performance, have not specifically addressed water efficiency. The low cost of
water has resulted in it becoming less of a priority in comparison to gas and electricity consumption. As such,
it is considered that there is reasonable scope for improvement. On average sites that have not undertaken
any action to reduce water consumption could save around 30% through low cost, no-cost measures.
Proportion of products considered ‘Green’: Green chemistry is an area of research that has grown
considerably over the last 20 years as manufacturers aim to meet increasingly stricter regulations and
consumer demands for greener products. As a result, new and emerging markets driven by environmental
legislation and sustainability have arisen (and will continue to do so), for example, the move from solvent
based paints to water based paints. However, there is currently a high degree of uncertainty on the impact of
green products on future water demand as many green product ranges may require more water to produce
(i.e. water-based products or increased water required for cleaning etc). At present it is estimated that green
products only comprise around 5% of overall chemicals production in the UK however, a small (10%) increase
in water demand is assumed as a consequence of the future growth of the green products market.
97 © Wood Environment & Infrastructure Solutions UK Limited
February 2020
Doc Ref. 41296-WOD-XX-XX-J-TR-0006i2 Final Report Page | 97
Magnitude and direction of change
In considering the key drivers for water demand set out above an overall trend or narrative for the sector can
be established. The chemicals sector is truly global and rising global demand for chemical products driven by
economic growth, rising population and technological advances is likely to result increased UK production
out to 2050. While consumer trends such as a move away from plastic packaging are starting to emerge,
these are likely to have limited impact on UK production but growing global demand for petrochemical
based products (e.g. plastics, primary chemicals, chemical feedstocks), will continue to be a driver of global
oil consumption.
Any potential increase in UK production is likely to result in an uplift in consumptive water demand however,
there is considerable scope to offset this demand through increased water efficiency measures and
environmental improvement.
10.6 Gaps in knowledge
The 2011 WRAP study provided a summary of the total abstracted water use from non-tidal sources in
England. The report highlighted the manufacture of chemicals and chemical products as the largest user of
abstracted water in the manufacturing sector (WRAP, 2011) and the most important consumptive user.
However, this report was based on 2006 data.
No other more recent detailed baseline data is available for the sector although with over 400 regulated
installations in England permitting data for these sites is in the public domain but has not been collated at
the sector level.
There is also currently no data or information directly related to future water demand of UK chemicals sector.
For the purposes of this study a direct correlation between demand for paper and water use associated with
the increase in production has been assumed however, growth forecasts for the chemicals sector are largely
high-level and there are varying degrees of uncertainty around the future drivers for the sector.
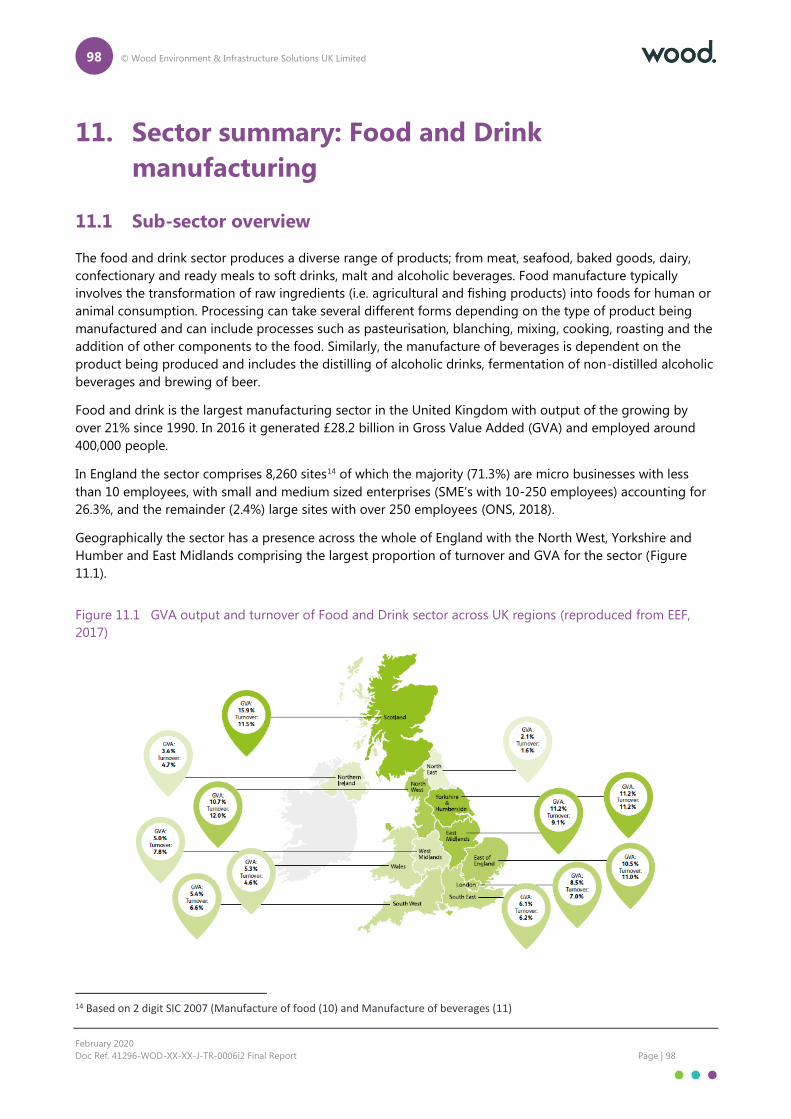
98 © Wood Environment & Infrastructure Solutions UK Limited
February 2020
Doc Ref. 41296-WOD-XX-XX-J-TR-0006i2 Final Report Page | 98
11. Sector summary: Food and Drink
manufacturing
11.1 Sub-sector overview
The food and drink sector produces a diverse range of products; from meat, seafood, baked goods, dairy,
confectionary and ready meals to soft drinks, malt and alcoholic beverages. Food manufacture typically
involves the transformation of raw ingredients (i.e. agricultural and fishing products) into foods for human or
animal consumption. Processing can take several different forms depending on the type of product being
manufactured and can include processes such as pasteurisation, blanching, mixing, cooking, roasting and the
addition of other components to the food. Similarly, the manufacture of beverages is dependent on the
product being produced and includes the distilling of alcoholic drinks, fermentation of non-distilled alcoholic
beverages and brewing of beer.
Food and drink is the largest manufacturing sector in the United Kingdom with output of the growing by
over 21% since 1990. In 2016 it generated £28.2 billion in Gross Value Added (GVA) and employed around
400,000 people.
In England the sector comprises 8,260 sites14 of which the majority (71.3%) are micro businesses with less
than 10 employees, with small and medium sized enterprises (SME’s with 10-250 employees) accounting for
26.3%, and the remainder (2.4%) large sites with over 250 employees (ONS, 2018).
Geographically the sector has a presence across the whole of England with the North West, Yorkshire and
Humber and East Midlands comprising the largest proportion of turnover and GVA for the sector (Figure
11.1).
Figure 11.1 GVA output and turnover of Food and Drink sector across UK regions (reproduced from EEF,
2017)
14 Based on 2 digit SIC 2007 (Manufacture of food (10) and Manufacture of beverages (11)

99 © Wood Environment & Infrastructure Solutions UK Limited
February 2020
Doc Ref. 41296-WOD-XX-XX-J-TR-0006i2 Final Report Page | 99
Water use within the sub-sector
While all businesses use water in their operations, either for domestic purposes or within a specific process in
the manufacture of food and drinks it is also a core raw material that becomes an integral part of the
product. As such the sector is a significant user of water.
Water is used in all aspects of the production process including:
For cooling and raising steam
Installation and equipment cleaning;
As process water e.g. for washing raw materials, intermediates and products;
For cooking, mixing, blending, dissolving and for transportation.
The quality of water required depends on the specific use but in general water is primarily supplied from the
public water supply rather than direct abstraction. Analysis of the WRGIS shows that the sector accounts for
13% of consumptive abstraction in the industrial/commercial category with the largest water using sub-
sectors highlighted as Food and Drink (10%), Breweries (2%) and Dairies (1%).
The Food and Drink NALD category comprises a number of water-intensive sub-sectors. A summary of the
key areas of water use within some of these sub-sectors is provided below:
The soft drinks industry comprises bottled water, fruit juice, fruit drinks, sports and energy drinks, carbonates
and dilutables. Water consumption varies throughout this sector and the proportion of abstracted water used
that ends up in the product depends on the nature of the product but can be significant (e.g. around 30% in
the bottled water sector and around 70% in the carbonated soft drinks sector). Other uses of water include
washing equipment, rinsing of containers, boiler operations and pasteurisation. The source of water used in
processing also varies considerably and while abstraction from groundwater provides the majority of water in
bottled water the majority of water used in the manufacture of fruit juices, carbonates and dilutables is from
mains supply.
In meat and poultry production water is mainly used for cleaning equipment and floors although significant
quantities are also used for washing and thawing meat. Other areas of use include pasteurising, sterilisation
of equipment and cooling. Water use in this sector tends to be high as many sites use excessively high
‘safety margins’ to ensure that stringent hygiene standards are met.
In the fruit and vegetable processing sector water is mainly used during washing, heating and cooling of
food products. It is also used during peeling and steam blanching of the raw materials.
The brewing industry uses large volumes of water for the production of beer, cleaning, bottling and the
utilities supporting these activities. Of the water used around 15% comprises the end product with a high
proportion of this water supplied via groundwater abstraction. Historically the location of breweries is
influenced by the characteristics and availability of water. Typically, mains water is used to raise steam and for
cooling and cleaning purposes.
Dairies also use large volumes of water in the processing of milk and milk products for purposes such as
heating, cooling and cleaning operations. Typically, 50-90% of water used in the dairy industry is used for
washing and cleaning operations. In milk production water is also used in the bottling process.
Recent trends in water use
Water use across the food and drink sector varies significantly and establishing a baseline consumption
figure for the sector has to date presented a number of challenges. In 2007 Defra’s Food Industry
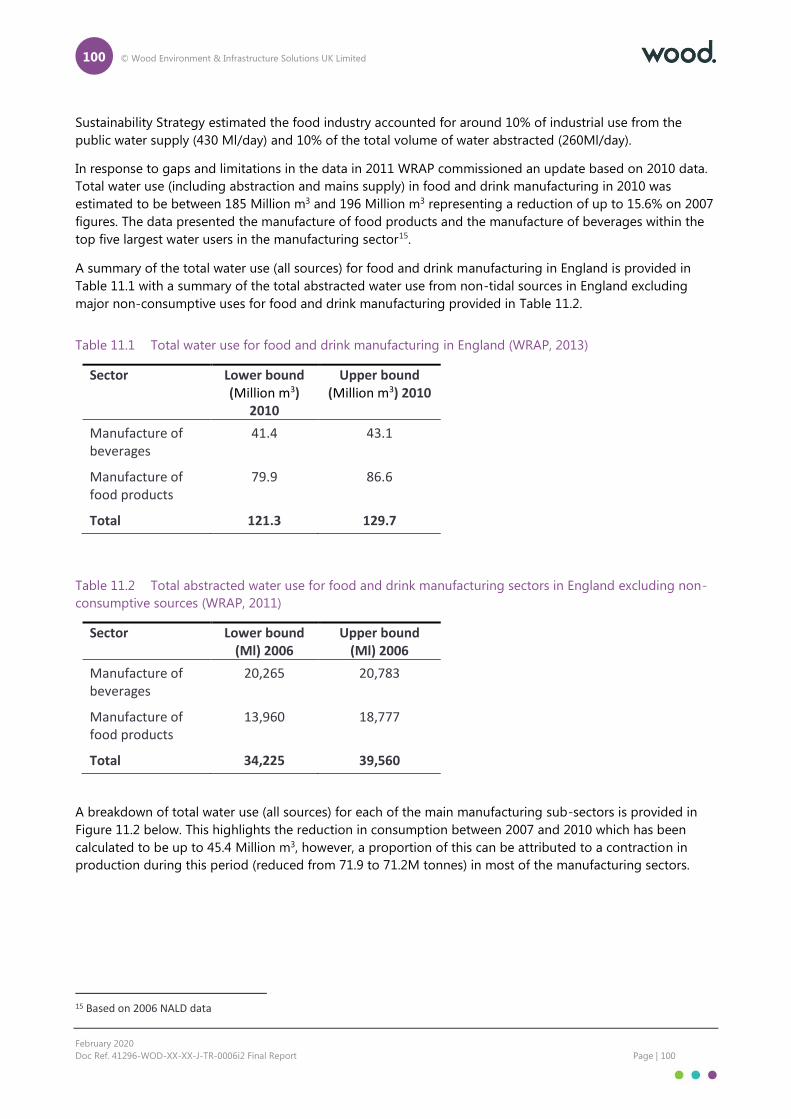
100 © Wood Environment & Infrastructure Solutions UK Limited
February 2020
Doc Ref. 41296-WOD-XX-XX-J-TR-0006i2 Final Report Page | 100
Sustainability Strategy estimated the food industry accounted for around 10% of industrial use from the
public water supply (430 Ml/day) and 10% of the total volume of water abstracted (260Ml/day).
In response to gaps and limitations in the data in 2011 WRAP commissioned an update based on 2010 data.
Total water use (including abstraction and mains supply) in food and drink manufacturing in 2010 was
estimated to be between 185 Million m3 and 196 Million m3 representing a reduction of up to 15.6% on 2007
figures. The data presented the manufacture of food products and the manufacture of beverages within the
top five largest water users in the manufacturing sector15.
A summary of the total water use (all sources) for food and drink manufacturing in England is provided in
Table 11.1 with a summary of the total abstracted water use from non-tidal sources in England excluding
major non-consumptive uses for food and drink manufacturing provided in Table 11.2.
Table 11.1 Total water use for food and drink manufacturing in England (WRAP, 2013)
Sector Lower bound (Million m3)
2010
Upper bound (Million m3) 2010
Manufacture of beverages
41.4 43.1
Manufacture of food products
79.9 86.6
Total 121.3 129.7
Table 11.2 Total abstracted water use for food and drink manufacturing sectors in England excluding non-
consumptive sources (WRAP, 2011)
Sector Lower bound (Ml) 2006
Upper bound (Ml) 2006
Manufacture of beverages
20,265 20,783
Manufacture of food products
13,960 18,777
Total 34,225 39,560
A breakdown of total water use (all sources) for each of the main manufacturing sub-sectors is provided in
Figure 11.2 below. This highlights the reduction in consumption between 2007 and 2010 which has been
calculated to be up to 45.4 Million m3, however, a proportion of this can be attributed to a contraction in
production during this period (reduced from 71.9 to 71.2M tonnes) in most of the manufacturing sectors.
15 Based on 2006 NALD data
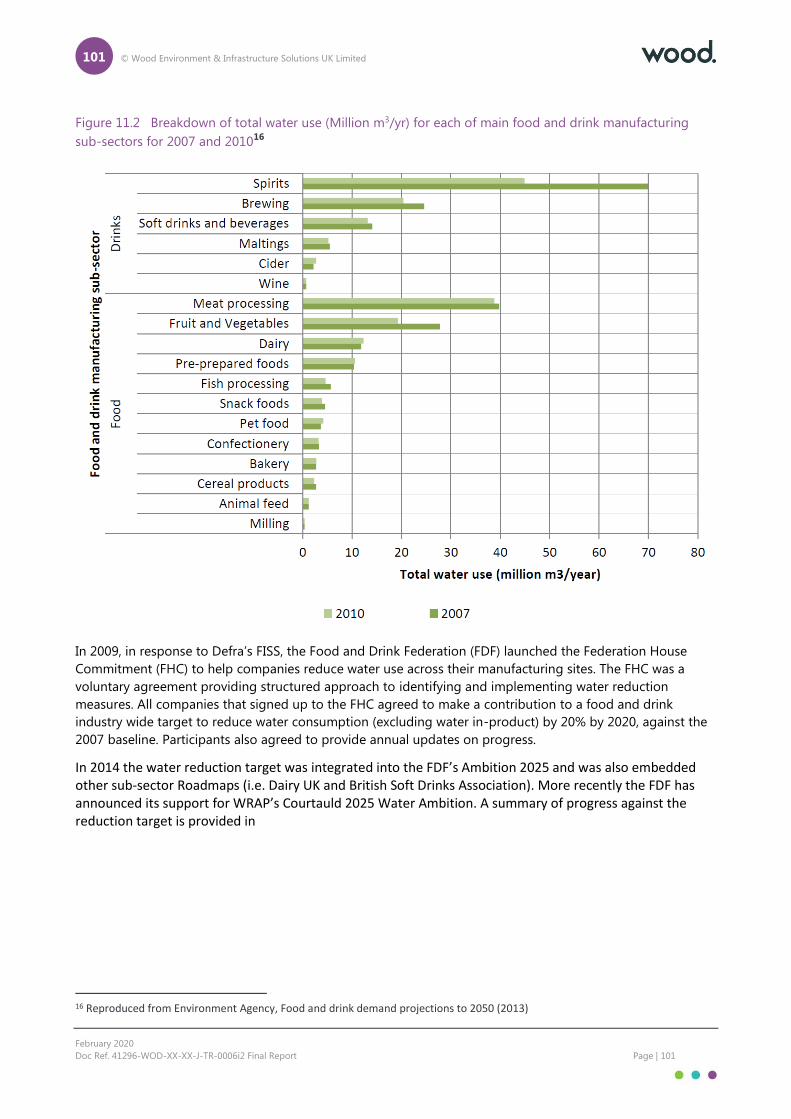
101 © Wood Environment & Infrastructure Solutions UK Limited
February 2020
Doc Ref. 41296-WOD-XX-XX-J-TR-0006i2 Final Report Page | 101
Figure 11.2 Breakdown of total water use (Million m3/yr) for each of main food and drink manufacturing
sub-sectors for 2007 and 201016
In 2009, in response to Defra’s FISS, the Food and Drink Federation (FDF) launched the Federation House
Commitment (FHC) to help companies reduce water use across their manufacturing sites. The FHC was a
voluntary agreement providing structured approach to identifying and implementing water reduction
measures. All companies that signed up to the FHC agreed to make a contribution to a food and drink
industry wide target to reduce water consumption (excluding water in-product) by 20% by 2020, against the
2007 baseline. Participants also agreed to provide annual updates on progress.
In 2014 the water reduction target was integrated into the FDF’s Ambition 2025 and was also embedded other sub-sector Roadmaps (i.e. Dairy UK and British Soft Drinks Association). More recently the FDF has announced its support for WRAP’s Courtauld 2025 Water Ambition. A summary of progress against the reduction target is provided in
16 Reproduced from Environment Agency, Food and drink demand projections to 2050 (2013)

102 © Wood Environment & Infrastructure Solutions UK Limited
February 2020
Doc Ref. 41296-WOD-XX-XX-J-TR-0006i2 Final Report Page | 102
Table 11.3.

103 © Wood Environment & Infrastructure Solutions UK Limited
February 2020
Doc Ref. 41296-WOD-XX-XX-J-TR-0006i2 Final Report Page | 103
Table 11.3 Sector progress against industry wide water reduction target of 20% by 2020 (against 2007
baseline)
Percentage reduction against 2007 baseline*
Target 2009-2013 2017
Absolute water use 15.6% 38.8%
Specific consumption 22% 40.1%
*Based on participating sites that have reported on progress
While considerable progress has been made in reducing water use in food and drink manufacturing it is also
recognised that further improvements could have been made in some sub-sectors. For example, the 2018
Dairy UK Roadmap highlights that despite a 23.4% reduction in absolute water use increase in product
ranges has meant a greater requirement for water in cleaning process. Further to this the anticipated
advances in water reuse have also yet to materialise.
11.2 Factors affecting water use within the sub-sector
The main factors affecting water use within the food and drink manufacturing sector are summarised in the
schematic in Figure 11.3.
.
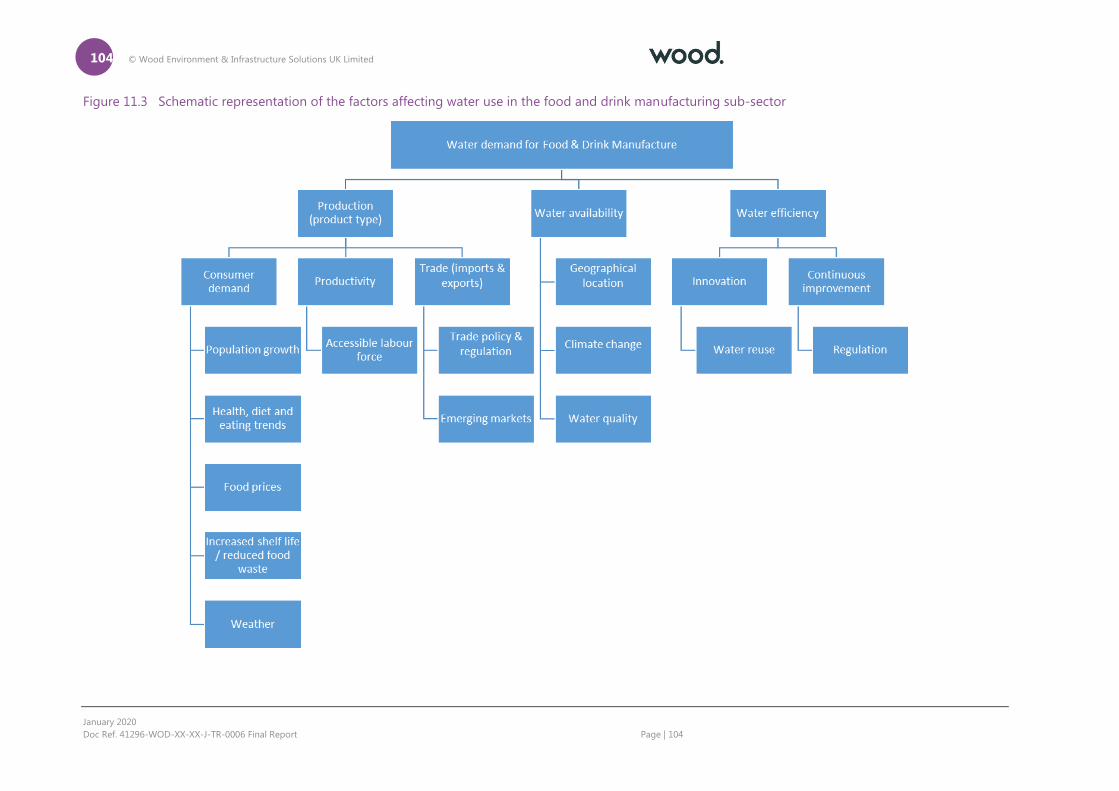
104 © Wood Environment & Infrastructure Solutions UK Limited
January 2020
Doc Ref. 41296-WOD-XX-XX-J-TR-0006 Final Report Page | 104
Figure 11.3 Schematic representation of the factors affecting water use in the food and drink manufacturing sub-sector
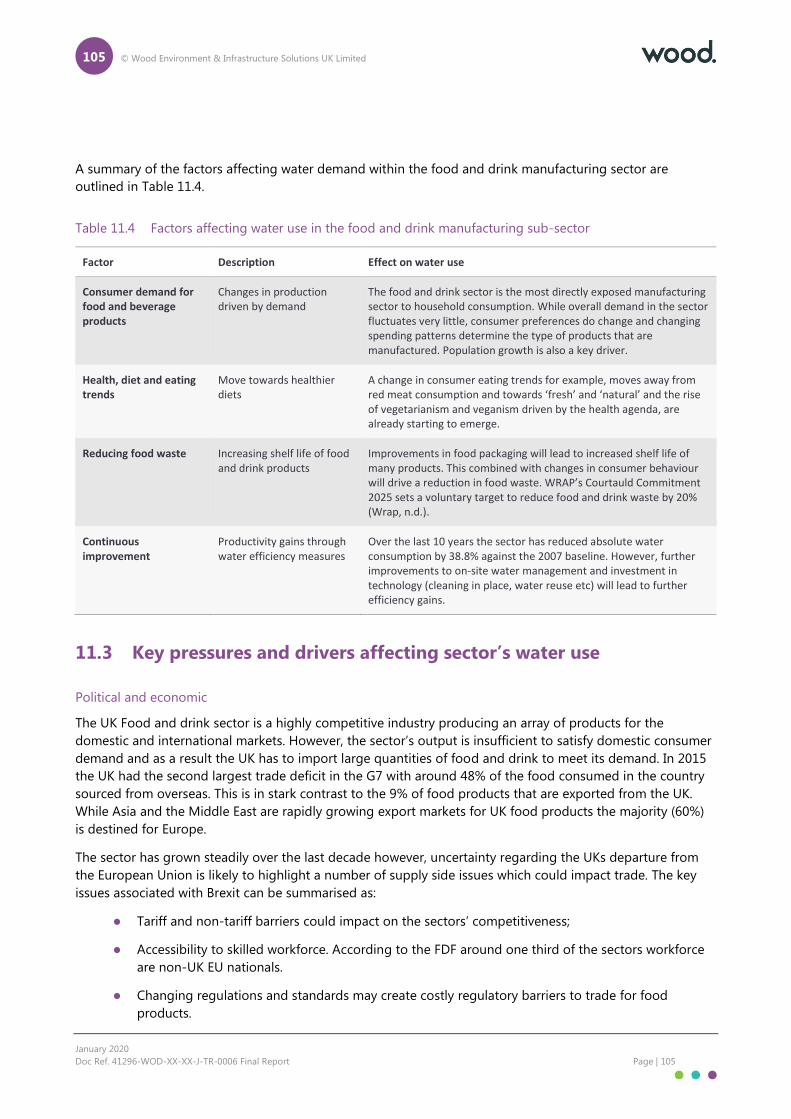
105 © Wood Environment & Infrastructure Solutions UK Limited
January 2020
Doc Ref. 41296-WOD-XX-XX-J-TR-0006 Final Report Page | 105
A summary of the factors affecting water demand within the food and drink manufacturing sector are
outlined in Table 11.4.
Table 11.4 Factors affecting water use in the food and drink manufacturing sub-sector
Factor Description Effect on water use
Consumer demand for food and beverage products
Changes in production driven by demand
The food and drink sector is the most directly exposed manufacturing sector to household consumption. While overall demand in the sector fluctuates very little, consumer preferences do change and changing spending patterns determine the type of products that are manufactured. Population growth is also a key driver.
Health, diet and eating trends
Move towards healthier diets
A change in consumer eating trends for example, moves away from red meat consumption and towards ‘fresh’ and ‘natural’ and the rise of vegetarianism and veganism driven by the health agenda, are already starting to emerge.
Reducing food waste Increasing shelf life of food and drink products
Improvements in food packaging will lead to increased shelf life of many products. This combined with changes in consumer behaviour will drive a reduction in food waste. WRAP’s Courtauld Commitment 2025 sets a voluntary target to reduce food and drink waste by 20% (Wrap, n.d.).
Continuous improvement
Productivity gains through water efficiency measures
Over the last 10 years the sector has reduced absolute water consumption by 38.8% against the 2007 baseline. However, further improvements to on-site water management and investment in technology (cleaning in place, water reuse etc) will lead to further efficiency gains.
11.3 Key pressures and drivers affecting sector’s water use
Political and economic
The UK Food and drink sector is a highly competitive industry producing an array of products for the
domestic and international markets. However, the sector’s output is insufficient to satisfy domestic consumer
demand and as a result the UK has to import large quantities of food and drink to meet its demand. In 2015
the UK had the second largest trade deficit in the G7 with around 48% of the food consumed in the country
sourced from overseas. This is in stark contrast to the 9% of food products that are exported from the UK.
While Asia and the Middle East are rapidly growing export markets for UK food products the majority (60%)
is destined for Europe.
The sector has grown steadily over the last decade however, uncertainty regarding the UKs departure from
the European Union is likely to highlight a number of supply side issues which could impact trade. The key
issues associated with Brexit can be summarised as:
Tariff and non-tariff barriers could impact on the sectors’ competitiveness;
Accessibility to skilled workforce. According to the FDF around one third of the sectors workforce
are non-UK EU nationals.
Changing regulations and standards may create costly regulatory barriers to trade for food
products.
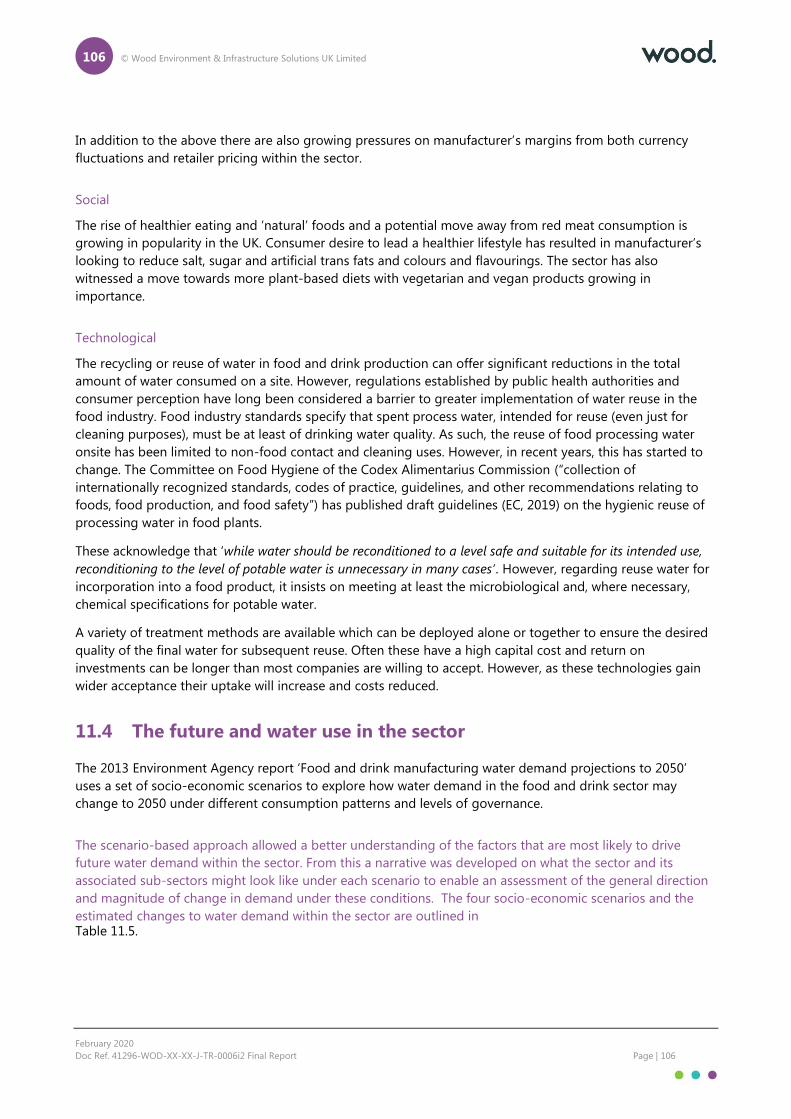
106 © Wood Environment & Infrastructure Solutions UK Limited
February 2020
Doc Ref. 41296-WOD-XX-XX-J-TR-0006i2 Final Report Page | 106
In addition to the above there are also growing pressures on manufacturer’s margins from both currency
fluctuations and retailer pricing within the sector.
Social
The rise of healthier eating and ‘natural’ foods and a potential move away from red meat consumption is
growing in popularity in the UK. Consumer desire to lead a healthier lifestyle has resulted in manufacturer’s
looking to reduce salt, sugar and artificial trans fats and colours and flavourings. The sector has also
witnessed a move towards more plant-based diets with vegetarian and vegan products growing in
importance.
Technological
The recycling or reuse of water in food and drink production can offer significant reductions in the total
amount of water consumed on a site. However, regulations established by public health authorities and
consumer perception have long been considered a barrier to greater implementation of water reuse in the
food industry. Food industry standards specify that spent process water, intended for reuse (even just for
cleaning purposes), must be at least of drinking water quality. As such, the reuse of food processing water
onsite has been limited to non-food contact and cleaning uses. However, in recent years, this has started to
change. The Committee on Food Hygiene of the Codex Alimentarius Commission (“collection of
internationally recognized standards, codes of practice, guidelines, and other recommendations relating to
foods, food production, and food safety”) has published draft guidelines (EC, 2019) on the hygienic reuse of
processing water in food plants.
These acknowledge that ‘while water should be reconditioned to a level safe and suitable for its intended use,
reconditioning to the level of potable water is unnecessary in many cases’. However, regarding reuse water for
incorporation into a food product, it insists on meeting at least the microbiological and, where necessary,
chemical specifications for potable water.
A variety of treatment methods are available which can be deployed alone or together to ensure the desired
quality of the final water for subsequent reuse. Often these have a high capital cost and return on
investments can be longer than most companies are willing to accept. However, as these technologies gain
wider acceptance their uptake will increase and costs reduced.
11.4 The future and water use in the sector
The 2013 Environment Agency report ‘Food and drink manufacturing water demand projections to 2050’
uses a set of socio-economic scenarios to explore how water demand in the food and drink sector may
change to 2050 under different consumption patterns and levels of governance.
The scenario-based approach allowed a better understanding of the factors that are most likely to drive
future water demand within the sector. From this a narrative was developed on what the sector and its
associated sub-sectors might look like under each scenario to enable an assessment of the general direction
and magnitude of change in demand under these conditions. The four socio-economic scenarios and the
estimated changes to water demand within the sector are outlined in Table 11.5.
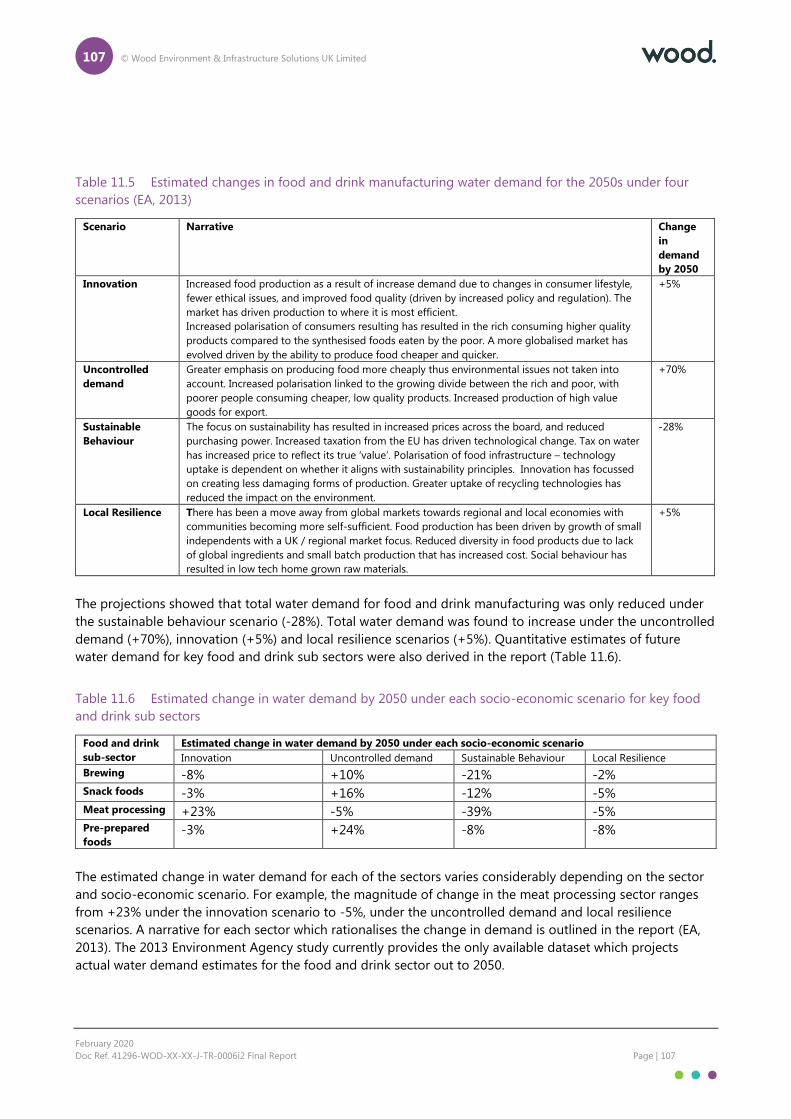
107 © Wood Environment & Infrastructure Solutions UK Limited
February 2020
Doc Ref. 41296-WOD-XX-XX-J-TR-0006i2 Final Report Page | 107
Table 11.5 Estimated changes in food and drink manufacturing water demand for the 2050s under four
scenarios (EA, 2013)
Scenario Narrative Change
in
demand
by 2050 Innovation Increased food production as a result of increase demand due to changes in consumer lifestyle,
fewer ethical issues, and improved food quality (driven by increased policy and regulation). The
market has driven production to where it is most efficient.
Increased polarisation of consumers resulting has resulted in the rich consuming higher quality
products compared to the synthesised foods eaten by the poor. A more globalised market has
evolved driven by the ability to produce food cheaper and quicker.
+5%
Uncontrolled
demand
Greater emphasis on producing food more cheaply thus environmental issues not taken into
account. Increased polarisation linked to the growing divide between the rich and poor, with
poorer people consuming cheaper, low quality products. Increased production of high value
goods for export.
+70%
Sustainable
Behaviour
The focus on sustainability has resulted in increased prices across the board, and reduced
purchasing power. Increased taxation from the EU has driven technological change. Tax on water
has increased price to reflect its true ‘value’. Polarisation of food infrastructure – technology
uptake is dependent on whether it aligns with sustainability principles. Innovation has focussed
on creating less damaging forms of production. Greater uptake of recycling technologies has
reduced the impact on the environment.
-28%
Local Resilience There has been a move away from global markets towards regional and local economies with
communities becoming more self-sufficient. Food production has been driven by growth of small
independents with a UK / regional market focus. Reduced diversity in food products due to lack
of global ingredients and small batch production that has increased cost. Social behaviour has
resulted in low tech home grown raw materials.
+5%
The projections showed that total water demand for food and drink manufacturing was only reduced under
the sustainable behaviour scenario (-28%). Total water demand was found to increase under the uncontrolled
demand (+70%), innovation (+5%) and local resilience scenarios (+5%). Quantitative estimates of future
water demand for key food and drink sub sectors were also derived in the report (Table 11.6).
Table 11.6 Estimated change in water demand by 2050 under each socio-economic scenario for key food
and drink sub sectors
Food and drink
sub-sector
Estimated change in water demand by 2050 under each socio-economic scenario
Innovation Uncontrolled demand Sustainable Behaviour Local Resilience
Brewing -8% +10% -21% -2% Snack foods -3% +16% -12% -5% Meat processing +23% -5% -39% -5% Pre-prepared
foods -3% +24% -8% -8%
The estimated change in water demand for each of the sectors varies considerably depending on the sector
and socio-economic scenario. For example, the magnitude of change in the meat processing sector ranges
from +23% under the innovation scenario to -5%, under the uncontrolled demand and local resilience
scenarios. A narrative for each sector which rationalises the change in demand is outlined in the report (EA,
2013). The 2013 Environment Agency study currently provides the only available dataset which projects
actual water demand estimates for the food and drink sector out to 2050.
108 © Wood Environment & Infrastructure Solutions UK Limited
February 2020
Doc Ref. 41296-WOD-XX-XX-J-TR-0006i2 Final Report Page | 108
In a study to assess the potential for a low-carbon future across the most energy intensive industrial sectors
in the UK, the Department for Business, Energy and Industrial Strategy (BEIS) and the Department of Energy
and Climate Change (DECC) (here on in referred to as the BEIS) set a number of decarbonisation pathways for
the sector which were tested under three future growth scenarios:
Current trends (1% annual growth): This would represent a future world very similar to our world
today with low continuous growth of the industry in the UK.
Challenging world (0% growth): This would represent a future world with a more challenging
economic climate and where decarbonisation is not a priority and the industry is declining in the
UK.
Collaborative growth (2% annual growth): This would represent a future world with a positive
economic climate and where there is collaboration across the globe to decarbonise and where the
industry has a higher growth rate in the UK.
While not specifically focussing on water demand the underlying scenarios and assumptions could provide a
proxy reference point to check any estimates of the likely magnitude and direction of change in future water
demand within the sector produced as part of this study. The study provided no detail on how the overall
sector growth rates were established but it is assumed that they were based on assumptions regarding sector
economics, trade, exports etc.
11.5 Future narratives
This study has highlighted a number of drivers which are likely to affect water demand within the sector.
Narratives to support future demand forecasting need to consider how these key drivers (described above)
might be influenced or be sensitive to future changes in socio-economic conditions and trade. Changes in
international trade agreements and introduction of tariffs following the UK’s departure from the EU will also
be critically important. However, it must also be noted that the significant diversity within the food and drink
sector makes it difficult to generalise about trends at the sector level. As a starting point, the following
narratives around the likely magnitude and direction of change for each of the drivers, which are likely to
affect future water demand, are starting to emerge (note that the following narratives focus on the
hypothetical effects of drivers acting in isolation):
Population growth: Overall demand for food and drink products is expected to increase in line with
increasing UK population. Assuming a direct correlation between demand and water use associated with
production, and based on this demand being met entirely by domestic production, future water demand
within the sector could increase by 30% against the current baseline. At present only 9% of food produced in
UK is exported thus population has a direct influence on demand for 91% of the UK production. If this level
is maintained then future water demand within the sector could increase by 27% as a direct result of
population growth.
Meat consumption per capita: In 2015, raw meat purchases per household fell by 4% compared to 2014
(ONS, 2016). While this may for a variety of reasons, with an increase in vegetarianism and veganism this
overall trend is likely to continue. At present water demand for meat processing accounts for approximately
20% of the total use in the UK. Thus, assuming a direct correlation between demand for meat products and
water use there is likely to be a decrease in future water demand for this sub-sector. The magnitude of this
change is somewhat uncertain as the markets for products to replace meat will growth and require water for
production. As such a modest 10% decrease in water demand within the sector is estimated as possible.
Process efficiency: The food and drink sector is considered one of the more water efficient manufacturing
sectors in the UK. Following the publication of Defra’s Food Industry Sustainability Strategy (FISS) (Defra,
109 © Wood Environment & Infrastructure Solutions UK Limited
February 2020
Doc Ref. 41296-WOD-XX-XX-J-TR-0006i2 Final Report Page | 109
2007) and the subsequent implementation of sector initiatives led by the FDF, such as FHC 202017 and
Ambition 2025 the sector has made steady progress in reducing water use. However, there remains scope for
further improvement and sites that have not undertaken any action to reduce water consumption could save
around 30% through low cost, no-cost measures.
Proportion consumed that is produced in UK: Currently around 52% of food consumed in country is
produced in the UK (EEF, 2018). Under certain socio-economic conditions this is expected to result in greater
domestic production to meet the increased demand for food in the UK and abroad (greater exports). In the
best-case scenario, it is estimated that this could result in a maximum increase in domestic production of
20% by 2050 and an equivalent uplift in the associated water demand.
Food waste: It is reported that around 25% of all food produced is currently wasted (Wrap, n.d.). Assuming a
direct correlation between food waste and water use (to produce the food which is wasted) any reduction will
result in reduced water demand. The general shift towards reducing food waste is set to continue driven by
changes in consumer behaviour and improvements in food packaging which will lead to increased shelf life
of many products. Based on the assumption that food waste will be cut in half it is estimated that future
water demand might decline by 25% by 2050.
Impacts of climate change (temperature) on soft drink production: Climate change scenarios predict that
temperatures in the UK will increase in the future resulting in with longer, hotter summers. As a consequence,
it is expected that the demand for soft drinks will also increase in line with these changes. The manufacture
of soft drinks currently accounts for around 7.5% of total food and drink sector water use in the UK. While
there is some uncertainty, it is anticipated that soft drink consumption could double by 2050, thus assuming
a direct correlation between water use and soft drink production overall water demand in the future could
increase by 7.5%.
Increased export: The food and drink manufacturing sector predominately serves the domestic UK market
with only 9% of production exported. In the last two decades exports have doubled with overseas sales of
food and drink products reaching £20 billion in 201692. The EEF also described growth in EU exports of 10.4%
in 2016, and that an increasing demand globally for UK F&D products (2010-2016 growth in exports to China
259%). Generally, this export growth is driven by a few food and drink sectors (e.g. alcoholic beverages (gin,
whiskey and beer) and meat) all of which are water intensive.
Current UK Government policy aims to increase future exports however, the challenges associated with Brexit
may lead to a decline in growth in the short term. Considering a 3-5% annual growth rate in production for
exports from a baseline of 9%, water demand could increase in line with increased production by a maximum
of 40% out to 2050.
Magnitude and direction of change
In considering the key drivers for water demand set out above an overall trend or narrative for the sector can
be established. In general population growth and a desire to increase exports from the UK food and drink
sector will increase outputs and therefore water demand. However, a building trend for reduced food waste
(less product required per unit consumed), consumer dietary changes (shifting to less water-intensive
products) and continued efficiency measures may offset some of this increased water demand, but not all.
Overall this is broadly in line with the findings from the 2013 Environment Agency study to project water
demand out to 2050.
17 FHC 2020 is a sector led voluntary agreement to reduce water consumption by 20% against the 2006 baseline.

110 © Wood Environment & Infrastructure Solutions UK Limited
February 2020
Doc Ref. 41296-WOD-XX-XX-J-TR-0006i2 Final Report Page | 110
11.6 Gaps in knowledge
In the short to medium term there also remains considerable uncertainty on the future growth and direction
of the sector due to the changes in international trade agreements and introduction of tariffs following the
UK’s departure from the EU.
Unlike the other UK manufacturing sectors, the food and drink sector has reasonable baseline data on water
consumption and annual trends. Following the 2013 Environment Agency study no further work to model
future water demand in the sector has been undertaken however the outputs from this work are still
considered highly relevant.
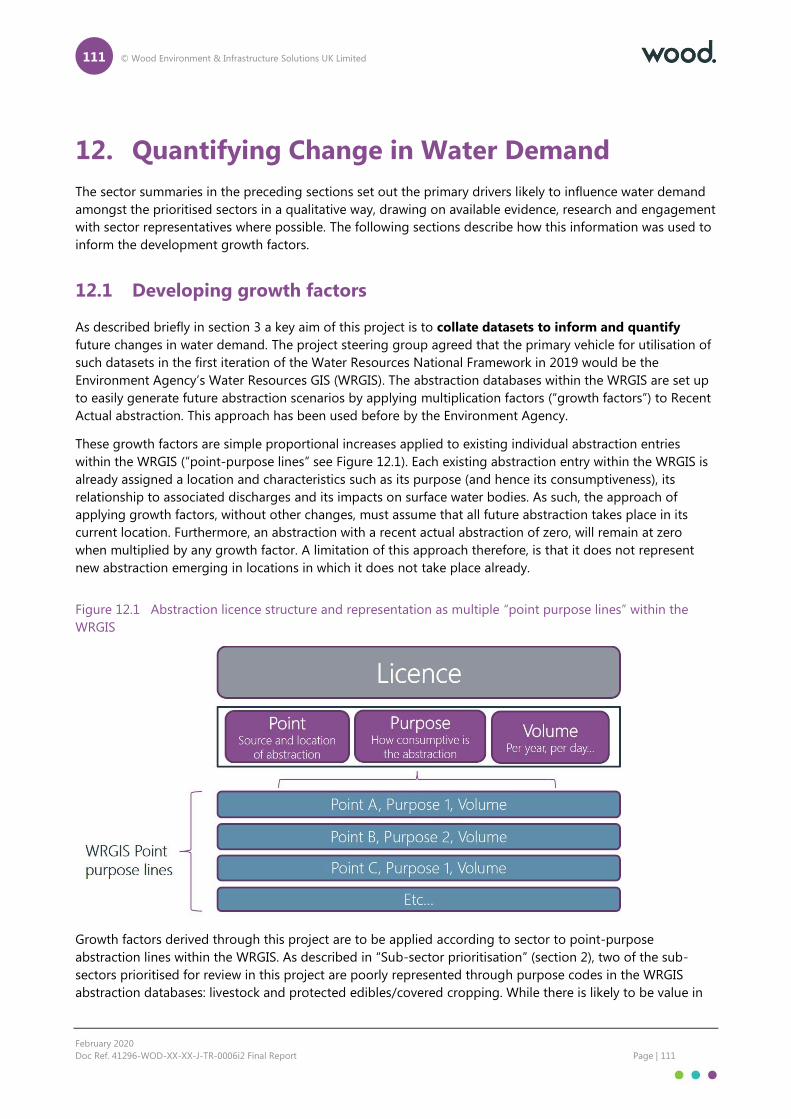
111 © Wood Environment & Infrastructure Solutions UK Limited
February 2020
Doc Ref. 41296-WOD-XX-XX-J-TR-0006i2 Final Report Page | 111
12. Quantifying Change in Water Demand
The sector summaries in the preceding sections set out the primary drivers likely to influence water demand
amongst the prioritised sectors in a qualitative way, drawing on available evidence, research and engagement
with sector representatives where possible. The following sections describe how this information was used to
inform the development growth factors.
12.1 Developing growth factors
As described briefly in section 3 a key aim of this project is to collate datasets to inform and quantify
future changes in water demand. The project steering group agreed that the primary vehicle for utilisation of
such datasets in the first iteration of the Water Resources National Framework in 2019 would be the
Environment Agency’s Water Resources GIS (WRGIS). The abstraction databases within the WRGIS are set up
to easily generate future abstraction scenarios by applying multiplication factors (“growth factors”) to Recent
Actual abstraction. This approach has been used before by the Environment Agency.
These growth factors are simple proportional increases applied to existing individual abstraction entries
within the WRGIS (“point-purpose lines” see Figure 12.1). Each existing abstraction entry within the WRGIS is
already assigned a location and characteristics such as its purpose (and hence its consumptiveness), its
relationship to associated discharges and its impacts on surface water bodies. As such, the approach of
applying growth factors, without other changes, must assume that all future abstraction takes place in its
current location. Furthermore, an abstraction with a recent actual abstraction of zero, will remain at zero
when multiplied by any growth factor. A limitation of this approach therefore, is that it does not represent
new abstraction emerging in locations in which it does not take place already.
Figure 12.1 Abstraction licence structure and representation as multiple “point purpose lines” within the
WRGIS
Growth factors derived through this project are to be applied according to sector to point-purpose
abstraction lines within the WRGIS. As described in “Sub-sector prioritisation” (section 2), two of the sub-
sectors prioritised for review in this project are poorly represented through purpose codes in the WRGIS
abstraction databases: livestock and protected edibles/covered cropping. While there is likely to be value in
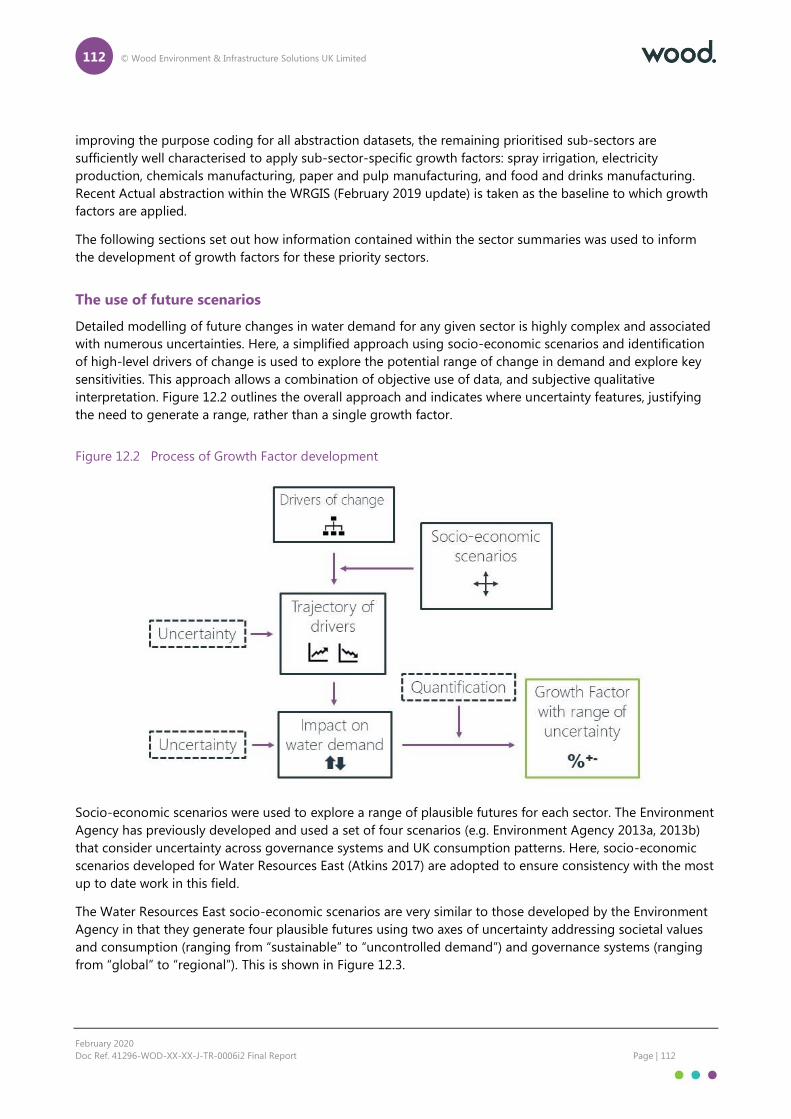
112 © Wood Environment & Infrastructure Solutions UK Limited
February 2020
Doc Ref. 41296-WOD-XX-XX-J-TR-0006i2 Final Report Page | 112
improving the purpose coding for all abstraction datasets, the remaining prioritised sub-sectors are
sufficiently well characterised to apply sub-sector-specific growth factors: spray irrigation, electricity
production, chemicals manufacturing, paper and pulp manufacturing, and food and drinks manufacturing.
Recent Actual abstraction within the WRGIS (February 2019 update) is taken as the baseline to which growth
factors are applied.
The following sections set out how information contained within the sector summaries was used to inform
the development of growth factors for these priority sectors.
The use of future scenarios
Detailed modelling of future changes in water demand for any given sector is highly complex and associated
with numerous uncertainties. Here, a simplified approach using socio-economic scenarios and identification
of high-level drivers of change is used to explore the potential range of change in demand and explore key
sensitivities. This approach allows a combination of objective use of data, and subjective qualitative
interpretation. Figure 12.2 outlines the overall approach and indicates where uncertainty features, justifying
the need to generate a range, rather than a single growth factor.
Figure 12.2 Process of Growth Factor development
Socio-economic scenarios were used to explore a range of plausible futures for each sector. The Environment
Agency has previously developed and used a set of four scenarios (e.g. Environment Agency 2013a, 2013b)
that consider uncertainty across governance systems and UK consumption patterns. Here, socio-economic
scenarios developed for Water Resources East (Atkins 2017) are adopted to ensure consistency with the most
up to date work in this field.
The Water Resources East socio-economic scenarios are very similar to those developed by the Environment
Agency in that they generate four plausible futures using two axes of uncertainty addressing societal values
and consumption (ranging from “sustainable” to “uncontrolled demand”) and governance systems (ranging
from “global” to “regional”). This is shown in Figure 12.3.
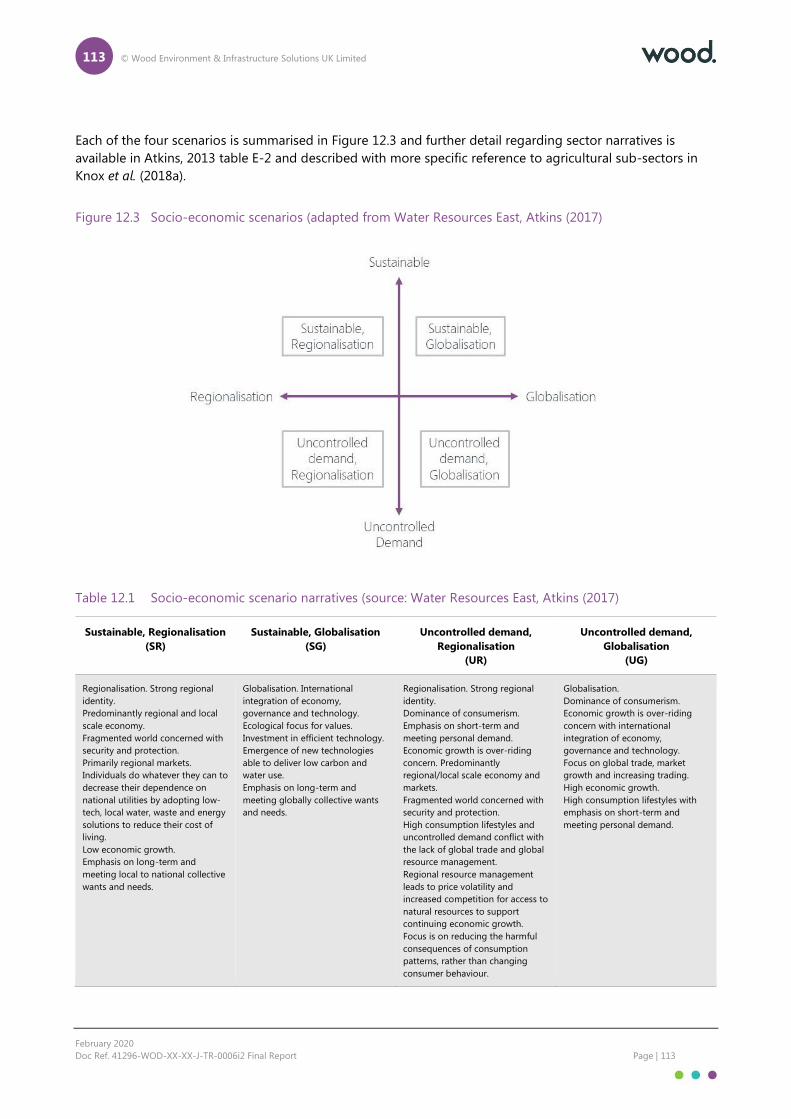
113 © Wood Environment & Infrastructure Solutions UK Limited
February 2020
Doc Ref. 41296-WOD-XX-XX-J-TR-0006i2 Final Report Page | 113
Each of the four scenarios is summarised in Figure 12.3 and further detail regarding sector narratives is
available in Atkins, 2013 table E-2 and described with more specific reference to agricultural sub-sectors in
Knox et al. (2018a).
Figure 12.3 Socio-economic scenarios (adapted from Water Resources East, Atkins (2017)
Table 12.1 Socio-economic scenario narratives (source: Water Resources East, Atkins (2017)
Sustainable, Regionalisation
(SR)
Sustainable, Globalisation
(SG)
Uncontrolled demand,
Regionalisation
(UR)
Uncontrolled demand,
Globalisation
(UG)
Regionalisation. Strong regional
identity.
Predominantly regional and local
scale economy.
Fragmented world concerned with
security and protection.
Primarily regional markets.
Individuals do whatever they can to
decrease their dependence on
national utilities by adopting low-
tech, local water, waste and energy
solutions to reduce their cost of
living.
Low economic growth.
Emphasis on long-term and
meeting local to national collective
wants and needs.
Globalisation. International
integration of economy,
governance and technology.
Ecological focus for values.
Investment in efficient technology.
Emergence of new technologies
able to deliver low carbon and
water use.
Emphasis on long-term and
meeting globally collective wants
and needs.
Regionalisation. Strong regional
identity.
Dominance of consumerism.
Emphasis on short-term and
meeting personal demand.
Economic growth is over-riding
concern. Predominantly
regional/local scale economy and
markets.
Fragmented world concerned with
security and protection.
High consumption lifestyles and
uncontrolled demand conflict with
the lack of global trade and global
resource management.
Regional resource management
leads to price volatility and
increased competition for access to
natural resources to support
continuing economic growth.
Focus is on reducing the harmful
consequences of consumption
patterns, rather than changing
consumer behaviour.
Globalisation.
Dominance of consumerism.
Economic growth is over-riding
concern with international
integration of economy,
governance and technology.
Focus on global trade, market
growth and increasing trading.
High economic growth.
High consumption lifestyles with
emphasis on short-term and
meeting personal demand.
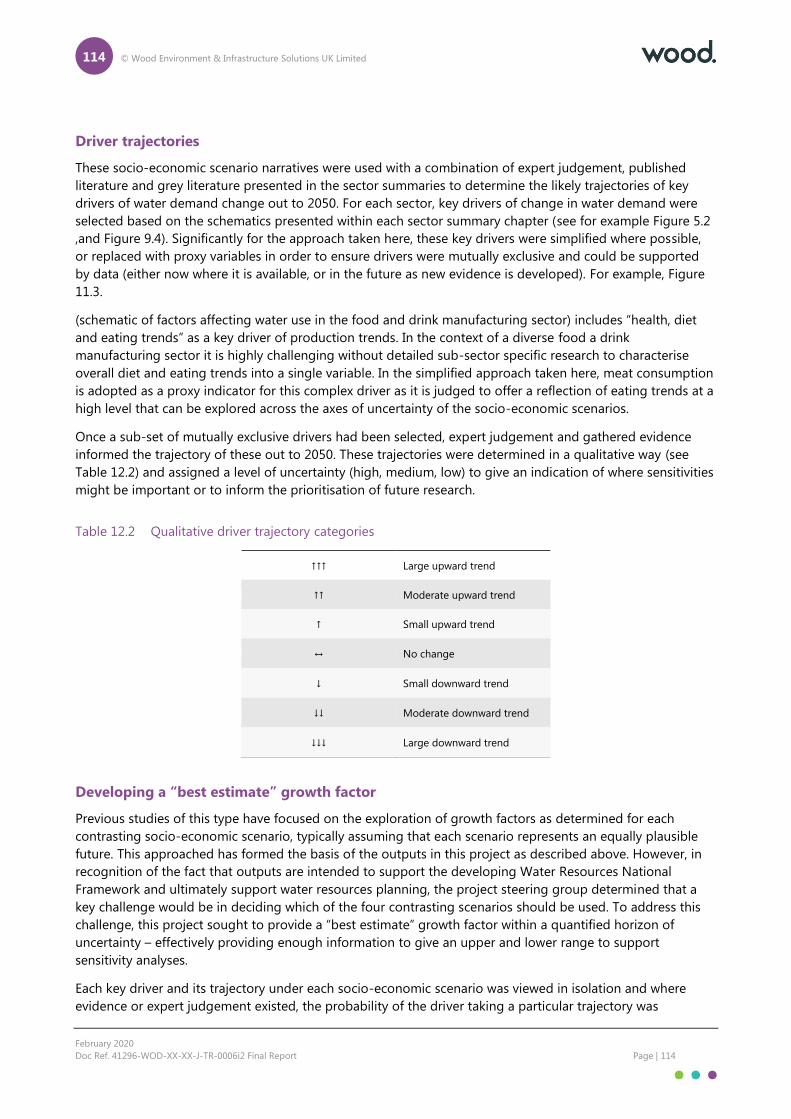
114 © Wood Environment & Infrastructure Solutions UK Limited
February 2020
Doc Ref. 41296-WOD-XX-XX-J-TR-0006i2 Final Report Page | 114
Driver trajectories
These socio-economic scenario narratives were used with a combination of expert judgement, published
literature and grey literature presented in the sector summaries to determine the likely trajectories of key
drivers of water demand change out to 2050. For each sector, key drivers of change in water demand were
selected based on the schematics presented within each sector summary chapter (see for example Figure 5.2
,and Figure 9.4). Significantly for the approach taken here, these key drivers were simplified where possible,
or replaced with proxy variables in order to ensure drivers were mutually exclusive and could be supported
by data (either now where it is available, or in the future as new evidence is developed). For example, Figure
11.3.
(schematic of factors affecting water use in the food and drink manufacturing sector) includes “health, diet
and eating trends” as a key driver of production trends. In the context of a diverse food a drink
manufacturing sector it is highly challenging without detailed sub-sector specific research to characterise
overall diet and eating trends into a single variable. In the simplified approach taken here, meat consumption
is adopted as a proxy indicator for this complex driver as it is judged to offer a reflection of eating trends at a
high level that can be explored across the axes of uncertainty of the socio-economic scenarios.
Once a sub-set of mutually exclusive drivers had been selected, expert judgement and gathered evidence
informed the trajectory of these out to 2050. These trajectories were determined in a qualitative way (see
Table 12.2) and assigned a level of uncertainty (high, medium, low) to give an indication of where sensitivities
might be important or to inform the prioritisation of future research.
Table 12.2 Qualitative driver trajectory categories
↑↑↑ Large upward trend
↑↑ Moderate upward trend
↑ Small upward trend
↔ No change
↓ Small downward trend
↓↓ Moderate downward trend
↓↓↓ Large downward trend
Developing a “best estimate” growth factor
Previous studies of this type have focused on the exploration of growth factors as determined for each
contrasting socio-economic scenario, typically assuming that each scenario represents an equally plausible
future. This approached has formed the basis of the outputs in this project as described above. However, in
recognition of the fact that outputs are intended to support the developing Water Resources National
Framework and ultimately support water resources planning, the project steering group determined that a
key challenge would be in deciding which of the four contrasting scenarios should be used. To address this
challenge, this project sought to provide a “best estimate” growth factor within a quantified horizon of
uncertainty – effectively providing enough information to give an upper and lower range to support
sensitivity analyses.
Each key driver and its trajectory under each socio-economic scenario was viewed in isolation and where
evidence or expert judgement existed, the probability of the driver taking a particular trajectory was

115 © Wood Environment & Infrastructure Solutions UK Limited
February 2020
Doc Ref. 41296-WOD-XX-XX-J-TR-0006i2 Final Report Page | 115
specified. The justification for taking this approach depends very much on the driver being considered and
the forces acting on it within each scenario. For example, a key driver selected for the analysis of future water
demand in the paper and pulp manufacturing sector is the proportion of packaging consisting of paper-
based materials. The baseline value for this globally is 34%. Current developing trends in packaging and the
shift from plastics to other materials (not only paper-based) would suggest that it is more likely that this
proportion will increase within the next three decades, than decrease. As such, scenarios in which this upward
trend is reflected, are given a slightly higher probability of occurrence. There are other examples for other
sub-sectors which can be seen in the summary data tables presented in Appendix B. Where no evidence or
justification existed for increasing the probability of one scenario over another, all trajectories were given
equal probability.
This allowed a weighted average change in water demand to be determined in subsequent steps, providing
the “best estimate” of change in water demand arising from each driver acting in isolation. Combining these
to give a net overall change therefore provided a “best estimate” overall growth factor for the sub-sector.
While each socio-economic scenario is typically assumed to be equally plausible, it should be noted that due
to their contrasting nature, they are likely to reflect more extreme and one-dimensional views of the future.
The way in which external socio-economic forces act on each sector will in practice be varied and complex. A
weighted average of the outcome of the four contrasting scenarios is considered to reflect the variety of
unique ways in which external drivers and internal business decisions and responses might play out within
each sector. This is particularly important for those sub-sectors characterised by a high degree of diversity in
production, processes, markets and business preferences.
Quantifying the change in water demand
The evidence reviewed as part of this project revealed that data sets and information relating directly to
water demand projections across the variety of sectors prioritised here are limited. Where it exists, it is often
in a form that is difficult to relate back to the adopted socio-economic scenarios, current assumptions or
directly compare across sectors in a consistent way. For this reason, in order to make use of information and
data that are available, the following method was used.
A plausible change in water demand caused by the most significant upward or downward key driver
trajectory identified in the scenario analysis was determined by using evidence set out in the sector chapters,
supported by key assumptions and expert judgement. This value then provides an upper benchmark for
change in demand (as an increase or decrease depending on the driver) against which the outcomes of other
scenarios with less extreme driver trajectories could be assessed in a more consistency way, without the need
for complex demand modelling or an unwieldy number of data assumptions.
For example, for the chemicals manufacturing sector, two of the socio-economic scenarios were
characterised by an increase in process efficiency (process efficiency being one of the selected key drivers).
Limited information exists in relation to water efficiency directly in the chemicals sector. Drawing on
experience from other manufacturing sectors for which there has been greater emphasis placed on collection
of water use data, it is judged that an improvement in water efficiency in the chemicals sector of 30% is
plausible as a maximum.
A horizon of uncertainty around this estimated plausible change in water demand, specified as a linear
increase or decrease in water demand is assigned (taking into consideration uncertainty around the stated
and non-stated socio-economic scenarios). In most cases the uncertainty range was derived through expert
judgement in the absence of better information.
The plausible change in water demand under each scenario was then estimated using a Likert scale (1-9,
where 1 indicates a strong negative change in water demand, 5 no change and 9 a strong positive change).
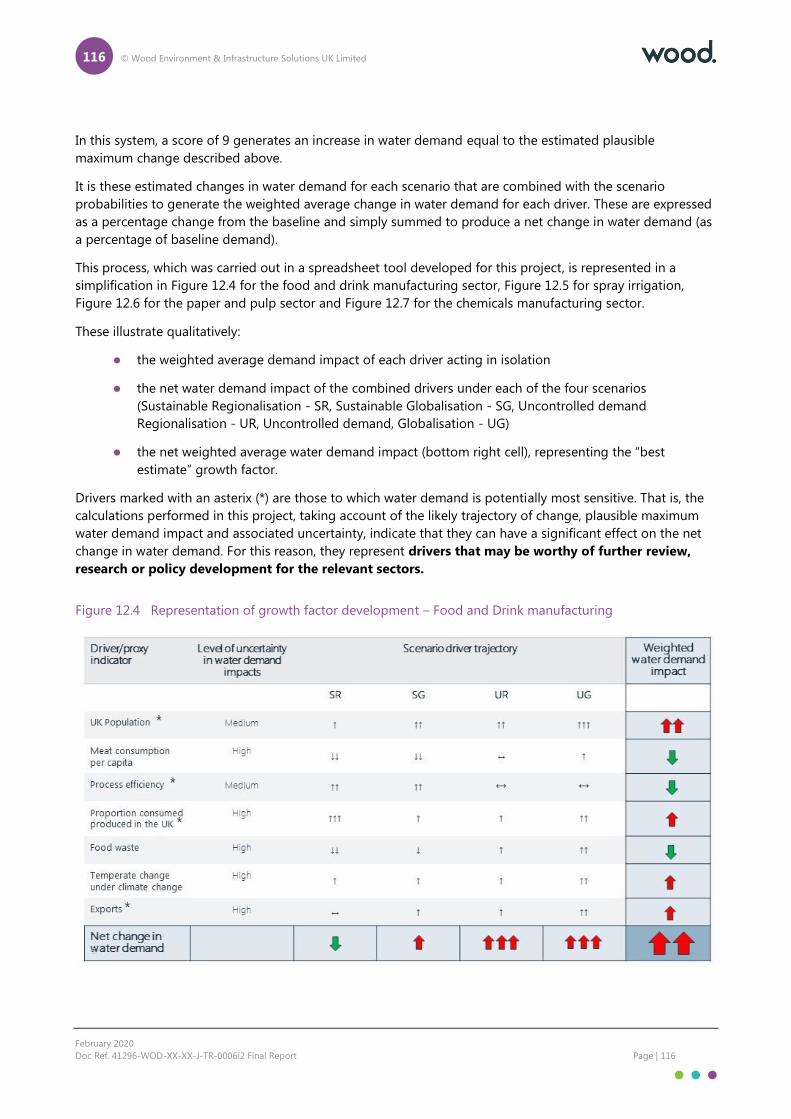
116 © Wood Environment & Infrastructure Solutions UK Limited
February 2020
Doc Ref. 41296-WOD-XX-XX-J-TR-0006i2 Final Report Page | 116
In this system, a score of 9 generates an increase in water demand equal to the estimated plausible
maximum change described above.
It is these estimated changes in water demand for each scenario that are combined with the scenario
probabilities to generate the weighted average change in water demand for each driver. These are expressed
as a percentage change from the baseline and simply summed to produce a net change in water demand (as
a percentage of baseline demand).
This process, which was carried out in a spreadsheet tool developed for this project, is represented in a
simplification in Figure 12.4 for the food and drink manufacturing sector, Figure 12.5 for spray irrigation,
Figure 12.6 for the paper and pulp sector and Figure 12.7 for the chemicals manufacturing sector.
These illustrate qualitatively:
the weighted average demand impact of each driver acting in isolation
the net water demand impact of the combined drivers under each of the four scenarios
(Sustainable Regionalisation - SR, Sustainable Globalisation - SG, Uncontrolled demand
Regionalisation - UR, Uncontrolled demand, Globalisation - UG)
the net weighted average water demand impact (bottom right cell), representing the “best
estimate” growth factor.
Drivers marked with an asterix (*) are those to which water demand is potentially most sensitive. That is, the
calculations performed in this project, taking account of the likely trajectory of change, plausible maximum
water demand impact and associated uncertainty, indicate that they can have a significant effect on the net
change in water demand. For this reason, they represent drivers that may be worthy of further review,
research or policy development for the relevant sectors.
Figure 12.4 Representation of growth factor development – Food and Drink manufacturing

117 © Wood Environment & Infrastructure Solutions UK Limited
February 2020
Doc Ref. 41296-WOD-XX-XX-J-TR-0006i2 Final Report Page | 117
Figure 12.5 Representation of growth factor development – Spray Irrigation
Figure 12.6 Representation of growth factor development – Paper and Pulp sector
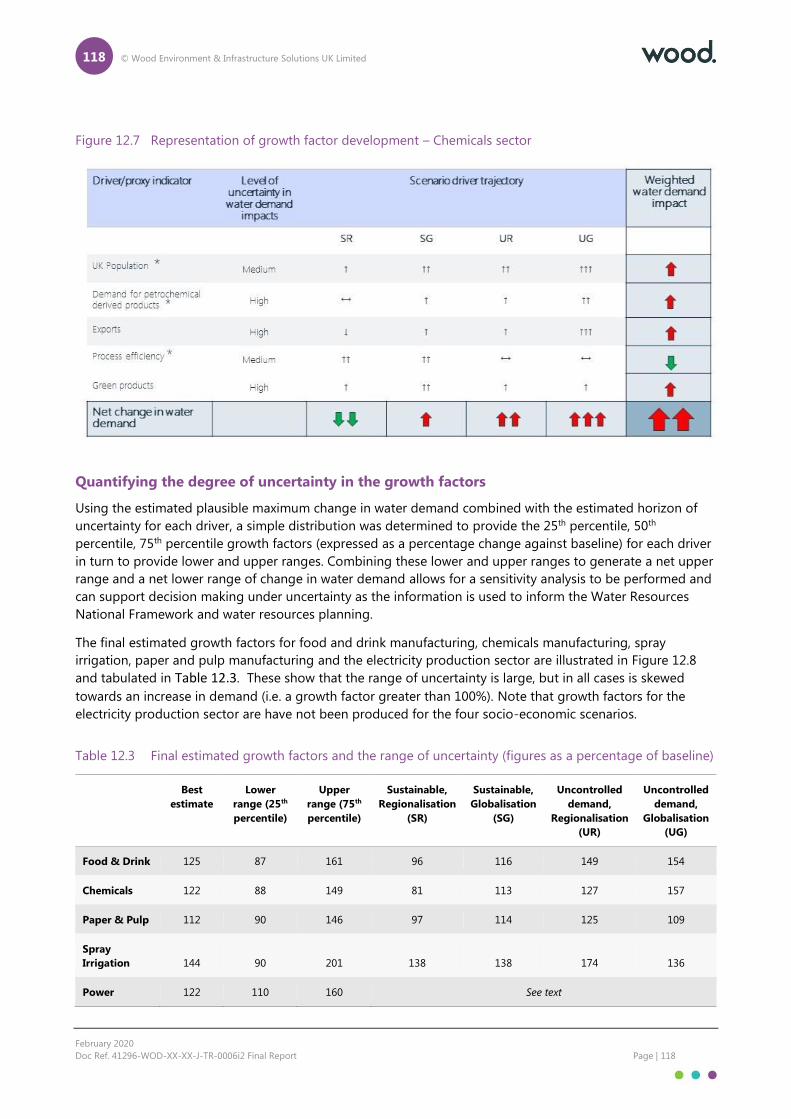
118 © Wood Environment & Infrastructure Solutions UK Limited
February 2020
Doc Ref. 41296-WOD-XX-XX-J-TR-0006i2 Final Report Page | 118
Figure 12.7 Representation of growth factor development – Chemicals sector
Quantifying the degree of uncertainty in the growth factors
Using the estimated plausible maximum change in water demand combined with the estimated horizon of
uncertainty for each driver, a simple distribution was determined to provide the 25th percentile, 50th
percentile, 75th percentile growth factors (expressed as a percentage change against baseline) for each driver
in turn to provide lower and upper ranges. Combining these lower and upper ranges to generate a net upper
range and a net lower range of change in water demand allows for a sensitivity analysis to be performed and
can support decision making under uncertainty as the information is used to inform the Water Resources
National Framework and water resources planning.
The final estimated growth factors for food and drink manufacturing, chemicals manufacturing, spray
irrigation, paper and pulp manufacturing and the electricity production sector are illustrated in Figure 12.8
and tabulated in Table 12.3. These show that the range of uncertainty is large, but in all cases is skewed
towards an increase in demand (i.e. a growth factor greater than 100%). Note that growth factors for the
electricity production sector are have not been produced for the four socio-economic scenarios.
Table 12.3 Final estimated growth factors and the range of uncertainty (figures as a percentage of baseline)
Best
estimate
Lower
range (25th
percentile)
Upper
range (75th
percentile)
Sustainable,
Regionalisation
(SR)
Sustainable,
Globalisation
(SG)
Uncontrolled
demand,
Regionalisation
(UR)
Uncontrolled
demand,
Globalisation
(UG)
Food & Drink 125 87 161 96 116 149 154
Chemicals 122 88 149 81 113 127 157
Paper & Pulp 112 90 146 97 114 125 109
Spray
Irrigation 144 90 201 138 138 174 136
Power 122 110 160 See text
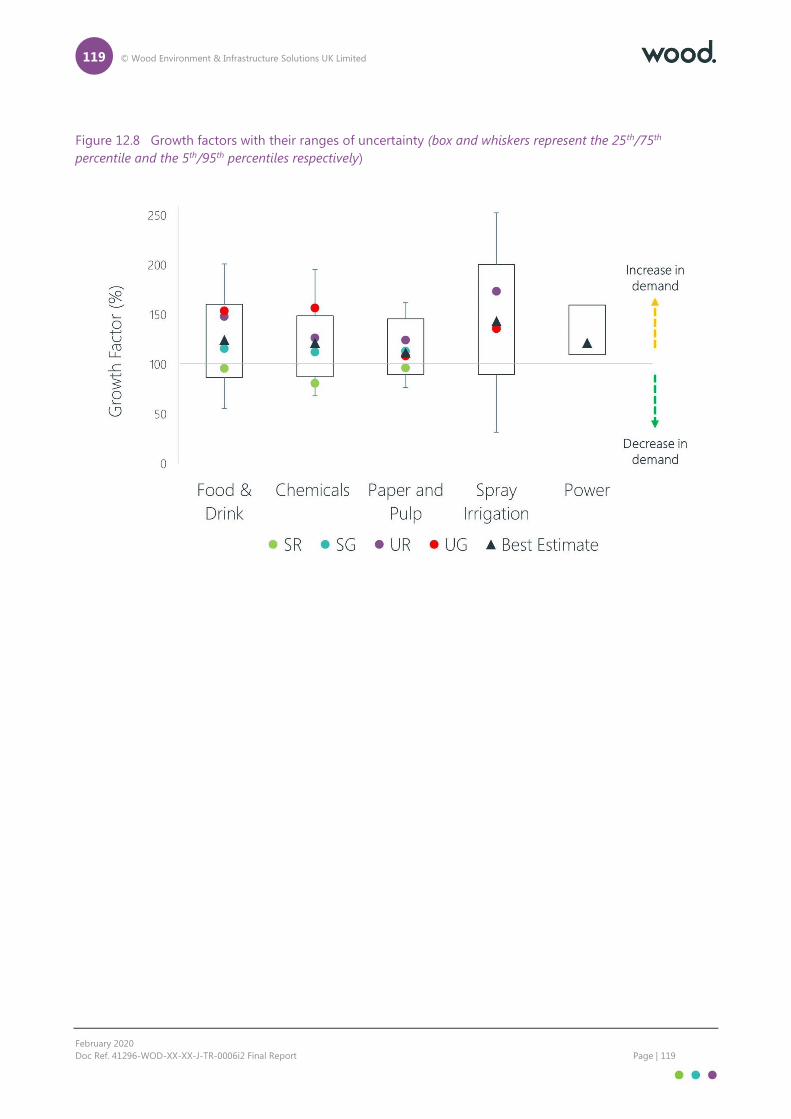
119 © Wood Environment & Infrastructure Solutions UK Limited
February 2020
Doc Ref. 41296-WOD-XX-XX-J-TR-0006i2 Final Report Page | 119
Figure 12.8 Growth factors with their ranges of uncertainty (box and whiskers represent the 25th/75th
percentile and the 5th/95th percentiles respectively)
120 © Wood Environment & Infrastructure Solutions UK Limited
February 2020
Doc Ref. 41296-WOD-XX-XX-J-TR-0006i2 Final Report Page | 120
Electricity production growth factors
There is significant uncertainty at both a national and site-specific level in the future water demands of the
electricity production sector. Section 8 explored these uncertainties in more detail. Key drivers of future
changes in water demand cannot be disentangled to create mutually exclusive relationships in the same way
as the other sectors selected here. The growth factor analysis for this sector could not pass through the
process described above and as such, only a best estimate, lower and upper range of growth factors are
presented to support sensitivity analysis.
The latest Future Energy Scenarios (FES 2019) provide an indication of the pathways that could be taken by
the industry to deliver decarbonisation targets, but there is little direct evidence available to translate these
scenarios and the details within them into changes in water demand. Work is due to be carried out by sector
in 2020 to address this information gap.
All scenarios within FES 2019 indicate an increase in overall electricity demand, with the Net Zero scenario
requiring the greatest generation (an increase of 172% over current demand by 2050) as a result of wider
reaching electrification of industry, transport and households. In the absence of any other changes to the
energy supply mix, cooling technologies or site locations, this would result in a significant increase in
freshwater demand. However, a complex range of interacting factors beyond the scope of this project to
analyse will influence the actual trajectory and magnitude of change.
The energy mix is critical. How and where electricity is generated will have a major bearing on national and
local freshwater demand from this sector. Perhaps more so than any other water-using sector, water needs
for the electricity production sector will vary considerably based on investment decisions at a very small
number of sites.
It is important to note that freshwater demand from this sector is unlikely to be consistent throughout any
given year. A distinction is made between the installed generation capacity and electricity demand. Installed
capacity will exceed projected electricity demand to ensure resilience (effectively providing headroom) and is
likely to involve a mixture of electricity production technologies with varying water freshwater demands.
During stress periods, or during periods in which typically “dormant” installations are required to generate
electricity, freshwater demand may increase.
The growth factor estimates presented here are taken simply from previous work carried out by the
Environment Agency (best estimate growth factor of 122%) and Byers et al. (2014) (upper range of freshwater
consumption based on the CCS+ scenario of 160%) and a more conservative 110% growth factor assigned to
the lower range. However, it should be noted that some energy mix scenarios could result in a decrease in
consumptive freshwater demand in some catchments.
121 © Wood Environment & Infrastructure Solutions UK Limited
February 2020
Doc Ref. 41296-WOD-XX-XX-J-TR-0006i2 Final Report Page | 121
13. Application of growth factors
13.1 Approach and assumptions
The best estimate and upper estimate (drawn from the 75th percentile) growth factors were applied to licence
point-purpose lines according their purpose codes and sector groupings, and WRGIS data handling
assumptions set out in section 1 and Appendix A.
Growth factors were applied consistently at a national scale based simply on the licence point-purpose
category. It is important to note that there is of course likely to be variation between regions, catchments and
individual users. The evidence gathered through this project, and the broad sectoral scope did not allow for
the derivation of regional or locally derive industry growth factors (for example indicating a greater
concentration of chemical industries in the North West). However, it could be argued that a consistent
approach across the country is appropriate for this national high-level assessment since the priority sectors
reviewed and their markets respond to drivers at a regional and even national level, both of which can be
subject to significant uncertainties. Further research and work may seek to enhance datasets at smaller scales
where a different range of factors and constraints, such as water availability, become more significant
particularly for large individual or groups of abstractors (as part of regional or catchment planning for
instance). This would allow a greater detail of analysis to take place.
The above national derived growth factors have been applied to existing abstractions within the WRGIS. All
future abstraction is therefore assumed to take place where it is currently located.
While growth factors have been developed considering possible change in demand between 2019 and 2050,
growth factors are applied here to Recent Actual annual abstraction as contained within the WRGIS February
2019 update. This is taken to be reflective of the period 2010-15 where possible. A more up to date baseline
is not available without a more thorough processing of annual abstraction returns data beyond the scope of
this project. However, for the purposes of demonstrating the use of these growth factors in a national-level
assessment, and considering other data uncertainties, this is not viewed as a significant hinderance the basic
analyses that follow here.
Note that in agreement with the project steering group, growth factors have been applied to licence point-
purpose lines within the WRGIS without constraining growth to fully licensed annual limits and without
regard for the availability of water to meet the project demand. As such, some individual abstractions exceed
their licensed volume in the growth scenarios, and it is possible that many individual abstractions would be
unable to grow as projected. This approach is deemed to be appropriate here in order to reveal where
pressures might exist. In this way, the projected change in demand from the priority sectors presented below
can be viewed in a similar way to the baseline supply demand balance within a water company’s Water
Resources Management Plan, which may indicate deficits in supply later in the planning horizon prior to the
selection of preferred options to address these.
Licence point-purpose lines for which growth factors have been developed in this project account for
approximately 60% of estimated consumptive freshwater abstraction outside of the water industry in
England. In some regions this figure is higher where the selected priority sectors are prevalent. However, it
should be noted that due to the high volumes of abstraction associated with the minerals sector along with
livestock farming in West Country Water Resources, the growth factors presented here account for a smaller
proportion of total abstraction in that region.
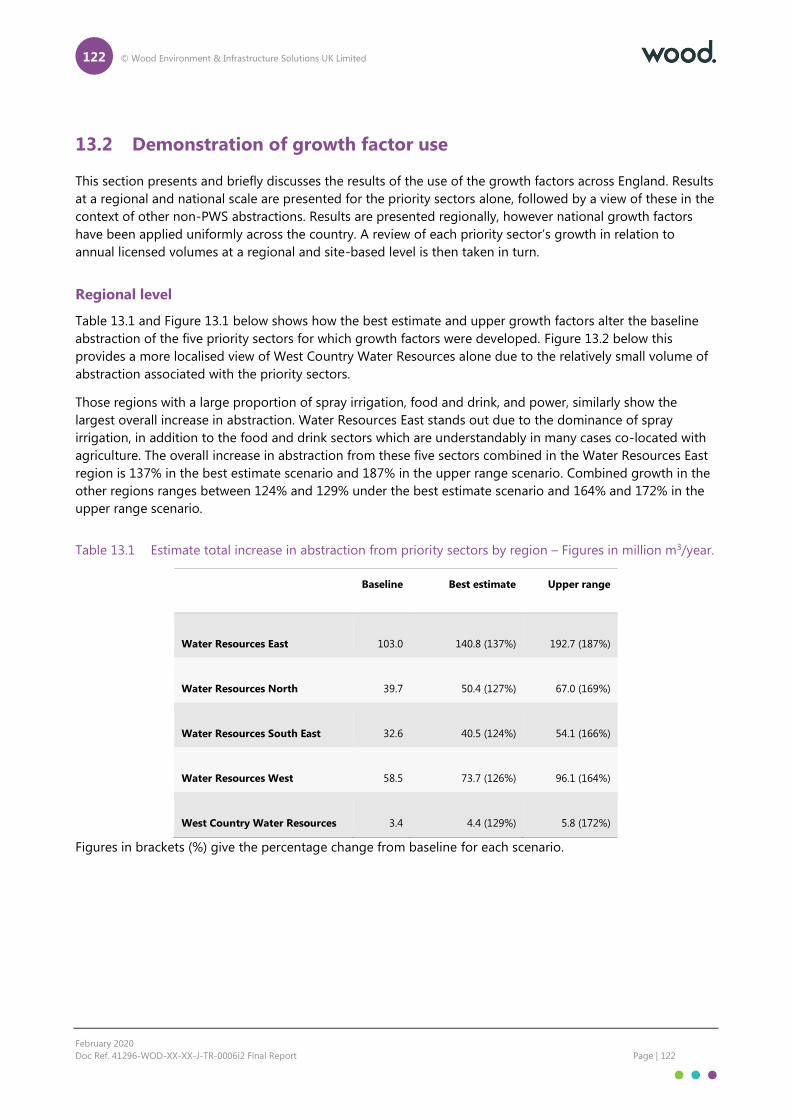
122 © Wood Environment & Infrastructure Solutions UK Limited
February 2020
Doc Ref. 41296-WOD-XX-XX-J-TR-0006i2 Final Report Page | 122
13.2 Demonstration of growth factor use
This section presents and briefly discusses the results of the use of the growth factors across England. Results
at a regional and national scale are presented for the priority sectors alone, followed by a view of these in the
context of other non-PWS abstractions. Results are presented regionally, however national growth factors
have been applied uniformly across the country. A review of each priority sector’s growth in relation to
annual licensed volumes at a regional and site-based level is then taken in turn.
Regional level
Table 13.1 and Figure 13.1 below shows how the best estimate and upper growth factors alter the baseline
abstraction of the five priority sectors for which growth factors were developed. Figure 13.2 below this
provides a more localised view of West Country Water Resources alone due to the relatively small volume of
abstraction associated with the priority sectors.
Those regions with a large proportion of spray irrigation, food and drink, and power, similarly show the
largest overall increase in abstraction. Water Resources East stands out due to the dominance of spray
irrigation, in addition to the food and drink sectors which are understandably in many cases co-located with
agriculture. The overall increase in abstraction from these five sectors combined in the Water Resources East
region is 137% in the best estimate scenario and 187% in the upper range scenario. Combined growth in the
other regions ranges between 124% and 129% under the best estimate scenario and 164% and 172% in the
upper range scenario.
Table 13.1 Estimate total increase in abstraction from priority sectors by region – Figures in million m3/year.
Baseline Best estimate Upper range
Water Resources East 103.0 140.8 (137%) 192.7 (187%)
Water Resources North 39.7 50.4 (127%) 67.0 (169%)
Water Resources South East 32.6 40.5 (124%) 54.1 (166%)
Water Resources West 58.5 73.7 (126%) 96.1 (164%)
West Country Water Resources 3.4 4.4 (129%) 5.8 (172%)
Figures in brackets (%) give the percentage change from baseline for each scenario.
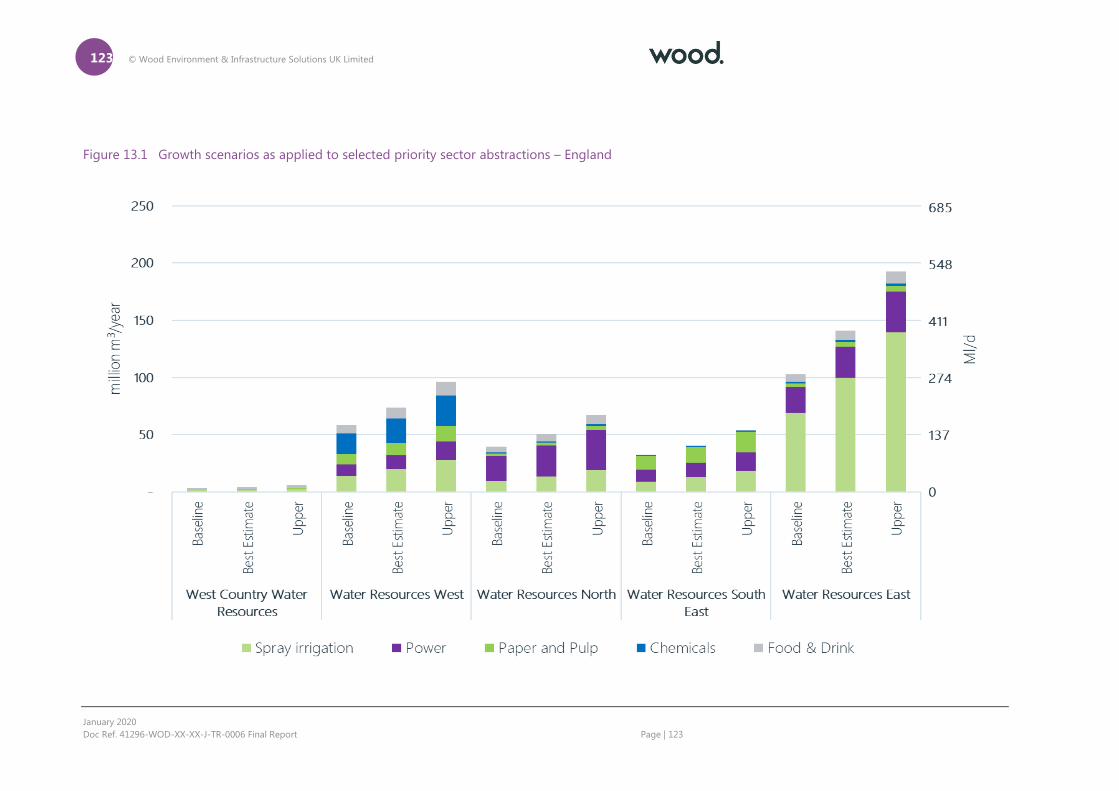
123 © Wood Environment & Infrastructure Solutions UK Limited
January 2020
Doc Ref. 41296-WOD-XX-XX-J-TR-0006 Final Report Page | 123
Figure 13.1 Growth scenarios as applied to selected priority sector abstractions – England
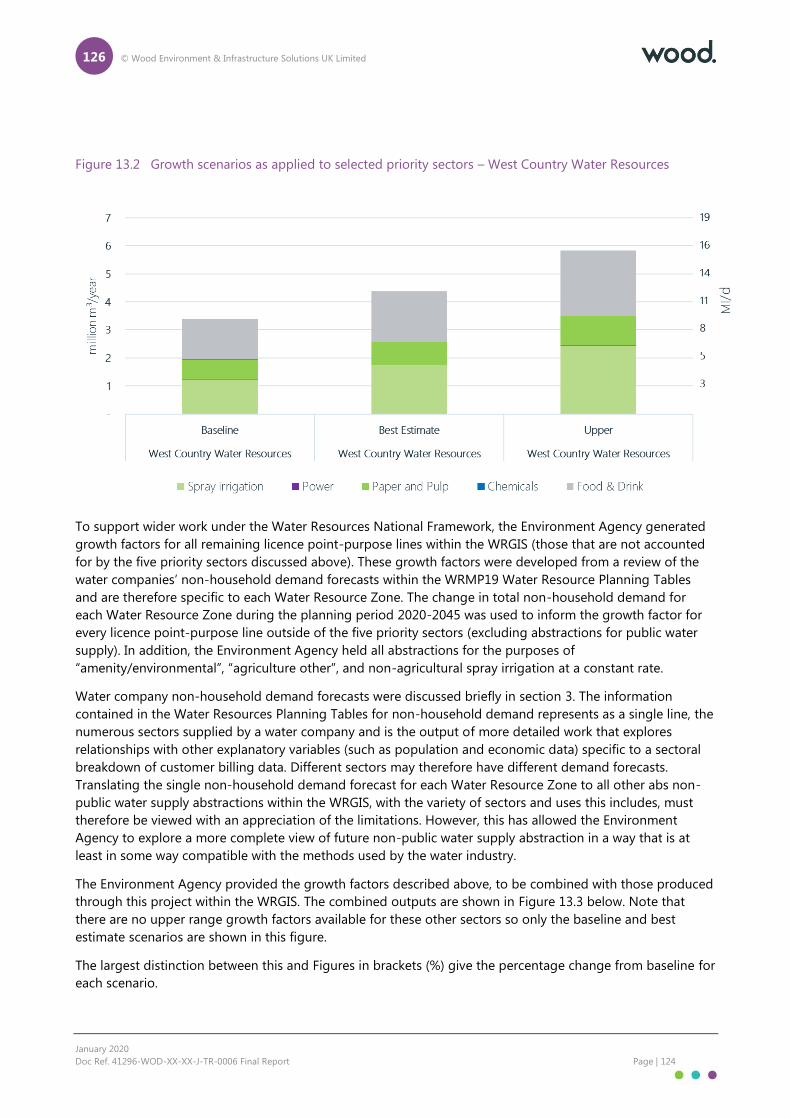
126 © Wood Environment & Infrastructure Solutions UK Limited
January 2020
Doc Ref. 41296-WOD-XX-XX-J-TR-0006 Final Report Page | 124
Figure 13.2 Growth scenarios as applied to selected priority sectors – West Country Water Resources
To support wider work under the Water Resources National Framework, the Environment Agency generated
growth factors for all remaining licence point-purpose lines within the WRGIS (those that are not accounted
for by the five priority sectors discussed above). These growth factors were developed from a review of the
water companies’ non-household demand forecasts within the WRMP19 Water Resource Planning Tables
and are therefore specific to each Water Resource Zone. The change in total non-household demand for
each Water Resource Zone during the planning period 2020-2045 was used to inform the growth factor for
every licence point-purpose line outside of the five priority sectors (excluding abstractions for public water
supply). In addition, the Environment Agency held all abstractions for the purposes of
“amenity/environmental”, “agriculture other”, and non-agricultural spray irrigation at a constant rate.
Water company non-household demand forecasts were discussed briefly in section 3. The information
contained in the Water Resources Planning Tables for non-household demand represents as a single line, the
numerous sectors supplied by a water company and is the output of more detailed work that explores
relationships with other explanatory variables (such as population and economic data) specific to a sectoral
breakdown of customer billing data. Different sectors may therefore have different demand forecasts.
Translating the single non-household demand forecast for each Water Resource Zone to all other abs non-
public water supply abstractions within the WRGIS, with the variety of sectors and uses this includes, must
therefore be viewed with an appreciation of the limitations. However, this has allowed the Environment
Agency to explore a more complete view of future non-public water supply abstraction in a way that is at
least in some way compatible with the methods used by the water industry.
The Environment Agency provided the growth factors described above, to be combined with those produced
through this project within the WRGIS. The combined outputs are shown in Figure 13.3 below. Note that
there are no upper range growth factors available for these other sectors so only the baseline and best
estimate scenarios are shown in this figure.
The largest distinction between this and Figures in brackets (%) give the percentage change from baseline for
each scenario.

126 © Wood Environment & Infrastructure Solutions UK Limited
January 2020
Doc Ref. 41296-WOD-XX-XX-J-TR-0006 Final Report Page | 125
Figure 13.1 is in the West Country Water Resources region, where there is a dominance of other sectors. As
discussed in section 3, methods applied by water company in their non-household demand forecasts tend to
show a much more muted growth than methods such as those applied through this project. Therefore,
change in demand shown in Figures in brackets (%) give the percentage change from baseline for each
scenario.
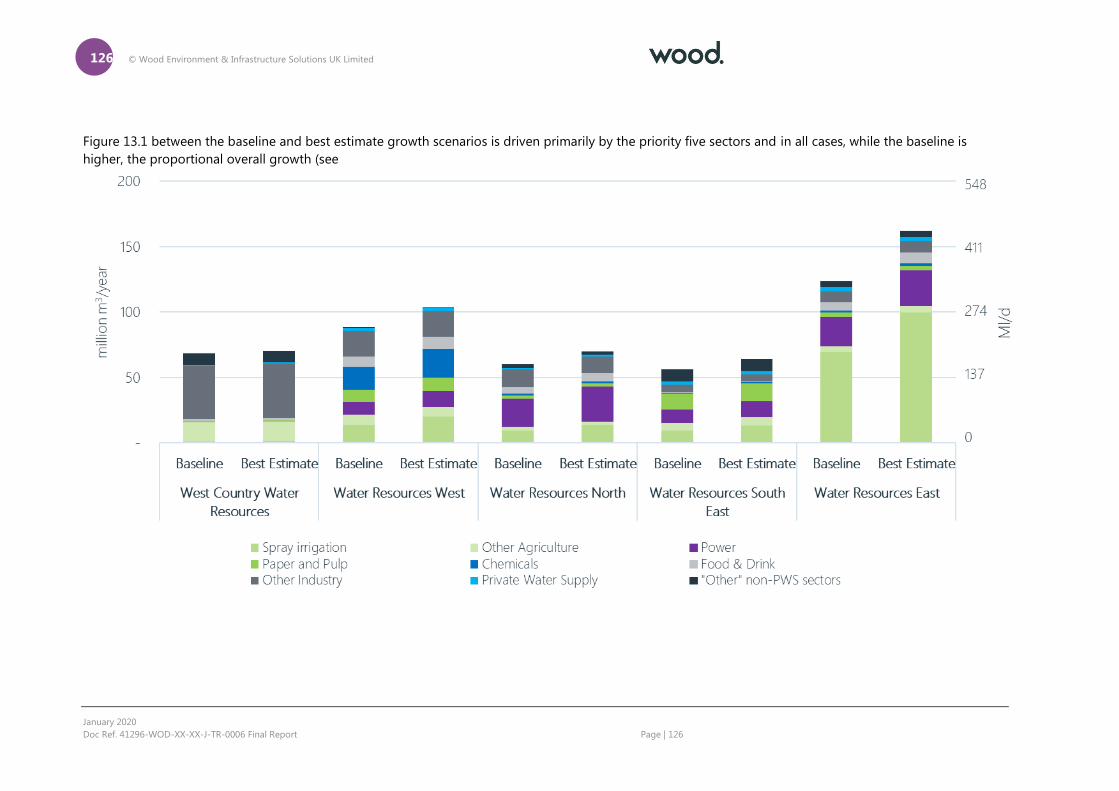
126 © Wood Environment & Infrastructure Solutions UK Limited
January 2020
Doc Ref. 41296-WOD-XX-XX-J-TR-0006 Final Report Page | 126
Figure 13.1 between the baseline and best estimate growth scenarios is driven primarily by the priority five sectors and in all cases, while the baseline is
higher, the proportional overall growth (see

126 © Wood Environment & Infrastructure Solutions UK Limited
January 2020
Doc Ref. 41296-WOD-XX-XX-J-TR-0006 Final Report Page | 127
Table 13.2 below) is lower that presented in Table 13.3 for the priority sectors alone.
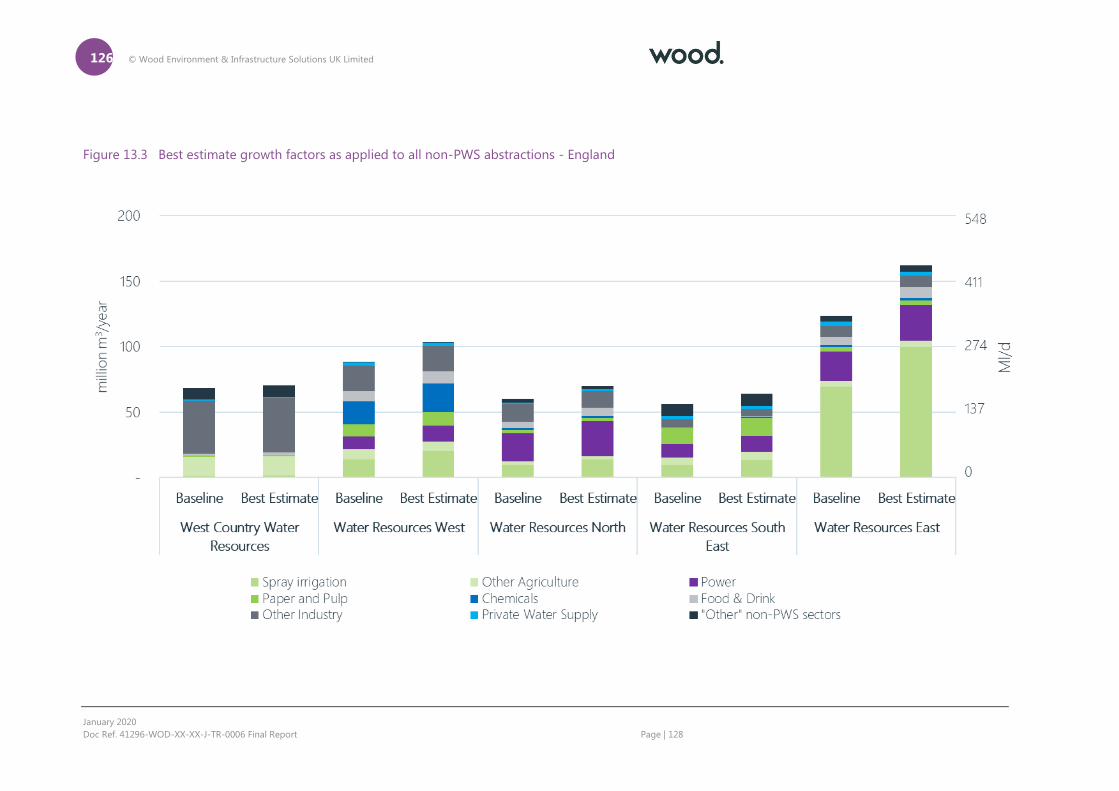
126 © Wood Environment & Infrastructure Solutions UK Limited
January 2020
Doc Ref. 41296-WOD-XX-XX-J-TR-0006 Final Report Page | 128
Figure 13.3 Best estimate growth factors as applied to all non-PWS abstractions - England
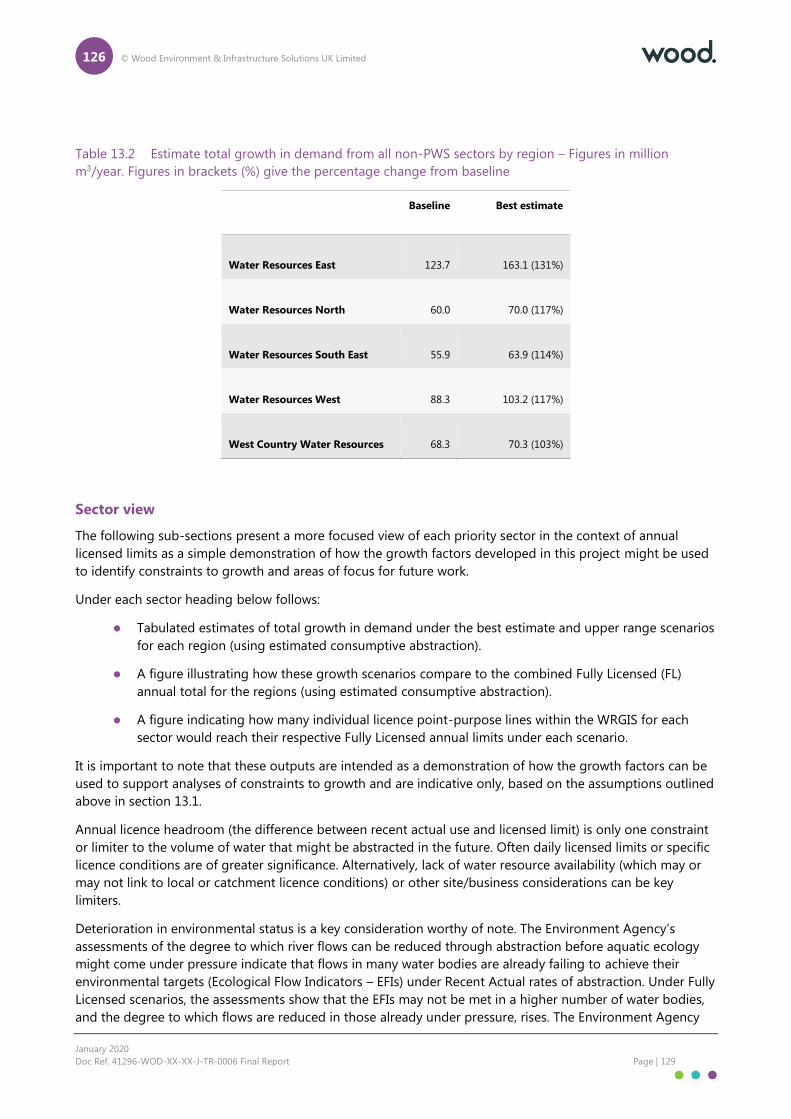
126 © Wood Environment & Infrastructure Solutions UK Limited
January 2020
Doc Ref. 41296-WOD-XX-XX-J-TR-0006 Final Report Page | 129
Table 13.2 Estimate total growth in demand from all non-PWS sectors by region – Figures in million
m3/year. Figures in brackets (%) give the percentage change from baseline
Baseline Best estimate
Water Resources East 123.7 163.1 (131%)
Water Resources North 60.0 70.0 (117%)
Water Resources South East 55.9 63.9 (114%)
Water Resources West 88.3 103.2 (117%)
West Country Water Resources 68.3 70.3 (103%)
Sector view
The following sub-sections present a more focused view of each priority sector in the context of annual
licensed limits as a simple demonstration of how the growth factors developed in this project might be used
to identify constraints to growth and areas of focus for future work.
Under each sector heading below follows:
Tabulated estimates of total growth in demand under the best estimate and upper range scenarios
for each region (using estimated consumptive abstraction).
A figure illustrating how these growth scenarios compare to the combined Fully Licensed (FL)
annual total for the regions (using estimated consumptive abstraction).
A figure indicating how many individual licence point-purpose lines within the WRGIS for each
sector would reach their respective Fully Licensed annual limits under each scenario.
It is important to note that these outputs are intended as a demonstration of how the growth factors can be
used to support analyses of constraints to growth and are indicative only, based on the assumptions outlined
above in section 13.1.
Annual licence headroom (the difference between recent actual use and licensed limit) is only one constraint
or limiter to the volume of water that might be abstracted in the future. Often daily licensed limits or specific
licence conditions are of greater significance. Alternatively, lack of water resource availability (which may or
may not link to local or catchment licence conditions) or other site/business considerations can be key
limiters.
Deterioration in environmental status is a key consideration worthy of note. The Environment Agency’s
assessments of the degree to which river flows can be reduced through abstraction before aquatic ecology
might come under pressure indicate that flows in many water bodies are already failing to achieve their
environmental targets (Ecological Flow Indicators – EFIs) under Recent Actual rates of abstraction. Under Fully
Licensed scenarios, the assessments show that the EFIs may not be met in a higher number of water bodies,
and the degree to which flows are reduced in those already under pressure, rises. The Environment Agency
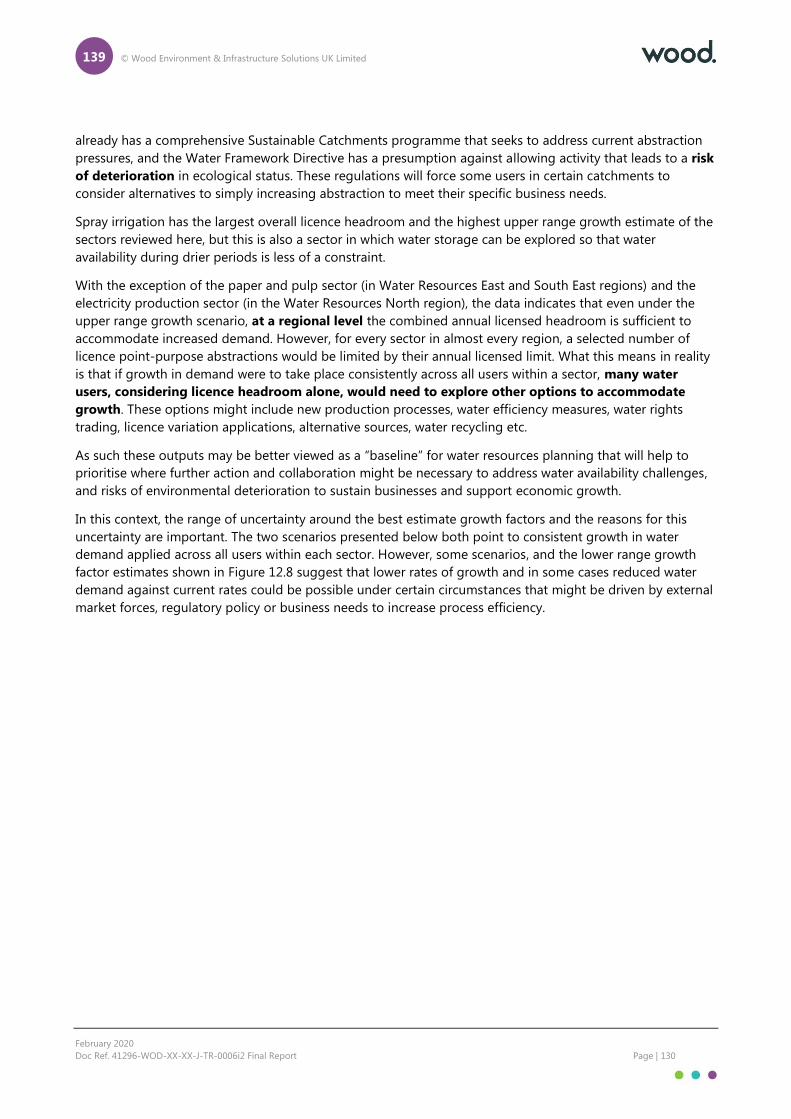
139 © Wood Environment & Infrastructure Solutions UK Limited
February 2020
Doc Ref. 41296-WOD-XX-XX-J-TR-0006i2 Final Report Page | 130
already has a comprehensive Sustainable Catchments programme that seeks to address current abstraction
pressures, and the Water Framework Directive has a presumption against allowing activity that leads to a risk
of deterioration in ecological status. These regulations will force some users in certain catchments to
consider alternatives to simply increasing abstraction to meet their specific business needs.
Spray irrigation has the largest overall licence headroom and the highest upper range growth estimate of the
sectors reviewed here, but this is also a sector in which water storage can be explored so that water
availability during drier periods is less of a constraint.
With the exception of the paper and pulp sector (in Water Resources East and South East regions) and the
electricity production sector (in the Water Resources North region), the data indicates that even under the
upper range growth scenario, at a regional level the combined annual licensed headroom is sufficient to
accommodate increased demand. However, for every sector in almost every region, a selected number of
licence point-purpose abstractions would be limited by their annual licensed limit. What this means in reality
is that if growth in demand were to take place consistently across all users within a sector, many water
users, considering licence headroom alone, would need to explore other options to accommodate
growth. These options might include new production processes, water efficiency measures, water rights
trading, licence variation applications, alternative sources, water recycling etc.
As such these outputs may be better viewed as a “baseline” for water resources planning that will help to
prioritise where further action and collaboration might be necessary to address water availability challenges,
and risks of environmental deterioration to sustain businesses and support economic growth.
In this context, the range of uncertainty around the best estimate growth factors and the reasons for this
uncertainty are important. The two scenarios presented below both point to consistent growth in water
demand applied across all users within each sector. However, some scenarios, and the lower range growth
factor estimates shown in Figure 12.8 suggest that lower rates of growth and in some cases reduced water
demand against current rates could be possible under certain circumstances that might be driven by external
market forces, regulatory policy or business needs to increase process efficiency.
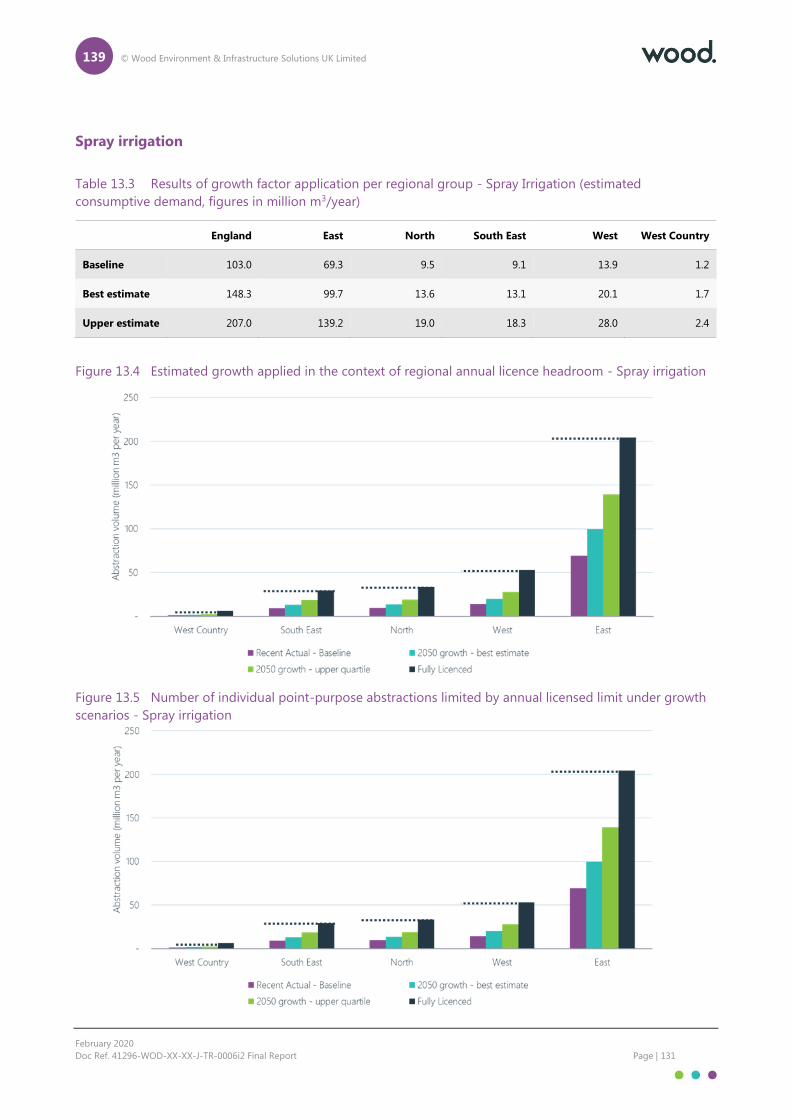
139 © Wood Environment & Infrastructure Solutions UK Limited
February 2020
Doc Ref. 41296-WOD-XX-XX-J-TR-0006i2 Final Report Page | 131
Spray irrigation
Table 13.3 Results of growth factor application per regional group - Spray Irrigation (estimated
consumptive demand, figures in million m3/year)
England East North South East West West Country
Baseline 103.0 69.3 9.5 9.1 13.9 1.2
Best estimate 148.3 99.7 13.6 13.1 20.1 1.7
Upper estimate 207.0 139.2 19.0 18.3 28.0 2.4
Figure 13.4 Estimated growth applied in the context of regional annual licence headroom - Spray irrigation
Figure 13.5 Number of individual point-purpose abstractions limited by annual licensed limit under growth
scenarios - Spray irrigation
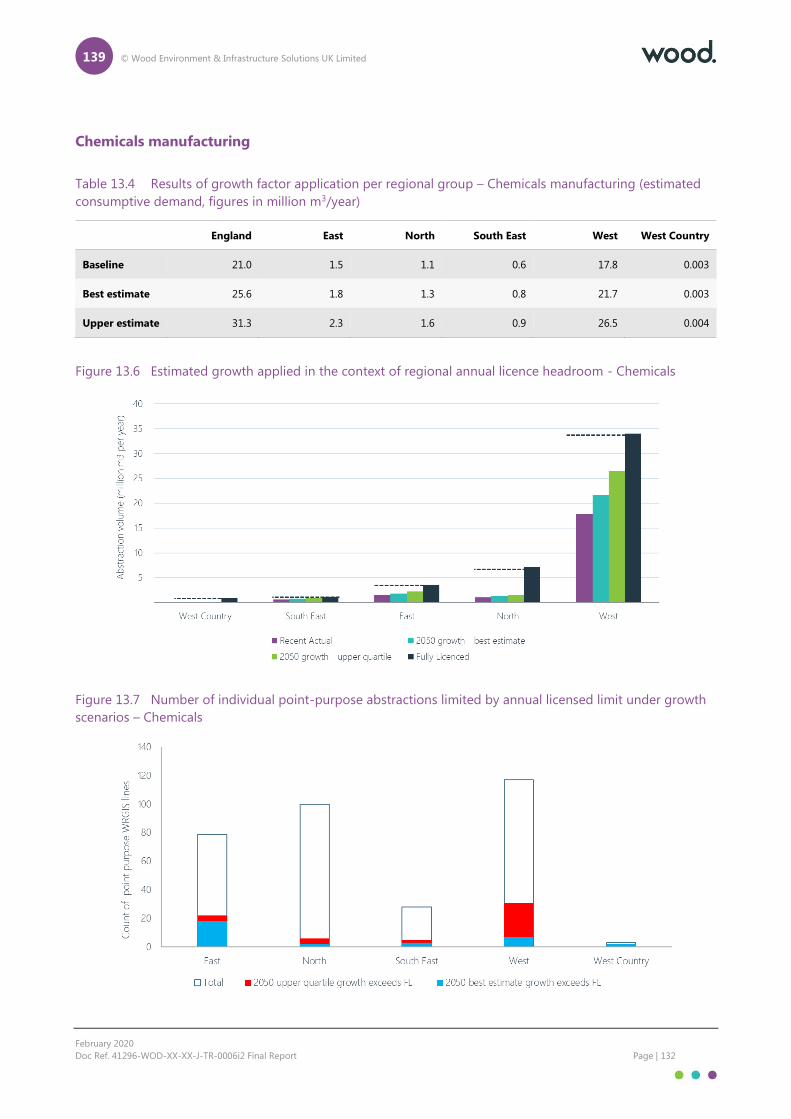
139 © Wood Environment & Infrastructure Solutions UK Limited
February 2020
Doc Ref. 41296-WOD-XX-XX-J-TR-0006i2 Final Report Page | 132
Chemicals manufacturing
Table 13.4 Results of growth factor application per regional group – Chemicals manufacturing (estimated
consumptive demand, figures in million m3/year)
England East North South East West West Country
Baseline 21.0 1.5 1.1 0.6 17.8 0.003
Best estimate 25.6 1.8 1.3 0.8 21.7 0.003
Upper estimate 31.3 2.3 1.6 0.9 26.5 0.004
Figure 13.6 Estimated growth applied in the context of regional annual licence headroom - Chemicals
Figure 13.7 Number of individual point-purpose abstractions limited by annual licensed limit under growth
scenarios – Chemicals
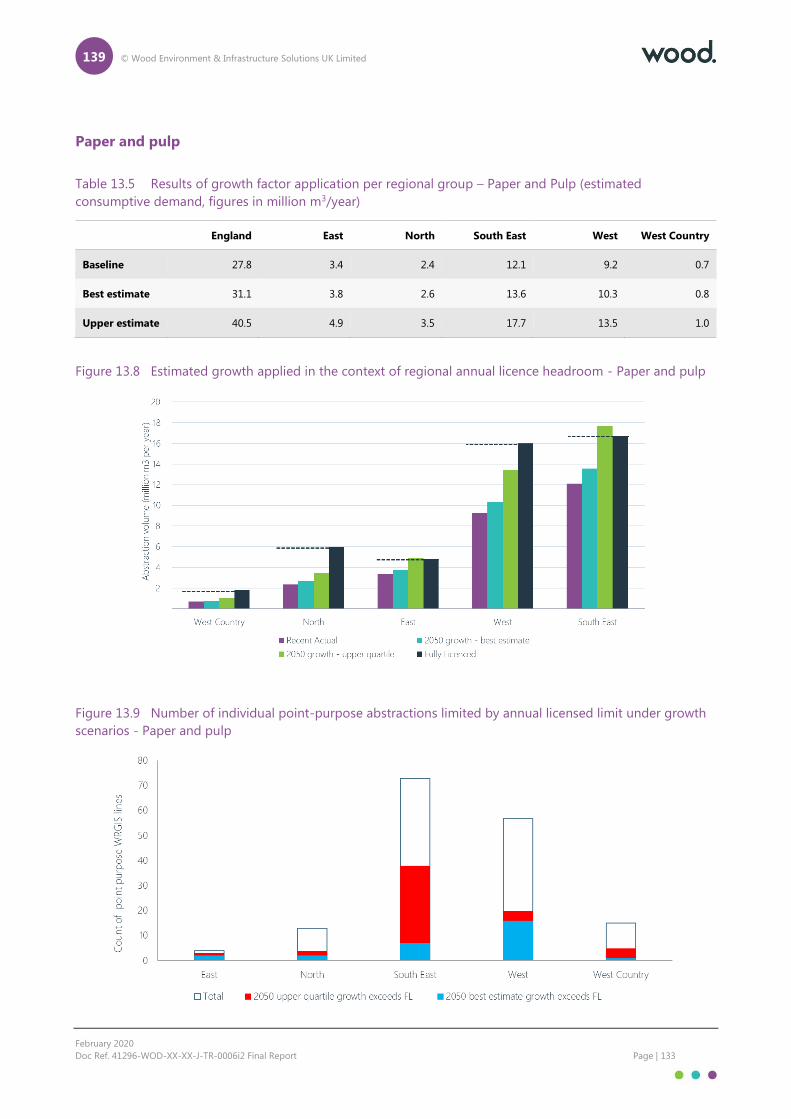
139 © Wood Environment & Infrastructure Solutions UK Limited
February 2020
Doc Ref. 41296-WOD-XX-XX-J-TR-0006i2 Final Report Page | 133
Paper and pulp
Table 13.5 Results of growth factor application per regional group – Paper and Pulp (estimated
consumptive demand, figures in million m3/year)
England East North South East West West Country
Baseline 27.8 3.4 2.4 12.1 9.2 0.7
Best estimate 31.1 3.8 2.6 13.6 10.3 0.8
Upper estimate 40.5 4.9 3.5 17.7 13.5 1.0
Figure 13.8 Estimated growth applied in the context of regional annual licence headroom - Paper and pulp
Figure 13.9 Number of individual point-purpose abstractions limited by annual licensed limit under growth
scenarios - Paper and pulp
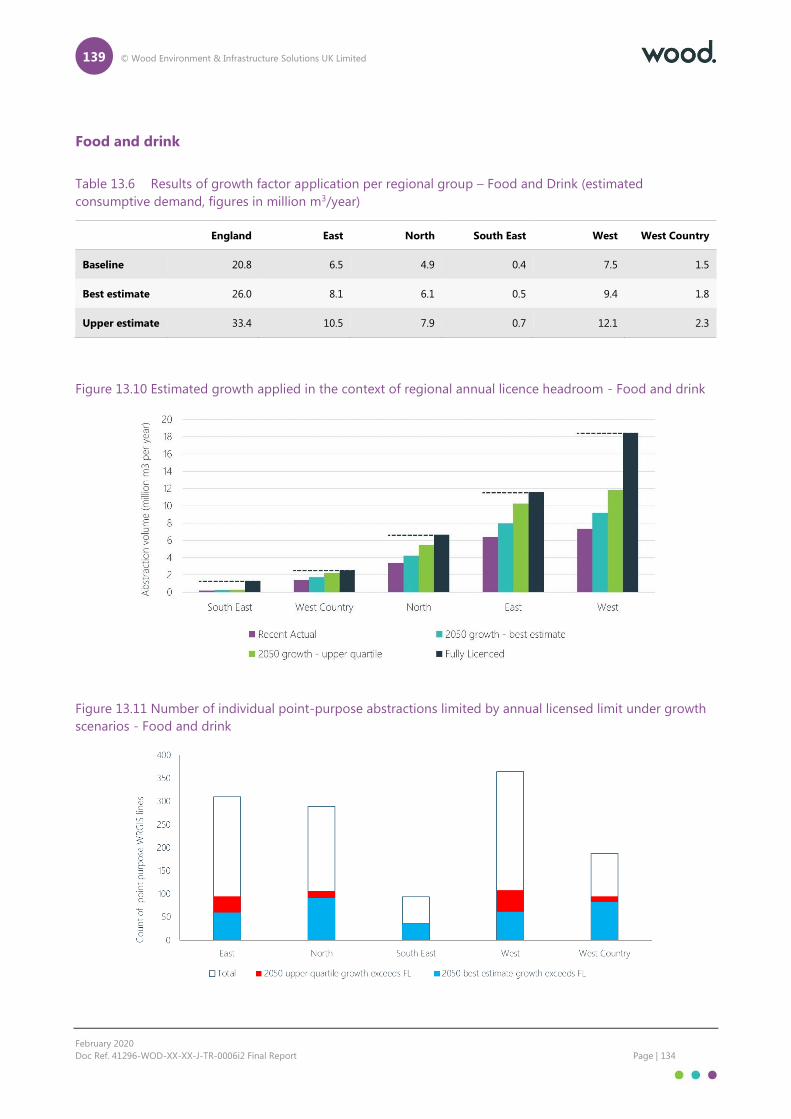
139 © Wood Environment & Infrastructure Solutions UK Limited
February 2020
Doc Ref. 41296-WOD-XX-XX-J-TR-0006i2 Final Report Page | 134
Food and drink
Table 13.6 Results of growth factor application per regional group – Food and Drink (estimated
consumptive demand, figures in million m3/year)
England East North South East West West Country
Baseline 20.8 6.5 4.9 0.4 7.5 1.5
Best estimate 26.0 8.1 6.1 0.5 9.4 1.8
Upper estimate 33.4 10.5 7.9 0.7 12.1 2.3
Figure 13.10 Estimated growth applied in the context of regional annual licence headroom - Food and drink
Figure 13.11 Number of individual point-purpose abstractions limited by annual licensed limit under growth
scenarios - Food and drink
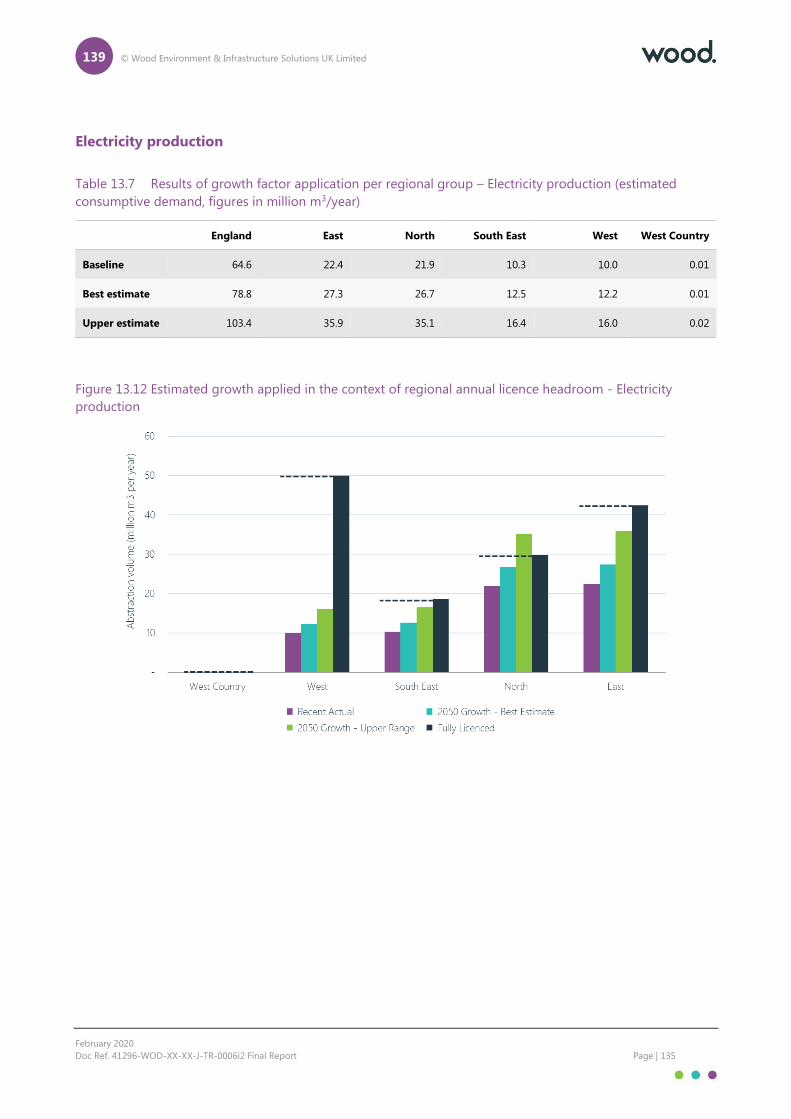
139 © Wood Environment & Infrastructure Solutions UK Limited
February 2020
Doc Ref. 41296-WOD-XX-XX-J-TR-0006i2 Final Report Page | 135
Electricity production
Table 13.7 Results of growth factor application per regional group – Electricity production (estimated
consumptive demand, figures in million m3/year)
England East North South East West West Country
Baseline 64.6 22.4 21.9 10.3 10.0 0.01
Best estimate 78.8 27.3 26.7 12.5 12.2 0.01
Upper estimate 103.4 35.9 35.1 16.4 16.0 0.02
Figure 13.12 Estimated growth applied in the context of regional annual licence headroom - Electricity
production
139 © Wood Environment & Infrastructure Solutions UK Limited
February 2020
Doc Ref. 41296-WOD-XX-XX-J-TR-0006i2 Final Report Page | 136
14. Concluding remarks and recommendations
This project has sought to compile information from a wide range of sources that leads to an improved
understanding of abstraction outside of the water industry in England currently and in the future, looking
ahead to 2050. Significant efforts have gone into drawing together available evidence and data that can now
be used to articulate the factors affecting water demand and the pressures that might cause an increase or
decrease in that demand in a number of sectors prioritised early in the project.
This evidence has been used here to develop a high-level sector view of the quantified scale of change in
water demand under a range of future scenarios, and importantly in the context of water resources planning,
developed a horizon of uncertainty around a “best estimate”. An appreciation of this uncertainty and the
range of outcomes possible is critical.
The application of the growth factors developed as part of this project has been demonstrated here, focusing
on scenarios in which increased water demand is believed to be more likely. However, as noted in section 13
these scenarios do not deal explicitly with the range of possible constraints to growth in water abstraction. It
is therefore suggested that these scenarios may be better viewed as a “baseline” forecast for water resources
planning that will help to prioritise where further action and collaboration might be necessary to address
constraints and perhaps in reality deliver a less significant increase in direct abstraction, or in some cases a
reduction in abstraction at different spatial and temporal scales.
It is worthy of note that abstraction data collected annually by the Environment Agency suggests that,
abstraction has generally reduced or remained relatively flat over recent years (with annual variability as
expected). This raises the question: “How confident can we be that trends might shift or reverse, or be
overtaken by other external factors that have as yet, not been significant?” These epistemic uncertainties -
around climate change impacts and responses, changing dietary trends, Brexit, shifting markets and global
trends to name just a few clearly build the case for retaining a view of a range of possible future outcomes
for water demand rather than focusing on a single growth factor.
This work, feeding into the developing Water Resources National Framework, should support collaboration
between the water industry and other sectors and provide initial insights into areas on which to focus. There
will be a challenge in the distinction between those sectors characterised by a large number of relatively
small abstractors where changes in overall demand at a catchment or regional level might take place in a
more diffuse way and be slow to develop, versus those sectors characterised by a small number of very large
users, in which the decisions of single users can generate a step-change in catchment demands very quickly.
Representatives from industries engaged through this project have stressed that in many cases, their sector’s
ability to expand or increase outputs, and willingness to invest will depend on the availability and security of
water resources. They have indicated that they wish to be involved, to ensure their needs are considered, and
to positively support the development of regional multi-sectoral planning
Regional water company groups may wish to develop the outputs of this project further, and in ways that
suit their diverse needs in order to integrate non-public water supply needs into their developing plans.
Gaps in knowledge and potential for further work
Key gaps in information that limited this project’s ability to further develop a better understanding of the
trajectory of future water demand were found in two of the sectors prioritised – Livestock and Covered
cropping – both of which are important parts of the country’s economy and significant water users in many
catchments contending with challenges of water availability. In addition, both sectors are understood to meet
their water demand via a variable mixture of direct abstraction and mains supply.
139 © Wood Environment & Infrastructure Solutions UK Limited
February 2020
Doc Ref. 41296-WOD-XX-XX-J-TR-0006i2 Final Report Page | 137
The work of this project has been based on a set of data that has allowed a high-level view of sectoral
demand – the WRGIS. The limitations of this data are understood and in particular, data used here to inform
the baseline of existing water demand (Recent Actual abstraction). There may be benefits of using other data
sources (annual returns or calculated theoretical irrigation demands for example) in subsequent work, but it
is important to recognise that the WRGIS remains a key Environment Agency tool for water resources
planning and screening of investigations and it is appropriate that it has been used here.
A number of other gaps and areas of uncertainty that should be considered in future work are noted below:
Consumptive (net) demand versus total (gross) demand:
This project focused on estimated consumptive demand to outline the relative sectoral breakdown of water
use in England as a way of avoiding unrealistic skew in the datasets and in an effort to direct further
investigation towards abstractors that have a localised net impact on the water balance. In practice, sufficient
water must be available at the point of abstraction to meet total water needs, irrespective of what might be
returned locally or elsewhere to the environment. Future work will need to consider this important
distinction, particularly where users or sectors’ water needs are met through a mixture of direct abstraction
with associated local discharges, and mains supply.
Ground-truthing:
Data handling assumptions and sectoral generalisations with regards to baseline and future abstraction will
need to be checked for validity when using data at a smaller scale. For example, there is a risk that some
sectors may have been incorrectly categorised as higher or lower water users in the baseline analysis of this
project, using Recent Actual abstraction figures (typically the period 2010-15). It is possible that this period
represented one of uncharacteristically low or high production or output.
Climate change:
Climate change is a key driver of future water resource availability and water demand. The impacts of climate
change on water demand was implicitly considered within the derivation of the growth factors for each sub-
sector. Further work to update growth factors could consider climate change impacts explicitly by deriving
factors under baseline conditions and scaled based on a range of RCP scenarios, for example RCP2.6 versus
RCP8.5. The impacts of climate change could also be explored in further detail at a ‘catchment level’. The
national set of UK climate change projections, UKCP18, could be used to investigate the impact on water
demand, and hence abstraction. This change in demand could then be compared to the associated change
in water availability under the same climate scenario to understand the influence on the supply-demand
balance. A catchment where spray irrigation is a significant abstractor would be a good example for this.
The catchment-based demand analysis could also be used to refine the sector growth factors.
Shifting abstraction patterns:
This project has not dealt explicitly with the effects of emerging uses of water that may generate an
additional need for direct abstraction or new mains supply. Nor have quantified estimates of the scale of
change incorporated the potential for land use changes and associated geographical shift in water demand
(for example geographical shifts in agricultural production resulting from climate change).
Critical periods:
Due to the broad nature of this project, data analyses have focused on the annual scale. Some industries use
water at a consistent rate year-round (e.g. paper production) while others vary considerably (e.g. the golf
139 © Wood Environment & Infrastructure Solutions UK Limited
February 2020
Doc Ref. 41296-WOD-XX-XX-J-TR-0006i2 Final Report Page | 138
sector for which water availability issues in 2018 brought water management into sharp focus). When
considering more specific water resources planning challenges at the regional or local scale, seasonal
variation and peak periods of demand will be important.
New authorisations and de-regulated abstractions:
Linked to points above, it is important to recognise that the WRGIS typically holds information on existing
licensed abstractions only. There are many legal, unlicensed users of water across England that are not
captured or fully accounted for in the datasets used in this project. These include de-regulated abstractions
(e.g. those abstracting less than 20m3/day) and uses that are still in the process of coming under licensing
control post-Water Act 2003 (New Authorisations). The Canal and Rivers Trust for example, has submitted
numerous applications under the New Authorisations programme in order to acquire licences for existing
operations. This work will lead to an improved characterisation of a greater number of abstractions.
Water company non-household demand forecasts:
Reconciling the differences between existing water company non-household demand forecasts and work
such as that presented in this project may be an important consideration for some regional groups and water
companies. In many cases, sectors receiving a mains supply are also reflected in the non-public supply
abstraction base. Understanding how the needs of these two groups can be determined and reflected in a
consistency way (if deemed necessary) may be significant as plans are developed.
Inclusion of additional sectors in the analysis:
This project recognised that water abstraction for mineral products production is significant. However, as
demand is from a very small number of abstractors, concentrated mostly in one region, it was agreed that
this sector should not a priority to focus on. Recognising the importance of this sector to support future
national infrastructure projects, further analysis of future water demand for this sector would be beneficial.
139 © Wood Environment & Infrastructure Solutions UK Limited
February 2020
Doc Ref. 41296-WOD-XX-XX-J-TR-0006i2 Final Report Page | 139
15. References
AHDB (2017). Brexit Scenarios: an impact assessment.
Atkins (2017) WRE Lot 1 Demand Final Report
BEIS (2015) Industrial Decarbonisation & Energy Efficiency Roadmaps to 2050 - Pulp and paper
Berkum, S. van, R.A. Jongeneel, H.C.J. Vrolijk, M.G.A. van Leeuwen and J.H. Jager, 2016. Implications of a UK
exit from the EU for British agriculture; Study for the National Farmers’ Union (NFU), Warwickshire, UK.
Wageningen, LEI Wageningen UR (University & Research centre), LEI Report 2016- 046. 52 pp.
Byers et al., (2015) Cooling water for Britain’s future electricity supply.
Byers, E.A, Hall, J.W., Amezaga, J.M (2014) Electricity generation and cooling water use: UK pathways to 2050.
Chemistry Council (2018). Sustainable innovation for a better world.
Collier, R., Knox, J., Hess, T.M. and Burgess, C. (2009) Identification and knowledge transfer of novel and
emerging technology with the potential to improve water use efficiency within English and Welsh agriculture.
Defra Project WU0123.
Collier, R., Knox, J., Hess, T.M. and Burgess, C. (2009) Identification and knowledge transfer of novel and
emerging technology with the potential to improve water use efficiency within English and Welsh agriculture.
Defra Project WU0123.
CPI (2018a) The economic value of the UK paper-based industries
CPI (2018b) Paper: the sustainable, renewable and recyclable choice
D, Stringer. (CPI) (2019), pers. comm. 17 April 2019.
Daccache A., Keay C., Jones R.J.A., Weatherhead E.K., Stalham M.A., Knox J.W. (2012) Climate change and land
suitability for potato production in England and Wales: Impacts and adaptation. The Journal of Agricultural
Science, 150:161 – 177.
Defra (2007) Food Industry Sustainability Strategy
Defra (2011) Water Usage in Agriculture and Horticulture Results from the Farm Business Survey 2009/10 and
the Irrigation Survey 2010.
Defra (2012) Project WR1210 - How can paper be made more sustainable? A desk-based review
Defra (2016). The Eatwell Guide. https://www.gov.uk/government/publications/the-eatwell-guide
Defra (2017) Water usage on farms. Results from the Farm Business Survey, England 2015/16, 31 January
2017. 46 pp. https://www.gov.uk/government/statistics/water-usage-on-farms-results-from-the-farm-
business-survey-england
Defra (2019). Water abstraction plan: Environment. Via: https://www.gov.uk/government/publications/water-
abstraction-plan-2017/water-abstraction-plan-environment
D-Risk. A planning tool to manage your irrigation abstraction and drought risks. www.d-risk.eu
EC (European Commission) (2019). Codex Committee on Food Hygiene. Via:
139 © Wood Environment & Infrastructure Solutions UK Limited
February 2020
Doc Ref. 41296-WOD-XX-XX-J-TR-0006i2 Final Report Page | 140
EEA (2001). Directive 2001/80/EC, large combustion plants. Via: https://www.eea.europa.eu/policy-
documents/directive-2001-80-ec-large (accessed 06/06/19)
EEF (2018) Sector Bulletin: Food and Drink
EEF (2017) Sector Bulletin: Chemicals sector
El Chami D., Knox J.W., Daccache A., Weatherhead E.K. (2015) The economics of irrigating wheat in a humid
climate - A study in the East of England. Agricultural Systems, 133: 97-108.
Environment Agency (Ricardo AAEA) (2013a) Food and drink demand projections to 2050
Environment Agency (2013b) Building electricity generation scenarios to identify water demand impacts
Environment Agency (2018) The future of petrochemicals; Towards more sustainable plastics and fertilizers
FAO (2018). Water use of livestock production systems and supply chains – Guidelines for assessment (Draft
for public review). Livestock Environmental Assessment and Performance (LEAP) Partnership. FAO, Rome,
Italy.
Gadanakis, Y., Bennett, R., Park, J. and Jose Areal, F. (2015) Improving productivity and water use efficiency: A
case study of farms in England. Agricultural Water Management, 160: 22-32.
Gasparino (2012) Independent development of water use in scenarios for future thermal power stations
Gill, T., Bonsall, E., Henman, P. Woolgar, C. Francis, P. (2012) The use of water for cleaning livestock units,
abattoirs and meat processing plants. Defra project WU0136.
Grafton, R. Q., et al., (2018). The paradox of irrigation efficiency. Science 361.6404: 748-750.
Haro-Monteagudo, D., Knox, J.W., and Holman, I.P. (2019) D-Risk: a decision-support webtool for improving
drought risk management in irrigated agriculture. Computers and Electronics in Agriculture 162: 855–858.
https://doi.org/10.1016/j.compag.2019.05.029
Hess, T.M. and Knox, J.W. (2013) Water savings in irrigated agriculture – a framework for assessing
technology and management options to reduce water losses. Outlook on Agriculture 42(2): 85–91.
Hess, T.M. and Sutcliffe, C. (2018) The exposure of a fresh fruit and vegetable supply chain to global water-
related risks. Water International, 43(6): 746-761.
Hess, T.M., Andersson, U., Mena, C. and Williams, A. (2015) The impact of healthier dietary scenarios on the
global blue water scarcity footprint of food consumption in the UK. Food Policy, 50: 1-10.
Hess, T.M., Chatterton, J., Daccache, A. and Williams, A. (2016) The impact of changing food choices on the
blue water scarcity footprint and greenhouse gas emissions of the British diet: The example of potato, pasta
and rice. Journal of Cleaner Production, 112(5) 4558-4568.
King, J. and Weatherhead, E.K. (2006) A study to identify baseline data on water use in agriculture. Defra
Project WU0102.
Knox, J., Daccache, A., Weatherhead, K., Groves, S. and Hulin, A., (2013). Assessment of the impacts of climate
change and changes in land use on future water requirement and availability for farming, and opportunities
for adaptation. Final Report Defra (FFG1129), Cranfield University.
Knox, J.W. and Hess, T.M. (2018) Advances in irrigation management and technology in potato cultivation:
experiences from a humid climate. In: Wale, S. (ed.) Achieving sustainable cultivation of potatoes Volume 2 -
139 © Wood Environment & Infrastructure Solutions UK Limited
February 2020
Doc Ref. 41296-WOD-XX-XX-J-TR-0006i2 Final Report Page | 141
Production and storage, production and sustainability. Burleigh Dodds Series in Agricultural Science. ISBN:
978-1-78676-128-6.doi/10.19103/AS.2017.0031.05
Knox, J.W., Haro-Monteagudo, D., Hess, T.M., Morris, J. (2018a) Forecasting Changes in Agricultural Irrigation
Demand to Support a Regional Integrated Water Resources Management Strategy. In Friesen J and Sinobas-
Rodriguez L (ed) Advanced Tools for Integrated Water Resources Management, Advances in Chemical
Pollution, Environmental Management and Protection, Vol. 3. ISBN: 9780128142998.
Knox, J.W., Rickson, R.J., Weatherhead, E.K., Hess, T.M., Deeks, L.K.,Truckell,I.J., Keay, C.A., Brewer T.R. and
Daccache, A. (2015) Research to develop the evidence base on soil erosion and water use in agriculture.
Cranfield University for the Adaptation Sub-Committee.
Menke (2018). The worldwide paper industry via https://globaledge.msu.edu/blog/post/55571/the-
worldwide-paper-industry. Accessed 19/09/2019
Monaghan, J.M., Daccache, A., Vickers, L., Hess, T.M., Weatherhead, E.K., Grove, I.G., and Knox, J.W. (2013).
More ‘crop per drop’ – constraints and opportunities for precision irrigation in European agriculture. Journal
of the Science of Food and Agriculture 93(5):977-80
Murrant D., Quinn A., Chapman L.2015 The water-energy nexus: Future water resource availability and its
implications on UK thermal power generation. Water and Environment Journal.
National Grid (2019) Future Energy Scenarios
National Grid (2018) Future Energy Scenarios
Office for National Statistics (ONS) (2018). UK Business: activity, size and Location -2018
https://www.ons.gov.uk/businessindustryandtrade/business/activitysizeandlocation/datasets/ukbusinessactivi
tysizeandlocation. Accessed 06/06/2019.
ONS (Office for National Statistics) (2016) Living costs and food survey
PITA (2018) PITA annual review 2016-2017
Rey D., Holman I.P., Daccache A., Morris J., Weatherhead E.K., Knox J.W. (2016) Modelling and mapping the
economic value of supplemental irrigation in a humid climate. Agricultural Water Management, 173: 13-22.
Thompson, A.J., King, J.A., Smith, K.A. and Tiffin, D.H. (2007) Opportunities for Reducing Water use in
Agriculture. Defra Project WU0101.
UK Government’s Chemical Sector analysis report (2017)
UKMO (2019) UKCP18 Science Overview Executive Summary.
https://www.metoffice.gov.uk/binaries/content/assets/metofficegovuk/pdf/research/ukcp/ukcp18-overview-
summary.pdf
Watts, G. et al. (2015) Climate change and water in the UK – past changes and future prospects. Progress in
Physical Geography, 39(1) 6–28. doi: 10.1177/0309133314542957
WRAP (2011) Freshwater use in the UK: manufacturing sector
WRAP (2013) water use in the UK food industry
WRAP (2019) Food surplus and waste in the UK – key facts. http://www.wrap.org.uk/content/food-surplus-
and-waste-uk-key-facts-nov18

139 © Wood Environment & Infrastructure Solutions UK Limited
February 2020
Doc Ref. 41296-WOD-XX-XX-J-TR-0006i2 Final Report Page | 142
16. Appendices
Appendix A - WRGIS, NALD code grouping and data assumptions
Appendix B – Growth factor development data summaries
Appendix C – Rapid Evidence Assessment method
Appendix D – Evidence register