Embed Size (px)
Citation preview

1
Abstract-- Preventive diagnosis and maintenance of
transformers has become more and more useful in recent times in order to improve the reliability of electric power systems. Time domain dielectric testing techniques such as Return Voltage (RV) measurement and Polarisation-Depolarisation Current (PDC) measurement have recently been widely used as potential tools for condition assessment of transformer insulation. In the frequency domain, measurement of the dissipation factor (tan )over a frequency range of 0.1 mHz to 1 kHz has been commonly used to assess the condition of transformer insulation. A number of transformers have been tested with these diagnostic techniques. A better understanding and analysis of the dielectric test results is only possible with a clear understanding of the physical behaviour of the insulation system in response to moisture and ageing. A circuit model, which describes the dielectric behaviour of the transformer’s main insulation system, has been modelled in this paper from the frequency domain measurement data and then RV and PDC data have been simulated from the circuit model. This paper then presents discussions of frequency and time domain techniques to find the condition of transformer insulation in terms of moisture and ageing estimation.
Index Terms-- Dielectric Response, Polarisation Depolarisation Current, Return Voltage, Dissipation Factor, Oil/paper Insulation, Ageing and Moisture Analysis, Transformer Condition Monitoring, Insulation Model Nomenclature
I. INTRODUCTION n oil/paper insulation system in a transformer is aged by the electrical, thermal and environmental stresses during
its operation. Among these, moisture and ageing by-products strongly degrade the dielectric properties of the oil/paper insulation system within a transformer. To assess the reliability of insulation accurately, it is very valuable to know the condition of the oil and the paper separately. In recent years, new methods to assess insulation systems have been extensively used. Among them, recovery voltage and polarisation/depolarisation current measurements in the time domain [1-2, 4-5, 8, 12] and dissipation factor measurements
T.K. Saha ([email protected]) and A Thomas ([email protected])
are with the School of ITEE, University of Queensland, Brisbane, QLD-4072, Australia and R. Middleton ([email protected]) is with the Hamilton Institute, National University of Ireland
at 50 Hz [3] or at variable frequency range [6-8] are examples of newer methods that have been used for the diagnosis of power transformer insulation condition. The commonly known measurement technique, Frequency Domain Spectroscopy (FDS), includes the measurement of dissipation factor (tan ) over a frequency range of 0.1 mHz to 1 kHz [6-8].
The interpretation of dielectric test methods require full and exact knowledge of the relationship between basic dielectric processes and the dielectric parameters measured. The simulation of the dielectric processes gives the possibility to explain some exact relationships that may help to correctly interpret the test results. An effort has been made in this paper to understand the dielectric response of oil/paper insulation as related to its fundamental structure and its behaviour to an external electric field. This paper reports the development of an RC equivalent circuit, based on the extended Debye model, which is based on the low frequency (0.1 mHz to 1 kHz) dielectric spectroscopy measurement conducted by the IDA200 equipment [8]. The model does not require taking into account the geometry of the transformer. Examples are provided in this paper to demonstrate the effectiveness of this tool to analyse results from field measurements on transformers. The model parameters have been identified using software written in Matlab. The time domain based diagnosis using polarisation/depolarisation currents and return voltages have been estimated from the identified model components by using the developed mathematical formulations.
Simulation results have also been supported with actual time domain field test results for one transformer using the Tettex 5461 recovery voltage meter [9] to illustrate any relationship between time and frequency domain diagnostic techniques. An expert system previously developed by the first author of this paper [16] was used to diagnose the state of insulation conditions.
II. THEORY OF POLARISATION BASED DIAGNOSIS
II.A Frequency Domain Dielectric Spectroscopy (FDS) [7, 8, 12]
This technique is an extension of capacitance and dissipation factor (tan ) measurements normally performed at
Understanding Frequency & Time Domain Polarisation Methods for the Insulation Condition
Assessment of Power Transformers T. K. Saha*, Senior Member IEEE, R. Middleton Fellow, IEEE ** and
A. Thomas*Member IEEE
A
978-1-4244-4241-6/09/$25.00 ©2009 IEEE
Authorized licensed use limited to: The Library NUI Maynooth. Downloaded on February 2, 2010 at 11:16 from IEEE Xplore. Restrictions apply.
2
power frequency. A sinusoidal signal is applied to the high voltage bushing and current is measured through the low voltage terminal.
If the applied voltage is an alternating signal at a frequency , then the measured capacitance is a complex quantity and
whose real and imaginary parts correspond directly to the real and imaginary components of the complex permittivity:
( ) '( ) ''( ) ( / ) '( ) ''( )C C jC A w j (1)
Where A is the plate area of the capacitance, is the permittivity and w is the distance between two plates. C’( ) corresponds to the ordinary capacitance, while the imaginary component C’’( ) represents the dielectric loss component. The tangent of the loss angle- (or dissipation factor) is given by equation (2).
''( )tan'( )
CC (2)
II.B Time Domain Polarisation Measurements [10, 15] If an insulation system with geometric capacitance C0
(measured capacitance at or near power frequency divided by r, the relative permittivity of the composite insulation
system), composite conductivity and dielectric response function f(t) is exposed to a step voltage of magnitude U0, the polarisation current through the insulation system can be derived as:
0 00
( ) ( )poli t C U f t (3)
Once the step voltage is removed and the insulation system is shorted to ground, the depolarisation current can be written as:
0 0 1( ) ( ) ( )depoli t C U f t f t t (4)
Fig. 1 Principle of polarisation/depolarisation current and RV measurement
Fig. 1 shows the nature of the polarisation current after
applying a DC voltage U0 and of the depolarisation current during the short circuit. At t=t2, ground (short circuit) is removed from the insulation and a voltmeter is connected across it. When a direct voltage is applied to a dielectric for a period of time, and is then short circuited for a period lower
than the charging time, after opening the short circuit, the charge bounded by the polarisation will randomly relax and result in a voltage build up between the electrodes of the dielectric. This phenomenon is called the return/recovery voltage. The test object is charged from 0 t t1, grounded from t1 t t2 and for t>t2 the recovery voltage is measured during the open circuit condition. The recovery voltage Ur is contained in the following equation.
0 0 0 1
02
( )( ) ( ) ( ) ( )
( ) ( )
rr r r
t
rt
dU ti t U t U f t f t t
dtd
f t U ddt
(5) For t2 < t < , and Ur (t=t2) = 0
II.C Modelling of Transformer Oil-Paper Insulation Using extended Debye Model from the Frequency Domain Dielectric
Spectroscopy measurements Over the last few years, several researchers [2, 4, 13, and
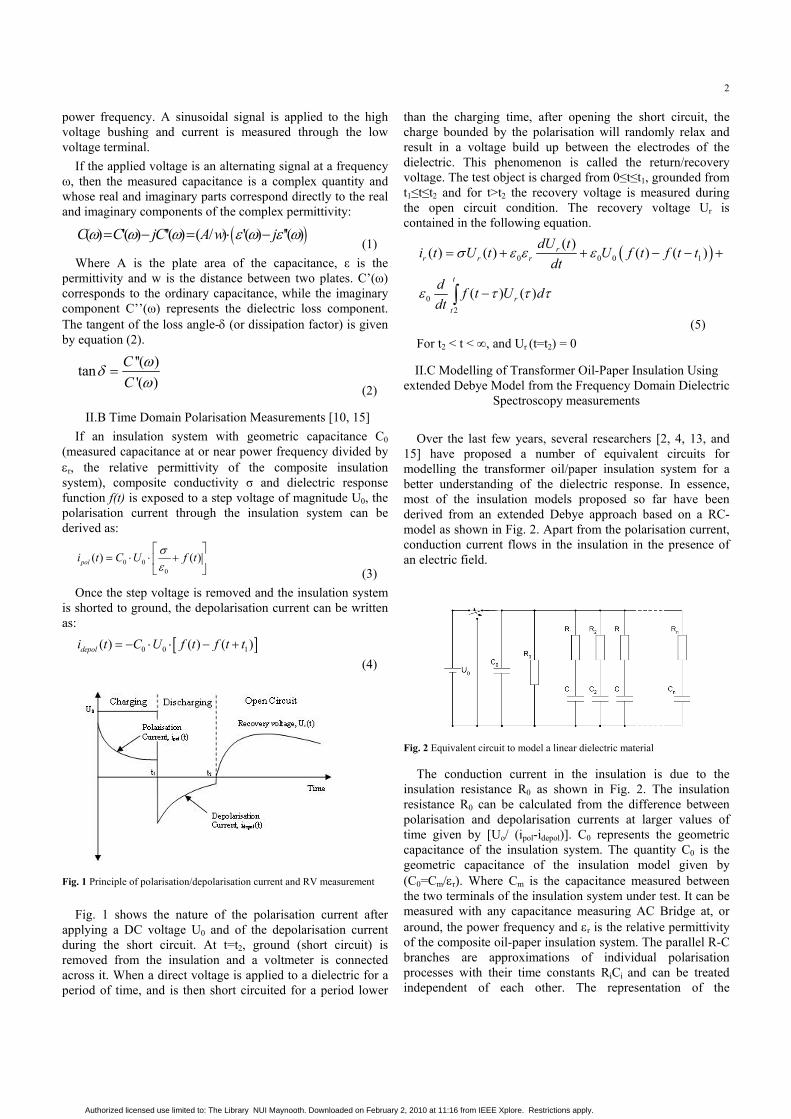
15] have proposed a number of equivalent circuits for modelling the transformer oil/paper insulation system for a better understanding of the dielectric response. In essence, most of the insulation models proposed so far have been derived from an extended Debye approach based on a RC-model as shown in Fig. 2. Apart from the polarisation current, conduction current flows in the insulation in the presence of an electric field.
Fig. 2 Equivalent circuit to model a linear dielectric material
The conduction current in the insulation is due to the insulation resistance R0 as shown in Fig. 2. The insulation resistance R0 can be calculated from the difference between polarisation and depolarisation currents at larger values of time given by [Uo/ (ipol-idepol)]. C0 represents the geometric capacitance of the insulation system. The quantity C0 is the geometric capacitance of the insulation model given by (C0=Cm/ r). Where Cm is the capacitance measured between the two terminals of the insulation system under test. It can be measured with any capacitance measuring AC Bridge at, or around, the power frequency and r is the relative permittivity of the composite oil-paper insulation system. The parallel R-C branches are approximations of individual polarisation processes with their time constants RiCi and can be treated independent of each other. The representation of the
Authorized licensed use limited to: The Library NUI Maynooth. Downloaded on February 2, 2010 at 11:16 from IEEE Xplore. Restrictions apply.
3
polarisation processes by parallel R-C branches allows the prediction of the response of the insulation, which rarely follows ideal Debye (i.e. non-extended) behaviour [13, 15].
The impedance of the circuit in Fig. 2 can be given by
nZZZZ
Z1111
1
210 (6) Where:
00
0 11
CjR
Z
(7) And :
nnn Cj
RZ 1
(8) Where n is the number of parallel branches of the series R-
C network. For the calculation of current, complex capacitance of the equivalent circuit has been defined by (1) from Fig. 2. For the FDS measurement, Uo would be replaced by U( ), where U( ) is the input signal to the circuit as a function of frequency. The current is then given by (9)
)()()( UCjI (9) The current can also be given by equation (10)
)()()()()( UY
ZUI
(10) Using (9) and (10), (11) is derived for the calculation of the
complex capacitance, which is the admittance of Fig. 2 divided by j .
jYC /)()( (11) The reciprocal of the impedance Z( ) is then the admittance
Y( )
)(1)( ZY
(12) C’( ) and C’’( ) can be obtained by dividing the
admittance by j . These values can be obtained as follows. The real and imaginary parts of the complex capacitance for
the equivalent circuit Fig. 2 can be expressed as: n
i ii
i
CRC
CC1
20'
1 (13)
n
i ii
ii
CRCR
RC
12
2
0 )(11)(''
(14) Now Z( ) can be expressed by (15),
)](")('[1
)(1)(
jCCjjCZ
(15) Where C’( ) and C”( ) are given by (13) and (14)
respectively.
II.D RELATIONS between Frequency and Time Domains-problem formulation for estimating R-C parameters from the frequency domain measured data
The problem is to take measured real and imaginary parts of complex capacitance versus frequency data (i.e. FDS data) of the form:
1 1
2 2,.. ..
n n
ZZ
Z
Z (16)
Where is a set of test frequencies (in rad/sec) and Zn is the measured impedance at n. The objective is to fit a linear transfer function model to this data. In performing this fit, several issues need to be considered, including: the form of the model, the measure to be used in determining the best fit and constraints imposed on the model.
II.D.1. Model Form There are a number of different model forms used to allow
data fitting. These can be transfer function based, pole-zero, state space, or other formulations. In this case, the gain, zero, pole form has been used, (Matlab ‘zpk’) which is as follows:
1
( )ˆ( )( )
Nm
m m
s zz s k
s p (17)
Where zm and pm are the impedance zeros and poles respectively, and k is the (high frequency) impedance. These unknown parameters are grouped into a (2N+1) dimensional
vector, 1 1T
N Nk z z p p In the form presented in (17), at high frequencies the
impedance tends to a constant. Whilst in practice the geometric capacitance would typically lead to an impedance, which tends to zero. With the model form of (17), this can be achieved if one of the zeros is allowed to become very large.
II.D.2 Criteria for Best Fit There are a number of different criteria that may be used to
determine the ‘best fit’ with one of the common ones being a least squares criteria:
2
1
ˆ( ) | ( , ) |n
LS i ii
J z z j
(18) Where zi is the measured complex impedance and
, iz j is the estimated complex impedance as a function of frequency. In a statistical sense, this cost function gives optimal estimation if the measurements are subject to additive
uncorrelated Gaussian errors: *ˆ ,i i iz z n
where * is
the true set of parameters and ni is the additive noise. On the other hand, if multiplicative errors are assumed,
Authorized licensed use limited to: The Library NUI Maynooth. Downloaded on February 2, 2010 at 11:16 from IEEE Xplore. Restrictions apply.
4
*ˆ , 1i i iz z n then the least square cost function is not
optimal. Instead, for small noise values, the least squares logarithmic impedance optimisation criteria was used, which is shown below:
2log
1
ˆ( ) | log( ) log( ( , )) |n
LS i ii
J z z j
(19) Note that the criteria in (19) gives a better measure of the
match on a Bode type diagram, whereas the standard least squares cost function is more suited to a linear scaling. In particular, the standard least squares cost function, (18), tends to give a relatively good fit for large impedances, and a relatively poor signal to noise ratio, rather than a constant absolute noise.
II.D.3 Parameter Constraints To ensure several realistic features of the model, a number
of constraints are introduced. Firstly, a nonlinear transformation of the parameters (logarithmic) is performed into new variables X=log ( ). This allows for a much greater dynamic range of variables, and ensures that for any X the gain will be positive, and all poles and zeros will be negative real1. In addition, the poles and zeros are constrained as follows:
1 1 2 2( ) ( ) ( ) ( ) .... ( )Nz p z p p (20)
The constraints in (20) interlace the zeros and poles and give the following desirable properties. , �>0 and � satisfying (20) it follows that:
1
2
2 21
( )ˆ( )( )
( )( ) ( ) ( )
0
Ni
i i
N i i i i
i i
j zz j
j p
z p j p z
p
(21) In addition, it can also be shown that for satisfying (20):
11
11
211 1
2 21
( ) ( ( ))2
( )( ( ))
( ) ( )
( )( ) ( ) ( )0 0
0
Ni
iN i
Ni i i i
i i
z j j z j
j zj j zj p j p
z p j p z
p
(22) So from the combination of (21) and (22) it is clear that for
any positive:
( ) 02
z j (23)
As expected for passive impedance is modelled on resistive and capacitive elements only. In addition to these constraints,
some other less important constraints on the relative separation etc. of pole and zeros are introduced.
II.D.4 Formulation of the problem as a constrained minimisation
The problem of determining the model from the parameters is thus set up as a constrained minimisation problem:
Given data, Z, and a given model order, N, determine parameters * as:
*log
: satisfies (10)arg min { }LSJ
(24)
Where log LSJ is defined in (9).
The constraints in this problem are linear, the gradient of
the cost function, log LSJ, can be computed analytically,
and therefore, the Matlab function “fmincon” can be used to solve equation (24) numerically.
II.D.5 Model Analysis
Once a model is estimated, a number of forms of analysis on this model can be performed. Note however, that due to the very wide range of time constants in the model in most cases, considerable care must be taken in handling the model. For example, conversion from zero, pole, gain form to transfer function form results in very large numerical rounding errors.
(a) Conversion to RC Model Form
The first form of analysis is to compute the predicted frequency response data. This can be easily performed using (for example) the Matlab “freqresp” command which computes the frequency response of a linear finite dimensional system. This command can directly take the model in the zero-pole gain form. This is also useful as a sanity check on the model fit to the data, where direct calculation gives capacitance and tan versus frequency. A second form of analysis is to convert the model to a series of parallel RC branches as shown in Fig. 2.
(b) Prediction of RVM/PDC Behaviour from model estimation
Another important set of tests performed are those based on time domain responses, namely, (i) Recovery Voltage (RV) and (ii) Polarisation/Depolarisation Current (PDC) Method.
To be able to handle a range of tests, and compare results, it is desirable that given a model one should be able to predict the results of various tests. This helps in model validation, and also gives greater flexibility in the testing scenario. It was therefore decided to take a model of the form given by (17), and given test conditions (charge voltage Uo, charge and discharge times t1 and t2) predict both the recovery voltage and the polarisation/depolarisation current waveforms. The poles/zero form of the model; (17) was used first, to create a
1Note:-it is claimed that any passive connection of positive RC elements can only result in a passive overall system, with negative real poles and zeros.
Authorized licensed use limited to: The Library NUI Maynooth. Downloaded on February 2, 2010 at 11:16 from IEEE Xplore. Restrictions apply.

5
state space version of the impedance model using standard Matlab commands.
III. INVESTIGATED TRANSFORMERS
Six transformers were tested in two power stations. Four transformers (marked with A-Gen, B-Gen, A-Aux and B-Aux) were measured in one power station and two transformers (marked with C-D) were measured in another power station. These measurements include frequency domain dielectric spectroscopy for all transformers and the Recovery Voltage measurement for only one transformer (due to time constraint provided by the customer). A summary of the transformers information is described in Table 1. Results are presented and analysed in this paper for these six transformers.
III.1. Measurement systems Frequency domain dielectric spectroscopy equipment
IDA200 [8] was used to measure capacitance and dissipation factor (tan ) over a frequency range of 0.1 mHz to 1 kHz. The supply voltage was 140 volts (RMS). The red (HI) connection was connected to the shorted HV terminals of the test object and the blue (LO) connection was connected to the shorted LV terminals of the transformer. The voltage over and the current through the specimen are measured with high accuracy using a voltage divider and an electrometer. The instrument earth was connected to the tank of the test object and the guard terminal was connected to the tank of the test object. Fig. 3 shows the arrangement for the frequency domain measurement.
Recovery Voltage was measured for one transformer using a Tettex 5461 RV meter [9]. For the RV measurement, all HV terminals were shorted and all LV terminals shorted and all were then grounded. The RV measurement was conducted on a 3-phase two winding type transformer. The instrument earth was connected to the tank of the transformer. Fig. 4 shows the arrangement for the RV measurement.
Fig. 3 Test arrangement of IDA 200 equipment
Table 1 Summary information of the tested transformers Transformer Identity
MVA Rating
HV Rating (kV)
LV Rating (kV)
Date of Manufacture
A-Gen Tx 390 330 23 1991 B-Gen Tx 390 330 23 1992 A-Aux Tx 45 23 11.5 1985 B-Aux Tx 45 23 11.5 1985 C-Tx 45 23 11.5 1983 D-Tx 45 23 11.5 1983
Fig. 4 Test arrangement of Tettex 5461 equipment
A range of charging times was applied to the test specimen during the RV test. For each of these charging times the instrument performed a number of operations. A DC voltage of 2000 volts was applied to the HV terminals for the predetermined charging time, after which the HV and LV terminals were shorted for half the charging time, then the recovery voltage was measured during the open circuit condition.
IV RESULTS & DISCUSSIONS
IV.I Frequency Domain Dielectric Spectroscopy Figs. 5 and 6 respectively show the plot of tan and
capacitance versus frequency for the four transformers (A-B Gen and Aux) measured in one power station. Figs. 7 and 8 respectively show the plot of tan and capacitance versus frequency for the two transformers (C and D) measured in another power station.
Fig. 5 Tan variations of four transformers (A, B Gen & Aux) over the
frequency range of 0.1 mHz to 1 kHz
Authorized licensed use limited to: The Library NUI Maynooth. Downloaded on February 2, 2010 at 11:16 from IEEE Xplore. Restrictions apply.

6
Fig. 6 Capacitance variation of four transformers (A, B Gen & Aux) over the frequency range of 0.1 mHz to 1 kHz It was reported in [12] that the major advantage with the
use of tan is its independence on test object geometry. In a previous study by the first author of this paper [14], findings from mass impregnated paper suggest that loss tangent has a minimum, which tends to increase with moisture content. A number of other researchers also correlated moisture with the minimum dissipation factor for oil/paper underground cables from the FDS measurement. The moisture content has been related with the minimum dissipation factor by some empirical relationships as in [17]. This indicates that one could attempt to directly relate the minimum of the loss tangent to certain moisture content in impregnated paper. However, this has not been reported for transformer oil-paper insulation and hence was not attempted to correlate in this paper. Summary results of frequency domain measurements from these transformers are presented in Table 2.
Table 2 Summary of frequency domain measurements Transformer Identity
Minimum tan
Frequency at minimum tan (Hz)
A-Gen Tx
0.0025
33
B-Gen. Tx 0.0035 10 A-Aux. Tx 0.0026
3.3
B-Aux. Tx 0.0025 3.3 C-Tx 0.0039 333.3 D-Tx 0.0041 333.3
Fig. 7 Tan variations of C and D transformers over the frequency range of
0.1 mHz to 1 kHz
Fig. 8 Capacitance variations of C and D transformers over the frequency range of 0.1 mHz to 1 kHz
It can be emphasised here that three transformers (A-Gen, A-Aux and B-Aux) have the lower range of minimum tan values compared to that of the B-Gen Tx, C-Tx and D-Tx transformers. This can be attributed to lower and higher moisture contents respectively. The D-Tx transformer has the highest minimum tan value among the three high tan transformers (B-Gen Tx, C-Tx and D-Tx), with an expectation of higher moisture content in this transformer than the others. The first author of this paper has extensively investigated time domain polarisation based tool for moisture assessment. In the later part of the result section, an estimation of moisture will be made from this previously developed software tool and other studies reported in [16] based on the time domain polarisation measurements.
Due to time constraints for allowable transformer outage, an RV measurement was conducted only for the B-gen transformer. The RV measured result of B-gen transformer is shown in Fig. 9 along with the simulated result based on the theory presented in the previous sections. An equivalent circuit (as in Fig. 2) is first modelled to perform this RV simulation. Similarly, RV Results for the three other transformers of the same power station are obtained from the developed simulation software and are shown in the Fig. 10. Simulation results from the other two transformers are shown in Fig. 11. The ratio of time to charging and discharging has always been two, for both measurements and simulation. Charging voltage for the RV measurement and simulation was 2000 volts dc. Summary results for these transformers are described in the Table 3.
Table 3 Summary of RV simulated results with only measurements on B generator transformer
Transformer
Identity
RV Peak Max. Value (V) Measured and (corresponding charging time to peak The return voltage)
RV Peak Max. Value (V) simulated
Corresponding time of charging (s)
A-Gen Tx
Not done 520 400
B-Gen Tx 296 (200 s) 446 200
A-Aux Tx
Not done 490 1000
B-Aux Tx
Not done 440 1000
C-Tx Not done 470 50
D-Tx Not done 361 50
Authorized licensed use limited to: The Library NUI Maynooth. Downloaded on February 2, 2010 at 11:16 from IEEE Xplore. Restrictions apply.

7
Fig. 9 RV spectra of B generator transformer and comparison with the measured results
Fig. 10 RV spectra for the A, B auxiliary and A generator transformers based on simulation from IDA data
IV.2 Recovery Voltage measurements and simulation Normally the charging time to peak maximum RV voltage
varies significantly for transformers with different moisture and ageing conditions [5, 6, 11, and 13]. For example, for a very dry transformer, this time could be several hundred to a thousand seconds and this becomes few to few tens of seconds for a very moist and aged transformer.
Results in Table 3 suggests that C-Tx and D-Tx transformers reached their peak RV at the shortest charging time (50 s) compared to the rest of the transformers. The B-Gen Tx has the next shortest charging time (200 s) followed by the A-Gen Tx. Simulated and measured RV magnitude showed a significance difference for the B-Gen Tx, where as the charging time to peak return voltage matches identically.
Fig. 11. RV spectra for the C and D transformers based on simulation from IDA data
IV.3 Simulation of Polarisation/Depolarisation Currents An attempt is made here to simulate polarisation and
depolarisation currents of these transformers. Simulation is performed using the RC parameters available from the curve fitting of IDA200 measurement data as described earlier. Once polarisation/depolarisation currents for very long times (10,000 seconds each) are available, it is possible to estimate oil and paper conductivities [10]. Results are presented in Table 4 using the concepts presented in references [10, 16]. In addition, an expert system was developed for moisture and ageing estimation by the first author of this paper, based on published results available from around the globe [16]. Based on the expert system, an attempt is also made here to find the moisture content of paper/pressboard insulation.
It can be observed from Table 4 that C-Tx and D-Tx transformers have much higher oil conductivities than those of the other four transformers. This suggests that the oil quality of these two transformers were much worse than the other transformers. The A-Gen Tx and B-Gen Tx also had higher oil conductivities than the other two auxiliary transformers at the same power station. On the other hand, the paper conductivities of C-Tx and D-Tx are also higher compared to the other four transformers. This suggests that paper ageing status of these two transformers (C and D) is in a much more degraded state than the other four.
The other four transformers have the paper conductivity in
the same order, suggesting not much change in paper ageing conditions among these four transformers. Based on the conductivities of oil and paper, RVM results and the expert systems tool previously published in [16], the moisture levels of A-Gen and B-Gen transformers were 1.5%, while both auxiliary transformers A-Aux and B-Aux had a moisture level of lower than 1%. The expert system estimated 3% moisture levels for the C-Tx and D-Tx in their solid insulation.
Authorized licensed use limited to: The Library NUI Maynooth. Downloaded on February 2, 2010 at 11:16 from IEEE Xplore. Restrictions apply.

8
Table 4. Summary of oil-paper conductivities from the simulated PDC
results Identity
Estimated oil conductivity (S/m)
Estimated pressboard/ paper conductivity (S/m)
Estimated pressboard paper Moisture Content from the expert system [18]
Ranking Bad to good
A-Gen TX 1.19 10-12 2.98 10-14 1.5% 4 B-Gen TX 1.33 10-12 5.17 10-14 1.5%
3
A-Aux Tx 5.13 10-14 5.09 10-14 <1%
5
B-Aux Tx 4.01 10-14 3.69 10-14 <1%
6
C-Tx 2.87 10-11 5.83 10-13 3%
2
D-Tx 2.55 10-11 1.55 10-12 3% 1
Results from FDS measurements also showed that C-Tx and D-Tx also have the highest minimum tan among the group, followed by the B-Gen Tx. The results are consistent from both time domain and frequency domain measurements.
V. CONCLUSIONS & DISCUSSIONS
A number of modern polarisation based dielectric diagnostics has been applied to six transformers. If the mathematical relationships between different dielectric diagnostics can be properly established, the analysis of insulation condition could be better understood.
An attempt has been made in this paper based on Matlab software to develop a circuit model, which describes the dielectric behaviour of the transformer’s main insulation system. This circuit model has been modelled in this paper from the frequency domain measurement data and then RV and PDC have been simulated. An expert system has been developed in the recent past at the University of Queensland and some analyses have been presented in this paper[16]. Out of six transformers two auxiliary transformers A-Aux and B-Aux are in general found to be in dry and good insulation condition. Although two generator transformers A-Gen and B-gen (using expert system estimation) show 1.5% moisture level in solid insulation and after 11-12 years of operation this is not in an alarming state. However, the other two transformers C and D after 22 years in operation showed significant moisture levels and poor oil and paper quality. Dielectric polarisation based diagnostics can provide oil and paper insulation conductivities and can be related to moisture conditions. The confidence level of using polarisation based diagnostics can be improved with the development of a large database and possible use of expert systems. The interrelationship between different polarisation based diagnostics is now much better understood with the current software development capabilities. Research in this field is continuing and further findings will be reported in future papers.
VI ACKNOWLEDGMENT The authors would like to take this opportunity to thank
Connell Wagner Advanced Technology Centre at Newcastle for their support in this work.
VII REFERENCES [1] Leibfried, T., and Kachler, A. J.: “Insulation diagnostics on power
transformers using the polarisation and depolarisation current (PDC) analysis”, Proc. IEEE International Symposium on Electrical Insulation, pp. 170-173, 2002.
[2] Csepes, G., Hamos, I., Brooks, I., and Karius, V.: “Practical foundations of the RVM (recovery voltage method for oil/paper insulation diagnosis)”, Proc. Conference on Electrical Insulation and Dielectric Phenomena, vol. 1, pp. 345-355, 1998.
[3] Shroff, D. H., and Stannett, A.W: “A Review of Paper Aging in Power Transfomers”, IEE Proc., vol. 132, pt. C, no. 6, pp. 312-319, 1985.
[4] Bognar, A., Kalacsai, L., Csepes, G., Nemeth, E., and Schmidt, J.: “Diagnostic Tests of High Voltage Oil-Paper Insulation Systems (in Particular Transformer Insulation) Using DC Dielectrometrics”, Proc. CIGRE, Paris Session, Paris, Paper no. 15/33-08, 1990.
[5] Saha, T. K., Darveniza, M., Hill, D.J.T., and Le, T.T.: “Electrical and Chemical Diagnosis of Transformer Insulation, Part A: Aged Transformer Samples”, IEEE Trans. Power Delivery, vol. 12, no. 4, pp. 1547-1554, 1997.
[6] Ekanayake; C., Gubanski, G.M., Graczkowski, G., and. Walczak K.: “Frequency response of oil impregnated pressboard and paper samples for estimating moisture in transformer insulation”, IEEE Transactions on Power Delivery, Volume 21, Issue 3, July 2006 Page(s):1309 – 1317
[7] Neimanis, R., Eriksson, R.: “Diagnosis of moisture in oil/paper distribution cables - Part I: Estimation of moisture content using frequency-domain spectroscopy” IEEE Transactions on Power Delivery, Volume 19, Issue 1, Jan. 2004 Page(s):9 - 14 GE
[8] Energy Services, “IDA 200™, Insulation Diagnostics System”, http://www.gepower.com/prod_serv/products/electrical_test/en/downloads_en/ida200_en.pdf
[9] Tettex Instruments General catalogue part-3 “Automatic recovery voltage meter 5461 for a diagnosis of oil-paper insulation system”, http://www.haefely.com/measuring_diagnostics/rvm_docu/Connection_and_operating.pdf
[10] Saha, T. K., and Purkait, P.: “Investigation of polarization and depolarization current measurements for the assessment of oil-paper insulation of aged transformers”, IEEE Transactions of Dielectrics and Electrical Insulation, Vol. 11, No. 1, Feb. 2004 , pp. 144 – 154.
[11] Saha, T. K., and Yao, Z.T.: “Experience with return voltage measurements for assessing insulation conditions in service-aged transformers”, IEEE Transactions on Power Delivery, Vol.18, No. 1 , Jan 2003, pp.128 – 135
[12] On Behalf of CIGRE Task Force 15.01.09, “Dielectric Response Methods for Diagnosis of Power Transformers”, Electra no. 202, pp. 25-36, 2002.
[13] P. Jota, R.S., Islam, S. M., and Jota, F. G. .:“Modelling the Polarisation in Composite Oil/Paper Insulation Systems”, IEEE Trans. Dielectrics and Electrical Insulation, vol. 6, no. 2, pp.145-151, 1999.
[14] Neimanis, R., Saha, T. K., and Eriksson, R.: “Determination of Moisture Content in Mass Impregnated Cable Insulation Using Low Frequency Dielectric Spectroscopy”, Proceedings of the IEEE 2000 Power Engineering Society Summer Meeting, 16-20 July 2000, Seattle, USA, pp. 463-468.
[15] Saha, T. K., Purkait, P., and Muller, F.: “Deriving an Equivalent Circuit of Transformer Insulation for Understanding the Dielectric response Measurements”, IEEE Transaction on Power Delivery, Vol. 20, No. 1, pp. 149-157, January 2005.
[16]Saha, T. K., and Purkait, P.: “An Expert System for Condition Assessment of transformer insulation Based on Dielectric response measurements”, IEEE Transactions on Power Delivery, Vol. 19, No. 3, July 2004, pp. 1127-1134
[17]Zaengl, W. S.: "Applications of dielectric spectroscopy in time and frequency domain for HV power equipment," Electrical Insulation Magazine, IEEE, vol. 19, no. 6, pp. 9-22, 2003.
Authorized licensed use limited to: The Library NUI Maynooth. Downloaded on February 2, 2010 at 11:16 from IEEE Xplore. Restrictions apply.

![Understanding and Improving Transformer From a Multi ...yplu/pub/TransformerODE.pdf · The Transformer architecture is usually developed by stacking Transformer layers [3, 7]. A Trans-](https://img.pdfslide.us/doc/110x75/5e041ce971302740e4025b95/understanding-and-improving-transformer-from-a-multi-yplupubtransformerodepdf.jpg)


![Dielectric behavior of transformer oil when …...the development of dielectric nanofluids [6, 7]. These materials are manufactured by adding nanoparticle suspensions to transformer](https://img.pdfslide.us/doc/110x75/5f0246247e708231d403727d/dielectric-behavior-of-transformer-oil-when-the-development-of-dielectric-nanofluids.jpg)