Embed Size (px)
Citation preview
UNDERSTANDING EXPENDITURE PATTERNS IN RETIREMENT
Barbara A. Butrica, Joshua H. Goldwyn, and Richard W. Johnson*
CRR WP 2005-03 Released: January 2005
Draft Submitted: December 2004
Center for Retirement Research at Boston College 550 Fulton Hall
140 Commonwealth Ave. Chestnut Hill, MA 02467
Tel: 617-552-1762 Fax: 617-552-1750 http://www.bc.edu/crr
*Barbara A. Butrica and Richard W. Johnson are both Senior Research Associates at the Urban Institute. Joshua H. Goldwyn was a Research Assistant at The Urban Institute. The research reported herein was performed pursuant to a grant from the U.S. Social Security Administration (SSA) to the Center for Retirement Research at Boston College (CRR). The opinions and conclusions are solely those of the authors and should not be construed as representing the opinions or policy of SSA or any agency of the Federal Government or of the CRR, or the Urban Institute, its board, or its sponsors. The authors thank Adeel Saleem for estimating tax liabilities. © 2005, by Barbara A. Butrica, Joshua H. Goldwyn, and Richard W. Johnson. All rights reserved. Short sections of text, not to exceed two paragraphs, may be quoted without explicit permission provided that full credit, including © notice, is given to the source.
About the Center for Retirement Research
The Center for Retirement Research at Boston College, part of a consortium that includes a parallel centers at the University of Michigan and the National Bureau of Economic Research, was established in 1998 through a grant from the Social Security Administration. The goals of the Center are to promote research on retirement issues, to transmit new findings to the policy community and the public, to help train new scholars, and to broaden access to valuable data sources. Through these initiatives, the Center hopes to forge a strong link between the academic and policy communities around an issue of critical importance to the nation’s future.
Center for Retirement Research at Boston College 550 Fulton Hall
140 Commonwealth Ave. Chestnut Hill, MA 02467
phone: 617-552-1762 fax: 617-552-1750 e-mail: [email protected]
http://www.bc.edu/crr
Affiliated Institutions:
American Enterprise Institute The Brookings Institution
Center for Strategic and International Studies Massachusetts Institute of Technology
Syracuse University Urban Institute
Understanding Expenditure Patterns in Retirement
Abstract
Understanding the consumption needs of retirees is critical to assessing the adequacy of
retirement income and the possible impact of Social Security reform on the well-being of older
Americans. This study uses data from the Health and Retirement Study, including a recent
supplemental expenditure survey, to analyze spending patterns and consumption needs for adults
ages 65 and older. Results indicate that typical older married adults spend 84 percent of after-tax
household income, and nonmarried adults spend 92 percent of after-tax income. Even at older
ages individuals devote a larger share of their expenditures and income to housing than any other
category of goods and services, including health care. Fully 8 percent of married adults report
after-tax incomes that fa ll short of our estimated basic-needs threshold, consisting of housing,
health care, food, and clothing. By comparison, only 3 percent of married adults have incomes
below the official poverty level.
I. INTRODUCTION
Understanding expenditure patterns in later life is critical to assessing the retirement
security of older Americans. Although previous studies have examined the determinants of
retirement income and wealth and projected the level of resources that will likely be available to
future cohorts of retirees, relatively little is known about consumption needs at older ages and
how they vary across different subgroups of the population. Better information about how much
income older Americans require to live comfortably in retirement is necessary before analysts
can determine how well Social Security, employer-sponsored pensions, post-retirement earnings,
and private savings meet the needs of the elderly population and before they can assess the
possible impact of potential Social Security reforms on economic well-being.
Popular financial advice suggests that households should strive to replace between 65 and
85 percent of pre-retirement income in retirement (Uccello 2001), but there appears to be little
scientific basis for this estimate. Retirees have lower consumption needs than workers because
they do not incur work-related expenses. Housing costs tend to decline at older ages once
homeowners pay off their mortgages. In addition, older adults no longer need to save for
retirement, and they typically pay lower taxes than younger people. On the other hand, health
care costs tend to rise at older ages, and many elderly people who lack private health insurance to
supplement Medicare benefits face catastrophic medical expenses (Crystal et al. 2000; Goldman
and Zissimopoulos 2003). The official federal poverty level establishes an absolute lower bound
for consumption needs, but it is based on surveys that are now about a half-century old, and most
experts do not consider the estimates to be reliable (Citro and Michael 1995). In order to
develop an accurate portrait of the well-being of older Americans, it is critical that analysts
understand how aged people spend their resources. For example, a very different picture
emerges if older households spend much of their resources on health care than if they devote
their money to expensive vacations.
This analysis represents a first step in understanding consumption needs in later life. We
examine the overall level, distribution, and composition of expenditures, and measure how
expenditures vary by key individual and household characteristics, including age, race, marital
status, health status, and income. We also analyze the relationship between spending and
2
household income. Finally, we establish a minimum threshold for how much income elderly
people need to live comfortably in retirement and estimate the share of the older population that
is unable to satisfy these consumption needs.
II. BACKGROUND
In order to paint a complete and accurate picture of economic well-being in retirement, it
is important to evaluate economic resources in relation to consumption needs. The official
poverty rate is designed to measure the share of the population with insufficient income to meet
basic consumption needs. The U.S. Census Bureau sets the official poverty thresholds, which
vary by family size and age and change each year with the change in the price level, as measured
by the Consumer Price Index (CPI). The share of the elderly population living in poverty has
declined dramatically over the last half of the twentieth century. In 1959, more than one in three
adults ages 65 and older received incomes below the poverty level; in 2003, only one in ten lived
in poverty (U.S. Census Bureau 2004).
However, important problems plague the official poverty thresholds. They were
constructed decades ago using data on food expenditure patterns that are now more than 40 years
old, under the assumption that food expenditures accounted for one-third of total consumption
needs. Given the tremendous technological changes that have occurred over the past 40 years,
and changes in the delivery of health care, it is unlikely that these thresholds reflect the
consumption needs of today’s older population.
Up-to-date information on household expenditures is critical, because spending patterns
at older ages appear to be changing. Out-of-pocket health care costs among older adults have
been rising, in response to increases in health insurance premiums, growth in Medicare cost-
sharing, declines in retiree health insurance coverage, and growth in prescription drug costs,
which are not currently covered by Medicare. (Drug benefits will be added to Medicare in 2006,
but beneficiaries will face substantial cost sharing requirements.) Tax burdens have also been
increasing for older people. Since 1993 high- income people have had to pay federal income
taxes on their Social Security benefits, but the threshold determining the taxability of benefits is
3
not indexed to the growth in prices or wages. As a result, the share of benefits subject to tax
rises each year. Moreover, the growing popularity of defined contribution pension plans, hybrid
pension plans (including cash balance plans), and Individual Retirement Accounts, all of which
generally provide benefits in the form of lump sum payments instead of annuities, is likely to
affect spending patterns at older ages, because people who do not annuitize their wealth may
limit their spending to reduce the risk of depleting their assets before they die.
In addition to traditional retirement income and financial assets, older adults can turn to
other resources to finance their consumption needs. One possibility is housing equity, the most
important asset for most Americans. Most older people prefer to remain in their homes, and are
reluctant to move even when they could increase their standard of living by selling their homes.
In principle, reverse mortgages solve this dilemma by allowing homeowners to borrow against
the equity in their homes. To date, however, very few elderly people have taken advantage of
these financial instruments.
Previous Literature
A number of studies have attempted to measure the adequacy of retirement resources on
the basis of income. Many of them suggest that most current retirees are doing well (Gustman
and Steinmeier 1999; Haveman 2003), pre-retirees are accumulating enough wealth to finance a
comfortable retirement (Easterlin 1990, 1993; Sabelhaus and Manchester 1995), and future
retirees are likely to receive at least as much income as previous generations (Butrica and
Uccello 2004; Butrica, Iams, and Smith 2003; Smith 2002). An important limitation of these
studies, however, is that they rely solely on income and wealth measures to evaluate economic
well-being, and ignore potential changes in future consumption needs.
Several studies have already examined spending patterns in retirement. One line of
research has focused primarily on testing the life cycle consumption hypothesis and assessing
whether expenditures decline at retirement (Ameriks, Caplan, and Leahy 2001; Banks, Blundell,
and Tanner 1998; Bernheim, Skinner, and Weinberg 2001; Hamermesh 1984; Hurd and
Rohwedder 2003; Paulin and Duly 2002). Another line of research is less concerned with how
4
expenditures change before and after retirement, and more interested in understanding
differences in spending within the retired population. For example, Bahizi (2003) uses data from
the Consumer Expenditure Survey (CEX) to document differences in expenditure levels and
budget shares for white, black, and Hispanic retirees. Another study by Paulin (2000) examines
changes in spending patterns of older adults between 1984 and 1997. But none of the studies in
either area of research focuses on measuring consumption needs.
Rubin and Nieswiadomy (1997) provide a comprehensive analysis of expenditure
patterns of the elderly across subgroups and over time using data from the CEX for the 1970s,
1980s, and early 1990s. Unlike most other studies, the authors are particularly concerned with
understanding how economically vulnerable elderly adults allocate their expenditures to
necessities, such as food, housing, and health care expenditures.
Our analysis builds on their research in several ways. First, we use relatively unexplored
expenditure data from a leading survey on the income and health status of older adults. Second,
we use much more recent data on expenditure patterns. Third, we use information on both
expenditures and income to construct minimum needs thresholds and to estimate the share of the
older population that is unable to satisfy these consumption needs.
III. DATA AND METHODOLOGY
Our data come from the Health and Retirement Study (HRS), a longitudinal survey of
older Americans conducted by the Survey Research Center at the University of Michigan for the
National Institute on Aging. Since 1992, the HRS has been following several cohorts of older
respondents and their spouses. In 2000, the survey interviewed a nationally representative
sample of 19,579 Americans ages 53 and older and their spouses. The HRS collects detailed
information on a wide range of subjects, including basic demographic information, detailed
health status, and comprehensive income and asset information. It oversamples African
Americans, Hispanics, and Florida residents, but includes sample weights used to adjust the
estimates so that they represent the underlying national population.
5
The HRS administered a supplemental mail survey on household expenditures to a subset
of respondents in 2001. This survey, the Consumption and Activities Mail Survey (CAMS),
asked respondents to report household expenditures over the past 12 months on 32 different
groups of goods and services designed to capture all household spending. It also asked
respondents how their spending would change if their income increased by 20 percent. Data was
collected for 3,813 households. We merged the 2001 CAMS with demographic and asset
information from the 2000 HRS and income information from the 2002 HRS (which collected
data on income received in 2001). In combination with the information collected from the core
HRS questionnaires, CAMS provides an unusually rich source of data on household spending at
older ages.
Measuring Expenditures and Income
To make the analysis of household spending patterns more manageable, we group
expenditures into the following categories:
• housing, which includes mortgage payments, home/renter insurance premiums, property
tax payments, rent, utility costs (electricity, water, heat, phone, and cable and internet
services), spending on house/yard supplies, and home maintenance costs;
• health care, consisting of out-of-pocket payments on insurance premiums, drugs, health
services, and medical supplies;
• food, which includes expenditures on groceries but not spending on dining outside of the
home;
• transportation expenditures, which consist of payments for automobile finance charges,
automobile insurance premiums, gasoline, and automobile maintenance (but which
exclude any spending on public transit);
• entertainment, consisting of spending on dining out, vacations, tickets to events, and
hobbies;
6
• gifts, which include charity and other gifts; and
• other consumer durables, including purchases of automobiles, refrigerators, washers and
dryers, dishwashers, televisions, and computers.
The analysis also relates spending to household income. We examine three different
income measures: before-tax income, after-tax income, and after-tax income plus the value of
annuitized assets. Before-tax household income comes directly from the HRS, which asks the
financially knowledgeable respondent in each household about multiple types of income
received by him or her and the spouse (if married).1 We compute after-tax household income by
subtracting estimated federal tax payments, based on the Urban-Brookings Tax Policy Center’s
Microsimulation Model, from before-tax income. The tax model is a detailed tax calculator that
captures most features of the federal individual income tax system. Inputs into the tax model
include earnings, Social Security benefits, and pension benefits. Other inputs (including interest
and dividends, state and local taxes, property taxes, mortgage interest, and capital gains) are
imputed from Statistics of Income (SOI) data from the Internal Revenue Service according to
age, filing status, and income brackets. Finally, to capture all of the financial resources available
to individuals, we estimate the annuitized value of the household’s financial assets and add it to
after-tax household income.2 This last measure provides a broader estimate of the financial
resources available to older people, under the assumption that they chose to consume their asset
holdings evenly over the rest of their expected lifetimes.
Our analysis is based on per capita household expenditures and income. Considering
only total household expenditures and income could be misleading, because spending and
income both tend to increase with household size. Ignoring household size could particularly
1 Household income includes payments from self-employment; wages and salaries; professional practices and trades; tips and bonuses; unemployment compensation; worker compensation; welfare benefits; rental income; assets, including stocks, bonds, checking accounts, and certificates of deposit; trusts; alimony support; Social Security benefits; Supplemental Security Income (SSI) benefits; veterans’ benefits; Individual Retirement Account (IRA) withdrawals; pension benefits; annuities; and other income. 2 Financial assets include IRA balances; stock and mutual fund values; bond funds; checking, savings, money market, and certificates of deposit account balances; and trusts, less unsecured debt. To measure income from financial assets, we calculate an actuarially fair annuity assuming an interest rate of 7 percent.
7
distort estimated age differences in spending, because older households tend to be smaller than
younger households. Although we can estimate per capita household expenditures by simply
dividing spending by the number of household members, we can only approximate per capita
income. The HRS collects complete information on income only for the respondent and spouse,
not for other adults who might live in the household. We set per capita income equal to
household income for unmarried adults and to one-half of household income for married adults.
This approach assumes that the income received by any other adults living in the household
equals the average per capita income of the respondent and spouse. Because this assumption
may not always hold, we also measure how our basic findings change when we restrict the
sample to households that do not include any other adults.
For each measure of interest, most of our tables report the mean value between the 45th
and 55th percentiles of the distribution. This statistic approximates the median, and better
describes outcomes for typical people than the mean because it is less sensitive to extreme
values. It is also a better statistic than the median, because the median value gives the
breakdown for a single observation, which may not be representative of people in the center of
the distribution. By using 10 percent of the sample, our statistic better describes the composition
of expenditures and income for typical cases. For ease of exposition, we refer to this statistic as
the median throughout the text, unless otherwise noted.
Measuring Needs
Using information on expenditures, we establish minimum consumption needs for older
households. We compute the median value of expenditures on housing, health care, food, and
clothing, and set our basic-needs threshold equal to the sum of these values. We compute
separate thresholds for married and nonmarried adults and determine the share of those whose
incomes fall short. We also consider how our results would differ under alternate definitions of
minimum needs.
8
One way to evaluate our thresholds for minimum needs is to consider how they compare
with subjective measures of well-being collected in the HRS. In each wave, the core survey asks
respondents whether their retirement experience turned out to be very satisfying, moderately
satisfying, or not at all satisfying. Respondents are also asked whether they have always had
enough money to buy the food they need. Additionally, the CAMS survey asked respondents
how they would change their spending if their income were to rise by 20 percent. Respondents
can answer that they would save or invest all of it, spend or donate all of it, spend and save some,
or that they are uncertain about what they would do. Those who responded that they would
spend and save some were then asked to report the percentage they would spend and the
percentage they would save. If they said that they would spend 50 percent or more of it, we
grouped them into the spend-all-or-most category. If they said that they would save 50 percent
or more of it, we grouped them into the save-all-or-most category.
We incorporate the responses from these survey questions into our analysis to assess
whether our minimum-needs thresholds appear to identify economically vulnerable older adults.
In general, those who report being satisfied with their retirement and who have enough money to
buy food are probably meeting their consumption needs. Similarly, respondents who claim that
they would save all or most of any additional income they might receive are probably able to
satisfy their consumption needs with their current levels of spending (since they claim they
would not increase their expenditures even if they had more resources).
Sample Criteria
Our analytic sample consists of adults ages 53 and older, although most of the analysis
focuses on adults ages 65 and older. We report results at the individual level, separately for
married and nonmarried adults. All expenditures and income are expressed in 2001 dollars.
After dropping a few cases with missing data, our sample includes 3,636 married adults (1,894 of
whom are ages 65 and older) and 1,730 nonmarried adults (1,115 of whom are ages 65 and
older).
9
IV. RESULTS
We begin by examining how expenditure and income patterns differ between younger
and older age groups. We then explore how older adults allocate their resources and differences
by key individual and household characteristics. Next we assess retirement security. First we
analyze the relationship between spending and household income. Then we establish a minimum
threshold for how much income older people need to live comfortably in retirement and estimate
the share of the older population that is unable to satisfy these consumption needs.
Overall Expenditure Patterns
Although the focus of our analysis is adults aged 65 and older, we briefly compare
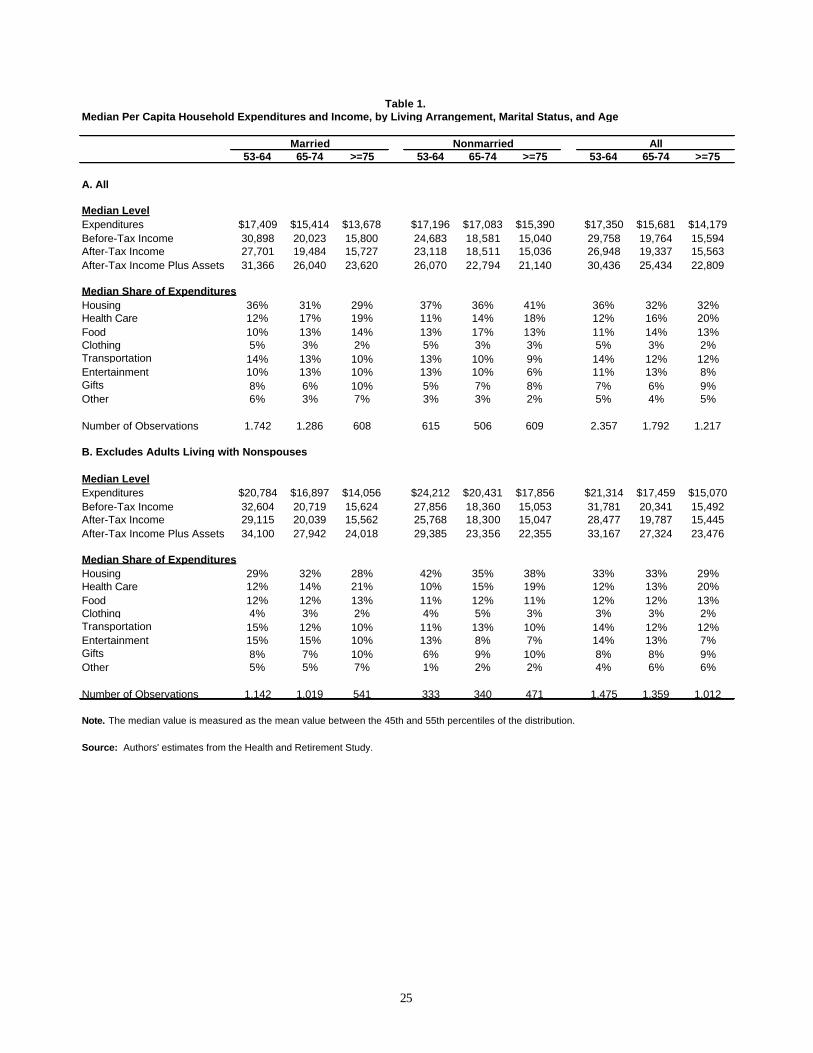
expenditure and income patterns for midlife and aged adults (see table 1). Among married
adults, including those living with nonspouses, the median value of per capita household
expenditures falls with age, declining from $17,409 at ages 53 to 64, to $15,414 at ages 65 to 74,
to $13,678 at ages 75 and older. Likewise, the median value of per capita before-tax income for
married people declines from $30,898 at ages 53 to 64, to $20,023 at ages 65 to 74, to $15,800 at
ages 75 and older. The median level of expenditures declines by 21 percent between the
youngest and oldest age groups, whereas the median value of income before taxes declines by 49
percent. The estimated decline in financial resources narrows when we account for taxes and
assets. The median value of after-tax income plus annuitized assets is only 25 percent less for
married adults aged 75 and older than for married adults aged 53 to 64.
Compared with married adults, nonmarried adults tend to have higher per capita
expenditures (except for the youngest age group) but lower per capita incomes. In contrast to
married individuals, median expenditures among nonmarried people are slightly higher at ages
65 to 74 than at ages 53 to 64, and then are lower at ages 75 and older. However, similar to
married individuals, median income declines with each successive age group. Between the
youngest and oldest age groups, expenditures decline by only 10 percent but after-tax income
plus assets declines by 19 percent.
10
The allocation of expenditures across spending categories changes with age. The share of
total expenditures devoted to health care costs increases between the youngest and oldest age
groups for both married and nonmarried adults. This increase is offset, in part, by the decline in
the share of the budget for clothing and transportation. Since quite a few of the patterns differ
between married and nonmarried individuals, we explore the allocation of expenditures more
closely in the next section of the paper.
Before turning to that discussion, we note that while per capita expenditures reflect the
spending of all members of the household, the per capita income measure is based only on
receipts by the respondent and spouse (if married), and thus excludes income received by other
adult household members. Sixteen percent of the married sample and 28 percent of the
nonmarried sample live with individuals other than their spouses. To test the sensitivity of our
findings to these differences, we also report results that exclude those living with nonspouses.
When we exclude adults living with nonspouses, we find that median expenditures increase for
all age groups, median income increases for most age groups, and that budget shares remain
fairly constant for those ages 65 and older.
Expenditure Patterns within Subgroups
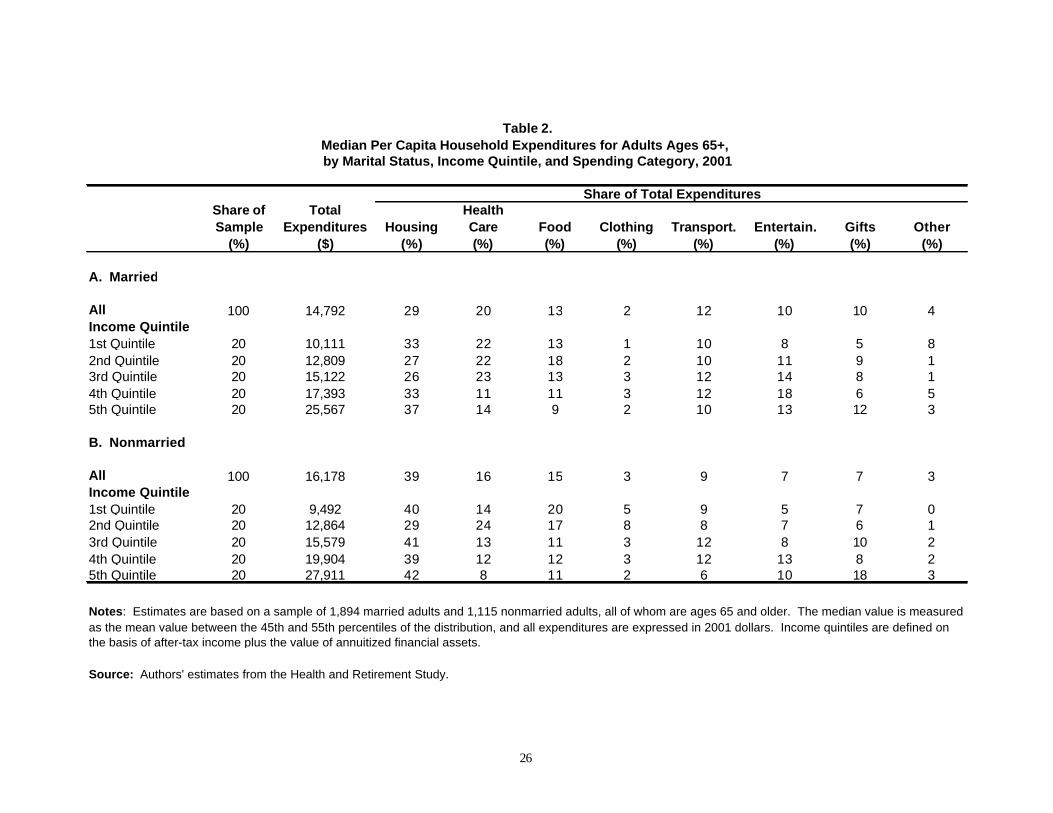
The median value of per capita household expenditures for married adults ages 65 and
older stands at $14,792 (see table 2). Housing is the largest spending category overall, followed
by health care, food, transportation, entertainment and gifts, other consumer durables, and
clothing. Specifically, typical married individuals devote 29 percent of their total expenditures
to housing. They devote another 20 percent to health care, 13 percent to food, and 12 percent to
transportation. Entertainment and gifts represent 10 percent of total expenditures. Other
consumer durables, such as appliances, account for 4 percent of total spending, and clothing
accounts for 2 percent. Interestingly, housing and health care alone account for close to half of
total household expenditures for typical older married adults. One reason for the relatively steep
housing expenditures is that the aged are increasingly likely to hold mortgages on their homes
(Gist and Figueiredo 2002), which tend to raise housing costs. Indeed, our data show that 25
percent of married adults ages 65 and older are homeowners with mortgages.
11
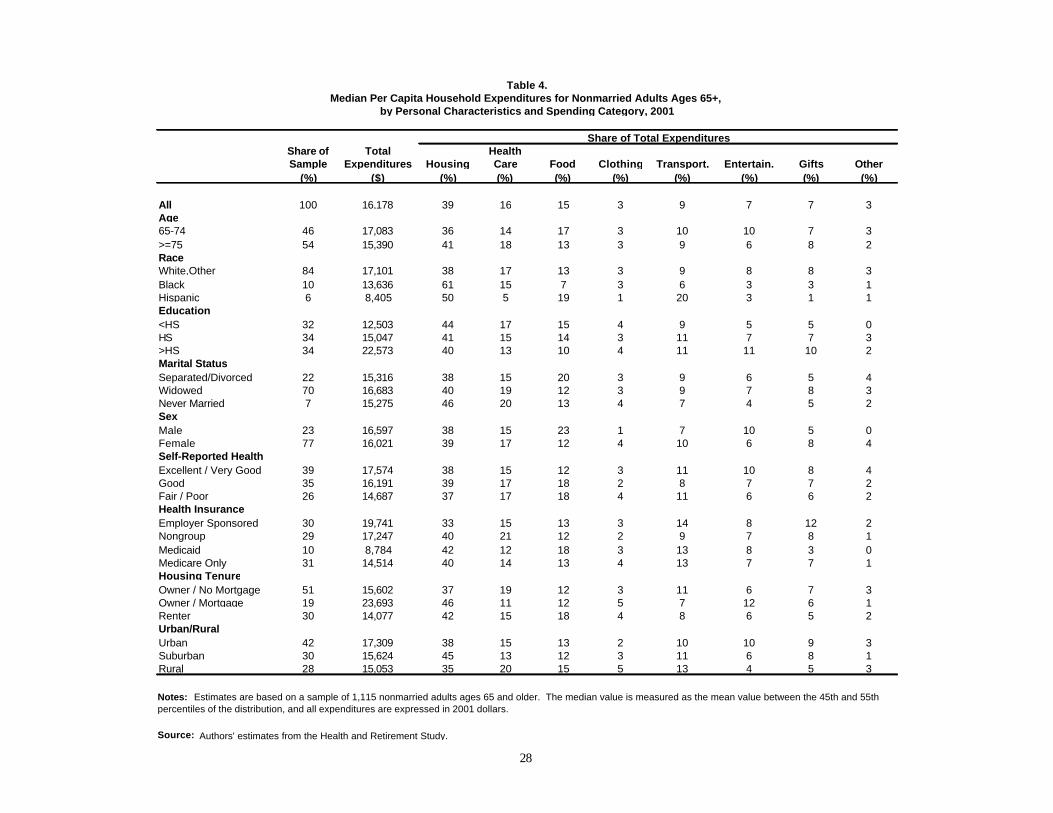
For nonmarried adults, the median value of per capita expenditures is $16,178, higher
than the level for married adults. Relative to married adults, nonmarried adults allocate larger
shares of their spending to housing (39 percent), food (15 percent), and clothing (3 percent), but
smaller shares to health care (16 percent), transportation (9 percent), entertainment and gifts (7
percent each), and other consumer durables (3 percent). Similar to married adults, housing and
health care account for more than half of total household expenditures for typical nonmarried
adults.
Given the attention paid to the burden of health care costs at older ages, it is somewhat
surprising that health care is not the largest spending category among older adults. Earlier
studies based on the Medicare Current Beneficiary Survey (MCBS) found that out-of-pocket
health care costs consume about 20 percent of income for adults ages 65 and older, and up to
one-third of income for those with limited financial resources (Caplan and Brangan 2004;
Crystal et al. 2000; Gross et al. 1999). Our estimates imply lower burdens of health care
spending, particularly for nonmarried adults (because, as we demonstrate later, typical older
adults do not spend all of their incomes). The differences between our study and previous
research appear to stem from the underreporting of income in the MCBS (Goldman and Smith
2001).
Not surprisingly, total expenditures increase with income. Married adults in the highest
income quintile consume 2.5 times more than their counterparts in the bottom income quintile.
The gap in expenditures between the highest and lowest income quintiles is even wider for
nonmarried adults. Relative to high- income groups, low-income groups allocate larger shares of
their budgets to health care and food, and smaller shares to entertainment and gifts. Rubin and
Nieswiadomy (1997) found a similar relationship in CEX data between income and both health
care and food expenditures. The authors also found that the share devoted to housing increased
with income. However, we do not find a clear relationship between income and housing
expenditures in the HRS.
12
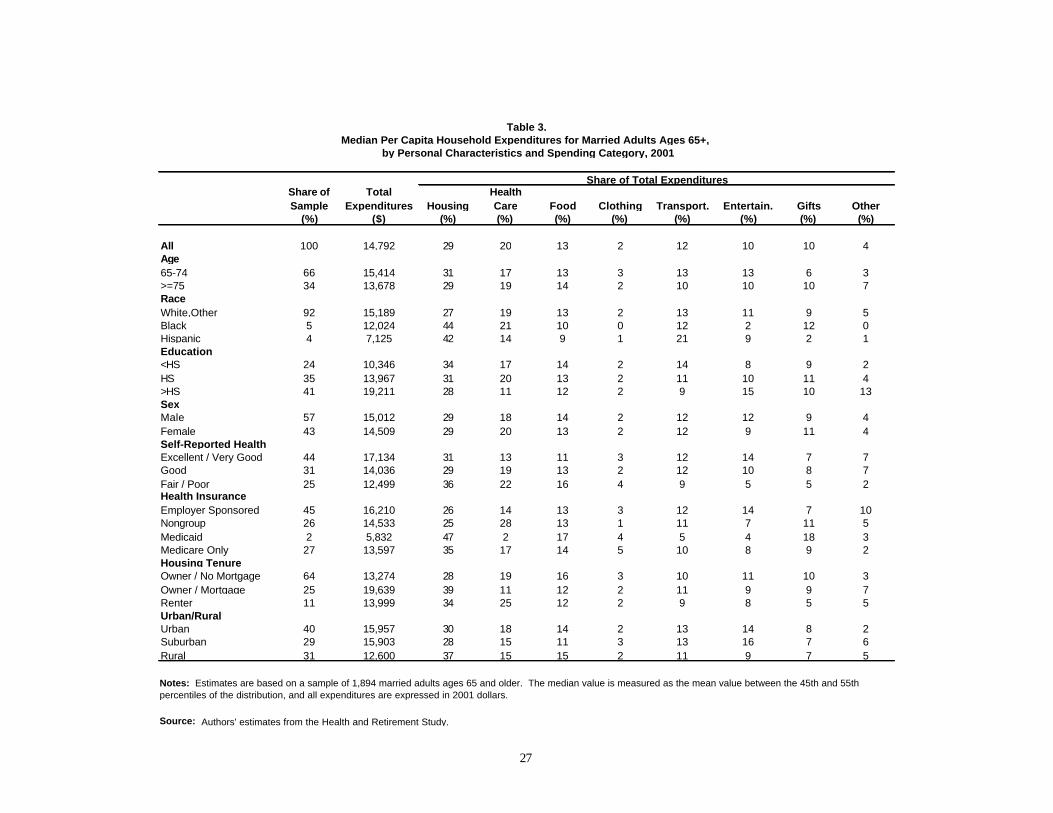
Table 3 reports per capita expenditures for married adults by personal characteristics, and
table 4 reports expenditures for nonmarried adults. There is tremendous variation in spending
patterns by personal characteristics, for both married and nonmarried adults. In general,
household spending varies directly with socioeconomic status, reflecting differences across
groups in average income levels. Groups with the highest expenses include whites, those who
completed college, those in excellent and very good health, those with employer-sponsored
health insurance, homeowners with mortgages, and those living in urban settings. In contrast,
groups with the lowest expenses include Hispanics, high school dropouts, those in fair or poor
health, Medicaid recipients, renters, and those living in rural settings. As expected, we also find
that disadvantaged groups tend to devote significantly highe r shares of their total expenses to
essential items, such as housing, and smaller shares to nonessential items, such as entertainment
and gifts. Because the patterns do not generally differ by marital status, we restrict the
discussion to married adults.
Expenditure patterns differ markedly by race and ethnicity. Married whites spend
$15,189 on a per capita basis, 26 percent more than blacks ($12,024) and 113 percent more than
Hispanics ($7,125). Married blacks and Hispanics allocate over 40 percent of total expenditures
to housing, compared with only 27 percent for whites. Blacks also spend substantially less than
whites on entertainment and other consumer durables. Hispanics, on the other hand, devote
much smaller shares of their budgets to health care, food, and gifts, and larger shares to
transportation. Using CEX data, Bahizi (2003) found similar differences by race. Specifically,
he found that blacks spend a larger share on housing than either whites or Hispanics, and
Hispanics allocate a larger percentage of their expenditures to transportation. The author also
found that blacks and Hispanics allocate a larger percentage of their expenditures to food than
whites. We find that nonmarried Hispanic adults devote disproportionate shares of their budgets
to food, but we do not find any other race and ethnicity differences in food expenditures.
The value of median expenditures among married individuals with at least some college
education is $19,211, 86 percent more than high school dropouts ($10,346) and 38 percent more
than high school graduates ($13,967). Relative to those with some college education, high
school dropouts and high school graduates allocate larger shares of their total expenditures to
13
housing, health care, and transportation, and smaller shares to entertainment, and consumer
durables.
As expected, the share of total expenditures devoted to health care is relatively large for
those with health problems, and the share devoted to housing is relatively large for homeowners
with mortgages and renters. Specifically, typical older married adults in excellent or very good
health spend $17,134, 13 percent of which they allocate to health care expenses. In contrast,
those in fair or poor health consume only $12,499, but allocate 22 percent to health care.
Additionally, typical older married adults with employer-sponsored health insurance spend
$16,210 14 percent of which they dedicate to health care expenses. Those with private non-
group insurance, however, spend only $14,533, but allocate 28 percent to health care. Finally,
typical older married homeowners with mortgages consume $19,639 and spend 39 percent on
housing. Although median renters consume only $13,999, they devote 34 percent of their
expenditures to housing. However, even homeowners who have paid off their mortgages spend
28 percent of their total expenditures on housing-related expenses.
Budget shares for housing and entertainment, in particular, vary considerably by
urbanicity. Median per capita expenditures are about $15,900 for typical older married adults
living in urban and suburban areas, who spend between 28 and 30 percent of their budgets on
housing and between 14 and 16 percent on entertainment. In contrast, median expenditures are
only $12,600 for those living in rural areas, who spend 37 percent on housing but only 9 percent
on entertainment.
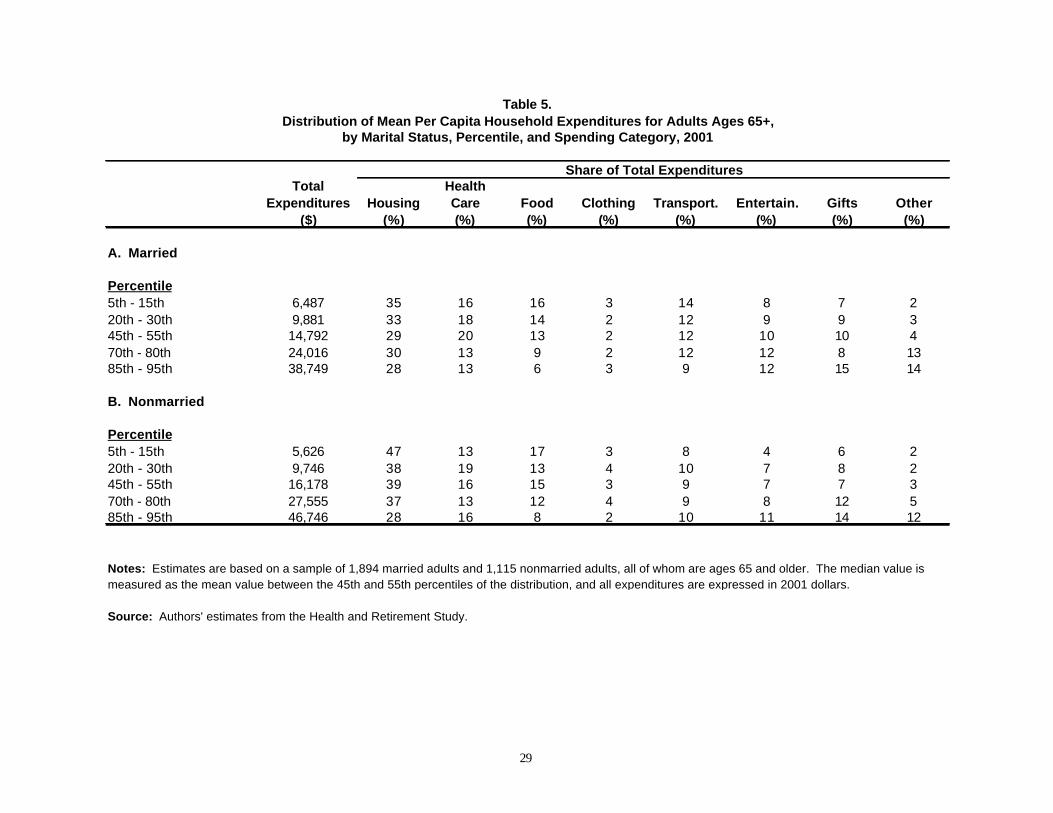
Distribution of Expenditures
Table 5 examines the distribution of per capita household expenditures and the allocation
of expenditures at different points in the distribution. Mean per capita expenditures for married
adults increase from $6,487 between the 5th and 15th percentiles of the distribution to $38,749
between the 85th and 90th percentiles. Those with lower expenditures allocate relatively more to
housing, food, and transportation. In contrast, those with higher expenditures allocate relatively
more to entertainment, gifts, and other consumer durables. The share of expenditures dedicated
14
to health care increases between the 5th-15th and 45th-55th percentiles, and then declines.
Expenditures on clothing, on the other hand, are relatively constant across the distribution.
Mean per capita expenditures for nonmarried adults increase from $5,626 between the 5th
and 15th percentiles of the distribution to $46,746 between the 85th and 90th percentiles. Similar
to married adults, those with lower expenditures allocate relatively more to housing and food,
and less to entertainment, gifts, and other consumer durables. However, expenditures on health
care, transportation, and clothing vary inconsistently across the distribution of overall
expenditures.
Finally, it is worth noting that per capita expenditures are higher for married adults than
for nonmarried adults through the 20th to 30th percentiles, and are lower thereafter. Also, the
distribution of expenditures is much more equal for married individuals than for nonmarried
individuals. For example, the ratio of mean expenditures between the 85th and 95th percentiles to
mean expenditures between the 5th and 15th percentiles is 6.0 for married adults and 8.3 for
nonmarried adults.
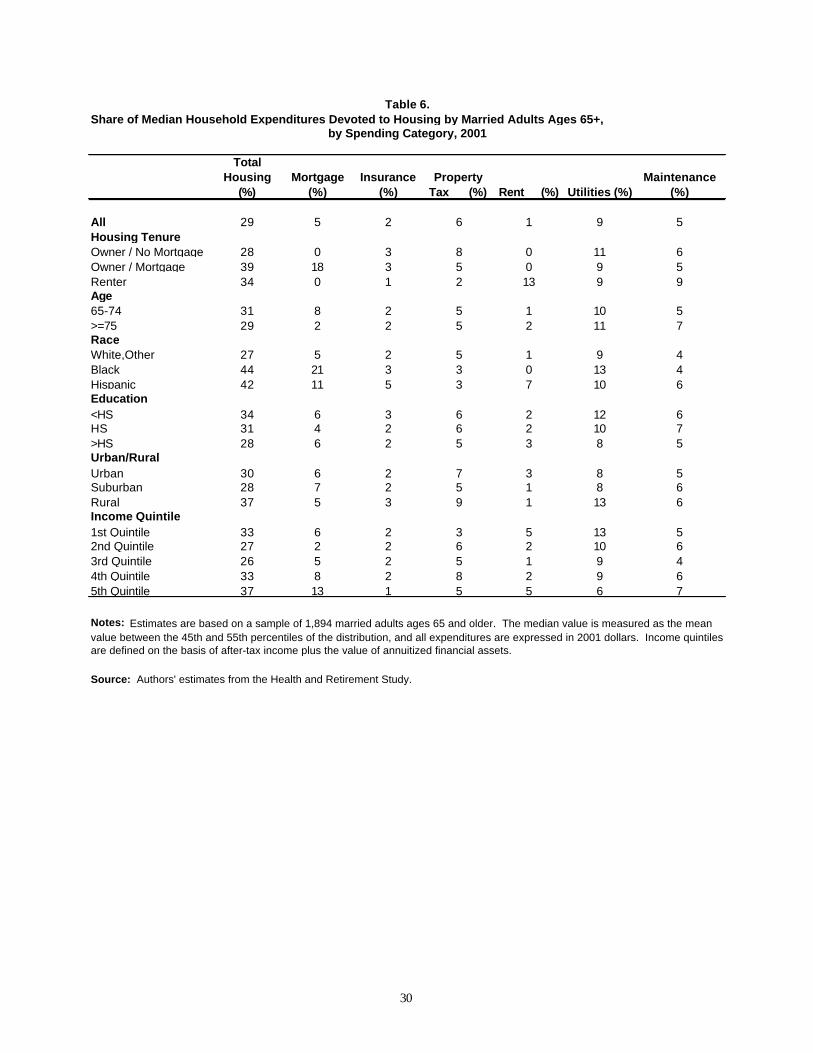
Housing Expenditures
As we have already noted, even at older ages both married and nonmarried adults devote
a disproportionate share of their total expenditures to housing. In this section, we further explore
the reason for relatively high housing expenses in later life. Table 6 shows that for married
adults utilities represent the largest housing spending category (9 percent of total expenditures),
followed by property taxes (6 percent), mortgage payments and housing maintenance (5 percent
each), insurance (2 percent), and rent (1 percent). We find that the share going to mortgages
declines with age, whereas the shares going to utilities and maintenance increase with age.
Blacks devote a disproportionate share of their total expenditures to housing because they tend to
have high mortgage payments, which represent 21 percent of total expenditures for the typical
black older married adult. Hispanics, who also allocate a larger than average share of their
overall expenditures to housing, devote 11 percent to mortgage payments and 7 percent to rent.
15
Married homeowners with mortgages, regardless of race or ethnicity, allocate 18 percent of their
total expenditures to mortgage payments. In contrast, renters allocate 13 percent of their total
expenditures to rent.
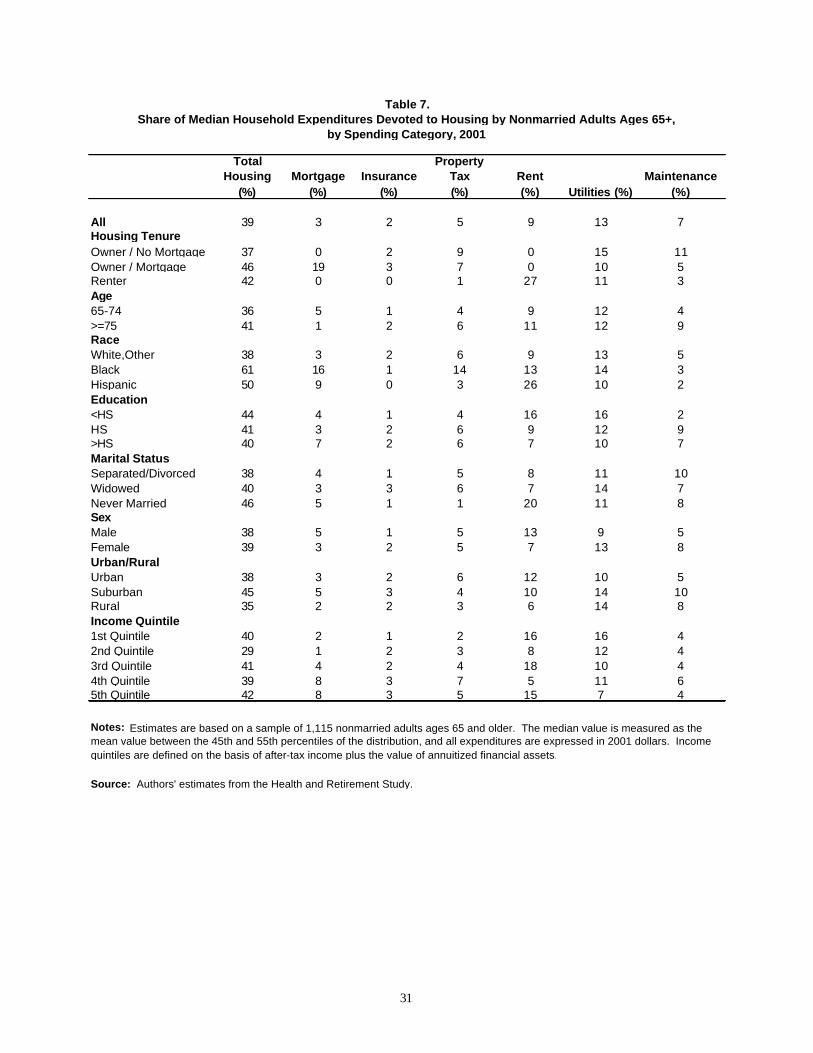
For nonmarried adults, utilities also represent the largest component of household
spending, accounting for 13 percent of total expenditures (see table 7). Rent accounts for
another 9 percent of expenditures, a much larger share than for married adults because
nonmarried individuals are nearly three times more likely to rent their homes. Nonmarred adults
also devote 7 percent of total spending to household maintenance, 5 percent to property tax, 3
percent to mortgage payments, and 2 percent to insurance.
Health Care Expenditures
For typical older adults, budget shares for health care expenses are second to housing
costs. However, health care expenditures warrant special attention because they tend to be much
more unpredictable than housing costs, especially for those without private supplemental health
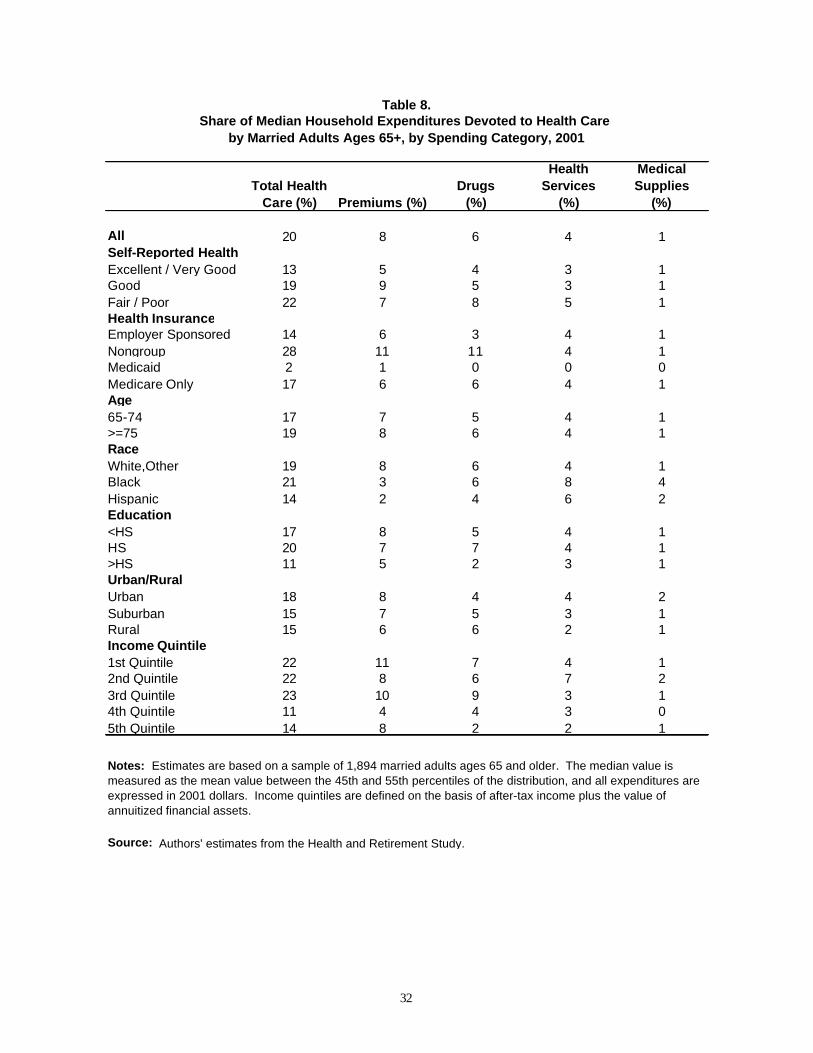
insurance. In this section, we break out the health care expenditures of older adults. Health
insurance premiums represent the largest health care spending category (8 percent of total
expenditures) for married individuals (see table 8). Additionally, they spend 6 percent on
prescription drugs, 4 percent on health services, and 1 percent on medical supplies. This find ing
is consistent with Rubin and Nieswiadomy (1997) who found that the increase in health care
expenditures between the 1980s and 1990s was driven primarily by insurance premiums,
followed by drugs and medical supplies, and health services.
Older married adults in poor health allocate twice as much of their overall spending to
prescription drugs than those in excellent or very good health. As expected, individuals with
non-group insurance spend a larger-than-average share of their overall expenditures on health
insurance premiums, but they also spend a larger-than-average share on prescription drugs.
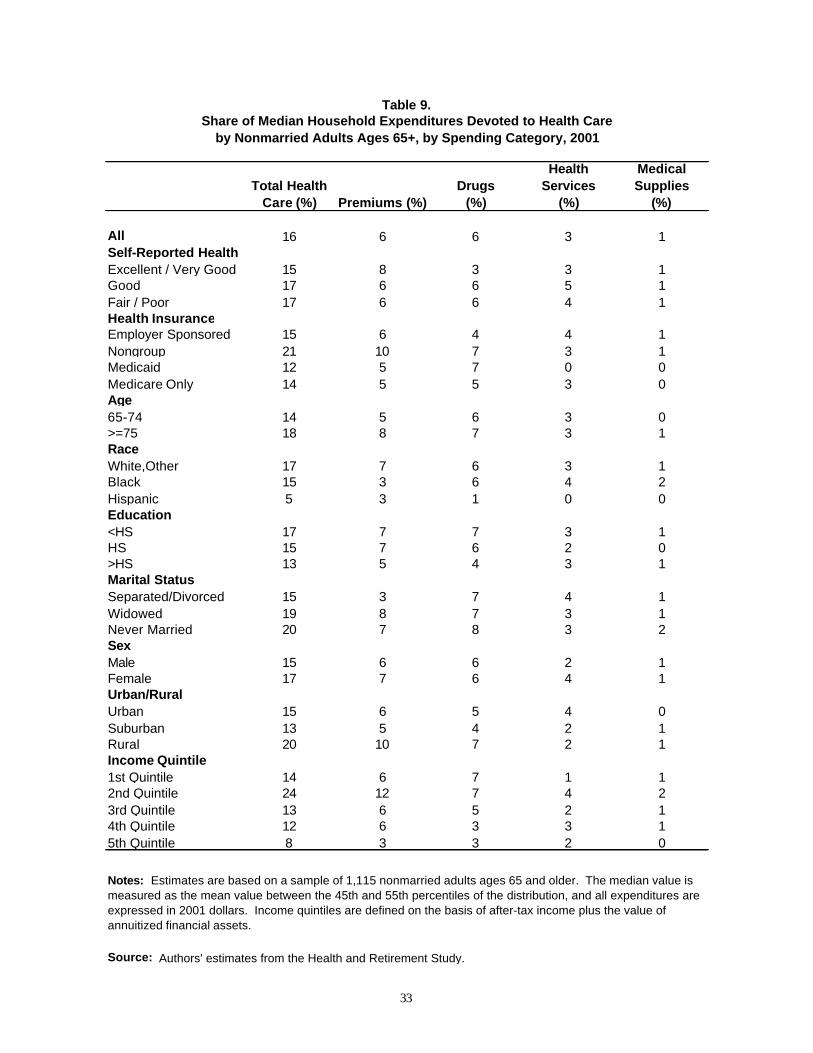
These patterns are very similar for nonmarried adults (see table 9).
16
Expenditures Relative to Income
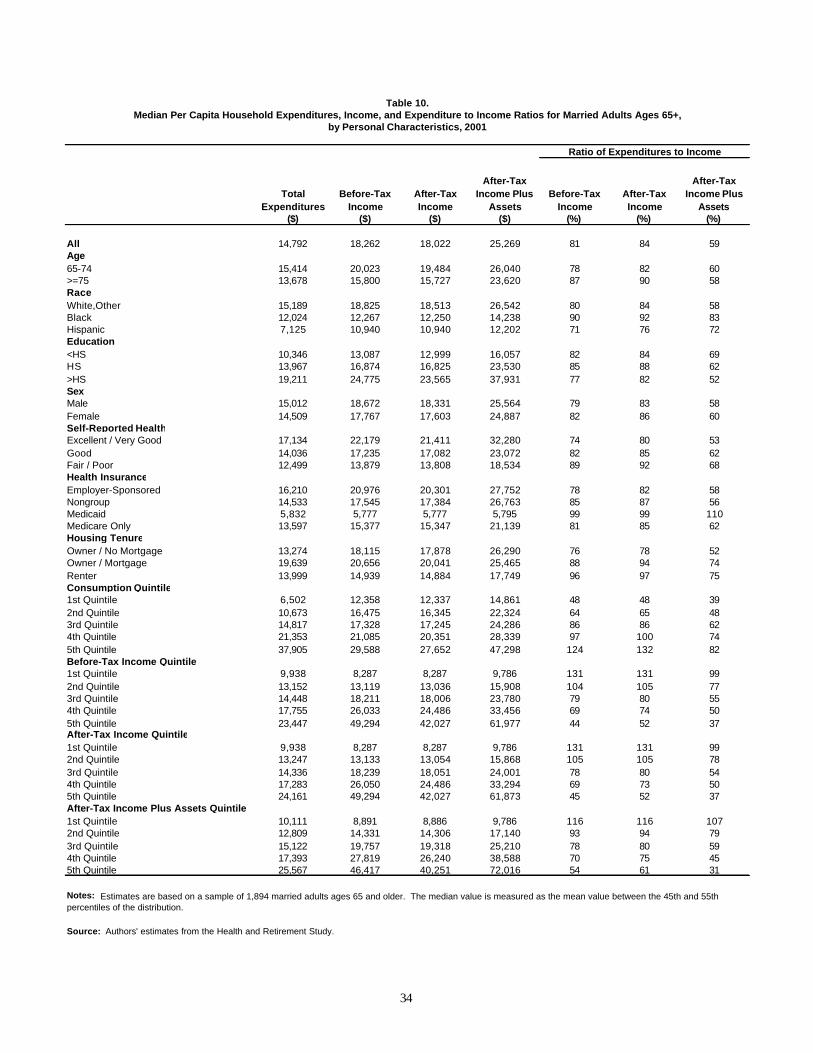
In order to assess retirement security, we consider an individual’s expenditures relative to
his or her economic resources. Table 10 compares median expenditures, before-tax income,
after-tax income, and after-tax income plus the value of annuitized assets for older married
adults, by key personal characteristics. It also reports the median ratio of expenditures to
income, for each measure of income. At the median, married adults consume 81 percent of their
before-tax income and 84 percent of their after-tax income. If we include their annuitized
financial assets in after-tax income, to better measure all of their economic resources, this share
falls to only 59 percent. Not surprisingly, the ratio of expenditures to income increases with age.
Typical married adults ages 65 to 74 spend 82 percent of their after-tax incomes, compared with
90 percent for those ages 75 and older.
Although expenditures are lower than average for many economically vulnerable
subgroups, they tend to spend relatively large shares of their income. For example, the median
value of per capita expenditures among married individuals is 26 percent higher for whites than
blacks ($15,189 vs. $12,024). However, the median value of per capita after-tax income is 53
percent higher for whites than blacks ($18,513 vs. $12,250). As a result, blacks consume larger
shares of their income than whites. For whites, expenditures amount to 84 percent of after-tax
income and 60 percent of after-tax income plus annuitized assets. In contrast, expenditures total
92 percent of after-tax income for blacks. Because blacks tend to hold fewer financial assets
than whites, their ratio of expenditures to income only drops to 83 percent after accounting for
the value of annuitized financial assets. Unlike blacks, Hispanics have much lower expenditures
than whites, and thus consume a lower-than-average share of their after-tax incomes (76
percent). Like blacks, however, they are less likely than whites to have financial assets.
Consequently, they consume a higher-than-average share of their after-tax income plus
annuitized assets (72 percent) than whites.
Similar patterns of expenditures and income are evident by education, health status,
health insurance type, housing tenure, urbanicity, expenditure level, and income level, with
disadvantaged groups consuming disproportionate shares of their incomes. Because
17
economically vulnerable groups tend to hold only limited financial assets, accounting for income
from annuitized assets magnifies the subgroup differences. In particular, high school dropouts
and high school graduates consume 69 and 62 percent of their after-tax income plus assets,
respectively, whereas college graduates consume only 52 percent of their income plus assets.
Similarly, those in fair or poor health consume 68 percent of their resources and those in good
health spend 62 percent. However, those in excellent or very good health spend only 53 percent
of their after-tax income plus assets. Although typical Medicaid recipients spend less than half
as much as other older married adults, they consume virtually all of their after-tax incomes,
because their incomes are so low. And because the median Medicaid recipient is in debt, he
spends 110 percent of his after-tax income plus net assets.
We also find that both homeowners with mortgages and renters consume about three-
quarters of their after-tax income plus assets. In contrast, homeowners without mortgages spend
only about half of their income. Although there are suburban and rural differences in
expenditures as a share of income, these mostly disappear after accounting for annuitized
financial assets.
Not surprisingly, expenditures as a share of income increase with spending and decrease
with income. Married adults in the lowest expenditure quintile consume only 39 percent of their
income plus assets, while those in the highest quintile spend 82 percent of their income.
Individuals in the lowest income quintile consume between 99 and 107 percent of their after-tax
income plus annuitized assets. In contrast, those in the highest income quintile spend between
31 and 37 percent of their income.
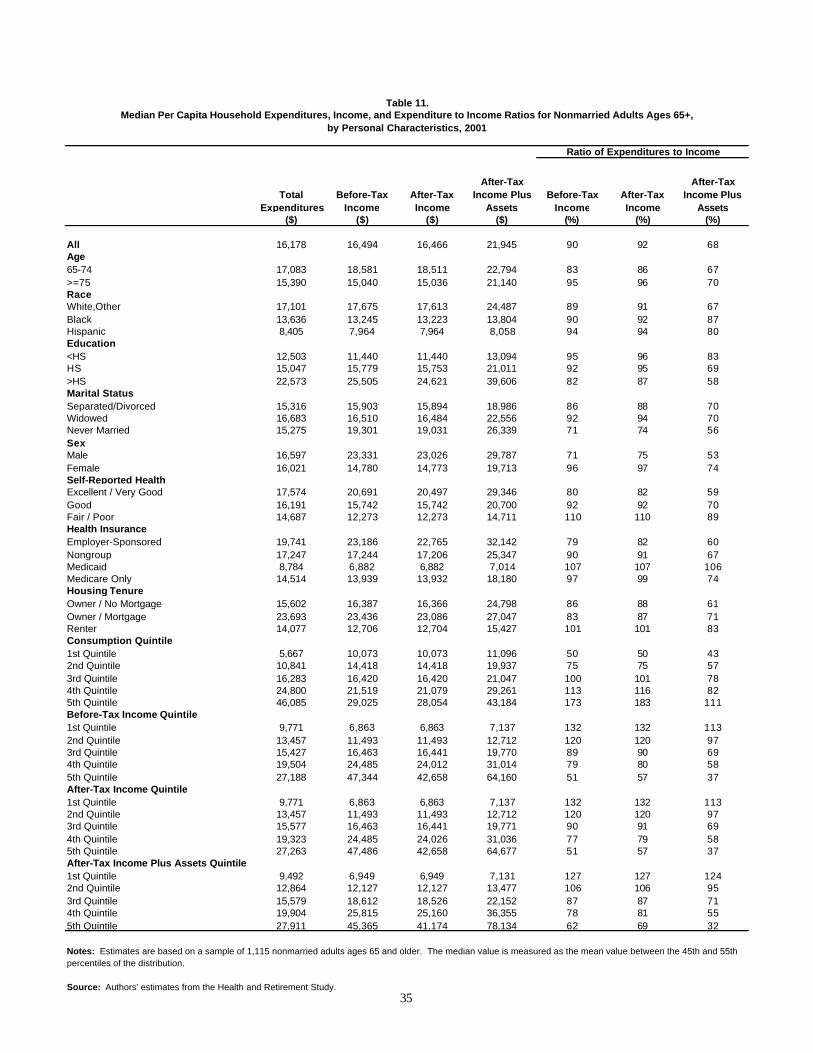
In most cases, expenditures consume larger shares of income for nonmarried adults than
for married adults (see table 11), again because nonmarried adults tend to have higher per capita
expenditures and lower per capita incomes. Median nonmarried adults ages 75 and older spend
nearly all of their after-tax incomes (96 percent), while those ages 65 to 74 spend 86 percent.
Like married adults, never married adults tend to have higher per capita incomes than other
marital groups. As a result, they consume just over half of their income plus assets, while those
who are separated, divorced, or widowed consume more than two-thirds of their resources.
18
Consumption Needs
Using information on expenditures and income, we establish minimum consumption
needs for older households and measure the share and characteristics of those who fall below
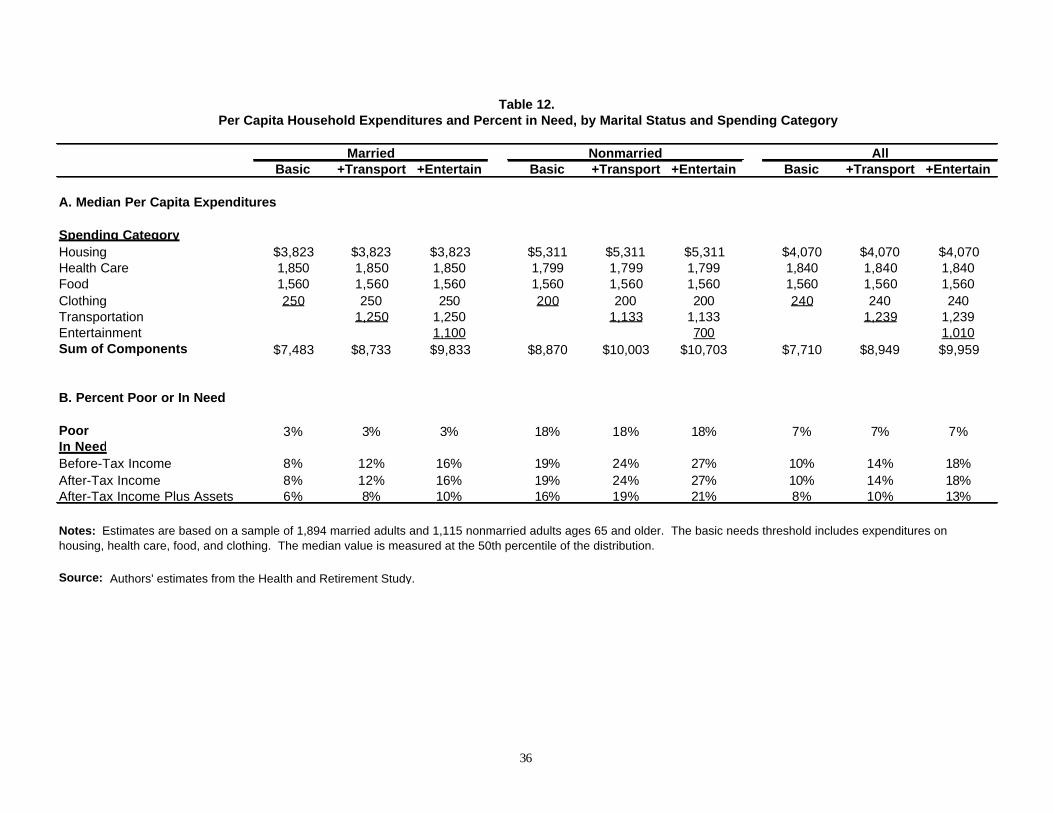
these thresholds (see table 12). The first measure captures basic needs and includes expenditures
on housing, health care, food, and clothing. For older married adults, the median value of per
capita expenditures amounts to $3,823 for housing, $1,850 for health care, $1,560 for food, and
$250 for clothing. Median expenditures on health care, food, and clothing are similar for
nonmarried adults, whereas median housing costs are about $1,500 higher for older nonmarried
adults than for their married counterparts. Our estimate of median food expenses is very close to
the cost of food under the U.S. Department of Agriculture’s Thrifty Food Plan, which the federal
government uses to allocate food stamps.3 We sum these values to construct a basic needs
threshold, which amounts to $7,483 for married individuals and $8,870 for nonmarried
individuals in 2001.
Although our measures of need reflect the ability of married people to live more
efficiently than single people, the economies of scale in household production implied by our
measures are smaller than those incorporated into the official poverty thresholds. Our estimates
imply that a married individual requires 84 percent as much income to meet basic needs as a
nonmarried person. By contrast, the official poverty thresholds imply that married older adults
need only 63 percent as much income as nonmarried people.4 It is not surprising, then, that only
3 percent of married individuals in our sample have incomes below the poverty threshold, but 8
percent have incomes below our basic needs threshold.5 The estimate based on before-tax
income comes closest to the Census Bureau’s definition of resources since it ignores taxes and
excludes potential income from assets. However, if we account for taxes and income from assets
3 In December 2001, food costs under the USDA Thrifty Food Plan were $1,536 per person for a two-person household with members aged 51 and older. They were $1,691 for a one-person male household and $1,660 for a one-person female household (U.S. Department of Agriculture, 2002). 4 In 2001, the poverty threshold was $10,715 for married couples (or $5,358 per person) and $8,494 for nonmarried people (U.S. Social Security Administration 2004). 5 Official U.S. Census (2004) estimates, based on the Current Population Survey (CPS), indicate that 10 percent of adults aged 65 and older were in poverty in 2001. This statistic is higher than our estimate of 7 percent because the CPS appears to underestimate income relative to the HRS (Hurd, Juster, and Smith 2003).
19
in our definition of resources the share in need among older married adults declines to 6 percent.
In contrast, the share of nonmarried individuals with incomes below the poverty threshold is very
similar to the share with incomes below the basic needs threshold, because the two thresholds are
quite similar.
What we include in the measure of need is somewhat subjective. One could argue that
transportation is a necessity, particularly for those who do not live in urban areas. Adding
transportation to the basket of necessary goods and services raises the threshold to $8,733 for
married individuals and increases the share in need to 12 percent (based on before-tax incomes).
For nonmarried individuals, the threshold increases to $10,003 and the share in need increases to
24 percent. Allowing for entertainment costs increases the threshold for married individuals by
over $1,000, to $9,833, and increases the share in need to 16 percent. For nonmarried
individuals, the threshold increases to $10,703 and the share in need increases to 27 percent.
One way of evaluating our thresholds for minimum needs is to consider how they
compare with subjective measures of well-being collected in the HRS. We incorporate into the
analysis responses to survey questions about whether respondents are satisfied with retirement,
whether they have enough money to buy food, and how they would change their spending if their
incomes were to rise. Overall, 68 percent of adults aged 65 and older report being very satisfied
with retirement, 97 percent report having enough money to spend on food, and 39 percent report
that they would save all or most of any extra money they received. Only 4 percent report being
dissatisfied with retirement, 3 percent report lacking sufficient money to spend on food, 17
percent report that they would spend all or most of any additional money they received, and 44
percent report being uncertain about whether they would save or spend extra income.
Regardless of the threshold we use to define minimum needs, we find that older adults
who are dissatisfied with retirement, who do not have enough money to buy food, or who would
spend any extra income if they had it are more likely to be in need than other people. For
example, after-tax income falls short of our estimate of basic consumption needs for 29 percent
of older adults who report being dissatisfied with retirement, compared with only 6 percent of
those who report being very satisfied with retirement (see table 13). Similarly, 27 percent of
20
those who report lacking enough money for food have insufficient financial resources to meet
basic consumption needs, compared with 10 percent of those who report having enough money
to buy food. Only 5 percent of older adults who say they would save all or most of any extra
money they received are in need, compared with 9 percent of those who would spend all or most
of it and 15 percent of those who are uncertain about what they would do.
V. CONCLUSIONS
Up-to-date information on the consumption needs of older Americans is crucial to
policymakers as they consider reforms to the Social Security system. While benefit cuts may be
necessary to achieve solvency, little is known about how they might affect standards of living for
aged households. Many studies have examined the level of resources available to older people
and how it is likely to change over time, but there has been remarkably little research on the
amount of resources they need to live comfortably in retirement. This research fills a critical gap
in the literature.
We find that housing and health care are the two largest spending categories. What is
somewhat surprising is that even at older ages individuals spend more on housing than health
care. However, older people appear to be increasingly likely to enter retirement with pre-
existing mortgages, or to refinance their homes in retirement to cover expenses. Indeed,
homeowners with mortgages make up nearly a quarter of our sample. These individuals have
higher-than-average expenditures and consume a higher-than-average share of their income.
While health care spending accounts for smaller shares of expenditures and income than housing,
these shares increase with age and poor health.
In order to assess retirement security, it is necessary to consider expenditures relative to
economic resources. At the median, married adults consume between 59 and 84 percent of their
household income, depending on whether income is measured before-tax or after-tax, and
whether the income measure includes annuitized assets. Nonmarried adults consume a larger
share of their income, ranging from 68 to 92 percent. In general, expenditures are lower than
21
average for economically vulnerable groups; however, but they consume a disproportionate share
of their income. Spending patterns vary less across groups than income patterns.
As policymakers consider reforms to the Social Security system, it is important to
understand how much older people need to live comfortably in retirement. To this end, we
construct a basic needs threshold consisting of housing, health care, food, and clothing
expenditures. We find that after-tax incomes fall short of our basic needs threshold for 8 percent
of married individuals in our sample, but that only 3 percent are officially considered poor. Even
when we expand our definition of resources to account for potential income from assets, the
share in need stands at 6 percent. In contrast, the share of nonmarried individuals with incomes
below the basic needs threshold is very similar to the share with incomes below the official
poverty threshold. However, when we expand our definition of minimum needs to account for
other expenditures (such as transportation and entertainment costs), the gap between those in
need and those in poverty increases for both married and nonmarried adults. Finally, we find
that older adults who report being dissatisfied with retirement, who report lacking enough money
to buy food, and who report that they would spend any extra income they might receive instead
of saving it are especially likely to fall below our basic-needs threshold. This result suggests that
many of these individuals are probably unable to meet their consumption needs.
22
REFERENCES Ameriks, John, Andrew Caplan, and John Leahy. 2002. “Retirement Consumption: Insights
from a Survey.” NBER Working Paper No. 8735. Cambridge, MA: National Bureau of Economic Research.
Bahizi, Pierre. 2003. “Retirement Expenditures for Whites, Blacks, and Persons of Hispanic
Origin.” Monthly Labor Review. June: 20-22. Banks, James, Richard Blundell, and Sarah Tanner. 1998. “Is There a Retirement-Savings
Puzzle?” American Economics Review 88(4): 769-788. Bernheim, B. Douglas, Jonathan Skinner, and Steven Weinberg. 2001. “What Accounts for the
Variation in Retirement Wealth Among U.S. Households?” American Economics Review 91(4): 832-857.
Butrica, Barbara A. and Cori E. Uccello. 2004. “How Will Boomers Fare at Retirement?”
Final Report to the AARP Public Policy Institute. Washington, D.C.: AARP. Butrica, Barbara A., Howard M. Iams, and Karen E. Smith. 2003. “It’s All Relative:
Understanding the Retirement Prospects of Baby Boomers.” CRR Working Paper No. 2003-21. Chestnut Hill, MA: Center for Retirement Research at Boston College.
Caplan, Craig, and Normandy Brangan. 2004. “Out-of-Pocket Spending on Health Care by
Medicare Beneficiaries Age 65 and Older in 2003.” AARP Data Digest. Washington, D.C.: AARP Public Policy Institute.
Citro, Constance F., and Robert T. Michael. 1995. Measuring Poverty: A New Approach.
Washington, D.C.: National Academy Press. Crystal, Stephen, Richard W. Johnson, Jeffrey Harman, Usha Sambamoorthi, and Rizie Kumar.
2000. “Out-of-Pocket Health Care Costs Among Older Americans.” Journals of Gerontology: Social Sciences 55B (1): S51-S62.
Easterlin, Richard A., Christine MacDonald, and Diane J. Macunovich. 1990. “Retirement
Prospects of the Baby Boom Generation: A Different Perspective.” The Gerontologist 30(6): 776–783.
Easterlin, Richard A., Christine M. Schaeffer, and Diane J. Macunovich. 1993. “Will the Baby
Boomers be Less Well Off Than Their Parents? Income, Wealth, and Family Circumstances Over the Life Cycle in the United States.” Population and Development Review 19(3): 497–522.
Gist, John, and Carlos Figueiredo. 2002. “Deeper in Debt Redux: Housing and Nonhousing
Debt Burdens.” AARP Data Digest. Washington, D.C.: AARP Public Policy Institute.
23
Goldman, Dana P., and James P. Smith. 2001. “Methodological Biases in Estimating the Burden
of Out-of-Pocket Expenses.” Health Services Research 35(6): 1357-1370. Goldman, Dana P., and Julie M. Zissimopoulos. 2003. “High Out-of-Pocket Health Care
Spending by the Elderly.” Health Affairs 22(3): 194-202. Gross, David J., Lisa Alecxih, Mary Jo Gibson, John Corea, Craig Caplan, and Normandy
Brangan. 1999. “Out-of-Pocket Health Spending by Poor and Near-Poor Elderly Medicare Beneficiaries.” Health Services Research 34(1): 241-254.
Gustman, Alan L., and Thomas L. Steinmeier. 1999. “Effects of Pensions on Savings: Analysis
with Data from the Health and Retirement Study.” Carnegie-Rochester Conference Series 50(July): 271–326.
Hamermesh, Daniel S. 1984. “Consumption During Retirement: The Missing Link in the Life
Cycle.” Review of Economics and Statistics 66(1): 1-7. Haveman, Robert, Karen Holden, Barbara Wolfe, and Shane Sherlund. 2003. “Have Newly
Retired Workers in the U.S. Saved Enough to Maintain Well-Being Through Retirement Years?” Paper presented at 2003 Annual APPAM Research Conference, Washington, D.C.
Hurd, Michael, F. Thomas Juster, James P. Smith. 2003. “Enhancing the Quality of Data on
Income: Recent Innovations from the HRS.” Journal of Human Resources 38(3): 758-772.
Hurd, Michael, and Susann Rohwedder. 2003. “The Retirement-Consumption Puzzle:
Anticipated and Actual Declines in Spending at Retirement.” NBER Working Paper No. 9586. Cambridge, MA: Nationa l Bureau of Economic Research.
Paulin, Geoffrey D. and Abby L. Duly. 2002. “Planning Ahead: Consumer Expenditure
Patterns in Retirement.” Monthly Labor Review. July: 38-58. Paulin, Geoffrey D. 2000. “Expenditure Patterns of Older Americans, 1984-97.” Monthly
Labor Review. May: 3-28. Rubin, Rose M. and Michael L. Nieswiadomy. 1997. Expenditures of Older Americans.
Westport, CT: Praeger. Sabelhaus, John, and Joyce Manchester. 1995. “Baby Boomers and Their Parents: How Does
Their Economic Well-Being Compare in Middle Age?” The Journal of Human Resources 30(4): 791–806.
Smith, Karen E. 2002. “How Will Recent Patterns of Earnings Inequality Affect Future
Retirement Incomes?” Final Report for AARP. Washington, DC: The Urban Institute.
24
Uccello, Cori E. 2001. “Are Americans Saving Enough for Retirement?” Issue Brief No. 7.
Center for Retirement Research at Boston College. U.S. Census Bureau. 2004. “Historical Poverty Tables.”
http://www.census.gov/hhes/poverty/histpov/hstpov3.html (Accessed December 6, 2004).
U.S. Social Security Administration. 2004. Annual Statistical Supplement to the Social Security
Bulletin, 2003. Washington, DC: U.S. Social Security Administration. U.S. Department of Agriculture. 2002. “Official USDA Food Plans: Cost of Food at Home at
Four Level, U.S. Average, December 2001.” http://www.usda.gov/cnpp/FoodPlans/Updates/fooddec01.pdf (Accessed December 6, 2004).
25
Median Per Capita Household Expenditures and Income, by Living Arrangement, Marital Status, and Age
53-64 65-74 >=75 53-64 65-74 >=75 53-64 65-74 >=75
A. All
Median LevelExpenditures $17,409 $15,414 $13,678 $17,196 $17,083 $15,390 $17,350 $15,681 $14,179Before-Tax Income 30,898 20,023 15,800 24,683 18,581 15,040 29,758 19,764 15,594After-Tax Income 27,701 19,484 15,727 23,118 18,511 15,036 26,948 19,337 15,563After-Tax Income Plus Assets 31,366 26,040 23,620 26,070 22,794 21,140 30,436 25,434 22,809
Median Share of ExpendituresHousing 36% 31% 29% 37% 36% 41% 36% 32% 32%Health Care 12% 17% 19% 11% 14% 18% 12% 16% 20%Food 10% 13% 14% 13% 17% 13% 11% 14% 13%Clothing 5% 3% 2% 5% 3% 3% 5% 3% 2%Transportation 14% 13% 10% 13% 10% 9% 14% 12% 12%Entertainment 10% 13% 10% 13% 10% 6% 11% 13% 8%Gifts 8% 6% 10% 5% 7% 8% 7% 6% 9%Other 6% 3% 7% 3% 3% 2% 5% 4% 5%
Number of Observations 1,742 1,286 608 615 506 609 2,357 1,792 1,217
B. Excludes Adults Living with Nonspouses
Median LevelExpenditures $20,784 $16,897 $14,056 $24,212 $20,431 $17,856 $21,314 $17,459 $15,070Before-Tax Income 32,604 20,719 15,624 27,856 18,360 15,053 31,781 20,341 15,492After-Tax Income 29,115 20,039 15,562 25,768 18,300 15,047 28,477 19,787 15,445After-Tax Income Plus Assets 34,100 27,942 24,018 29,385 23,356 22,355 33,167 27,324 23,476
Median Share of ExpendituresHousing 29% 32% 28% 42% 35% 38% 33% 33% 29%Health Care 12% 14% 21% 10% 15% 19% 12% 13% 20%Food 12% 12% 13% 11% 12% 11% 12% 12% 13%Clothing 4% 3% 2% 4% 5% 3% 3% 3% 2%Transportation 15% 12% 10% 11% 13% 10% 14% 12% 12%Entertainment 15% 15% 10% 13% 8% 7% 14% 13% 7%Gifts 8% 7% 10% 6% 9% 10% 8% 8% 9%Other 5% 5% 7% 1% 2% 2% 4% 6% 6%
Number of Observations 1,142 1,019 541 333 340 471 1,475 1,359 1,012
Note. The median value is measured as the mean value between the 45th and 55th percentiles of the distribution.
Source: Authors' estimates from the Health and Retirement Study.
AllMarried Nonmarried
Table 1.
26
Share of Sample
Total Expenditures Housing
Health Care Food Clothing Transport. Entertain. Gifts Other
(%) ($) (%) (%) (%) (%) (%) (%) (%) (%)
A. Married
All 100 14,792 29 20 13 2 12 10 10 4Income Quintile 1st Quintile 20 10,111 33 22 13 1 10 8 5 82nd Quintile 20 12,809 27 22 18 2 10 11 9 13rd Quintile 20 15,122 26 23 13 3 12 14 8 14th Quintile 20 17,393 33 11 11 3 12 18 6 55th Quintile 20 25,567 37 14 9 2 10 13 12 3
B. Nonmarried
All 100 16,178 39 16 15 3 9 7 7 3Income Quintile 1st Quintile 20 9,492 40 14 20 5 9 5 7 02nd Quintile 20 12,864 29 24 17 8 8 7 6 13rd Quintile 20 15,579 41 13 11 3 12 8 10 24th Quintile 20 19,904 39 12 12 3 12 13 8 25th Quintile 20 27,911 42 8 11 2 6 10 18 3
Source: Authors' estimates from the Health and Retirement Study.
Table 2.
Share of Total Expenditures
Notes: Estimates are based on a sample of 1,894 married adults and 1,115 nonmarried adults, all of whom are ages 65 and older. The median value is measured as the mean value between the 45th and 55th percentiles of the distribution, and all expenditures are expressed in 2001 dollars. Income quintiles are defined on the basis of after-tax income plus the value of annuitized financial assets.
by Marital Status, Income Quintile, and Spending Category, 2001Median Per Capita Household Expenditures for Adults Ages 65+,
27
Share of Sample
Total Expenditures Housing
Health Care Food Clothing Transport. Entertain. Gifts Other
(%) ($) (%) (%) (%) (%) (%) (%) (%) (%)
All 100 14,792 29 20 13 2 12 10 10 4Age65-74 66 15,414 31 17 13 3 13 13 6 3>=75 34 13,678 29 19 14 2 10 10 10 7Race White,Other 92 15,189 27 19 13 2 13 11 9 5Black 5 12,024 44 21 10 0 12 2 12 0Hispanic 4 7,125 42 14 9 1 21 9 2 1Education <HS 24 10,346 34 17 14 2 14 8 9 2HS 35 13,967 31 20 13 2 11 10 11 4>HS 41 19,211 28 11 12 2 9 15 10 13Sex Male 57 15,012 29 18 14 2 12 12 9 4Female 43 14,509 29 20 13 2 12 9 11 4Self-Reported Health Excellent / Very Good 44 17,134 31 13 11 3 12 14 7 7Good 31 14,036 29 19 13 2 12 10 8 7Fair / Poor 25 12,499 36 22 16 4 9 5 5 2Health Insurance Employer Sponsored 45 16,210 26 14 13 3 12 14 7 10Nongroup 26 14,533 25 28 13 1 11 7 11 5Medicaid 2 5,832 47 2 17 4 5 4 18 3Medicare Only 27 13,597 35 17 14 5 10 8 9 2Housing Tenure Owner / No Mortgage 64 13,274 28 19 16 3 10 11 10 3Owner / Mortgage 25 19,639 39 11 12 2 11 9 9 7Renter 11 13,999 34 25 12 2 9 8 5 5Urban/Rural Urban 40 15,957 30 18 14 2 13 14 8 2Suburban 29 15,903 28 15 11 3 13 16 7 6Rural 31 12,600 37 15 15 2 11 9 7 5
Source: Authors' estimates from the Health and Retirement Study.
Share of Total Expenditures
Notes: Estimates are based on a sample of 1,894 married adults ages 65 and older. The median value is measured as the mean value between the 45th and 55th percentiles of the distribution, and all expenditures are expressed in 2001 dollars.
Table 3.Median Per Capita Household Expenditures for Married Adults Ages 65+,
by Personal Characteristics and Spending Category, 2001
28
Share of Sample
Total Expenditures Housing
Health Care Food Clothing Transport. Entertain. Gifts Other
(%) ($) (%) (%) (%) (%) (%) (%) (%) (%)
All 100 16,178 39 16 15 3 9 7 7 3Age65-74 46 17,083 36 14 17 3 10 10 7 3>=75 54 15,390 41 18 13 3 9 6 8 2Race White,Other 84 17,101 38 17 13 3 9 8 8 3Black 10 13,636 61 15 7 3 6 3 3 1Hispanic 6 8,405 50 5 19 1 20 3 1 1Education <HS 32 12,503 44 17 15 4 9 5 5 0HS 34 15,047 41 15 14 3 11 7 7 3>HS 34 22,573 40 13 10 4 11 11 10 2Marital Status Separated/Divorced 22 15,316 38 15 20 3 9 6 5 4Widowed 70 16,683 40 19 12 3 9 7 8 3Never Married 7 15,275 46 20 13 4 7 4 5 2Sex Male 23 16,597 38 15 23 1 7 10 5 0Female 77 16,021 39 17 12 4 10 6 8 4Self-Reported Health Excellent / Very Good 39 17,574 38 15 12 3 11 10 8 4Good 35 16,191 39 17 18 2 8 7 7 2Fair / Poor 26 14,687 37 17 18 4 11 6 6 2Health Insurance Employer Sponsored 30 19,741 33 15 13 3 14 8 12 2Nongroup 29 17,247 40 21 12 2 9 7 8 1Medicaid 10 8,784 42 12 18 3 13 8 3 0Medicare Only 31 14,514 40 14 13 4 13 7 7 1Housing Tenure Owner / No Mortgage 51 15,602 37 19 12 3 11 6 7 3Owner / Mortgage 19 23,693 46 11 12 5 7 12 6 1Renter 30 14,077 42 15 18 4 8 6 5 2Urban/Rural Urban 42 17,309 38 15 13 2 10 10 9 3Suburban 30 15,624 45 13 12 3 11 6 8 1Rural 28 15,053 35 20 15 5 13 4 5 3
Source: Authors' estimates from the Health and Retirement Study.
Share of Total Expenditures
Notes: Estimates are based on a sample of 1,115 nonmarried adults ages 65 and older. The median value is measured as the mean value between the 45th and 55th percentiles of the distribution, and all expenditures are expressed in 2001 dollars.
Table 4.Median Per Capita Household Expenditures for Nonmarried Adults Ages 65+,
by Personal Characteristics and Spending Category, 2001
29
Total Expenditures Housing
Health Care Food Clothing Transport. Entertain. Gifts Other
($) (%) (%) (%) (%) (%) (%) (%) (%)
A. Married
Percentile5th - 15th 6,487 35 16 16 3 14 8 7 220th - 30th 9,881 33 18 14 2 12 9 9 345th - 55th 14,792 29 20 13 2 12 10 10 470th - 80th 24,016 30 13 9 2 12 12 8 1385th - 95th 38,749 28 13 6 3 9 12 15 14
B. Nonmarried
Percentile5th - 15th 5,626 47 13 17 3 8 4 6 220th - 30th 9,746 38 19 13 4 10 7 8 245th - 55th 16,178 39 16 15 3 9 7 7 370th - 80th 27,555 37 13 12 4 9 8 12 585th - 95th 46,746 28 16 8 2 10 11 14 12
Source: Authors' estimates from the Health and Retirement Study.
Share of Total Expenditures
Notes: Estimates are based on a sample of 1,894 married adults and 1,115 nonmarried adults, all of whom are ages 65 and older. The median value is measured as the mean value between the 45th and 55th percentiles of the distribution, and all expenditures are expressed in 2001 dollars.
Table 5.Distribution of Mean Per Capita Household Expenditures for Adults Ages 65+,
by Marital Status, Percentile, and Spending Category, 2001
30
Share of Median Household Expenditures Devoted to Housing by Married Adults Ages 65+,
Total Housing
(%)Mortgage
(%)Insurance
(%)Property
Tax (%) Rent (%) Utilities (%)Maintenance
(%)
All 29 5 2 6 1 9 5Housing TenureOwner / No Mortgage 28 0 3 8 0 11 6Owner / Mortgage 39 18 3 5 0 9 5Renter 34 0 1 2 13 9 9Age65-74 31 8 2 5 1 10 5>=75 29 2 2 5 2 11 7RaceWhite,Other 27 5 2 5 1 9 4Black 44 21 3 3 0 13 4Hispanic 42 11 5 3 7 10 6Education<HS 34 6 3 6 2 12 6HS 31 4 2 6 2 10 7>HS 28 6 2 5 3 8 5Urban/RuralUrban 30 6 2 7 3 8 5Suburban 28 7 2 5 1 8 6Rural 37 5 3 9 1 13 6Income Quintile1st Quintile 33 6 2 3 5 13 52nd Quintile 27 2 2 6 2 10 63rd Quintile 26 5 2 5 1 9 44th Quintile 33 8 2 8 2 9 65th Quintile 37 13 1 5 5 6 7
Source: Authors' estimates from the Health and Retirement Study.
Notes: Estimates are based on a sample of 1,894 married adults ages 65 and older. The median value is measured as the mean value between the 45th and 55th percentiles of the distribution, and all expenditures are expressed in 2001 dollars. Income quintiles are defined on the basis of after-tax income plus the value of annuitized financial assets.
Table 6.
by Spending Category, 2001
31
Total Housing
(%)Mortgage
(%)Insurance
(%)
Property Tax (%)
Rent (%) Utilities (%)
Maintenance (%)
All 39 3 2 5 9 13 7Housing TenureOwner / No Mortgage 37 0 2 9 0 15 11Owner / Mortgage 46 19 3 7 0 10 5Renter 42 0 0 1 27 11 3Age65-74 36 5 1 4 9 12 4>=75 41 1 2 6 11 12 9RaceWhite,Other 38 3 2 6 9 13 5Black 61 16 1 14 13 14 3Hispanic 50 9 0 3 26 10 2Education<HS 44 4 1 4 16 16 2HS 41 3 2 6 9 12 9>HS 40 7 2 6 7 10 7Marital StatusSeparated/Divorced 38 4 1 5 8 11 10Widowed 40 3 3 6 7 14 7Never Married 46 5 1 1 20 11 8SexMale 38 5 1 5 13 9 5Female 39 3 2 5 7 13 8Urban/RuralUrban 38 3 2 6 12 10 5Suburban 45 5 3 4 10 14 10Rural 35 2 2 3 6 14 8Income Quintile1st Quintile 40 2 1 2 16 16 42nd Quintile 29 1 2 3 8 12 43rd Quintile 41 4 2 4 18 10 44th Quintile 39 8 3 7 5 11 65th Quintile 42 8 3 5 15 7 4
Source: Authors' estimates from the Health and Retirement Study.
Notes: Estimates are based on a sample of 1,115 nonmarried adults ages 65 and older. The median value is measured as the mean value between the 45th and 55th percentiles of the distribution, and all expenditures are expressed in 2001 dollars. Income quintiles are defined on the basis of after-tax income plus the value of annuitized financial assets.
Table 7.
by Spending Category, 2001Share of Median Household Expenditures Devoted to Housing by Nonmarried Adults Ages 65+,
32
Total Health Care (%) Premiums (%)
Drugs (%)
Health Services
(%)
Medical Supplies
(%)
All 20 8 6 4 1Self-Reported HealthExcellent / Very Good 13 5 4 3 1Good 19 9 5 3 1Fair / Poor 22 7 8 5 1Health InsuranceEmployer Sponsored 14 6 3 4 1Nongroup 28 11 11 4 1Medicaid 2 1 0 0 0Medicare Only 17 6 6 4 1Age65-74 17 7 5 4 1>=75 19 8 6 4 1RaceWhite,Other 19 8 6 4 1Black 21 3 6 8 4Hispanic 14 2 4 6 2Education<HS 17 8 5 4 1HS 20 7 7 4 1>HS 11 5 2 3 1Urban/RuralUrban 18 8 4 4 2Suburban 15 7 5 3 1Rural 15 6 6 2 1Income Quintile1st Quintile 22 11 7 4 12nd Quintile 22 8 6 7 23rd Quintile 23 10 9 3 14th Quintile 11 4 4 3 05th Quintile 14 8 2 2 1
Source: Authors' estimates from the Health and Retirement Study.
Notes: Estimates are based on a sample of 1,894 married adults ages 65 and older. The median value is measured as the mean value between the 45th and 55th percentiles of the distribution, and all expenditures are expressed in 2001 dollars. Income quintiles are defined on the basis of after-tax income plus the value of annuitized financial assets.
Table 8.Share of Median Household Expenditures Devoted to Health Care
by Married Adults Ages 65+, by Spending Category, 2001
33
Total Health Care (%) Premiums (%)
Drugs (%)
Health Services
(%)
Medical Supplies
(%)
All 16 6 6 3 1Self-Reported HealthExcellent / Very Good 15 8 3 3 1Good 17 6 6 5 1Fair / Poor 17 6 6 4 1Health InsuranceEmployer Sponsored 15 6 4 4 1Nongroup 21 10 7 3 1Medicaid 12 5 7 0 0Medicare Only 14 5 5 3 0Age65-74 14 5 6 3 0>=75 18 8 7 3 1RaceWhite,Other 17 7 6 3 1Black 15 3 6 4 2Hispanic 5 3 1 0 0Education<HS 17 7 7 3 1HS 15 7 6 2 0>HS 13 5 4 3 1Marital StatusSeparated/Divorced 15 3 7 4 1Widowed 19 8 7 3 1Never Married 20 7 8 3 2SexMale 15 6 6 2 1Female 17 7 6 4 1Urban/RuralUrban 15 6 5 4 0Suburban 13 5 4 2 1Rural 20 10 7 2 1Income Quintile1st Quintile 14 6 7 1 12nd Quintile 24 12 7 4 23rd Quintile 13 6 5 2 14th Quintile 12 6 3 3 15th Quintile 8 3 3 2 0
Source: Authors' estimates from the Health and Retirement Study.
Notes: Estimates are based on a sample of 1,115 nonmarried adults ages 65 and older. The median value is measured as the mean value between the 45th and 55th percentiles of the distribution, and all expenditures are expressed in 2001 dollars. Income quintiles are defined on the basis of after-tax income plus the value of annuitized financial assets.
Table 9.Share of Median Household Expenditures Devoted to Health Care
by Nonmarried Adults Ages 65+, by Spending Category, 2001
34
Total Expenditures
Before-Tax Income
After-Tax Income
After-Tax Income Plus
AssetsBefore-Tax
IncomeAfter-Tax Income
After-Tax Income Plus
Assets($) ($) ($) ($) (%) (%) (%)
All 14,792 18,262 18,022 25,269 81 84 59Age65-74 15,414 20,023 19,484 26,040 78 82 60>=75 13,678 15,800 15,727 23,620 87 90 58RaceWhite,Other 15,189 18,825 18,513 26,542 80 84 58Black 12,024 12,267 12,250 14,238 90 92 83Hispanic 7,125 10,940 10,940 12,202 71 76 72Education<HS 10,346 13,087 12,999 16,057 82 84 69HS 13,967 16,874 16,825 23,530 85 88 62>HS 19,211 24,775 23,565 37,931 77 82 52SexMale 15,012 18,672 18,331 25,564 79 83 58Female 14,509 17,767 17,603 24,887 82 86 60Self-Reported HealthExcellent / Very Good 17,134 22,179 21,411 32,280 74 80 53Good 14,036 17,235 17,082 23,072 82 85 62Fair / Poor 12,499 13,879 13,808 18,534 89 92 68Health InsuranceEmployer-Sponsored 16,210 20,976 20,301 27,752 78 82 58Nongroup 14,533 17,545 17,384 26,763 85 87 56Medicaid 5,832 5,777 5,777 5,795 99 99 110Medicare Only 13,597 15,377 15,347 21,139 81 85 62Housing TenureOwner / No Mortgage 13,274 18,115 17,878 26,290 76 78 52Owner / Mortgage 19,639 20,656 20,041 25,465 88 94 74Renter 13,999 14,939 14,884 17,749 96 97 75Consumption Quintile1st Quintile 6,502 12,358 12,337 14,861 48 48 392nd Quintile 10,673 16,475 16,345 22,324 64 65 483rd Quintile 14,817 17,328 17,245 24,286 86 86 624th Quintile 21,353 21,085 20,351 28,339 97 100 745th Quintile 37,905 29,588 27,652 47,298 124 132 82Before-Tax Income Quintile1st Quintile 9,938 8,287 8,287 9,786 131 131 992nd Quintile 13,152 13,119 13,036 15,908 104 105 773rd Quintile 14,448 18,211 18,006 23,780 79 80 554th Quintile 17,755 26,033 24,486 33,456 69 74 505th Quintile 23,447 49,294 42,027 61,977 44 52 37After-Tax Income Quintile1st Quintile 9,938 8,287 8,287 9,786 131 131 992nd Quintile 13,247 13,133 13,054 15,868 105 105 783rd Quintile 14,336 18,239 18,051 24,001 78 80 544th Quintile 17,283 26,050 24,486 33,294 69 73 505th Quintile 24,161 49,294 42,027 61,873 45 52 37After-Tax Income Plus Assets Quintile1st Quintile 10,111 8,891 8,886 9,786 116 116 1072nd Quintile 12,809 14,331 14,306 17,140 93 94 793rd Quintile 15,122 19,757 19,318 25,210 78 80 594th Quintile 17,393 27,819 26,240 38,588 70 75 455th Quintile 25,567 46,417 40,251 72,016 54 61 31
Source: Authors' estimates from the Health and Retirement Study.
Notes: Estimates are based on a sample of 1,894 married adults ages 65 and older. The median value is measured as the mean value between the 45th and 55th percentiles of the distribution.
Median Per Capita Household Expenditures, Income, and Expenditure to Income Ratios for Married Adults Ages 65+,
Ratio of Expenditures to Income
Table 10.
by Personal Characteristics, 2001
35
Total Expenditures
Before-Tax Income
After-Tax Income
After-Tax Income Plus
AssetsBefore-Tax
IncomeAfter-Tax Income
After-Tax Income Plus
Assets($) ($) ($) ($) (%) (%) (%)
All 16,178 16,494 16,466 21,945 90 92 68Age65-74 17,083 18,581 18,511 22,794 83 86 67>=75 15,390 15,040 15,036 21,140 95 96 70RaceWhite,Other 17,101 17,675 17,613 24,487 89 91 67Black 13,636 13,245 13,223 13,804 90 92 87Hispanic 8,405 7,964 7,964 8,058 94 94 80Education<HS 12,503 11,440 11,440 13,094 95 96 83HS 15,047 15,779 15,753 21,011 92 95 69>HS 22,573 25,505 24,621 39,606 82 87 58Marital StatusSeparated/Divorced 15,316 15,903 15,894 18,986 86 88 70Widowed 16,683 16,510 16,484 22,556 92 94 70Never Married 15,275 19,301 19,031 26,339 71 74 56SexMale 16,597 23,331 23,026 29,787 71 75 53Female 16,021 14,780 14,773 19,713 96 97 74Self-Reported HealthExcellent / Very Good 17,574 20,691 20,497 29,346 80 82 59Good 16,191 15,742 15,742 20,700 92 92 70Fair / Poor 14,687 12,273 12,273 14,711 110 110 89Health InsuranceEmployer-Sponsored 19,741 23,186 22,765 32,142 79 82 60Nongroup 17,247 17,244 17,206 25,347 90 91 67Medicaid 8,784 6,882 6,882 7,014 107 107 106Medicare Only 14,514 13,939 13,932 18,180 97 99 74Housing TenureOwner / No Mortgage 15,602 16,387 16,366 24,798 86 88 61Owner / Mortgage 23,693 23,436 23,086 27,047 83 87 71Renter 14,077 12,706 12,704 15,427 101 101 83Consumption Quintile1st Quintile 5,667 10,073 10,073 11,096 50 50 432nd Quintile 10,841 14,418 14,418 19,937 75 75 573rd Quintile 16,283 16,420 16,420 21,047 100 101 784th Quintile 24,800 21,519 21,079 29,261 113 116 825th Quintile 46,085 29,025 28,054 43,184 173 183 111Before-Tax Income Quintile1st Quintile 9,771 6,863 6,863 7,137 132 132 1132nd Quintile 13,457 11,493 11,493 12,712 120 120 973rd Quintile 15,427 16,463 16,441 19,770 89 90 694th Quintile 19,504 24,485 24,012 31,014 79 80 585th Quintile 27,188 47,344 42,658 64,160 51 57 37After-Tax Income Quintile1st Quintile 9,771 6,863 6,863 7,137 132 132 1132nd Quintile 13,457 11,493 11,493 12,712 120 120 973rd Quintile 15,577 16,463 16,441 19,771 90 91 694th Quintile 19,323 24,485 24,026 31,036 77 79 585th Quintile 27,263 47,486 42,658 64,677 51 57 37After-Tax Income Plus Assets Quintile1st Quintile 9,492 6,949 6,949 7,131 127 127 1242nd Quintile 12,864 12,127 12,127 13,477 106 106 953rd Quintile 15,579 18,612 18,526 22,152 87 87 714th Quintile 19,904 25,815 25,160 36,355 78 81 555th Quintile 27,911 45,365 41,174 78,134 62 69 32
Source: Authors' estimates from the Health and Retirement Study.
Table 11.Median Per Capita Household Expenditures, Income, and Expenditure to Income Ratios for Nonmarried Adults Ages 65+,
Ratio of Expenditures to Income
Notes: Estimates are based on a sample of 1,115 nonmarried adults ages 65 and older. The median value is measured as the mean value between the 45th and 55th percentiles of the distribution.
by Personal Characteristics, 2001
36
Basic +Transport +Entertain Basic +Transport +Entertain Basic +Transport +Entertain
A. Median Per Capita Expenditures
Spending CategoryHousing $3,823 $3,823 $3,823 $5,311 $5,311 $5,311 $4,070 $4,070 $4,070Health Care 1,850 1,850 1,850 1,799 1,799 1,799 1,840 1,840 1,840Food 1,560 1,560 1,560 1,560 1,560 1,560 1,560 1,560 1,560Clothing 250 250 250 200 200 200 240 240 240Transportation 1,250 1,250 1,133 1,133 1,239 1,239Entertainment 1,100 700 1,010Sum of Components $7,483 $8,733 $9,833 $8,870 $10,003 $10,703 $7,710 $8,949 $9,959
B. Percent Poor or In Need
Poor 3% 3% 3% 18% 18% 18% 7% 7% 7%In NeedBefore-Tax Income 8% 12% 16% 19% 24% 27% 10% 14% 18%After-Tax Income 8% 12% 16% 19% 24% 27% 10% 14% 18%After-Tax Income Plus Assets 6% 8% 10% 16% 19% 21% 8% 10% 13%
Source: Authors' estimates from the Health and Retirement Study.
Table 12.Per Capita Household Expenditures and Percent in Need, by Marital Status and Spending Category
Notes: Estimates are based on a sample of 1,894 married adults and 1,115 nonmarried adults ages 65 and older. The basic needs threshold includes expenditures on housing, health care, food, and clothing. The median value is measured at the 50th percentile of the distribution.
Married Nonmarried All
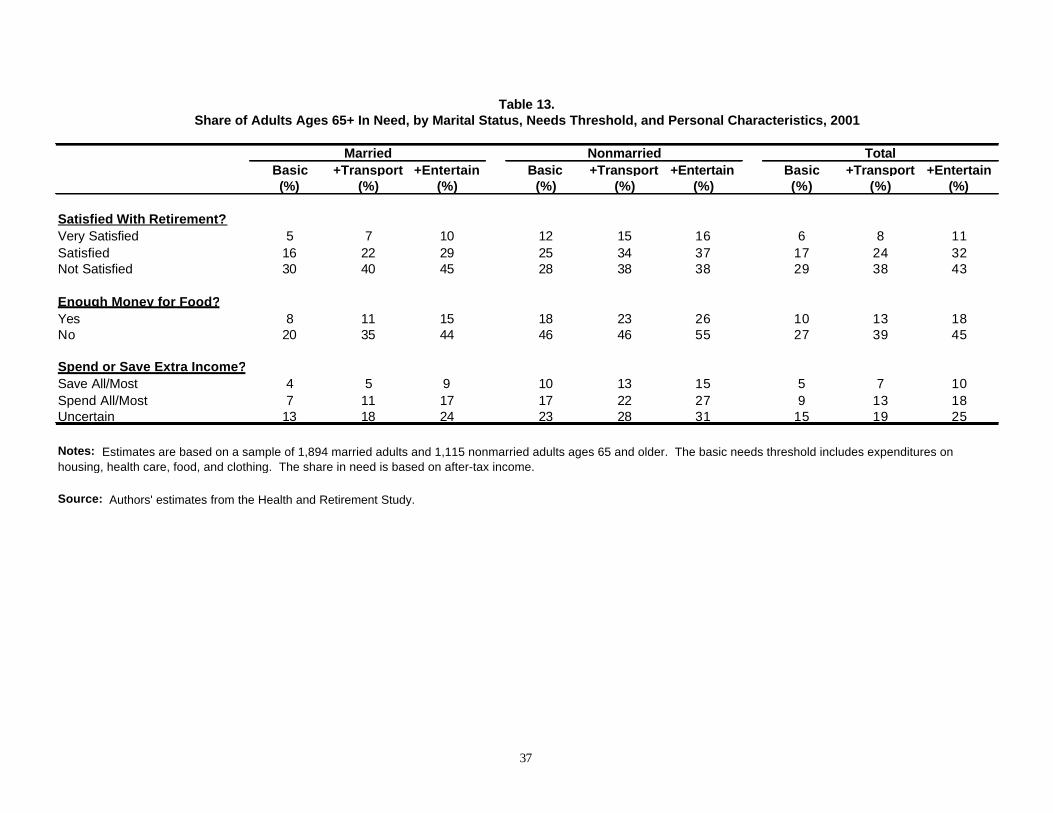
37
Basic +Transport +Entertain Basic +Transport +Entertain Basic +Transport +Entertain(%) (%) (%) (%) (%) (%) (%) (%) (%)
Satisfied With Retirement?Very Satisfied 5 7 10 12 15 16 6 8 11Satisfied 16 22 29 25 34 37 17 24 32Not Satisfied 30 40 45 28 38 38 29 38 43
Enough Money for Food?Yes 8 11 15 18 23 26 10 13 18No 20 35 44 46 46 55 27 39 45
Spend or Save Extra Income?Save All/Most 4 5 9 10 13 15 5 7 10Spend All/Most 7 11 17 17 22 27 9 13 18Uncertain 13 18 24 23 28 31 15 19 25
Source: Authors' estimates from the Health and Retirement Study.
Table 13.Share of Adults Ages 65+ In Need, by Marital Status, Needs Threshold, and Personal Characteristics, 2001
Notes: Estimates are based on a sample of 1,894 married adults and 1,115 nonmarried adults ages 65 and older. The basic needs threshold includes expenditures on housing, health care, food, and clothing. The share in need is based on after-tax income.
NonmarriedMarried Total
RECENT WORKING PAPERS FROM THE
CENTER FOR RETIREMENT RESEARCH AT BOSTON COLLEGE
Understanding Expenditure Patterns in Retirement Barbara A. Butrica, Joshua H. Goldwyn, and Richard W. Johnson, January 2005 Changes in the Distribution of Long-Run Earnings and Retirement Incomes—Have Recent Cohorts Fallen Behind? Peter Gottschalk and Minh Huynh, January 2005 The Age Profile of Income and the Burden of Unfunded Transfers in Four Countries: Evidence from the Luxembourg Income Study Gary Burtless, December 2004
Projecting Immigration: A Survey of the Current State of Practice and Theory Neil Howe and Richard Jackson, December 2004
Nonearnings Income Migration in the United States: Anticipating the Geographical Impacts of Baby Boom Retirement Peter B. Nelson, December 2004
Does Work Pay at Older Ages? Barbara A. Butrica, Richard W. Johnson, Karen E. Smith, and Eugene Steuerle, November 2004 Poverty and Income Maintenance in Old Age: A Cross-National View of Low Income Older Women Timothy M. Smeeding and Susanna Sandstrom, November 2004 How Does Marriage Affect the Allocation of Assets in Women’s Defined Contribution Plans? Angela C. Lyons and Tansel Yilmazer, November 2004 Why Don’t Americans Save? Barry Bosworth, November 2004 How Do Pensions Affect Expected and Actual Retirement Ages? Alicia H. Munnell, Robert K. Triest, and Natalia A. Jivan, November 2004
All working papers are available on the Center for Retirement Research website (http://www.bc.edu/crr) and can be requested by e-mail ([email protected]) or phone (617-552-1762).