Embed Size (px)
Citation preview

China is the world’s largest national source of greenhouse gas emissions, and energy production and use create most of those emissions. China has set ambitious targets to reduce energy demand growth and, consequently, its greenhouse gas emissions growth, and has claimed dramatic gains in meeting them.
Unfortunately, inadequacies in China’s national statistical system makes it difficult to assess China’s progress toward meeting its goals. The government’s claims of significant progress in reducing carbon intensity are generally plausible. However, due to shortcomings in the data system, China’s progress cannot be proven in detail with a high level of accuracy.
The Chinese government could increase confidence in the energy and emissions data it collects and publishes by improving the methods and capabilities of its statistical collection and reporting system. For example, data collection agencies could make better use of data spot checking, data sampling, and personnel training. Chinese leaders could facilitate capacity building at all levels of data management and administration to guarantee data quality (and consistency) from top to bottom.
Significant data quality improvements could be made by applying lessons learned from the economic census China has developed over the last decade. The statistical shortcomings revealed by the census include large adjustments required for total coal production and in gross domestic product (GDP) for the service sector. The Chinese government could concentrate its efforts on improving data collection, analysis, and processing in these areas.
Measurements of electricity, natural gas, and heat use—which are metered and invoiced by utilities—could be used directly for statistical reporting in place of survey data obtained from enterprises.
Most importantly, additional effort could be made to collect data on coal output, especially from small mines, which could be required to report their production data even if their output is small. This would ensure that all coal output is included, providing more reliable data.
Understanding Energy Intensity Data in China March 24, 2011
Wang Yanjia, Tsinghua University and William Chandler, Transition Energy
2
Why Chinese Data Matter
This paper attempts to improve understanding of Chinese energy data because doing so is central to understanding global efforts to limit the growth of greenhouse gas emissions. China is the world’s largest national source of greenhouse gas emissions, and energy production and use account for the majority of Chinese emissions.
Chinese measures of energy use and economic growth have come under increasing scrutiny since the “Bali Roadmap” emphasized making national emissions trends and reductions for all countries measurable, reportable, and verifiable.1 In particular, Chinese leaders have claimed success in reaching their unprecedented goal of cutting 2010 energy intensity—the ratio of energy used per unit of economic output—by 20 percent compared to the base year of 2005. Similarly, China’s commitment for 2020 made at the Copenhagen climate summit in 2009 was to cut carbon emissions intensity by 40–45 percent, again relative to 2005.
Unfortunately, the reliability and transparency of Chinese energy data often come into question, particularly concerning measures of the Chinese economy and the rate of economic growth. Uncertainty stems from problems with and major recent revisions in the Chinese statistical system. For example, a delay until 2010 in publishing Chinese energy data for 2008 raised questions among international observers regarding the reliability and believability of Chinese data.2 Estimates of progress toward the 2010 energy intensity goal have been revised several times, further increasing concern about the data.3
Chinese officials announced that they met their ambitious 2010 target to reduce energy intensity (compared to 2005 levels) by 20 percent.4 Those claims are largely plausible. To explain this view, we describe the sources of the data, how the data were collected, why the data were modified, make judgments about their quality, and try to show how problems and changes in those data can be better understood and corrected.
How Chinese GDP Data Are Collected and Reported
GDP—or total national economic output—is the denominator in the energy intensity calculation China uses to chart progress toward goals to reduce energy consumption and carbon emissions. Since 2004, two agencies, the National Bureau of Statistics (NBS) and the State Council, have led efforts to collect GDP data. The NBS publishes the data in three main reports: the Statistical Communiqué of the People’s Republic of China on National Economic and Social
Inadequacies in China’s national statistical system makes it difficult to assess China’s progress toward meeting its emissions goals.

3
Development; the China Statistical Yearbook; and the Communiqué on Major Data of the National Economic Census of China.
Before 2004, the NBS only collected and published GDP data annually based on surveys sent to firms and agencies. Many firms, particularly in the service sector, were omitted because the survey excluded companies with annual revenues below a specific amount. For example, in 2004, firms with revenues less than about 5 million Chinese RMB (U.S. $730,000) were not surveyed. This survey methodology significantly underreported the national economic product.
To provide more accurate data, the Chinese government launched an economic census to be conducted every four years. That effort was led jointly by the State Council and NBS. The first census was performed in 2005, providing data for 2004. The second census, conducted in 2009, reported data for 2008.
The census survey is conducted over a period of twelve months. Surveyors are expected to visit every existing business, a key difference from the NBS approach, which involved mailing surveys to firms. The census methodology has vastly improved the comprehensiveness and reliability of the economic data.
GDP since 2005 has been reported in three different versions (table 1), though only two versions of GDP may be published in years when a census does not take place. While the NBS normally revises GDP in its Statistical Yearbooks, it does not do so until a current census result is available.
Table 1. CHInA PRovIDEs GDP DATA In THREE MAjoR PUblICATIons
Publication Issued Timing GDP Estimate notes
Statistical Communiqué of the People’s Republic of China on National Economic and Social Development
Annual February Reported data for first 11 months plus estimated December growth.
GDP in current price
China Statistical Yearbook
Annual September Whole-year statistical data
GDP (revised) in current and constant prices.
Communiqué on Major Data of the National Economic Census of China
Once in 4 years
January Census GDP in current price adjusted between censuses

4
Table 2. PUblIsHED CHInEsE GDP vARY bY offICIAl PUblICATIon: An ExAMPlE fRoM 2007
Data sourceGDP In Current Price (Trillion RMb)
Statistical Communiqué of the People’s Republic of China on the 2008 National Economic and Social Development
24.7
China Statistical Yearbook 2008 25.7
Statistical Communiqué of the People’s Republic of China on 2008 National Economic and Social Development (After Census)
26.6
Problems Arising from the GDP Data
Any revision to GDP will obviously affect estimates of energy intensity, which is defined simply as a ratio of energy use per unit of GDP. Chinese GDP has been revised substantially as a result of the census estimates, which are considered more thorough and reliable than the NBS GDP estimates. Keeping in mind that GDP is defined as the sum of value-added across all sectors, the largest adjustment to the GDP comes because the census includes more value-added from the service sector (see table 3). This additional value-added is created mainly by small businesses, which are more likely to be omitted from the NBS data and are generally less energy-intensive than large industry. According to the standard practice of the regular NBS statistical system, value-added data are collected according to a minimum size criterion for organizations, defined mainly by their annual revenue.
Table 3. CHInEsE GDP WAs REvIsED bAsED on THE 2008 CEnsUs (TRIllIon RMb)
before Census After Census Revision
GDP 30.1 31.4 13 4.3%
Primary Industry 3.4 3.37 -0.29 -0.9%
Secondary Industry 14.6 14.9 0.28 2.0%
Tertiary Industry 12.04 13.1 0.11 9.2%
Sources: On the Major Data of the Second National Economic Census; China Statistical Yearbook 2009.
5
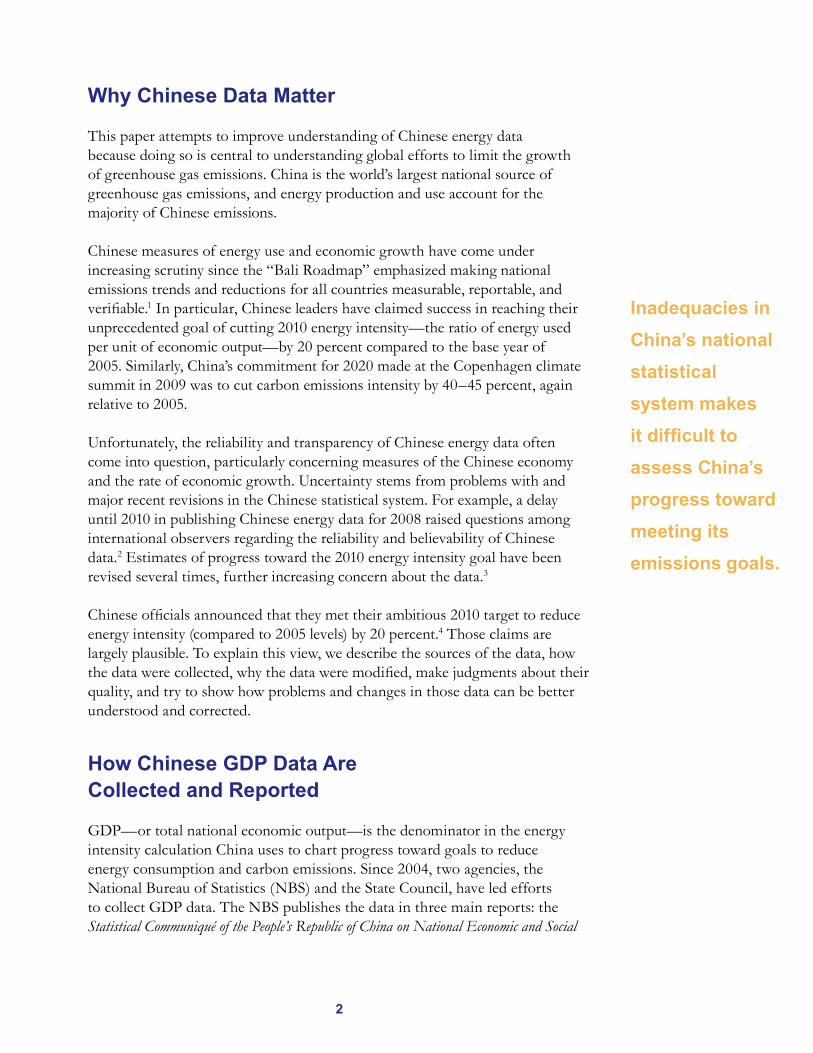
In addition to omitting retailers with revenues below 5 million RMB (U.S. $730,000), industrial firms, wholesalers, and other service providers are excluded (see table 4 for a definition of the designated size of organization for inclusion in data collection in various sectors).
The government does not use a “spot check” method—a test, for example, to see if the aggregate data sum properly—for the services sector, though it does so to cross-check industrial enterprises below the designated data collection size. Only income data from enterprises for real estate development, railways, and communication are collected in addition to enterprises in the wholesale, retail, hotel, and catering sectors. Value-added data from many service activities are not included in the NBS surveys, although preparations are being made to do so (see table 5; all sub-sectors listed in table 5 are, to date, excluded from the surveys). Most organizations in these sectors are government agencies, but many are nongovernmental enterprises that also create value-added.
Table 4. THE nbs AnnUAl EConoMIC sURvEYs ExClUDE MAnY EnTERPRIsEs
sector Criteria for Inclusion in survey
Industry (Mining, Manufacture, Electricity, Gas, Water)
All state-owned and non-state-owned enterprises with annual revenue from principal business ≥5 million RMB
Construction Various ownership types with qualified certification and independent accounting
Wholesale Sales ≥20 million RMBEmployees (year-end)>20
Retail Sales ≥5 million RMBEmployees (year-end)>60
Hotel Only hotels with a “star” rating
Catering Sales ≥2 million RMBEmployees (year-end)>40

6
Table 5. soME sERvICE CATEGoRIEs ARE ExClUDED fRoM THE nbs sURvEYs
sector
number of legal Entities
EnterprisesAgencies,
Institutions, other
Information Transmission, Computer Services, and Software
144,942 8,350
Banking 26,404 1,732
Leasing and Business Services 359,295 67,717
Scientific Research, Technical Service, Geological Prospecting
125,412 76,290
Water Conservancy, Environment, and Public Facilities
22,068 35,490
Services to Households and Other Services
106,491 13,977
Education 21,423 313,642
Health, Social Securities, and Social Welfare
35,146 46,732
Public Management and Social Organization
1,363,849
Total 857,122 2,118,318
Source: Communiqué on the Major Data of the Second National Economic Census
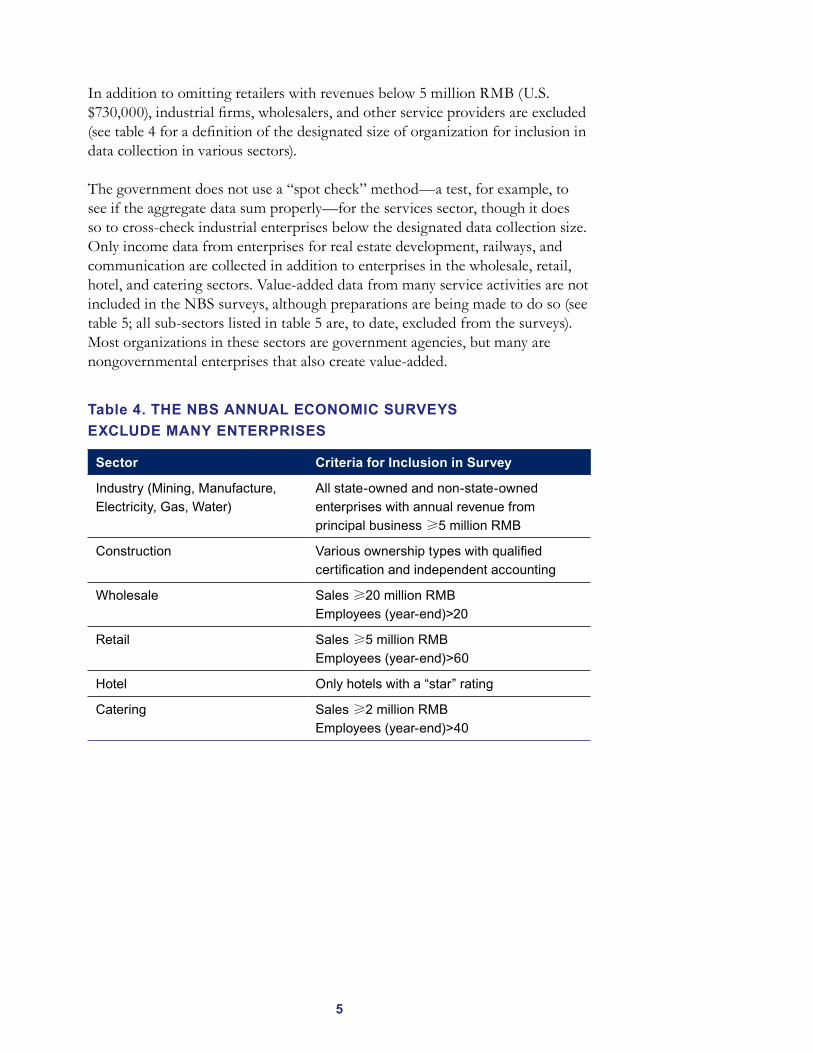
The economic census, in contrast, collects value-added data from all organizations. Census takers are instructed to go to every existing enterprise to conduct their surveys. However, even published census data do not aggregate value-added at a sectoral level, leading to substantial differences in estimates (see table 6). For example, the Statistical Yearbook indicated there were 138,086 wholesale and retail enterprises that created revenues of 18.8 trillion RMB in 2008, while the Census shows the sector had 1,403,000 enterprises and created revenue of 24.7 trillion RMB in the same year.
7
Table 6. THE EConoMIC CEnsUs InClUDEs MoRE EConoMIC ACTIvITY THAn THE nbs sURvEYs (2008)
Indicator Yearbook Census Census/Yearbook (Ratio)
Enterprises (units) 138,086 1,403,000 10.2
Employees (persons) 11,374,819 18,912,000 1.7
Revenue (trillion RMB) 18.8 24.7 1.3
Total assets (trillion RMB)
7.5 12.2 1.6
Source: Communiqué on the Major Data of the Second National Economic Census; China Statistical Yearbook, 2009
Before 2009, industrial enterprise accounting statements reported “gross output production value” rather than “value-added,” a difficult concept to estimate. The gross output value equals the total value of all goods and services produced by all units, regardless of whether the goods were sold or merely went into inventory. To calculate that value, the average price for goods actually sold is multiplied by total production to estimate the value of gross output. The concept of value-added in constant prices was even more difficult for firms to estimate. Value-added for an enterprise is estimated in two ways, one of them by taking the gross output production value and subtracting the value of all inputs and adding any value-added tax paid. But adjusting for constant prices for a variety of goods can be tricky. This approach is called the “production approach.” When the Chinese government established its 20 percent energy intensity reduction target in 2006, many firms were confused by the concept and did not know how to measure their mandated energy efficiency improvements. All value-added data for agriculture and industry was estimated by national and local statistical bureaus.
Statistical bureaus mainly adopt the “production approach” combined in some sectors (for example, education or health care) with the “income approach,” a second way of estimating value added. The income approach is used sometimes when value-added cannot reliably be estimated. This approach estimates primary income created by all residential units and distributed to residential and non-residential units. It is estimated for a given enterprise or sector by summing the amount of money paid by that firm or sector in salaries, value-added tax, and subtracting the depreciation of the firm or sector’s assets. The provincial bureaus of statistics (PBSs) independently report provincial GDP to the NBS.

8
Inevitably, there is some double counting of valued-added and so the sum of the provincial GDP is larger than the national GDP. GDP estimated at the provincial level more likely includes double counting because many companies have branches in different locations and conduct business across provincial boundaries.
This inconsistency raises the question as to which estimates are more reliable—the provincial or the national data estimates. Some experts think that the NBS data are more reliable because the NBS checks provincial GDP using a growth rate derived from other data, such as tax revenues, electricity consumption, and goods turnover. The PBSs, on the other hand, do not make those kinds of cross-checks. After adjusting provincial GDP—usually to lower the estimates—the NBS sends the estimates back to the PBSs. The PBSs then publish their provincial GDP numbers using the adjusted data in their provincial statistical yearbooks.
Some observers think provincial data are affected by local authorities’ desire to show higher economic growth rates in their region. The PBSs have never publicly responded to questions about their data quality. At the same time, there has been no reported case of outright data manipulation.
How Chinese Energy Data Are Collected and Reported
A similar situation affects energy statistics. The Statistical Communiqué of the People’s Republic of China on National Economic and Social Development usually provides figures for total energy consumption and production, coal, crude oil and natural gas production, and total electricity generated. Those data are based on reported information for the first eleven months of each year and a growth rate to estimate values for December, where the growth rate used is the one from the previous December.
The China Energ y Statistical Yearbook later revises the energy data based on a full-year set of statistics. These energy data are then adjusted again after an Economic Census is completed and the revisions are published in the next Energ y Statistical Yearbook. The Energ y Statistical Yearbook 2005 revised energy consumption data from 1999 to 2004 based on the results of the first national economic census in 2005 (see table 7). The biggest adjustment occurred in the year 2000 data, in which primary energy consumption was revised upward by 6.28 percent compared to the data published initially.

9
Table 7. PRIMARY EnERGY ConsUMPTIon DIffERs bY soURCE In 1999‒2004 (MTCE5)
Primary Energy Consumption by Year
Data source
Difference, Compared to Census (%)
Energy statistical Yearbook, 2005(After Census)
Energy statistical Yearbook, 2002–2004
1999 1,283 1,247 2.9
2000 1,324 1,246 6.3
2001 1,357 1,284 5.7
2002 1,441 1,406 2.5
2003 1,672 1,632 2.5
2004 1,939 -- --
The Statistical Communiqué of the People’s Republic of China on 2009 National Economic and Social Development estimated 2008 energy consumption to be just over 2 percent lower for that year than did the 2008 Economic Census (2.85 and 2.91 billion tons of coal-equivalent, respectively). The Energ y Yearbook 2009 also revised upward energy consumption in 2005–2007 based on the results of that second census (see table 8).
Once again, the Energ y Statistical Yearbook 2009 revised the energy consumption data from the first national economic census (see table 9). But the NBS did not explain the reason why the first census data needed to be revised, though the revisions can be striking. For example, the first census adjusted 2000 energy consumption by 6.3 percent higher than the original statistical data (see table 7), with the second census again adjusting 2000 energy consumption by an additional 5.3 percent.
Table 8. PRIMARY EnERGY ConsUMPTIon DIffERs bY soURCE In 2005‒2008 (MTCE)
Data source
Difference After Census (%)
Primary Energy Consumption
Energy statistical Yearbook 2009, After Census
Energy statistical Yearbook 2008
2005 2,257 2,144 5.3
2006 2,475 2,351 5.3
2007 2,684 2,534 5.9
2008 2,775 -- --

10
Table 9. PRIMARY EnERGY ConsUMPTIon In 1999‒2004 WAs ADjUsTED UPWARD bAsED on THE sEConD CEnsUs (MTCE)
Primary Energy Consumption
Energy statistical Yearbook 2009 (2nd Census)
Energy statistical Yearbook 2005 (1st Census)
Difference After the second
Census (%)
Energy statistical Yearbooks 2002–2004
Difference After the second
Census (%)
1999 1,351 1,284 5.3 1,248 8.3
2000 1,394 1,325 5.3 1,246 11.9
2001 1,430 1,358 5.3 1,284 11.3
2002 1,518 1,442 5.3 1,406 7.9
2003 1,761 1,673 5.3 1,632 7.9
2004 2,042 1,940 5.3
After the revisions in Chinese energy use data following both the first and second censuses, the supposed decline in energy consumption between 1997 and 2001 was completely eliminated. The original data showed that energy consumption had declined for several years after 1996. Revisions after the first census, which only adjusted data from 1999 to 2003, still reported a decline in national energy use for 1997 and 1998. The second census adjusted energy consumption data from 1995, however, and the effect was to lower consumption data for 1995, 1996, and 1997, and to increase the totals after 1998, especially from 1998 to 2003. These changes smoothed the curve of energy consumption and consequently removed the decline from the overall trend (see figure 1). We are not aware of any public effort to explain why the second census changed the energy-related data relative to the first census. This absence of information raises a question, one that remains an area in which new research could be productive.

11
Figure 1. THE TWO CENSUS REVISIONS ELIMINATED THE SUPPOSED DECLINE IN ENERGY USE AFTER 1996
1991
MC
TE
Before 1st Census 1st Census 2nd Census
3,000
2,500
2,000
1,500
1,000
500
–
1993 1995 1997 1999 2001 2003 2005 2007
Source: China Energ y Statistical Yearbook, various years
Problems Arising from the Energy Data
The energy-related data revisions brought about by the National Economic Census have mainly resulted in adjusting coal-related data. Coal consumption in 2002, for example, was estimated to be 1.41 billion tons before the census, but was increased to 1.44 billion tons after the first census. There is no adjustment indicated in other energy sources (see table 10).
The second census showed that the statistical quality of coal data collection was not improved after the first census and may have been made worse (compare highlighted data in tables 10 and 11). That is, coal data were revised even more after the second census than they were after the first census. The statistical data in petroleum, natural gas, and electricity appear more accurate than coal, which is unsurprising as their use is metered.

12
This does not mean that discrepancies in those data do not exist; they probably do and they may well amount to uncertainties worth, say, billions of dollars in oil imports. However, the unexplained differences are highly unlikely to make a difference in carbon emissions or energy intensity, the subject of this paper.
The second census increased petroleum consumption by 0.2 percent and natural gas only 1.5 percent, compared to 5.5 percent for coal.
Table 10. CoAl DATA WERE REvIsED MosT AfTER THE fIRsT CEnsUs (YEAR 2002 DATA)
2002before Census
After Census Difference (%)
Primary Energy Consumption (MTCE) 1,406 1,441 2.5
Coal (Million tons) 1,366 1,416 3.7
Petroleum (Million tons) 247 247 0.03
Natural Gas (Billion Cubic Meters) 29 22 0.00
Hydro power (Billion kWh) 288 288 0.00
Nuclear power (Billion kWh) 25 25 0.00
Table 11. CoAl DATA WERE REvIsED EvEn MoRE AfTER THE sEConD EConoMIC CEnsUs (YEAR 2007 DATA)
sectorbefore Census
After Census Difference (%)
Primary Energy Consumption (MTCE) 2,534 2,684 5.9
Coal (Million Tons) 2,586 2,727 5.5
Petroleum (Million Tons) 365 366 0.2
Natural Gas (Billion Cubic Meters) 69.5 70.0 1.5
Hydro Power (Billion kWh) 485 485 0.00
Nuclear power ( Billion kWh) 62 62 0.00
The PBSs are not required to collect energy data. Instead, the NBS collects energy data directly from industrial enterprises. Large energy production enterprises must report their information to the NBS once a month and small energy production enterprises report once a quarter. The NBS checks data quality
13
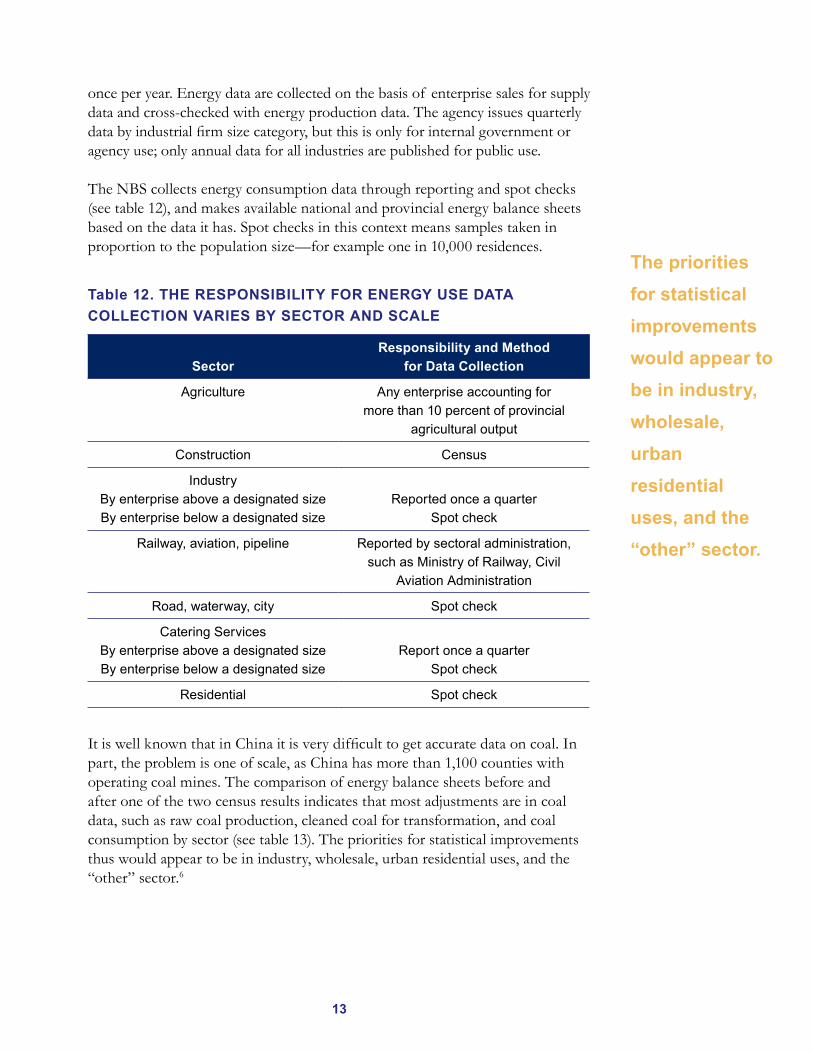
once per year. Energy data are collected on the basis of enterprise sales for supply data and cross-checked with energy production data. The agency issues quarterly data by industrial firm size category, but this is only for internal government or agency use; only annual data for all industries are published for public use.
The NBS collects energy consumption data through reporting and spot checks (see table 12), and makes available national and provincial energy balance sheets based on the data it has. Spot checks in this context means samples taken in proportion to the population size—for example one in 10,000 residences.
Table 12. THE REsPonsIbIlITY foR EnERGY UsE DATA CollECTIon vARIEs bY sECToR AnD sCAlE
sectorResponsibility and Method
for Data Collection
Agriculture Any enterprise accounting for more than 10 percent of provincial
agricultural output
Construction Census
IndustryBy enterprise above a designated sizeBy enterprise below a designated size
Reported once a quarterSpot check
Railway, aviation, pipeline Reported by sectoral administration, such as Ministry of Railway, Civil
Aviation Administration
Road, waterway, city Spot check
Catering ServicesBy enterprise above a designated sizeBy enterprise below a designated size
Report once a quarterSpot check
Residential Spot check
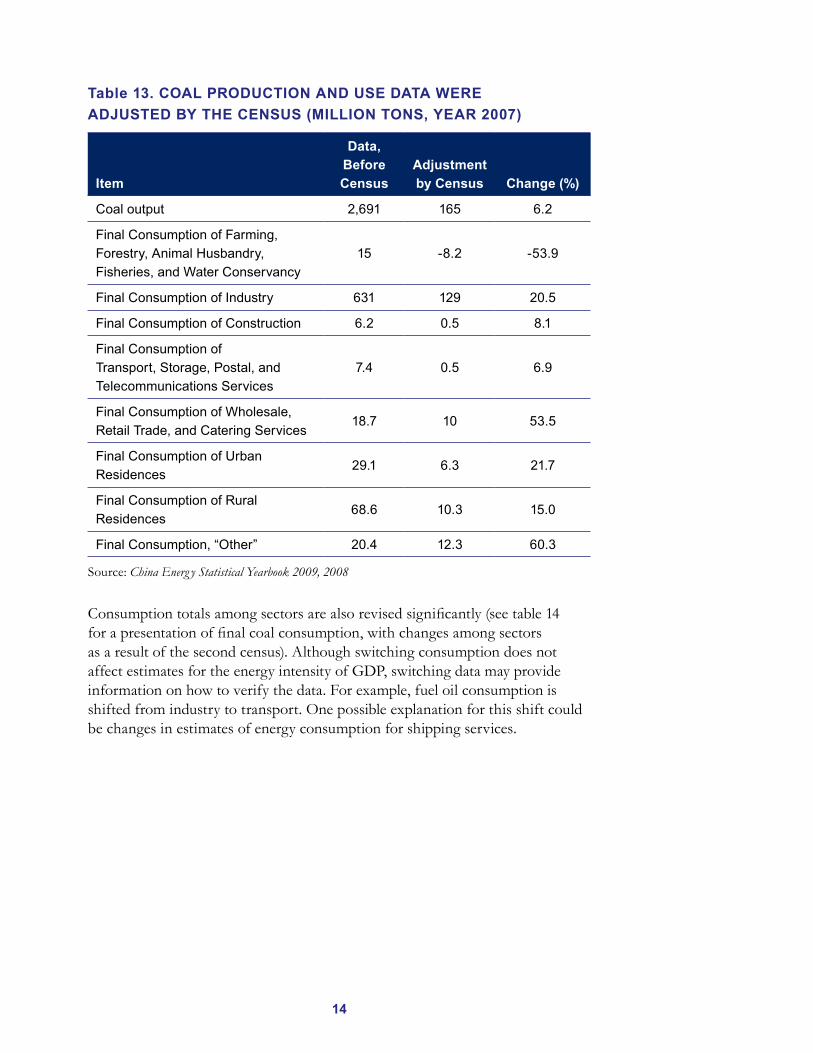
It is well known that in China it is very difficult to get accurate data on coal. In part, the problem is one of scale, as China has more than 1,100 counties with operating coal mines. The comparison of energy balance sheets before and after one of the two census results indicates that most adjustments are in coal data, such as raw coal production, cleaned coal for transformation, and coal consumption by sector (see table 13). The priorities for statistical improvements thus would appear to be in industry, wholesale, urban residential uses, and the “other” sector.6
The priorities for statistical improvements would appear to be in industry, wholesale, urban residential uses, and the “other” sector.
14
Table 13. CoAl PRoDUCTIon AnD UsE DATA WERE ADjUsTED bY THE CEnsUs (MIllIon Tons, YEAR 2007)
Item
Data, before Census
Adjustment by Census Change (%)
Coal output 2,691 165 6.2
Final Consumption of Farming, Forestry, Animal Husbandry, Fisheries, and Water Conservancy
15 -8.2 -53.9
Final Consumption of Industry 631 129 20.5
Final Consumption of Construction 6.2 0.5 8.1
Final Consumption of Transport, Storage, Postal, and Telecommunications Services
7.4 0.5 6.9
Final Consumption of Wholesale, Retail Trade, and Catering Services
18.7 10 53.5
Final Consumption of Urban Residences
29.1 6.3 21.7
Final Consumption of Rural Residences
68.6 10.3 15.0
Final Consumption, “Other” 20.4 12.3 60.3
Source: China Energ y Statistical Yearbook 2009, 2008
Consumption totals among sectors are also revised significantly (see table 14 for a presentation of final coal consumption, with changes among sectors as a result of the second census). Although switching consumption does not affect estimates for the energy intensity of GDP, switching data may provide information on how to verify the data. For example, fuel oil consumption is shifted from industry to transport. One possible explanation for this shift could be changes in estimates of energy consumption for shipping services.

15
Table 14. A CoMPARIson of fInAl EnERGY ConsUMPTIon bEfoRE AnD AfTER THE CEnsUs sHoWs vARYInG DIffEREnCEs sECToR ToTAls (2007, MTCE)
ItemRaw Coal Coke
other Gas Gasoline Diesel
fuel oil
natural Gas Heat Electricity
Total Final Consumption
120 -11.4 31.8 0 0.05 1.1 1.3 0 0
Farming, Forestry, Animal Husbandry, Fishery & Water Conservancy
-5.8 -0.24 0 -1.09 -9.56 0 0 -1 -123
Industry 97.2 -11.2 31.1 -0.7 3.6 -4.4 -4.0 -0.34 -4.2
Non-Energy Use 6.5 -0.5 0 -0.02 0.07 -0.21 -1.00 0 0
Construction 0.4 0 0 -0.29 0 0.21 0 0 0
Transport, Storage, Postal & Telecommunications Services
0.40 0 0 -2.21 5.68 5.29 3.99 0 0
Wholesale, Retail Trade, Catering Service
7.36 0 0 -3.24 -6.84 0 0 0 0
Urban Residential Consumption
4.47 0 0.72 3.00 3.50 0 1.33 03.20
Rural Residential Consumption
7.59 0.05 0 2.06 1.46 0 0 0 2.21
Other 8.81 0.01 0 2.50 2.19 0 0 0.35 0
Source: China Energ y Statistical Yearbook 2009, 2008
judgments Regarding Data Reliability
We have a high degree of confidence in China’s published energy consumption data for natural gas, hydropower, and nuclear power based on the fact that repeated official reviews of the data have not led to major revisions. The same is not true for the heavily revised coal data, however. This perceived unreliability has major implications because coal production and use dominate all important aggregate Chinese energy data, including total energy consumption, energy intensity of the GDP, and carbon dioxide emissions. Problems with coal data stem from two characteristics of the fuel: measurements based on the physical quantity of coal consumed, and measurements of the heat and carbon content of some 2–3 billion tons of coal used each year.

16
Coal production and use can be estimated by using several sources of information, such as output by coal type, region, and ownership (tables 15a and 15b). While this information is useful generally, detailed information on coal quality by coal type is usually not available to the public (Table 16 includes common indicators used for coal quality). For example, anthracite coal from different regions has different carbon and hydrogen content. Without knowing the carbon content data—which is not usually collected for coal—it is hard to calculate carbon dioxide emissions by type of coal burned. Moreover, the combustion efficiency will differ by coal quality, which will affect coal consumption and carbon data.
Table 15a. PoTEnTIAl soURCEs of CRoss-REfEREnCEs foR CHInEsE CoAl QUAlITY DATA
source Characteristics Indicated Data Availability
Coal Networkwww.coal.com.cn
Output by coal type and region (monthly)
Membership only
China Coal Industry Yearbook 2008 (Census Year)
Output by coal type (anthracite; meager-lean; lean; coking; fat; 1/3 coking; gas-fat; gas; other) and region (yearly)
Public
China Coal Industry Yearbook (Non-Census Year)
Output by mine ownership (yearly) Public
Coal Networkwww.coal.com.cn
Coal quality indicators for specific producers or mines
Public
Table 15b. sElECTED InDICAToRs of CoAl QUAlITY
Testing based Air Dried Dried Dry Ash free
Inherent Moisture, %
Common Coal Quality IndicatorsAsh, %
Volatile Matter, %
Heat Value, kcal/kg
Fixed Carbon, %
From Coal Quality Analysis Report Only
Total Sulfur, %
Carbon, %
Hydrogen, %
Nitrogen, %

17
No cost-effective approach has been identified for checking the accuracy of coal quality data after the data have been submitted. The quality of such data can be ensured only during the submission process. However, many local officials lack the human or technical capacity to ensure data quality. Research and training are needed to suggest how the data bureaus can ensure that officials can better judge data reliability.
For example, when experts questioned coal data in 2001 (figure 2), most observers simply assumed that small mines were hiding their output because their production had been declared illegal under government policy, or, alternatively, that firms were hiding production to avoid paying taxes. Only a few observers realized that the local bureaus of statistics did not count small coal mine production because officials assumed the small coal mines had stopped operating—as supposedly required by the government—and never verified whether they had indeed closed. This situation bolstered the belief that local governments were hiding coal production data because officials wanted to show they had increased coal output, as the government had ordered. While this explains the reduction in coal output, it does not explain differences in coal consumption data.
Indicators exist to help judge the reliability of data supplied by companies and small mines (table 16). For example, the capacity of mines owned by Town and Village Enterprises (TVEs) in the early part of the 2010s increased significantly while their production capacities shrank. It would be easier to draw conclusions about those counterintuitive trends if an effort to cross-check and verify the data existed.
Figure 2. TVE COAL OUTPUT SUGGESTS A MEANS OF SPOT-CHECKING COAL DATA7
1995
Bill
ion
Tons
of C
oal
Per
cent
Before Census After Census TVE Share (%, right axis)
3.0
2.5
2.0
1.5
1.0
0.5
0.0
60
50
40
30
20
10
01997 1999 2001 2003 2005 2007
Research and training are needed to suggest how the data bureaus can ensure that officials can better judge data reliability.

18
Table 16. CoAl oUTPUT In sHAnnxI PRovInCE
Company by ownership Item 2007 2008 judgment
Shenhua Company
Mines 6 6
High reliabilityCapacity (million tons) 60 65
Output (million tons) 60 65
State-owned Key
Mines 26 27
Modest reliabilityCapacity (million tons) 29 29
Output (million tons) 30.8 43.7
State-owned Local
Mines 51 59
Low reliabilityCapacity (million tons) 18.5 17.9
Output (million tons) 22.6 25.5
TVEs
Mines 651 362
Very low reliabilityCapacity (million tons) 44.4 26.6
Output (million tons) 58.5 83.1
Data source: China Coal Industry Yearbook 2007, 2008. “Capacity” includes mines under construction, but “output” does not.
Software to correct such data discrepancies, improve data quality, and avoid mistakes would help improve data reliability. For example, raw coal consumed as feedstock in 2008 was 37.6 million tons, according to the national energy balance sheet. But adding up the data across all provincial energy balance sheets shows a total of 50.4 million tons—one-third higher than the national total. This kind of inconsistency could be avoided by automatically cross-checking data.
Other published data and expert knowledge could be applied to judge provincial data reliability, especially for priority areas such as ammonia output and other feedstocks (natural gas, naphtha) for ammonia production. The data could be cross-checked, for example, by comparing it with the regulatory standard established for feedstock use in ammonia production. (Table 17 includes examples of approaches to cross-checking coal consumption data for ammonia production.)

19
Table 17. CRoss-CHECks CAn bE APPlIED To CoAl ConsUMPTIon DATA foR AMMonIA PRoDUCTIon (2008, MIllIon Tons)
selected Province
Raw Coal as feedstock
Ammonia output
Coal/Ammonia
Comment
National 37.6 50.0 0.75Assumes 5360 kcal/ton raw coal
Provincial Sum
50.4 50.0 1.01
Shandong 0 6.0 0Unclear if other feedstock used
Guangdong 4.0 0.1 53.9Unclear if other products use coal as feedstock
Sichuan 2.6 4.1 0.6Most of ammonia plants in Sichuan use natural gas as feedstock
findings and Recommendations
China publishes same-year GDP and energy consumption data using different values on different occasions and in different publications. When these documents are translated into English or reported by the media, only the numbers receive attention; the qualifiers are often ignored and the data revisions not fully explained. Addressing this problem requires greater effort on the part of the Chinese government—to clarify the meaning of the data—and on the part of the international institutions that interpret this data for the global public.
Chinese data collection agencies could also improve the quality of statistical reporting by making better use of data spot checking, data sampling, and personnel training. Most importantly, Chinese leaders could facilitate capacity building at all levels of data management and administration to guarantee data quality (and consistency) from top to bottom.
For example, when enterprises create energy management systems, a national standard consistent with NBS’s requirements on data collection could be followed. When data are maintained in electronic format, the reported information could be transferred directly and automatically, minimizing human error. Data for measures of electricity, natural gas, and heat use—which are metered and invoiced by utilities—could be used directly for statistical reporting in place of survey data obtained from enterprises.
Chinese leaders could facilitate capacity building at all levels of data management and administration to guarantee data quality (and consistency) from top to bottom.

20
More effort also could be made to collect data on coal output, especially from small mines, which could be required to report their production data even if their output is small. This would ensure that all coal output is included, providing more reliable data.
In addition, significant improvements could be made by applying lessons learned from the economic census. The statistical shortcomings revealed by the census include large adjustments required for total coal production and in GDP for the service sector. The Chinese government should concentrate its efforts on improving data collection, analysis, and processing in these areas.
Improving data quality is a long-term task, with no easy solution. Bringing additional energy expertise to the analysis of energy data systems would likely improve the quality of these systems. While verifying data quality is a labor-intensive task, automated cross-checking both minimizes this burden and improves data quality.
The national energy balance sheet should equal the total of corresponding items in all provincial energy balance sheets. The fact that it does not currently do so shows the challenge ahead.8 The Chinese data system could also improve the quality of its products and enhance their credibility by inviting independent organizations and experts to review the data before publication.9 China appears to take its role in reducing carbon emissions quite seriously, and these steps toward improving data accuracy would greatly enhance the credibility of its monitoring, verification, and reporting efforts.
China appears to take its role in reducing carbon emissions quite seriously, and these steps toward improving data accuracy would greatly enhance the credibility of its monitoring, verification, and reporting efforts.

21
The authors are grateful to Jeffrey Logan (National Renewable Energ y Laboratory), Jonathan Sinton (International Energ y Agency), Holly Gwin (Transition Energ y), and Howard Gruenspecht (Energ y Information Administration) for comments on, and to the Blue Moon Fund and the Rockefeller Brothers Fund for financial support for this paper.
Notes1 TheBaliRoadmapwasproducedbytheConferenceofPartiestotheUnitedNations
FrameworkConventiononClimateChangemeetinginBali,Indonesia,December3–15,2007.Seeunfccc.int/meetings/cop_13/items/4049.php.
2 TheNationalBureauofStatistics(NBS)ofthePeople’sRepublicofChinausuallypublishestheChinaEnergyStatisticalYearbookwithenergyproductionandconsumptiondatawithin12–18monthsoftheyearbeingreported.Forexample,theChina Energ y Statistical Yearbook 2009wouldnormallyhavebeenpublishedbyAugust2009topresentenergydatafrom2008,butwaspublishedinJuly2010.Itshouldbenoted,however,thatduetopublicationofthenewEconomic Census, theNBShadtoreviseoveradecadeofenergybalancedataandhadtodosowithonlyasmalladditionofstaff.
3 Again,itshouldbenotedthatmultiplerevisionsinthedataarenormal.TheNBStypicallypublishespreliminarydatainthefirstquarterofeachyearandrevisesitinthesecondquarterinitsStatistical Abstract,andthenagainmakesrevisionsbyOctoberbasedonsomeadditionaldetaileddataprovidedbytheprovinces.TheauthorswouldliketothankJonathanSintonoftheInternationalEnergyAgencyforhiscommentsonthemechanicsofthisreportingprocess.
4 XinhuaNewsAgency,“China’s‘EleventhFive-Year’emissionreductiontargetshavebeencompletedaheadofschedule.”SeetheoriginalChineselanguagenewsstoryat,forexample,http://roll.sohu.com/20101201/n300778955.shtml.
5 MTCEmeansmilliontonsofcoalequivalent,withatonbeingdefinedasthecalorificequivalentwhereonetonequals29.27gigajoules.
6 Weassumethedifferencesapparentinthefarmingsectorandforruralresidentsarecausedbyachangeindatacollectionmethodsfrommeasuringcoalproductiontomeasuringdailycoalconsumption.
7 Townandvillage-ownedenterprises
8 Actually,thesumwouldbesomewhatlargerthantheprovincialsumsbecauseenergydatafromTibetarenotincludedinthedatareporting.
9 Involvementofoutsideorganizationswouldofcourserequiretheexecutionofnon-disclosureagreementstoprotectconfidentialinformation.

22
WAnG YAnjIA is a professor at the Energy and Environmental Technology Center at Tsinghua University in Beijing. She is an expert in energy technology and policy in China. She has served as an adviser to the International Energy Agency, the Organization for Economic Development and Cooperation, Lawrence Berkeley Laboratory, and the BaoSteel Company.
WIllIAM CHAnDlER is president of Transition Energy and research director for the Energy Transition Research Institute, and former director of Energy and Climate at the Carnegie Endowment. Chandler is a board member of the Environmental Law Institute and a member of the Committee on the Human Dimensions of Climate Change of the National Academy of Sciences. A former laboratory fellow at Battelle Pacific Northwest National Laboratory (PNNL), Chandler won the Global Climate Technology Leadership Award in 1999.
CARnEGIE EnDoWMEnT foR InTERnATIonAl PEACE The Carnegie Endowment for International Peace is a private, nonprofit organization dedicated to advancing cooperation between nations and promoting active international engagement by the United States. Founded in 1910, its work is nonpartisan and dedicated to achieving practical results.
As it celebrates its Centennial, the Carnegie Endowment is pioneering the first global think tank, with flourishing offices now in Washington, Moscow, Beijing, Beirut, and Brussels. These five locations include the centers of world governance and the places whose political evolution and international policies will most determine the near-term possibilities for international peace and economic advance.
© 2011 CARnEGIE EnDoWMEnT foR InTERnATIonAl PEACE


![High-intensity versus low-intensity physical activity or ... · [Intervention Review] High-intensity versus low-intensity physical activity or exercise in people with hip or knee](https://img.pdfslide.us/doc/110x75/602e37b7b5faa56d200b56dc/high-intensity-versus-low-intensity-physical-activity-or-intervention-review.jpg)