Embed Size (px)
Citation preview

Understanding Dynamic ParallelismKnow your code and know yourself
Presenter: Mark O’Connor, VP Product Management

Agenda
• Introduction and Background
• Fixing a Dynamic Parallelism Bug
• Understanding Dynamic Parallelism
• Questions & Answers
• Parallel development tools company since 2002
‒ Leading in HPC software tools market worldwide
‒ Global customer base
• Making parallel programming accessible to the widest range
of scientists and programmers
‒ Design an unrivaled productive and easy-to-use development environment…
‒ … To help you reach the highest level of performance and scalability
‒ Define a new standard of customer support
Allinea
The Company
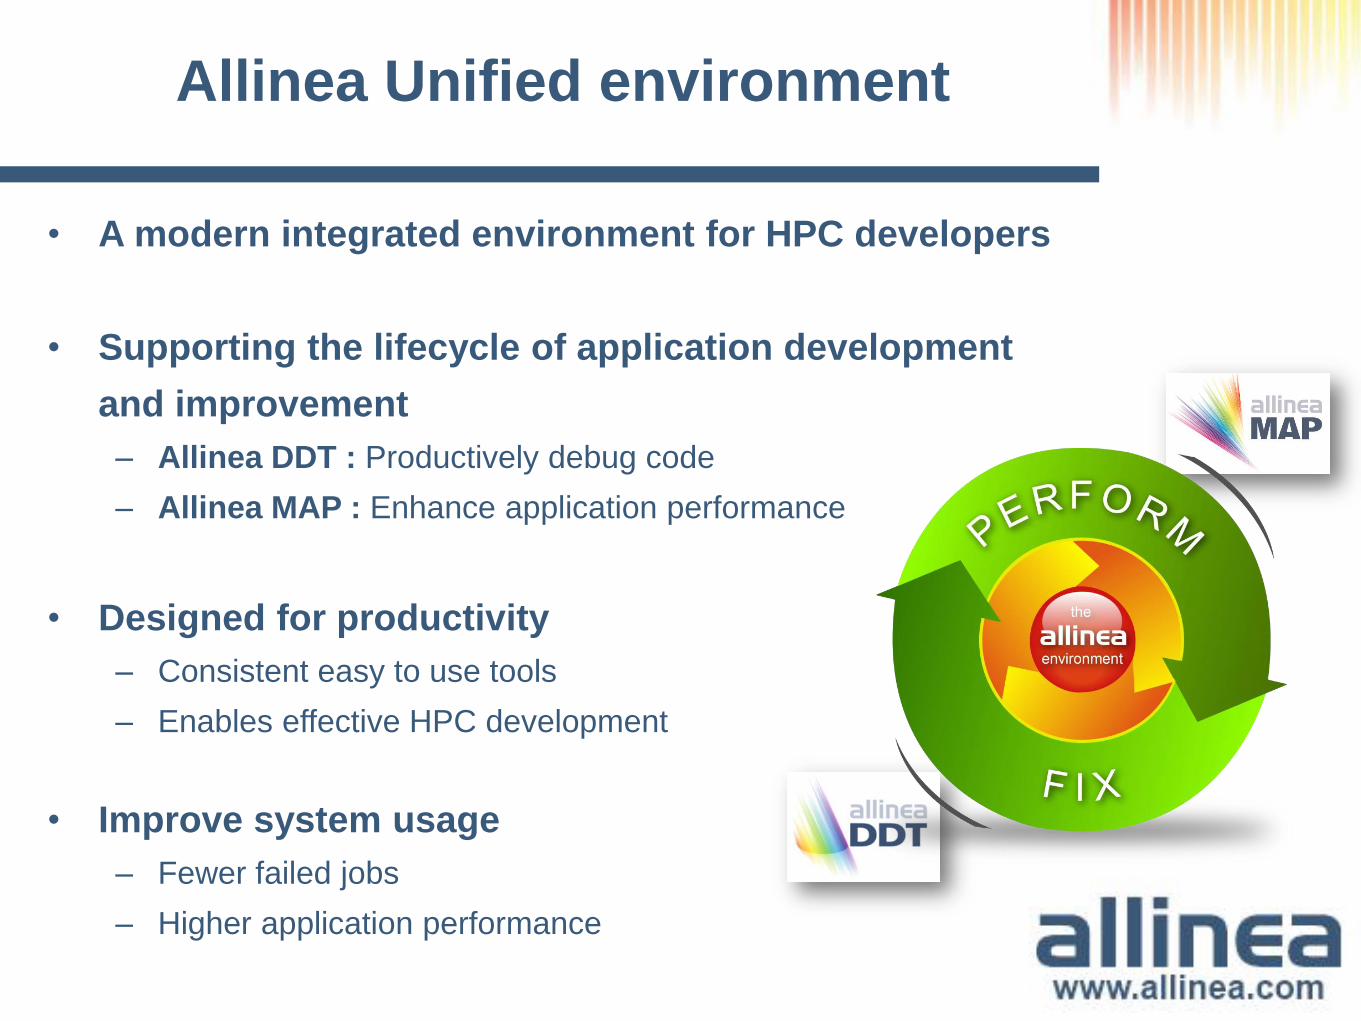
• A modern integrated environment for HPC developers
• Supporting the lifecycle of application development
and improvement
‒ Allinea DDT : Productively debug code
‒ Allinea MAP : Enhance application performance
• Designed for productivity
‒ Consistent easy to use tools
‒ Enables effective HPC development
• Improve system usage
‒ Fewer failed jobs
‒ Higher application performance
Allinea Unified environment

Unified building blocks
in production since 2010
Shared Graphical Interface
Shared Scalable Architecture
Shared Configuration Files
Shared Intelligence and Data Consolidation

• Parallel profiler designed for:
‒ C/C++, Fortran
‒ Multiprocess code
Interdependent or independent processes
‒ Multithreaded code
Monitor the main threads for each process
‒ Accelerated codes
GPUs, Intel Xeon Phi
• Improve productivity :
‒ Helps you detect performance issues quickly and easily
‒ Tells you immediately where your time is spent in your source code
‒ Helps you to optimize your application efficiently
Allinea MAP
Increase application performance
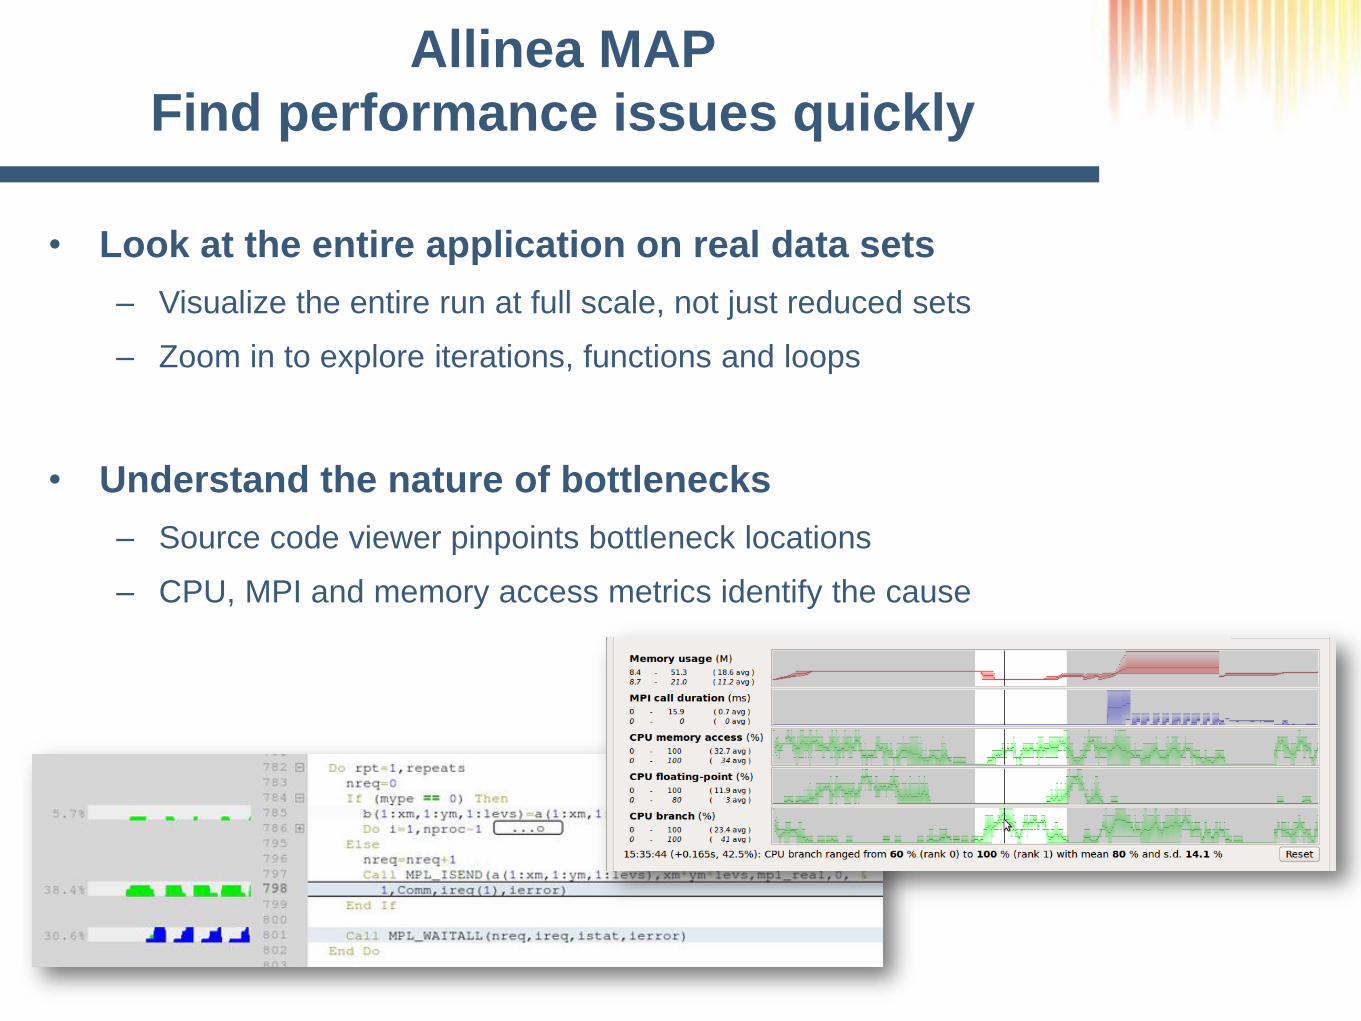
• Look at the entire application on real data sets
– Visualize the entire run at full scale, not just reduced sets
– Zoom in to explore iterations, functions and loops
• Understand the nature of bottlenecks
– Source code viewer pinpoints bottleneck locations
– CPU, MPI and memory access metrics identify the cause
Allinea MAP
Find performance issues quickly

• Graphical debugger designed for:
‒ C/C++, Fortran, UPC, CUDA
‒ Multithreaded code
Single address space
‒ Multiprocess code
Interdependent or independent processes
‒ Accelerated codes
GPUs, Intel Xeon Phi
‒ Any mix of the above
• Slash your time to debug :
‒ Reproduces and triggers your bugs instantly
‒ Helps you easily understand where issues come from quickly
‒ Helps you to fix them as swiftly as possible
Allinea DDT
Fix software problems - fast

• Where did it happen?
‒ Allinea DDT leaps to source automatically
‒ Merges stacks from processes and threads
• How did it happen?
‒ Some faults evident instantly from source
• Why did it happen?
‒ Real-time data comparison and consolidation
‒ Unique “Smart Highlighting” – coloring
differences and changes
‒ Sparklines comparing data across processes
Allinea DDT
Scalable debugging by design
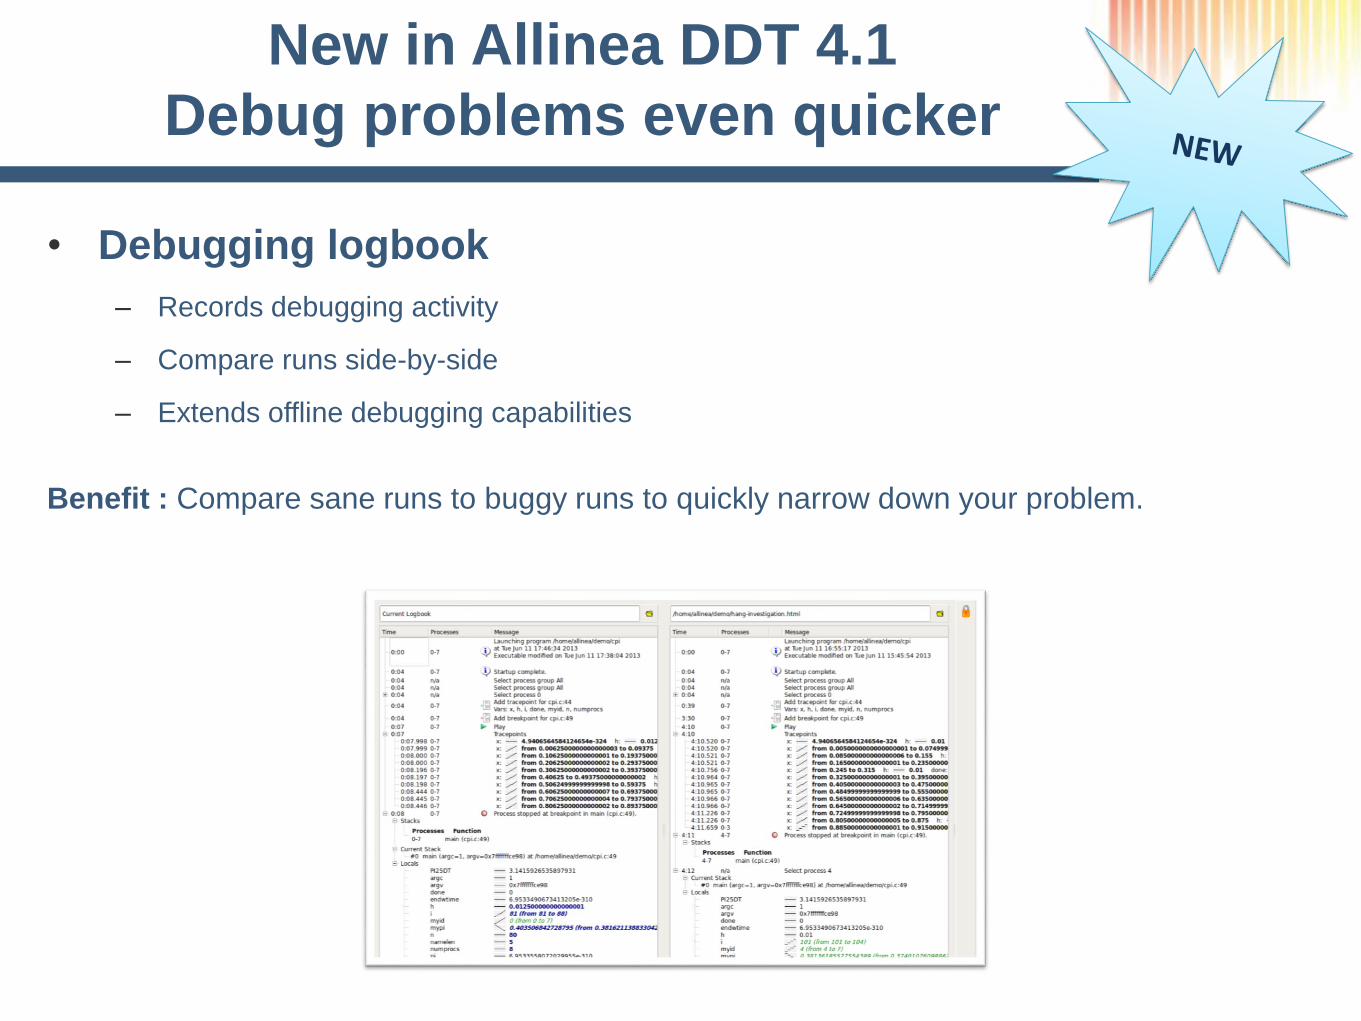
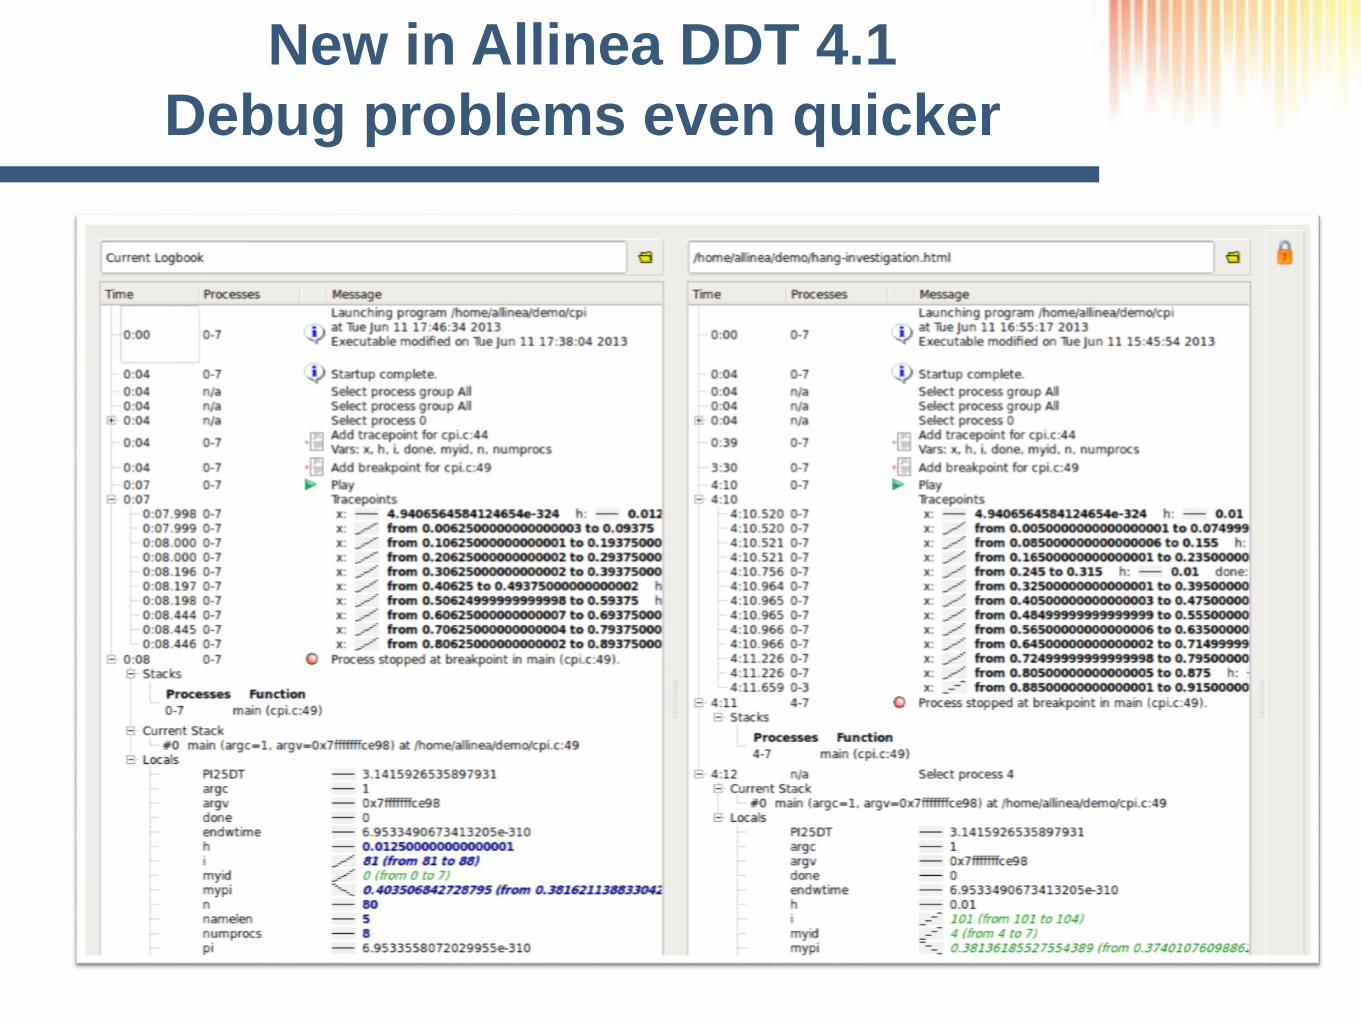
• Debugging logbook
‒ Records debugging activity
‒ Compare runs side-by-side
‒ Extends offline debugging capabilities
Benefit : Compare sane runs to buggy runs to quickly narrow down your problem.
New in Allinea DDT 4.1
Debug problems even quicker
New in Allinea DDT 4.1
Debug problems even quicker

New in Allinea DDT 4.1
Debug problems even quicker
• Version control integration
‒ Highlights where source code has been changed
‒ Source code annotated with a change heatmap
‒ Support for Mercurial, CVS, SVN, Git…
Benefit : Quickly identify the cause of regressions by seeing at a glance what has changed

New in Allinea DDT 4.1
Debug problems even quicker

• Visualization enhancements
‒ Pick cells and interact with them in the debugger –
e.g. set a watchpoint
‒ Display of multiple datasets
‒ Wizard to guide data layout
Benefit: Link visualization to precise memory areas to
shorten the debugging process
New in Allinea DDT 4.1
Tighten the link with VisIt

Leading the way to Innovation
• Support for accelerated environments– CUDA 5.0 and Kepler 20
– Intel Xeon Phi Coprocessor
– GPU directives (both OpenACC and non-OpenACC)
• Support for complex architectures
– Debug and profile MPI, OpenMP and CUDA combinations
– Supports low power CPU architectures (Moonshot program)
– Support for all major compilers, MPI and OpenMP implementations
• Quick resolution of our customer issues
– 90% of support tickets are resolved within 7 days
Murex : NVIDIA Carma Dev Kit
University of Gent

Today: Debugging Dynamic Parallelism on K20

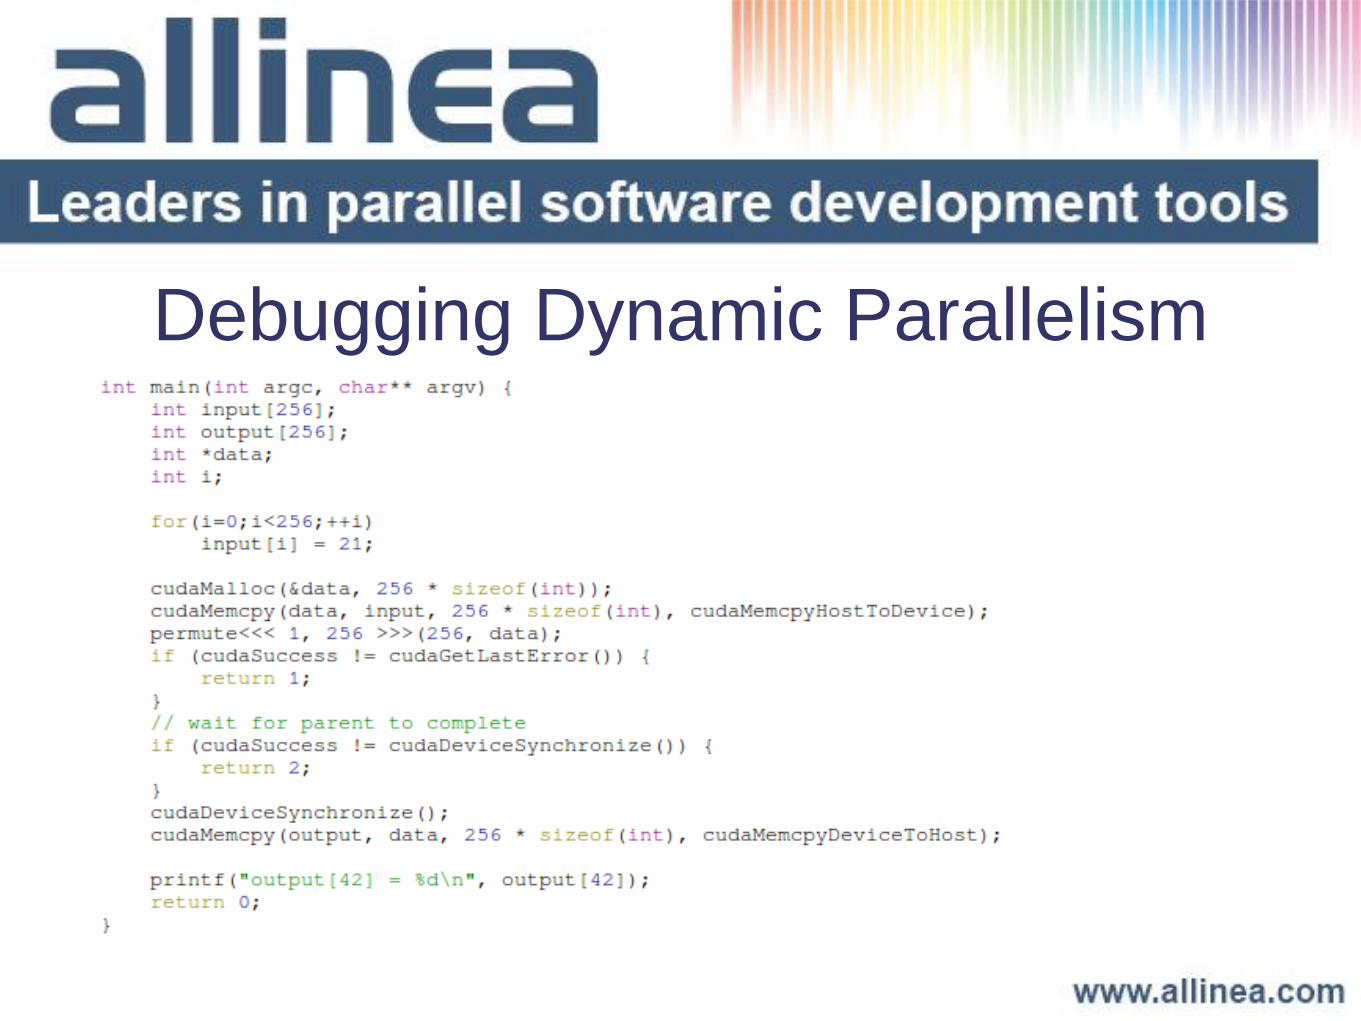
Debugging Dynamic Parallelism
Debugging Dynamic Parallelism

Debugging Dynamic Parallelism
wait, what?


Debugging Dynamic Parallelism

Debugging is About Understanding
Which values are put into data and when?
What's the relationship between n and data?
How many kernels are launched?
What actually
happens here?


Allinea DDT + MAP
See which loops can be offloaded
to the GPU most effectively
with Allinea MAP
Get correct results fast using the
industry-leading parallel debugger
Full support for NVIDIA CUDA 5
An integrated, ready-to-run development suite

Questions and Answers
Mark O’Connor, VP Product Management
Robert Rick, VP Sales, Director of Operations, Americas
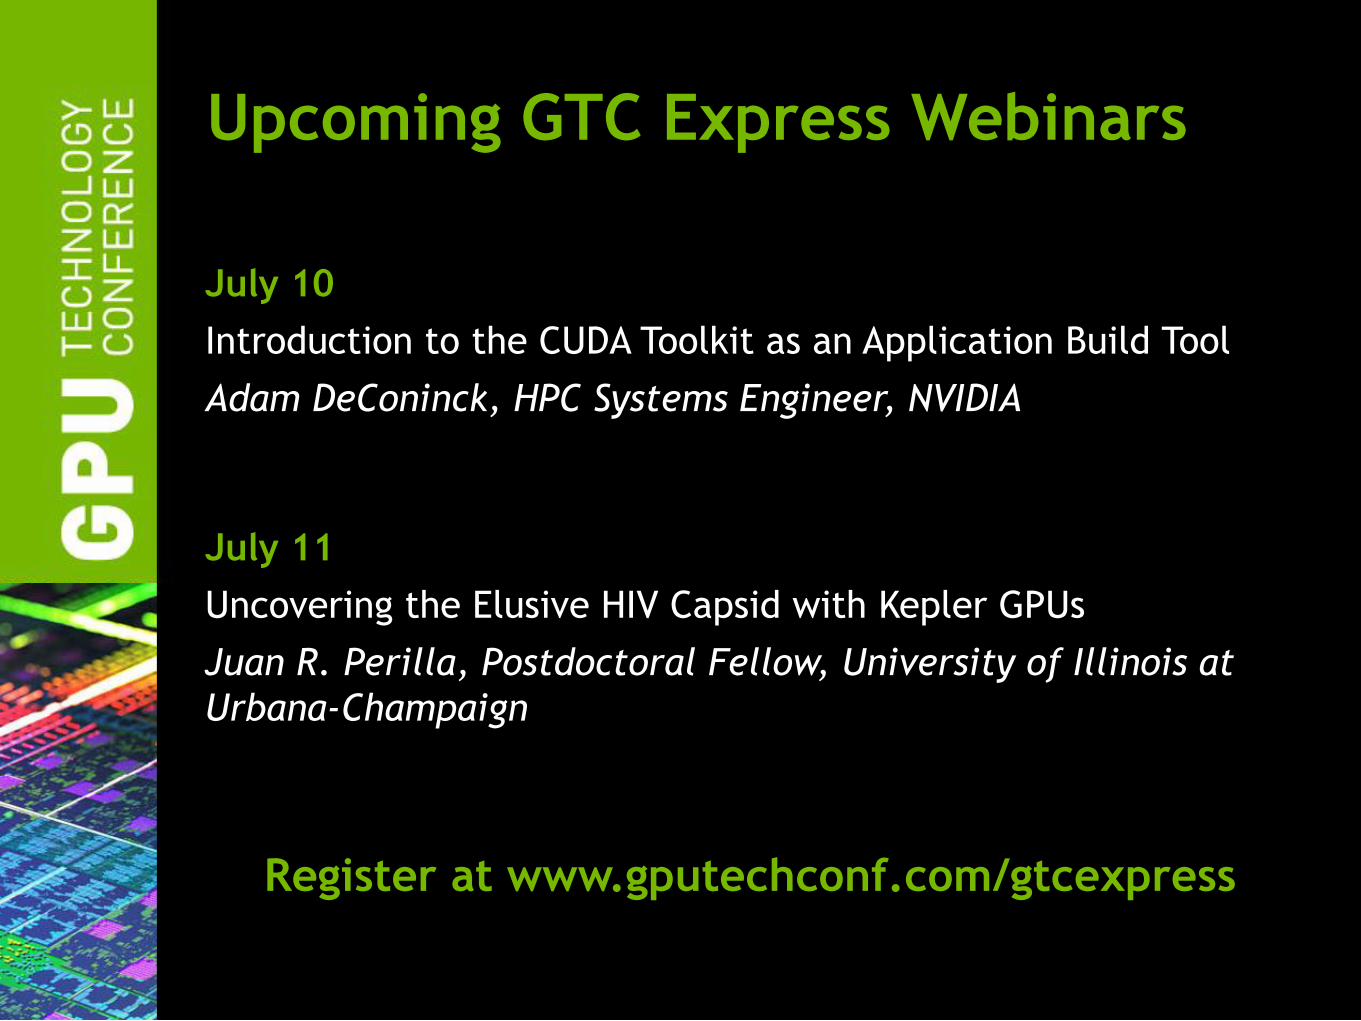
Upcoming GTC Express Webinars
July 10
Introduction to the CUDA Toolkit as an Application Build Tool
Adam DeConinck, HPC Systems Engineer, NVIDIA
July 11
Uncovering the Elusive HIV Capsid with Kepler GPUs
Juan R. Perilla, Postdoctoral Fellow, University of Illinois at
Urbana-Champaign
Register at www.gputechconf.com/gtcexpress