Embed Size (px)
Citation preview

Understanding DNA degradation in decomposed samples
Dr Nick DawnayLiverpool John Moores University
Talk Contents
1. Addressing the key questions• Low quantity vs Low quality
2. Validation data• Data Quality• Performance• Equivalence Testing
3. Degradation index• Experimental Design• Degradation Index• Application to human samples
4. Summary

Addressing the key question
• STR profiling is end game
• Successful STR profiling• Alleles identified• Clear signal:noise• Absence of mixtures• No need to repeat
• Key question:“Can this biological sample yield a DNA profile”
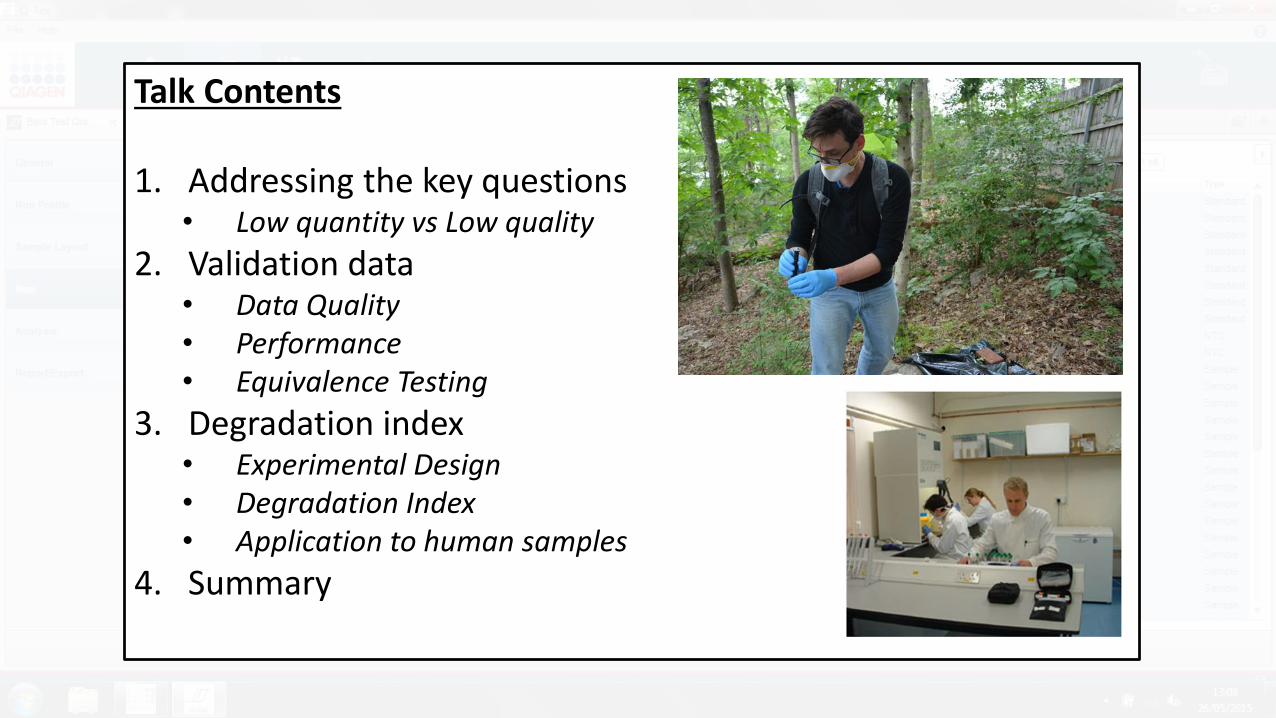
Quantity vs Quality
• ‘Quantity’ assessed by established metric of concentration – pg/µl
• Established relationship between concentration and profile ‘quality’
• Dilution of high molecular weight DNA leads to less amplification

Quantity vs Quality
• ‘Quality’ is a loose term used to capture different issues• Inhibition (environmental, cellular, reagent) • Degradation (HMW:LMW)
• Current quantification kits can infer PCR inhibition pre STR analysis• No current mechanism to identify degradation pre STR analysis
RFLP
miniSTRs
STRs
mtDNA
1000bp
500bp
100bp
50bp
Academic Press 2002

Addressing the key question
• Identification of degradation post analysis is flawed• Lost time in repeat analysis• Lost cost of repeat analysis• Loss of data if sample stopped
• Key Question still “Can this biological sample yield a DNA profile”
• But also….“Can we measure ‘quality’ pre-STR analysis”
NOT HEREHERE

Validation Data – Accuracy
• No significant difference in • R2 between 7 and 4 standards• R2 equal between RGQ and
commercial equivalent (EC)
• Accuracy and precision is better • However, equivalent not run under
recommended conditions
• Precision worsens with low DNA• Typical observation• Seen in both kits
Autosomal Y-linked
Acc
ura
cy (
%)

Degradation – Lab Experiment
• DNA degradation• 1ng/µl control DNA sonicated• Instrument RGQ-5Plex• Ran at 500pg and 50pg
• Analysis using Degradation Index
• Independent ratio analysis• Autosomal marker at 91bp vs 353bp• Y-marker at 81bp and 359bp
Co
ntr
ol D
NA
1M
inu
te
2 M
inu
tes
5M
inu
tes
10
Min
ute
s
30
min
ute
s
1 H
ou
r
2 H
ou
rs

Degradation – Laboratory Results
• Results show• Less HMW DNA results in higher
Degradation scores• Relationship is consistent over 10 fold
change in DNA concertation• Suggests that variation in index score
occurs with more degradation
• Results need supporting with STR profiling to assess prediction

Degradation – Application in research
• Ongoing research project • Field detection of human remains• Optimising sample recovery• Assessing sample success rates
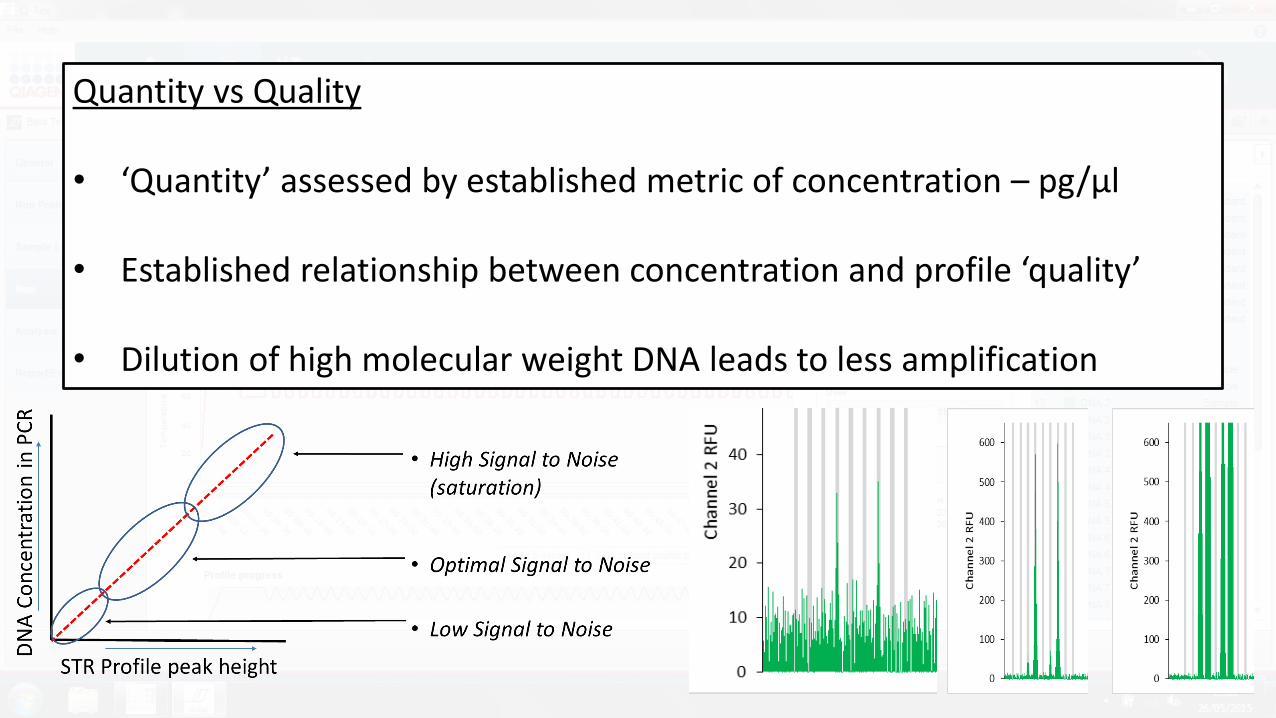
Summary
• The Quantiplex RGQ kit performs well when compared to equivalent
• Data supports its use in DNA quantification applications
• New degradation index functions very well on laboratory research samples
• Further sample assessment will provide further confidence
• Degradation index needs to link to STR result – not performed in study
Thank you for listening
Any Questions?
Acknowledgement toDr. Suzzanne McCollDr. Jari LouhelainenMr Jack Morrison


![Addressing Key Structural Vulnerabilities for [Africa’s] LDCs](https://img.pdfslide.us/doc/110x75/56813bf2550346895da52ace/addressing-key-structural-vulnerabilities-for-africas-ldcs.jpg)