Embed Size (px)
Citation preview
Understanding Direct Care Workers:
A Snapshot of Two of America’s Most
Important Jobs
Certified Nursing Assistants and Home Health Aides
March 2011
U.S. Department of Health and Human Services
ii
Office of the Assistant Secretary for Planning and Evaluation
The Office of the Assistant Secretary for Planning and Evaluation (ASPE), the principal advisor to the Secretary of the Department of Health and Human Services (HHS) on policy development issues, is responsible for major activities in the areas of legislative and budget development, strategic planning, policy research and evaluation, and economic analysis.
ASPE develops or reviews issues from the viewpoint of the Secretary, providing a perspective that is broader in scope than the specific focus of the various operating agencies. ASPE also works closely with the HHS operating divisions. It assists these agencies in developing policies and in planning policy research, evaluation, and data collection within broad HHS and administration initiatives. ASPE often serves a coordinating role for cross-cutting policy and administrative activities.
ASPE plans and conducts evaluations and research—both in-house and through support of projects by external researchers—of current and proposed programs and topics of particular interest to the Secretary, the Administration, and the Congress.
Office of Disability, Aging and Long-Term Care Policy
The Office of Disability, Aging and Long-Term Care Policy (DALTCP), within ASPE, is responsible for the development, coordination, analysis, research, and evaluation of HHS policies and programs that support the independence, health, and long-term care of persons with disabilities—children, working aging adults, and older persons. DALTCP is also responsible for policy coordination and research to promote the economic and social well-being of the elderly.
In particular, DALTCP addresses policies concerning nursing home and community-based services, informal caregiving, the integration of acute and long-term care, Medicare post-acute services and home care, managed care for people with disabilities, long-term rehabilitation services, children’s disability, and linkages between employment and health policies. These activities are carried out through policy planning, policy and program analysis, regulatory reviews, formulation of legislative proposals, policy research, evaluation, and data planning.
This report was prepared under contract # HHSP23320095651WC between HHS’s ASPE/DALTCP and RTI International. For additional information about this subject, contact the ASPE Project Officer, Marie R. Squillace, Ph.D., at HHS/ASPE/DALTCP, Rm. 424E20, H.H. Humphrey Building, 200 Independence Avenue, S.W., Washington, D.C. 20201. Her e-mail address is [email protected]
Understanding Direct Care Workers:
A Snapshot of Two of America’s Most
Important Jobs
Certified Nursing Assistants and Home Health Aides
March 2011
U.S. Department of Health and Human Services
iv
Authors & Production
RTI International Galina Khatutsky, M.S.Joshua Wiener, Ph.D.
Wayne Anderson, Ph.D.Valentina Akhmerova, M.S.
E. Andrew Jessup
U.S. Department of Health and Human Services Office of the Assistant Secretary for Planning and Evaluation
Marie R. Squillace, Ph.D.
Acknowledgement
We thank Anita Bercovitz, Ph.D., and Lauren Harris-Kojetin, Ph.D., from the National Center for Health Statistics, Long Term Care Statistics Branch, for their helpful comments
on earlier drafts of the chart book and for their analytic support.
v
Contents
Definitions . . . . . . . . . . . . . . . . . . . . . . . . . . . . . . . . . . . . . . . . . . . . . . . . . . . . . . . . . . . . . . . . . . . . . . vi
Introduction . . . . . . . . . . . . . . . . . . . . . . . . . . . . . . . . . . . . . . . . . . . . . . . . . . . . . . . . . . . . . . . . . . . . . 1
Chapter 1 Choosing Direct Care Work . . . . . . . . . . . . . . . . . . . . . . . . . . . . . . . . . . . . . . . . . . . . . . . . . . . . . . 3
Chapter 2 Finding a Job . . . . . . . . . . . . . . . . . . . . . . . . . . . . . . . . . . . . . . . . . . . . . . . . . . . . . . . . . . . . . . . . . . 13
Chapter 3 Training to Become a Direct Care Worker . . . . . . . . . . . . . . . . . . . . . . . . . . . . . . . . . . . . . . 19
Chapter 4 A Low-Wage, Low-Fringe Benefits Job . . . . . . . . . . . . . . . . . . . . . . . . . . . . . . . . . . . . . . . . . 25
Chapter 5 A Difficult Job . . . . . . . . . . . . . . . . . . . . . . . . . . . . . . . . . . . . . . . . . . . . . . . . . . . . . . . . . . . . . . . . . 34
Chapter 6 Turnover Is a Serious Problem . . . . . . . . . . . . . . . . . . . . . . . . . . . . . . . . . . . . . . . . . . . . . . . . . 41
Chapter 7 The Benefits Outweigh the Risks . . . . . . . . . . . . . . . . . . . . . . . . . . . . . . . . . . . . . . . . . . . . . . 48
Conclusion . . . . . . . . . . . . . . . . . . . . . . . . . . . . . . . . . . . . . . . . . . . . . . . . . . . . . . . . . . . . . . . . . . . . . 56
Appendix A Survey Limitations . . . . . . . . . . . . . . . . . . . . . . . . . . . . . . . . . . . . . . . . . . . . . . . . . . . . . . . . . . . . . 57
Appendix B Links to Data Files . . . . . . . . . . . . . . . . . . . . . . . . . . . . . . . . . . . . . . . . . . . . . . . . . . . . . . . . . . . . . 58
Appendix C For More Information . . . . . . . . . . . . . . . . . . . . . . . . . . . . . . . . . . . . . . . . . . . . . . . . . . . . . . . . . . 59
References . . . . . . . . . . . . . . . . . . . . . . . . . . . . . . . . . . . . . . . . . . . . . . . . . . . . . . . . . . . . . . . . . . . . . 62
vi
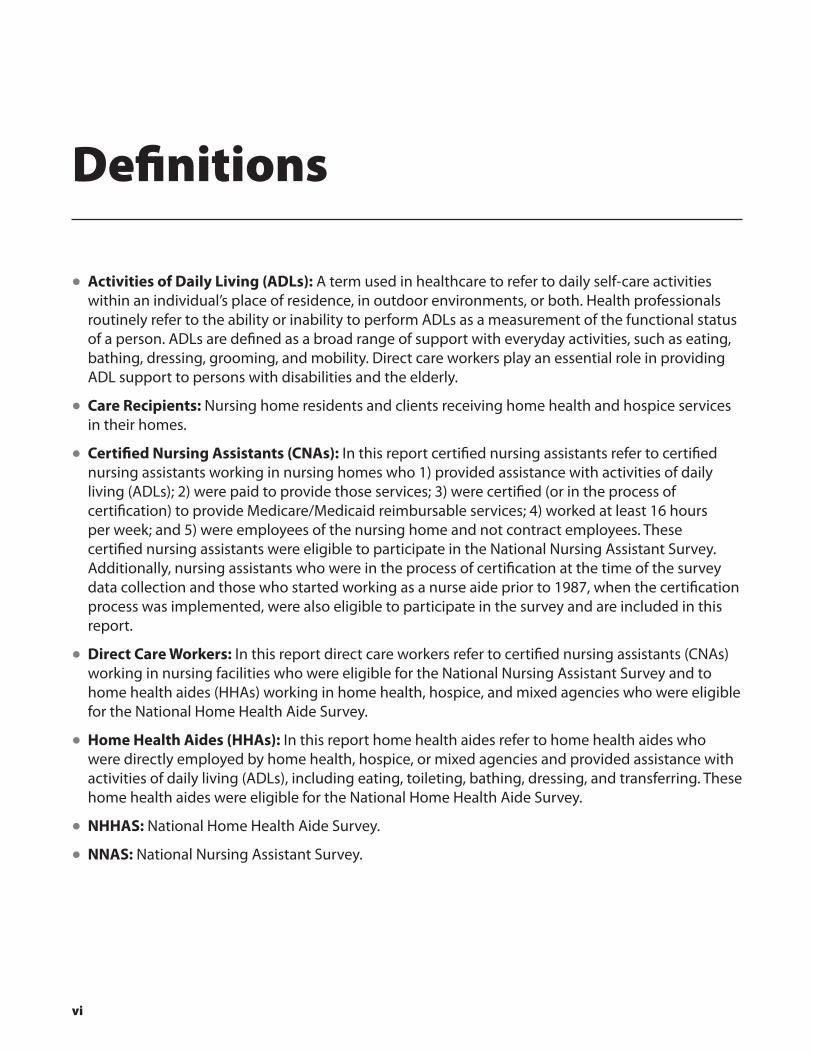
Definitions
•Activities of Daily Living (ADLs): A term used in healthcare to refer to daily self-care activities within an individual’s place of residence, in outdoor environments, or both. Health professionals routinely refer to the ability or inability to perform ADLs as a measurement of the functional status of a person. ADLs are defined as a broad range of support with everyday activities, such as eating, bathing, dressing, grooming, and mobility. Direct care workers play an essential role in providing ADL support to persons with disabilities and the elderly.
•Care Recipients: Nursing home residents and clients receiving home health and hospice services in their homes.
•Certified Nursing Assistants (CNAs): In this report certified nursing assistants refer to certified nursing assistants working in nursing homes who 1) provided assistance with activities of daily living (ADLs); 2) were paid to provide those services; 3) were certified (or in the process of certification) to provide Medicare/Medicaid reimbursable services; 4) worked at least 16 hours per week; and 5) were employees of the nursing home and not contract employees. These certified nursing assistants were eligible to participate in the National Nursing Assistant Survey. Additionally, nursing assistants who were in the process of certification at the time of the survey data collection and those who started working as a nurse aide prior to 1987, when the certification process was implemented, were also eligible to participate in the survey and are included in this report.
•Direct Care Workers: In this report direct care workers refer to certified nursing assistants (CNAs) working in nursing facilities who were eligible for the National Nursing Assistant Survey and to home health aides (HHAs) working in home health, hospice, and mixed agencies who were eligible for the National Home Health Aide Survey.
•Home Health Aides (HHAs): In this report home health aides refer to home health aides who were directly employed by home health, hospice, or mixed agencies and provided assistance with activities of daily living (ADLs), including eating, toileting, bathing, dressing, and transferring. These home health aides were eligible for the National Home Health Aide Survey.
•NHHAS: National Home Health Aide Survey.
•NNAS: National Nursing Assistant Survey.
1
Introduction
Direct care workers − nurse aides, home health aides, and personal and home care aides − are the primary providers of paid hands-on care for more than 13 million elderly and disabled Americans. They assist individuals with a broad range of support including preparing meals, helping with medications, bathing, dressing, getting about (mobility), and getting to planned activities on a daily basis. Their service and dedication is exemplary and their role in enhancing the lives of others is vital. They make it possible for individuals to live meaningful lives in their homes and communities and remain connected to their families.
Although direct care workers constitute one of the largest and fastest-growing sectors of the workforce, there is a documented critical and growing shortage of these workers in every community throughout the United States. There is significant need to attract many more direct care workers in the near future.
The U.S. Department of Health and Human Services is working to improve the quality of direct care jobs and stabilize this workforce on a number of fronts. For over a decade, the Office of the Assistant Secretary for Planning and Evaluation (ASPE) has made the direct care workforce a major focal point of its policy research agenda. ASPE has convened expert meetings and conferences; produced seminal reports and reports to Congress on the long-term care workforce; reviewed state-based policies and provider practice initiatives; examined the utility and efficacy of worker registries, background checks, and wage pass-throughs; explored potential new sources of new workers; and sponsored a number of program evaluations and demonstrations. The Patient Protection and Affordable Care Act (P.L. 111-148) strengthens the investment in direct care work by authorizing several new initiatives aimed at improving the quality of direct care jobs, workforce development, and long-term care.
This chart book highlights findings from two new ASPE-sponsored national surveys: The 2004 National Nursing Assistant Survey and the 2007 National Home Health Aide Survey. Both surveys represent a major advance in the data available about two of America’s most important jobs − certified nursing assistants working in nursing homes and home health aides working in home and hospice care settings. The chart book is intended to help multiple audiences understand these jobs, issues, and challenges; and to establish useful benchmarks as goals toward which improvement efforts might aspire.
2
Today’s direct care workers must have the strength to care for others, the commitment to remain involved in continuing education, and the compassion to provide hands-on care. They are the experts at knowing what persons with disabilities and elderly individuals want and need, and they always respond to both. That’s the power of direct care work. This chart book is their story.
Marie R. Squillace, Ph.D. U.S. Department of Health and Human Services
3
Chapter 1
Choosing Direct Care Work
There is a great shortage of CNAs and HHAs. According to one study, in 2007, there were over 60,000 vacancies for CNAs in nursing homes (American Health Care Association, 2008).1 With the aging of the population, demand for these workers will increase dramatically over time. In fact, the U.S. Bureau of Labor Statistics projects that, between 2008 and 2018, the demand for CNAs and HHAs will increase by about 19 and 50 percent, respectively (U.S. Bureau of Labor Statistics, 2010).2 The sociodemographic characteristics of these workers are important to understand as this workforce is difficult to recruit and retain.
•Most direct care workers have limited education and low household incomes, with high levels of previous use of public assistance programs.
• Reflecting their educational and financial status, females, immigrants, and ethnic and racial minorities are disproportionately represented in the direct care workforce.
• Immigrants represent a large labor pool with the potential to help alleviate labor shortages in long-term care. Immigrant workers tend to be better educated than non-immigrants, possibly reflecting their educational attainment prior to their arrival to the United States. However, growing ethnic diversity among direct care workers may lead to communication difficulties. Immigrant workers in particular report more difficulties than native-born workers in communicating with care recipients because they speak a different language.
• High proportions of long-term care workers must balance employment with substantial family caregiving obligations, potentially adding stress to the job and adding to the days missed from work.
4
Direct Care Workers in Long-Term Care
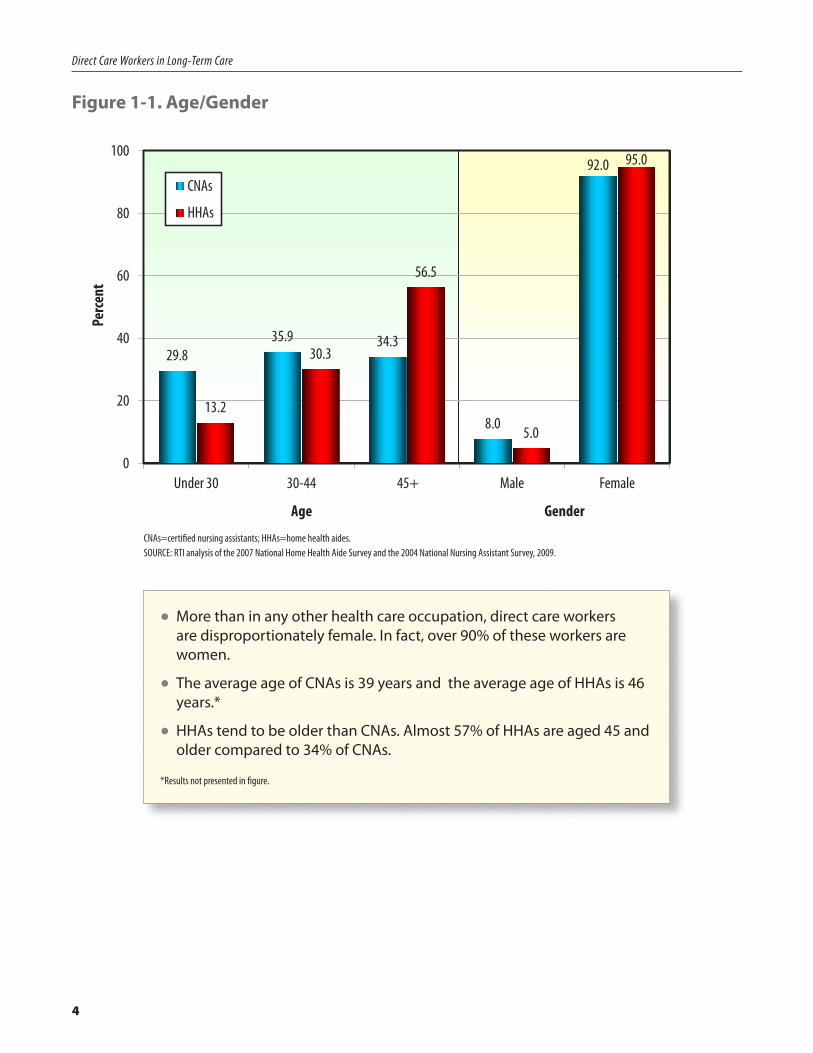
Figure 1-1. Age/Gender
29.835.9 34.3
8.0
92.0
13.2
30.3
56.5
5.0
95.0
0
20
40
60
80
100
Under 30 30-44 45+ Male Female
Perc
ent
CNAs
HHAs
GenderAge
CNAs=certified nursing assistants; HHAs=home health aides.SOURCE: RTI analysis of the 2007 National Home Health Aide Survey and the 2004 National Nursing Assistant Survey, 2009.
•More than in any other health care occupation, direct care workers are disproportionately female. In fact, over 90% of these workers are women.
•The average age of CNAs is 39 years and the average age of HHAs is 46 years.*
•HHAs tend to be older than CNAs. Almost 57% of HHAs are aged 45 and older compared to 34% of CNAs.
*Results not presented in figure.
5
Direct Care Workers in Long-Term Care
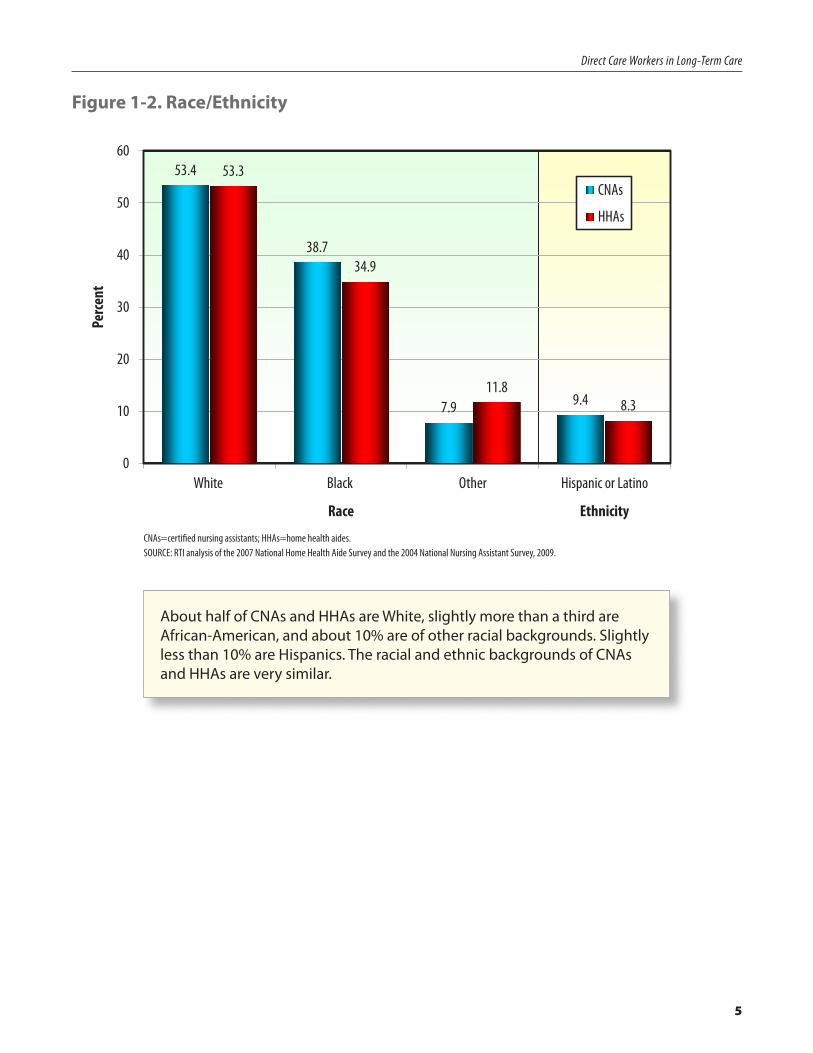
Figure 1-2. Race/Ethnicity
53.4
38.7
7.9 9.4
53.3
34.9
11.88.3
0
10
20
30
40
50
60
White Black Other Hispanic or Latino
Perc
ent
CNAs
HHAs
EthnicityRace
CNAs=certified nursing assistants; HHAs=home health aides.SOURCE: RTI analysis of the 2007 National Home Health Aide Survey and the 2004 National Nursing Assistant Survey, 2009.
About half of CNAs and HHAs are White, slightly more than a third are African-American, and about 10% are of other racial backgrounds. Slightly less than 10% are Hispanics. The racial and ethnic backgrounds of CNAs and HHAs are very similar.
6
Direct Care Workers in Long-Term Care
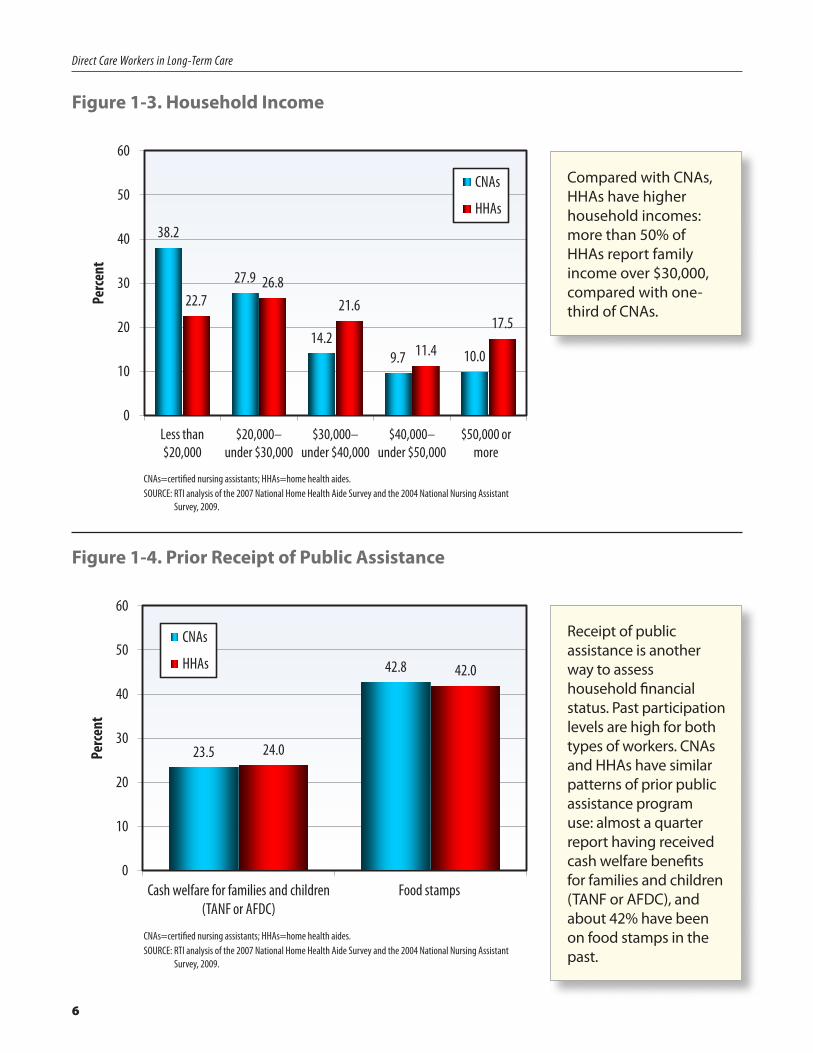
Figure 1-3. Household Income
38.2
27.9
14.29.7 10.0
22.726.8
21.6
11.4
17.5
0
10
20
30
40
50
60
Less than $20,000
$20,000–under $30,000
$30,000–under $40,000
$40,000–under $50,000
$50,000 or more
Perc
ent
CNAs
HHAs
CNAs=certified nursing assistants; HHAs=home health aides.SOURCE: RTI analysis of the 2007 National Home Health Aide Survey and the 2004 National Nursing Assistant
Survey, 2009.
Compared with CNAs, HHAs have higher household incomes: more than 50% of HHAs report family income over $30,000, compared with one-third of CNAs.
Figure 1-4. Prior Receipt of Public Assistance
23.5
42.8
24.0
42.0
0
10
20
30
40
50
60
Cash welfare for families and children (TANF or AFDC)
Food stamps
Perc
ent
CNAs
HHAs
CNAs=certified nursing assistants; HHAs=home health aides.SOURCE: RTI analysis of the 2007 National Home Health Aide Survey and the 2004 National Nursing Assistant
Survey, 2009.
Receipt of public assistance is another way to assess household financial status. Past participation levels are high for both types of workers. CNAs and HHAs have similar patterns of prior public assistance program use: almost a quarter report having received cash welfare benefits for families and children (TANF or AFDC), and about 42% have been on food stamps in the past.
7
Direct Care Workers in Long-Term Care
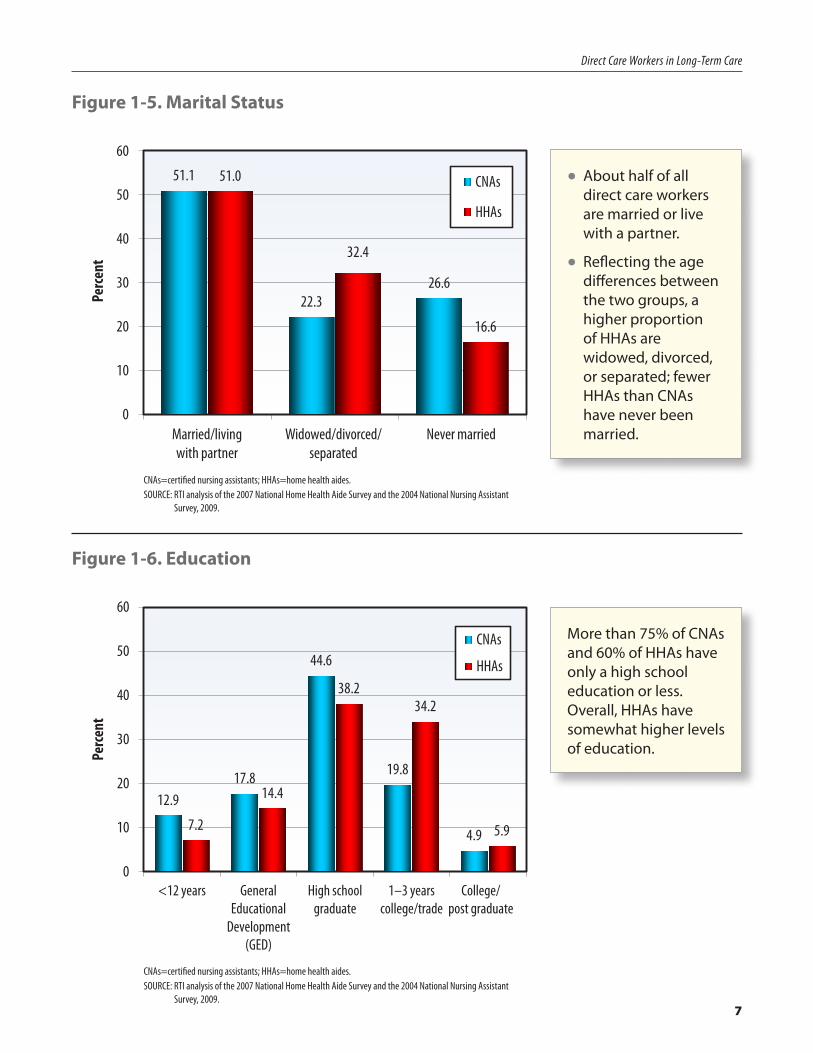
Figure 1-5. Marital Status
51.1
22.326.6
51.0
32.4
16.6
0
10
20
30
40
50
60
Married/living with partner
Widowed/divorced/separated
Never married
Perc
ent
CNAs
HHAs
CNAs=certified nursing assistants; HHAs=home health aides.SOURCE: RTI analysis of the 2007 National Home Health Aide Survey and the 2004 National Nursing Assistant
Survey, 2009.
•About half of all direct care workers are married or live with a partner.
•Reflecting the age differences between the two groups, a higher proportion of HHAs are widowed, divorced, or separated; fewer HHAs than CNAs have never been married.
Figure 1-6. Education
12.917.8
44.6
19.8
4.97.2
14.4
38.234.2
5.9
0
10
20
30
40
50
60
<12 years General Educational
Development (GED)
High school graduate
1–3 years college/trade
College/post graduate
Perc
ent
CNAs
HHAs
CNAs=certified nursing assistants; HHAs=home health aides.SOURCE: RTI analysis of the 2007 National Home Health Aide Survey and the 2004 National Nursing Assistant
Survey, 2009.
More than 75% of CNAs and 60% of HHAs have only a high school education or less. Overall, HHAs have somewhat higher levels of education.
8
Direct Care Workers in Long-Term Care
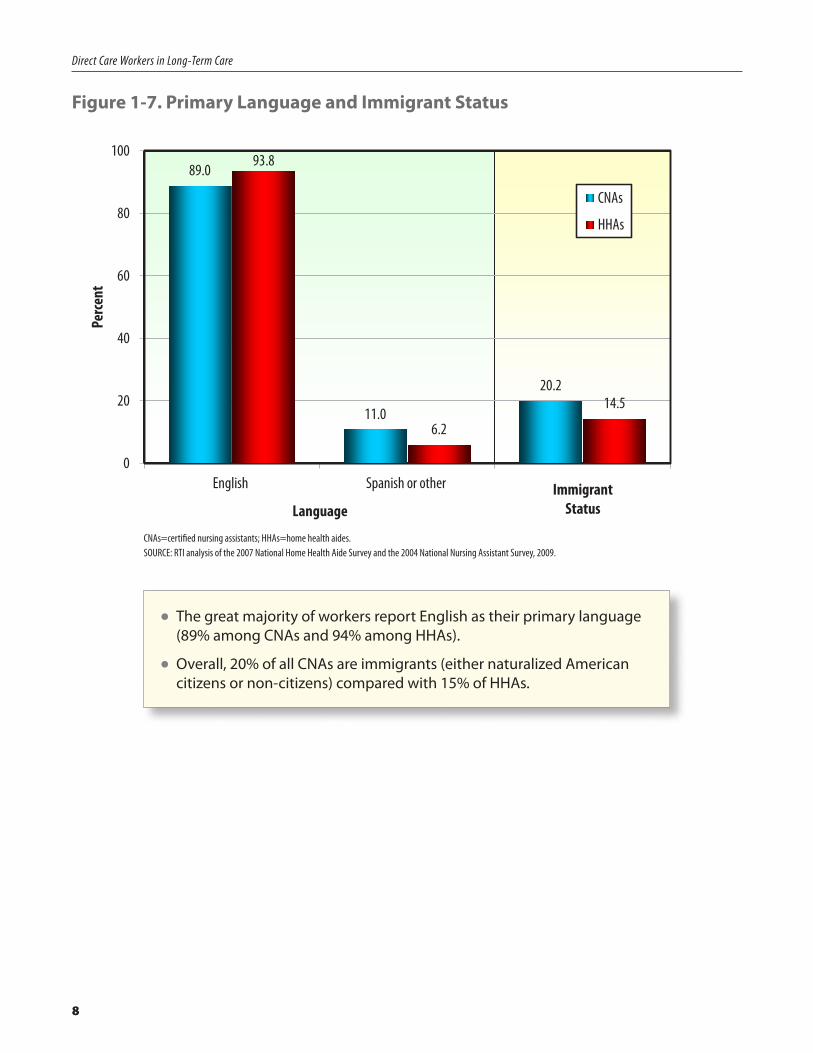
Figure 1-7. Primary Language and Immigrant Status
89.0
11.0
20.2
93.8
6.2
14.5
0
20
40
60
80
100
English Spanish or other
Perc
ent
CNAs
HHAs
Immigrant StatusLanguage
CNAs=certified nursing assistants; HHAs=home health aides.SOURCE: RTI analysis of the 2007 National Home Health Aide Survey and the 2004 National Nursing Assistant Survey, 2009.
•The great majority of workers report English as their primary language (89% among CNAs and 94% among HHAs).
•Overall, 20% of all CNAs are immigrants (either naturalized American citizens or non-citizens) compared with 15% of HHAs.
9
Direct Care Workers in Long-Term Care
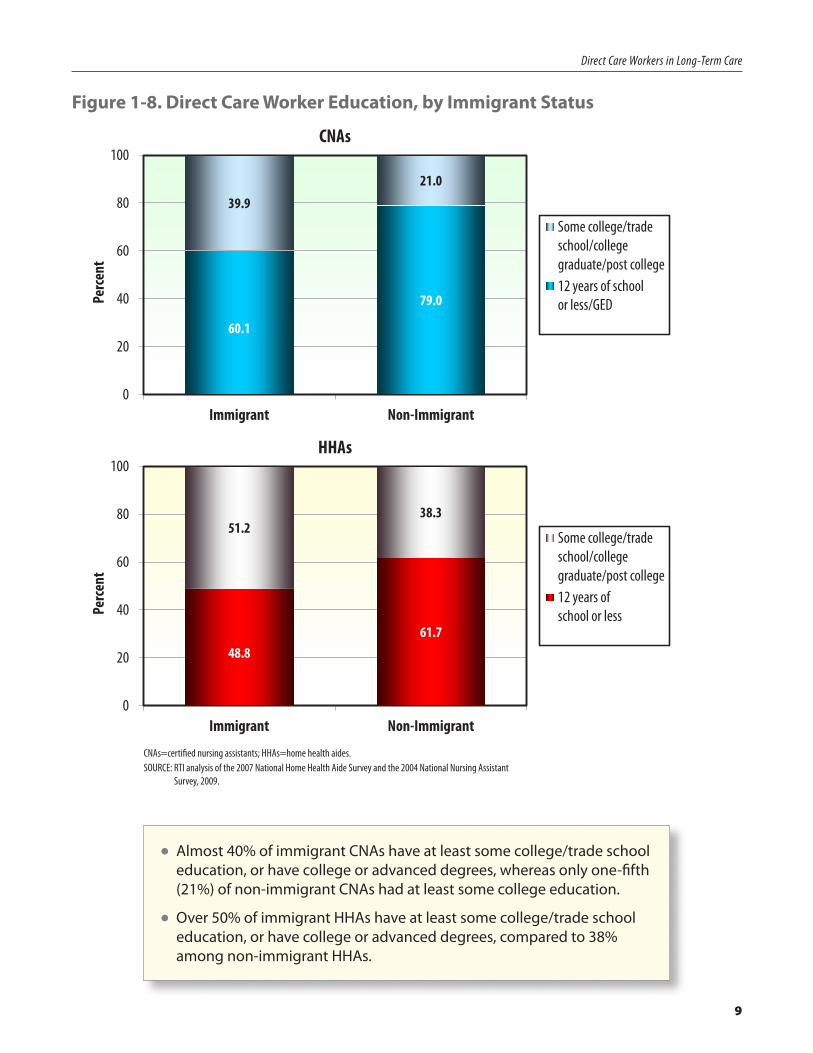
Figure 1-8. Direct Care Worker Education, by Immigrant Status
60.1
79.0
39.9
21.0
0
20
40
60
80
100
Immigrant Non-Immigrant
Perc
ent
Some college/trade school/college graduate/post college12 years of school or less/GED
CNAs
HHAs
48.861.7
51.238.3
0
20
40
60
80
100
Immigrant Non-Immigrant
Perc
ent
Some college/trade school/college graduate/post college12 years of school or less
CNAs=certified nursing assistants; HHAs=home health aides.SOURCE: RTI analysis of the 2007 National Home Health Aide Survey and the 2004 National Nursing Assistant
Survey, 2009.
•Almost 40% of immigrant CNAs have at least some college/trade school education, or have college or advanced degrees, whereas only one-fifth (21%) of non-immigrant CNAs had at least some college education.
•Over 50% of immigrant HHAs have at least some college/trade school education, or have college or advanced degrees, compared to 38% among non-immigrant HHAs.
10
Direct Care Workers in Long-Term Care
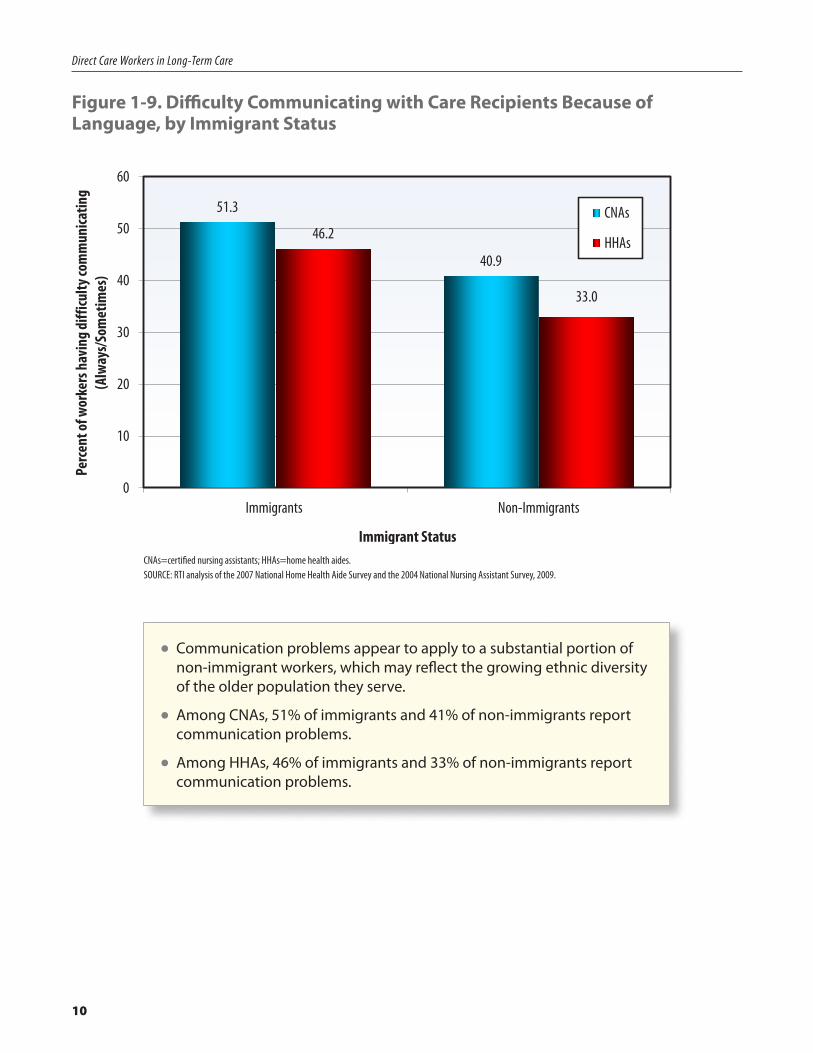
Figure 1-9. Difficulty Communicating with Care Recipients Because of Language, by Immigrant Status
51.3
40.9
46.2
33.0
0
10
20
30
40
50
60
Immigrants Non-Immigrants
Perc
ent o
f wor
kers
hav
ing d
ifficu
lty co
mm
unica
ting
(Alw
ays/S
omet
imes
)
CNAs
HHAs
Immigrant StatusCNAs=certified nursing assistants; HHAs=home health aides.SOURCE: RTI analysis of the 2007 National Home Health Aide Survey and the 2004 National Nursing Assistant Survey, 2009.
•Communication problems appear to apply to a substantial portion of non-immigrant workers, which may reflect the growing ethnic diversity of the older population they serve.
•Among CNAs, 51% of immigrants and 41% of non-immigrants report communication problems.
•Among HHAs, 46% of immigrants and 33% of non-immigrants report communication problems.
11
Direct Care Workers in Long-Term Care
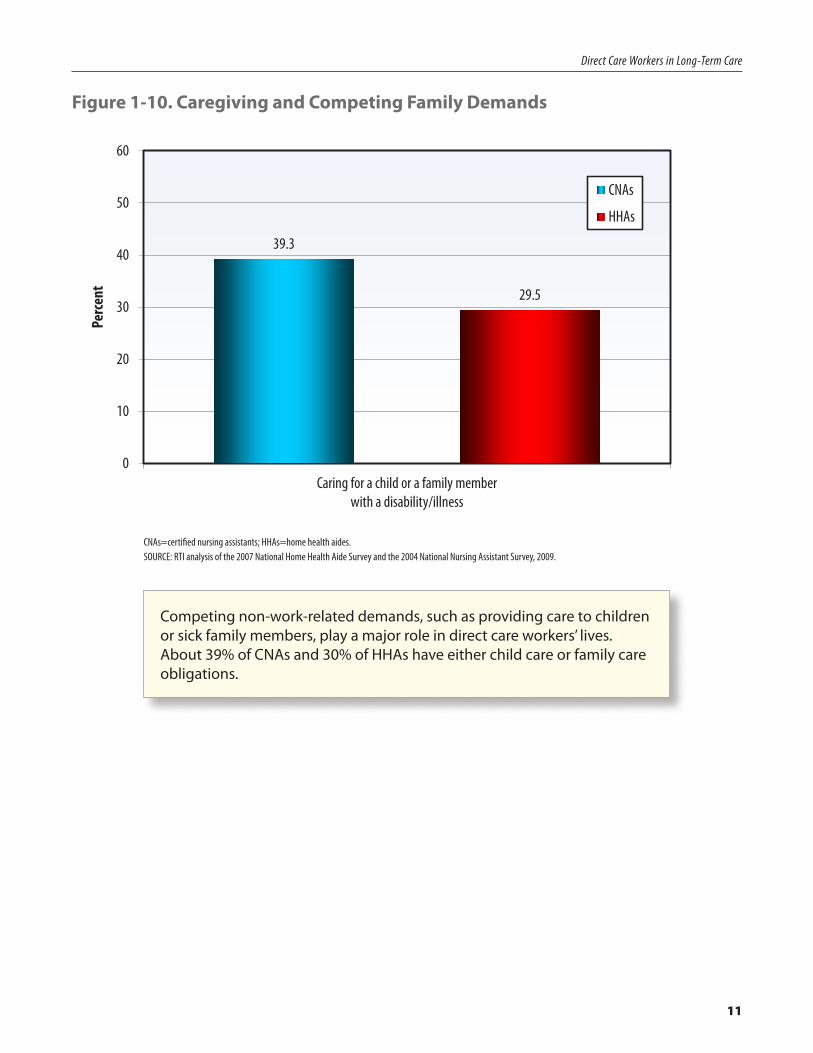
Figure 1-10. Caregiving and Competing Family Demands
39.3
29.5
0
10
20
30
40
50
60
Caring for a child or a family member with a disability/illness
Perc
ent
CNAs
HHAs
CNAs=certified nursing assistants; HHAs=home health aides.SOURCE: RTI analysis of the 2007 National Home Health Aide Survey and the 2004 National Nursing Assistant Survey, 2009.
Competing non-work-related demands, such as providing care to children or sick family members, play a major role in direct care workers’ lives. About 39% of CNAs and 30% of HHAs have either child care or family care obligations.
12
Direct Care Workers in Long-Term Care
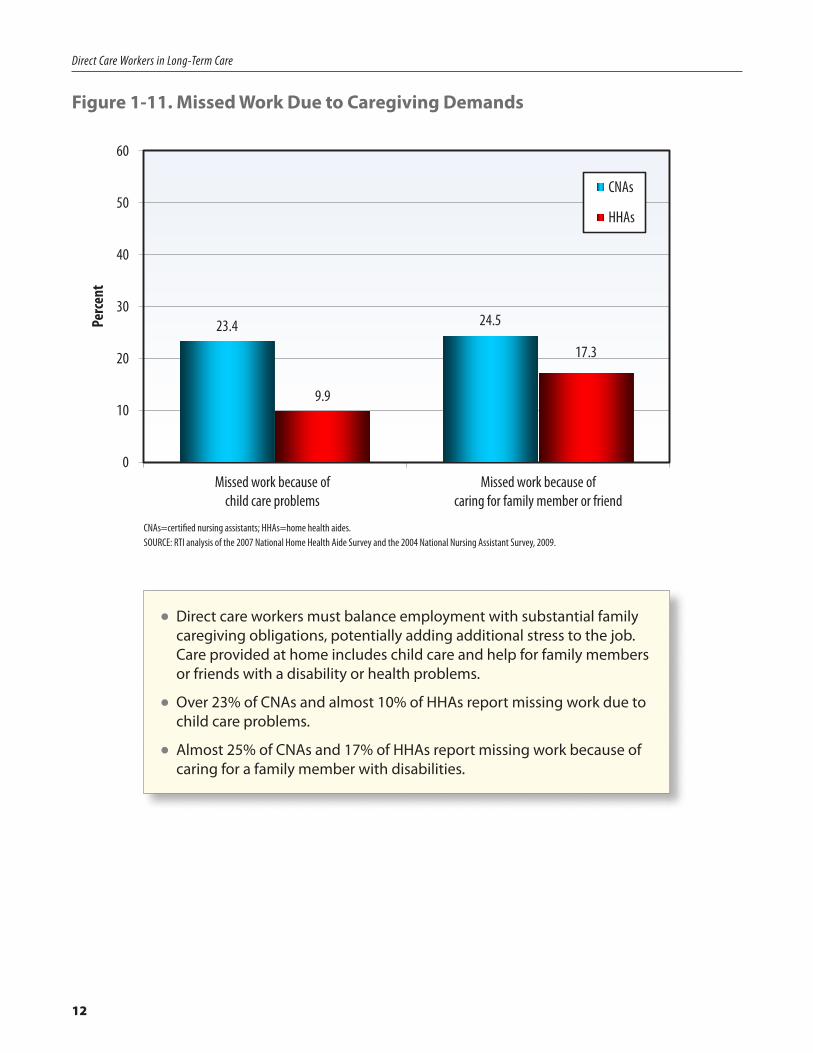
Figure 1-11. Missed Work Due to Caregiving Demands
23.4 24.5
9.9
17.3
0
10
20
30
40
50
60
Missed work because of child care problems
Missed work because of caring for family member or friend
Perc
ent
CNAs
HHAs
CNAs=certified nursing assistants; HHAs=home health aides.SOURCE: RTI analysis of the 2007 National Home Health Aide Survey and the 2004 National Nursing Assistant Survey, 2009.
•Direct care workers must balance employment with substantial family caregiving obligations, potentially adding additional stress to the job. Care provided at home includes child care and help for family members or friends with a disability or health problems.
•Over 23% of CNAs and almost 10% of HHAs report missing work due to child care problems.
•Almost 25% of CNAs and 17% of HHAs report missing work because of caring for a family member with disabilities.
13
Chapter 2
Finding a Job
Increasing the number of qualified applicants for the growing number of positions is one strategy to reduce the long-term care workforce shortage. Effective recruitment strategies are important components of increasing the number of direct care workers. Up until now, little was known about how potential applicants learn about direct care jobs and what attracts workers to the long-term care field.
• Direct care workers learn about becoming a CNA or HHA and find their jobs through family and friends, working in another health care setting, newspaper advertisements and articles, and school or job training.
• The great majority of CNAs and HHAs become direct care workers because they want to help others, suggesting that these workers are not interchangeable with other low-wage workers.
• In their recruitment efforts, providers and policymakers need to recognize the importance of local family connections and community ties.
•Most CNAs work for for-profit and 100- to 199-bed facilities. Most HHAs work for for-profit agencies and for organizations that exclusively provide home health services.
14
Direct Care Workers in Long-Term Care
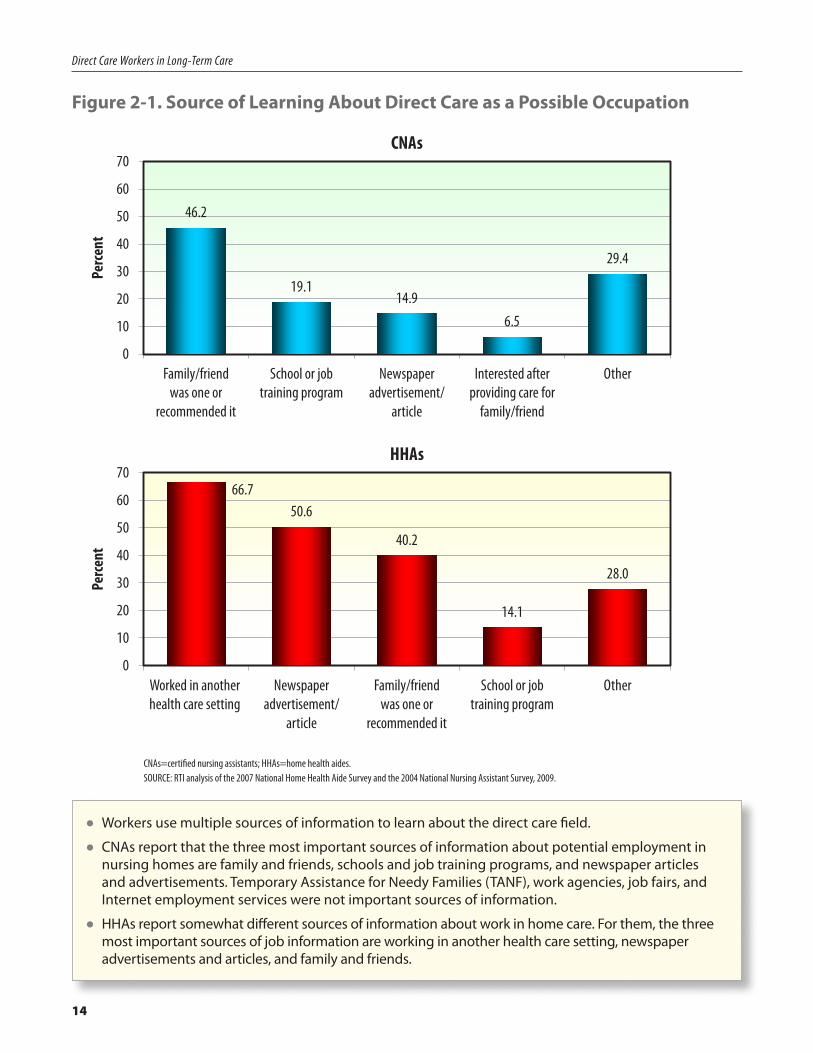
Figure 2-1. Source of Learning About Direct Care as a Possible Occupation
46.2
19.1 14.9
6.5
29.4
0
10
20
30
40
50
60
70
Family/friend was one or
recommended it
School or job training program
Newspaper advertisement/
article
Interested after providing care for
family/friend
Other
Perc
ent
CNAs
66.7 50.6
40.2
14.1
28.0
0
10
20
30
40
50
60
70
Worked in another health care setting
Newspaper advertisement/
article
Family/friend was one or
recommended it
School or job training program
Other
Perc
ent
HHAs
CNAs=certified nursing assistants; HHAs=home health aides.SOURCE: RTI analysis of the 2007 National Home Health Aide Survey and the 2004 National Nursing Assistant Survey, 2009.
•Workers use multiple sources of information to learn about the direct care field.
•CNAs report that the three most important sources of information about potential employment in nursing homes are family and friends, schools and job training programs, and newspaper articles and advertisements. Temporary Assistance for Needy Families (TANF), work agencies, job fairs, and Internet employment services were not important sources of information.
•HHAs report somewhat different sources of information about work in home care. For them, the three most important sources of job information are working in another health care setting, newspaper advertisements and articles, and family and friends.
15
Direct Care Workers in Long-Term Care
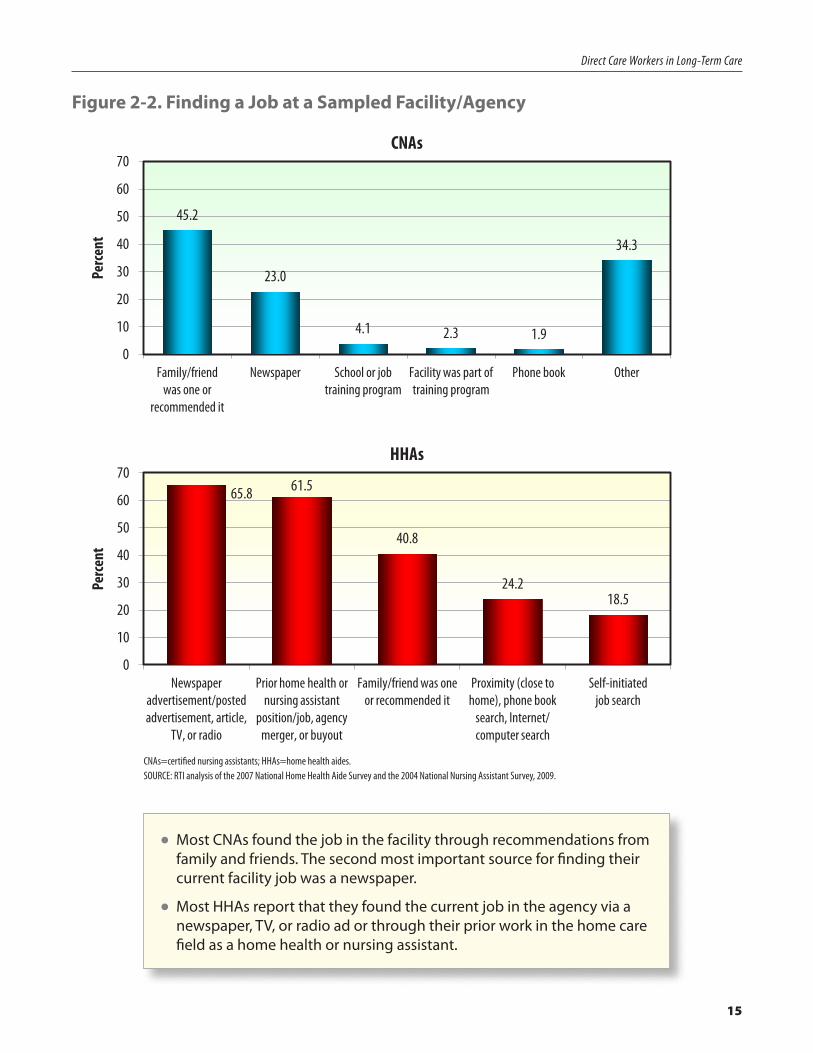
Figure 2-2. Finding a Job at a Sampled Facility/Agency
45.2
23.0
4.1 2.3 1.9
34.3
0
10
20
30
40
50
60
70
Family/friend was one or
recommended it
Newspaper School or job training program
Facility was part of training program
Phone book Other
Perc
ent
CNAs
65.8 61.5
40.8
24.2 18.5
0
10
20
30
40
50
60
70
Newspaper advertisement/posted advertisement, article,
TV, or radio
Prior home health or nursing assistant
position/job, agency merger, or buyout
Family/friend was one or recommended it
Proximity (close to home), phone book
search, Internet/ computer search
Self-initiated job search
Perc
ent
HHAs
CNAs=certified nursing assistants; HHAs=home health aides.SOURCE: RTI analysis of the 2007 National Home Health Aide Survey and the 2004 National Nursing Assistant Survey, 2009.
•Most CNAs found the job in the facility through recommendations from family and friends. The second most important source for finding their current facility job was a newspaper.
•Most HHAs report that they found the current job in the agency via a newspaper, TV, or radio ad or through their prior work in the home care field as a home health or nursing assistant.
16
Direct Care Workers in Long-Term Care
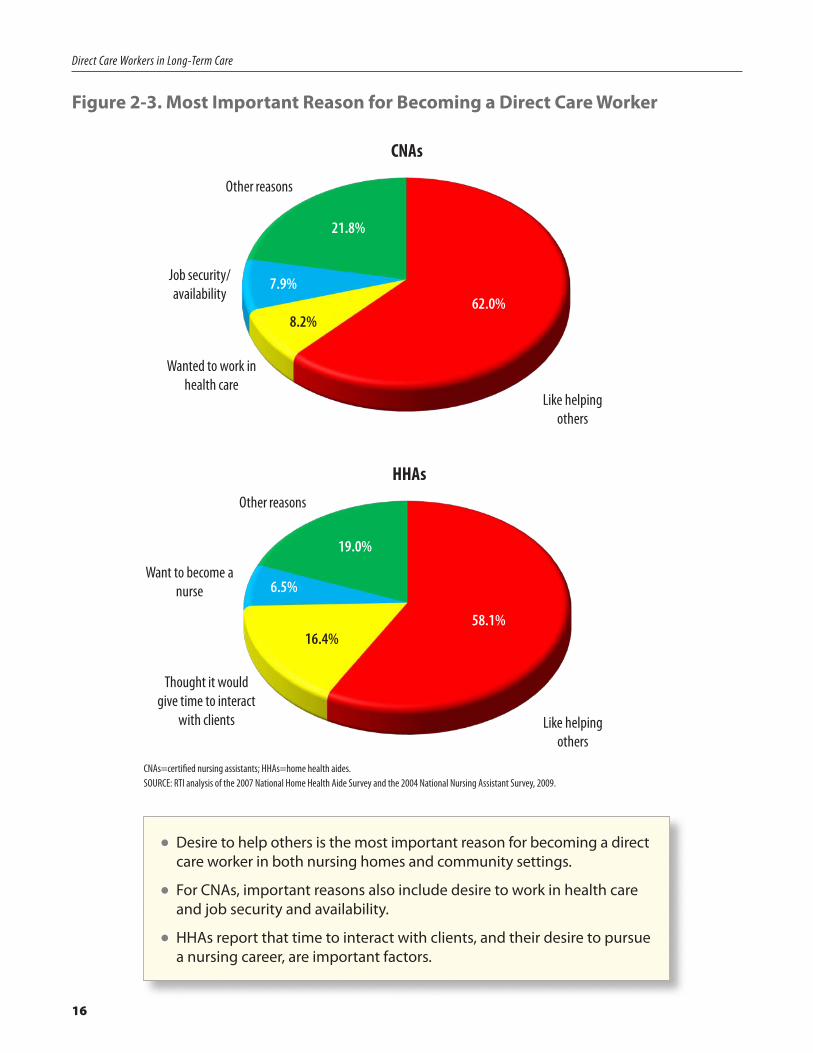
Figure 2-3. Most Important Reason for Becoming a Direct Care Worker
Like helping others
Wanted to work in health care
Job security/ availability
Other reasons
CNAs
21.8%
62.0%7.9%
8.2%
HHAs
Like helping others
Thought it would give time to interact
with clients
Want to become a nurse
Other reasons
19.0%
58.1%
6.5%
16.4%
CNAs=certified nursing assistants; HHAs=home health aides.SOURCE: RTI analysis of the 2007 National Home Health Aide Survey and the 2004 National Nursing Assistant Survey, 2009.
•Desire to help others is the most important reason for becoming a direct care worker in both nursing homes and community settings.
•For CNAs, important reasons also include desire to work in health care and job security and availability.
•HHAs report that time to interact with clients, and their desire to pursue a nursing career, are important factors.
17
Direct Care Workers in Long-Term Care
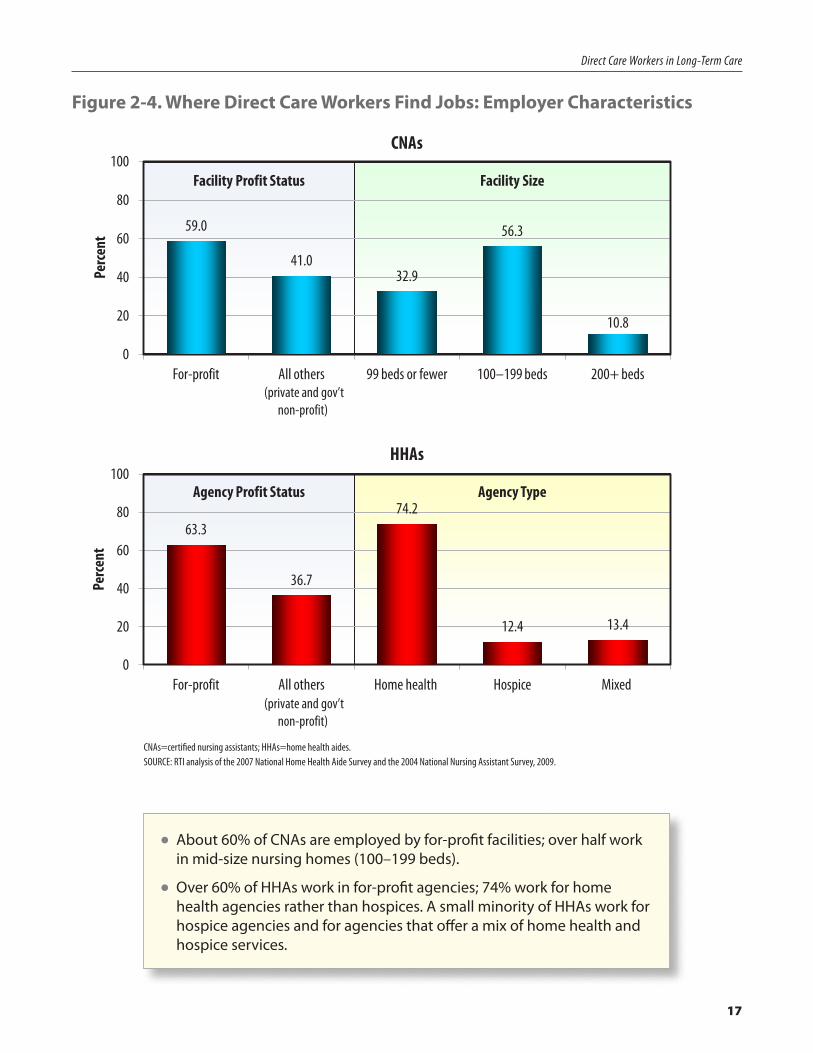
Figure 2-4. Where Direct Care Workers Find Jobs: Employer Characteristics
59.0
41.032.9
56.3
10.8
0
20
40
60
80
100
For-profit All others 99 beds or fewer 100–199 beds 200+ beds
Perc
ent
Facility SizeFacility Profit Status
CNAs
(private and gov’tnon-profit)
HHAs
63.3
36.7
74.2
12.4 13.4
0
20
40
60
80
100
For-profit All others Home health Hospice Mixed
Perc
ent
Agency TypeAgency Profit Status
(private and gov’tnon-profit)
CNAs=certified nursing assistants; HHAs=home health aides.SOURCE: RTI analysis of the 2007 National Home Health Aide Survey and the 2004 National Nursing Assistant Survey, 2009.
•About 60% of CNAs are employed by for-profit facilities; over half work in mid-size nursing homes (100–199 beds).
•Over 60% of HHAs work in for-profit agencies; 74% work for home health agencies rather than hospices. A small minority of HHAs work for hospice agencies and for agencies that offer a mix of home health and hospice services.
18
Direct Care Workers in Long-Term Care
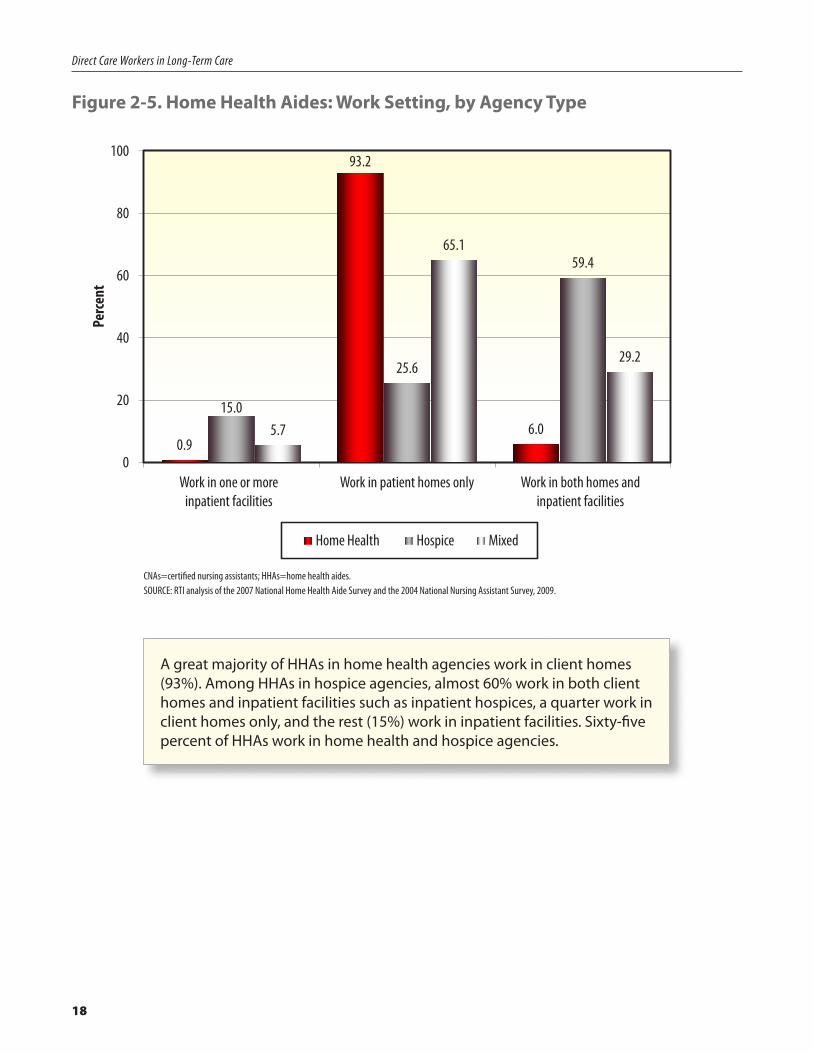
Figure 2-5. Home Health Aides: Work Setting, by Agency Type
0.9
93.2
6.015.0
25.6
59.4
5.7
65.1
29.2
0
20
40
60
80
100
Work in one or more inpatient facilities
Work in patient homes only Work in both homes and inpatient facilities
Perc
ent
Home Health Hospice Mixed
CNAs=certified nursing assistants; HHAs=home health aides.SOURCE: RTI analysis of the 2007 National Home Health Aide Survey and the 2004 National Nursing Assistant Survey, 2009.
A great majority of HHAs in home health agencies work in client homes (93%). Among HHAs in hospice agencies, almost 60% work in both client homes and inpatient facilities such as inpatient hospices, a quarter work in client homes only, and the rest (15%) work in inpatient facilities. Sixty-five percent of HHAs work in home health and hospice agencies.
19
Chapter 3
Training to Become a Direct Care Worker
Inadequate training may lead to poor job performance and quality of care, which in turn may result in low levels of job satisfaction and high turnover rates. Job training includes initial instruction and continuing education. Obstacles to more and better training include tuition costs and time constraints. The need for better training was recognized by the Patient Protection and Affordable Care Act of 2010, which establishes a new three-year program to provide infrastructure support for the development, evaluation, and demonstration of a competency-based curriculum to train qualified nursing assistants and home health aides (Pub.L.111-148, Affordable Care Act).
•More than half of all CNAs receive their initial training at nursing facilities, and most HHAs are trained at community colleges or vocational or trade schools.
• A great majority of all direct care workers report being well prepared for the job by their initial training. More HHAs than CNAs report being well prepared for their job. Workers feel better prepared for direct care work when they receive hands-on training or when their training is evenly split between hands-on and classroom training.
• Training costs and time constraints represent a substantial barrier to becoming a direct care worker. Almost one-third of all CNAs paid out of pocket for their initial training. Similar data are not available for HHAs.
• Career advancement opportunities are very important to direct care workers. They often cite this as a reason to stay on the current job and value supervisors who are supportive of their career advancement.
20
Direct Care Workers in Long-Term Care
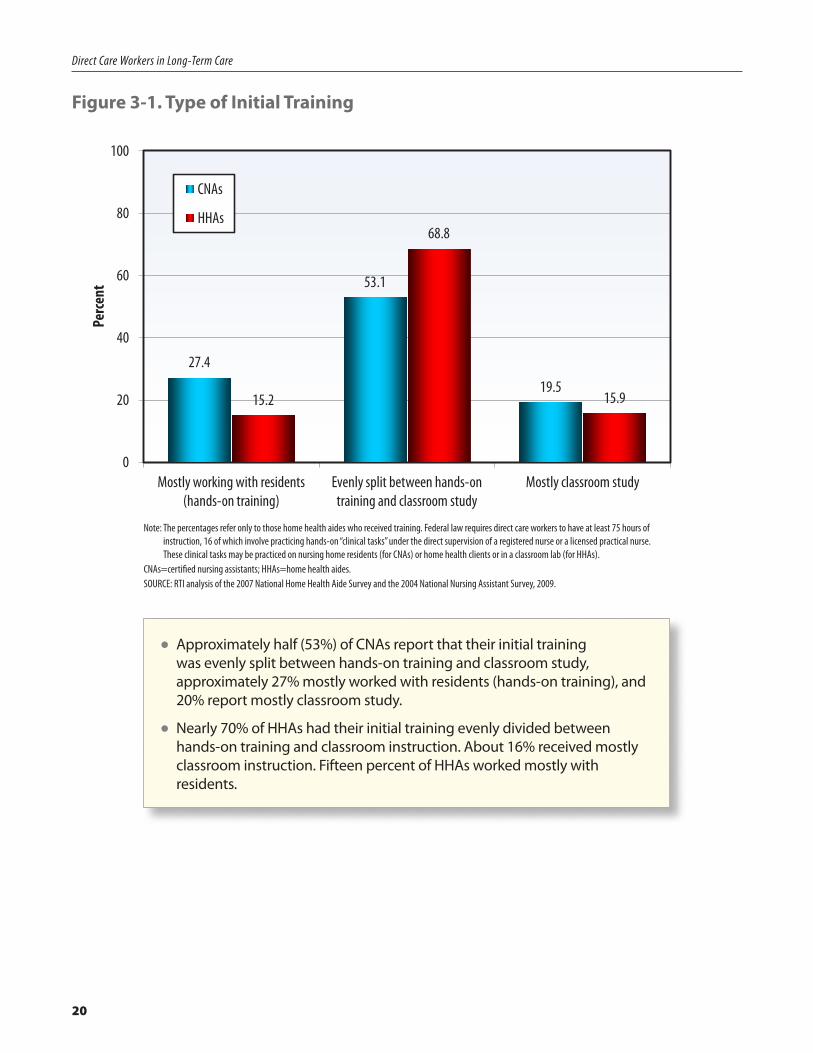
Figure 3-1. Type of Initial Training
27.4
53.1
19.515.2
68.8
15.9
0
20
40
60
80
100
Mostly working with residents (hands-on training)
Evenly split between hands-on training and classroom study
Mostly classroom study
Perc
ent
CNAs
HHAs
Note: The percentages refer only to those home health aides who received training. Federal law requires direct care workers to have at least 75 hours of instruction, 16 of which involve practicing hands-on “clinical tasks” under the direct supervision of a registered nurse or a licensed practical nurse. These clinical tasks may be practiced on nursing home residents (for CNAs) or home health clients or in a classroom lab (for HHAs).
CNAs=certified nursing assistants; HHAs=home health aides.SOURCE: RTI analysis of the 2007 National Home Health Aide Survey and the 2004 National Nursing Assistant Survey, 2009.
•Approximately half (53%) of CNAs report that their initial training was evenly split between hands-on training and classroom study, approximately 27% mostly worked with residents (hands-on training), and 20% report mostly classroom study.
•Nearly 70% of HHAs had their initial training evenly divided between hands-on training and classroom instruction. About 16% received mostly classroom instruction. Fifteen percent of HHAs worked mostly with residents.
21
Direct Care Workers in Long-Term Care
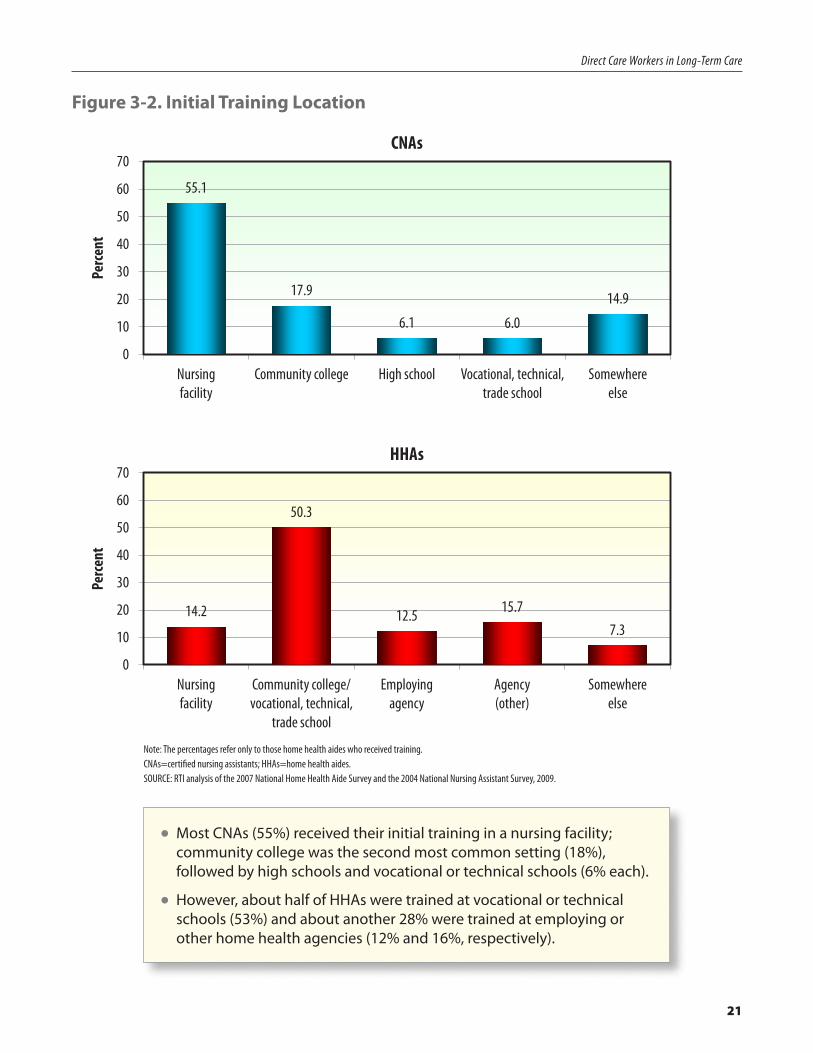
Figure 3-2. Initial Training Location
55.1
17.9
6.1 6.0
14.9
0
10
20
30
40
50
60
70
Nursing facility
Community college High school Vocational, technical, trade school
Somewhere else
Perc
ent
CNAs
14.2
50.3
12.5 15.7 7.3
0
10
20
30
40
50
60
70
Nursing facility
Community college/ vocational, technical,
trade school
Employing agency
Agency (other)
Somewhere else
Perc
ent
HHAs
Note: The percentages refer only to those home health aides who received training.CNAs=certified nursing assistants; HHAs=home health aides.SOURCE: RTI analysis of the 2007 National Home Health Aide Survey and the 2004 National Nursing Assistant Survey, 2009.
•Most CNAs (55%) received their initial training in a nursing facility; community college was the second most common setting (18%), followed by high schools and vocational or technical schools (6% each).
•However, about half of HHAs were trained at vocational or technical schools (53%) and about another 28% were trained at employing or other home health agencies (12% and 16%, respectively).
22
Direct Care Workers in Long-Term Care
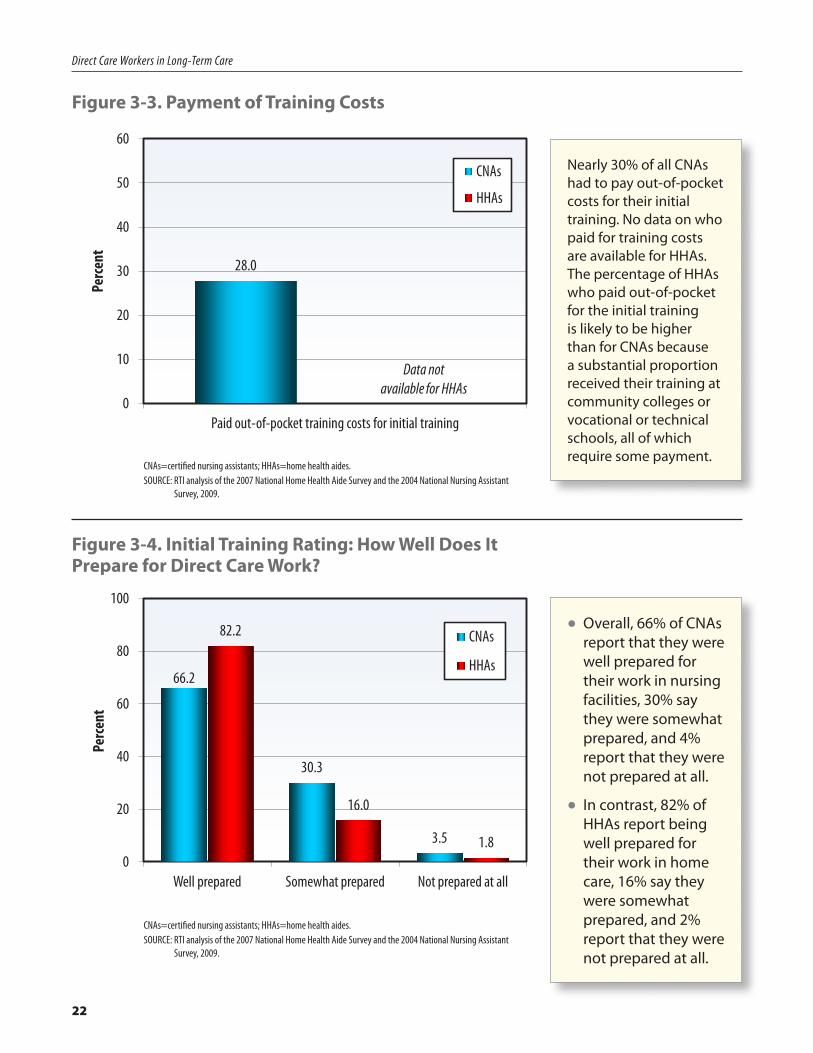
Figure 3-3. Payment of Training Costs
28.0
0
10
20
30
40
50
60
Paid out-of-pocket training costs for initial training
Perc
ent
CNAs
HHAs
Data not available for HHAs
CNAs=certified nursing assistants; HHAs=home health aides.SOURCE: RTI analysis of the 2007 National Home Health Aide Survey and the 2004 National Nursing Assistant
Survey, 2009.
Nearly 30% of all CNAs had to pay out-of-pocket costs for their initial training. No data on who paid for training costs are available for HHAs. The percentage of HHAs who paid out-of-pocket for the initial training is likely to be higher than for CNAs because a substantial proportion received their training at community colleges or vocational or technical schools, all of which require some payment.
Figure 3-4. Initial Training Rating: How Well Does It Prepare for Direct Care Work?
66.2
30.3
3.5
82.2
16.0
1.8 0
20
40
60
80
100
Well prepared Somewhat prepared Not prepared at all
Perc
ent
CNAs
HHAs
CNAs=certified nursing assistants; HHAs=home health aides.SOURCE: RTI analysis of the 2007 National Home Health Aide Survey and the 2004 National Nursing Assistant
Survey, 2009.
•Overall, 66% of CNAs report that they were well prepared for their work in nursing facilities, 30% say they were somewhat prepared, and 4% report that they were not prepared at all.
•In contrast, 82% of HHAs report being well prepared for their work in home care, 16% say they were somewhat prepared, and 2% report that they were not prepared at all.
23
Direct Care Workers in Long-Term Care
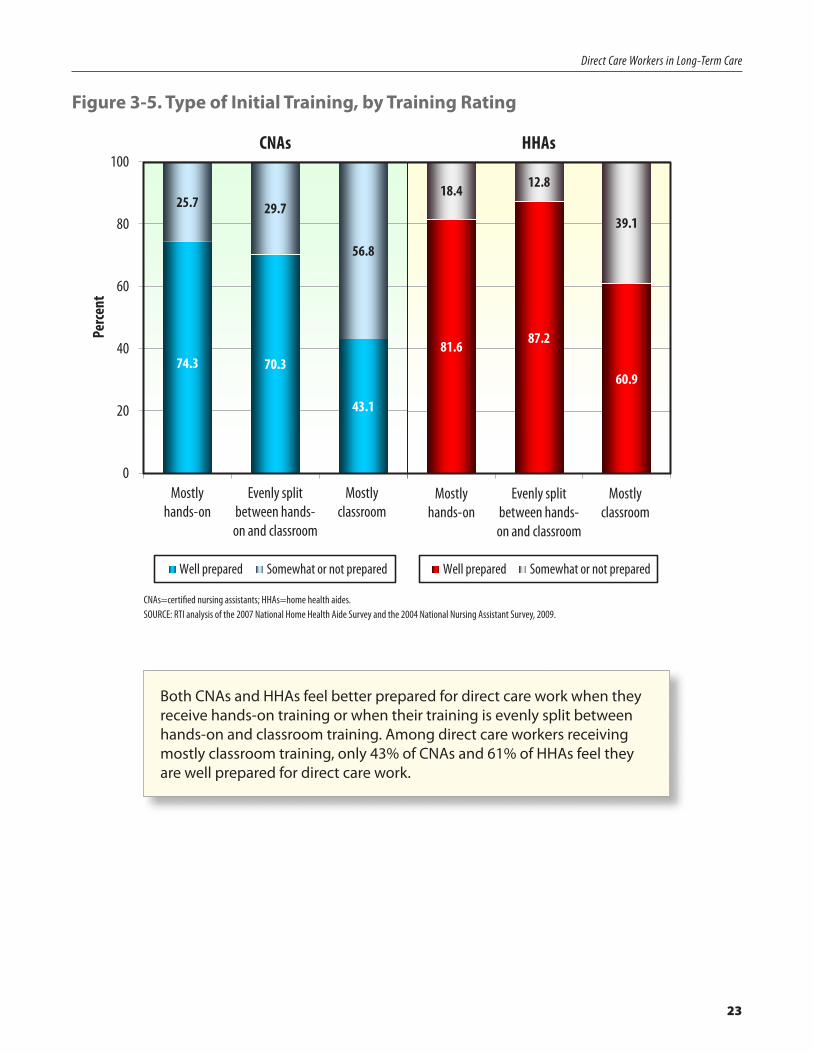
Figure 3-5. Type of Initial Training, by Training Rating
74.3 70.3
43.1
25.7 29.7
56.8
0
20
40
60
80
100
Mostly hands-on
Evenly split between hands-on and classroom
Mostly classroom
Perc
ent
Well prepared Somewhat or not prepared
81.6 87.2
60.9
18.4 12.8
39.1
Mostly hands-on
Evenly split between hands-on and classroom
Mostly classroom
Well prepared Somewhat or not prepared
CNAs HHAs
CNAs=certified nursing assistants; HHAs=home health aides.SOURCE: RTI analysis of the 2007 National Home Health Aide Survey and the 2004 National Nursing Assistant Survey, 2009.
Both CNAs and HHAs feel better prepared for direct care work when they receive hands-on training or when their training is evenly split between hands-on and classroom training. Among direct care workers receiving mostly classroom training, only 43% of CNAs and 61% of HHAs feel they are well prepared for direct care work.
24
Direct Care Workers in Long-Term Care
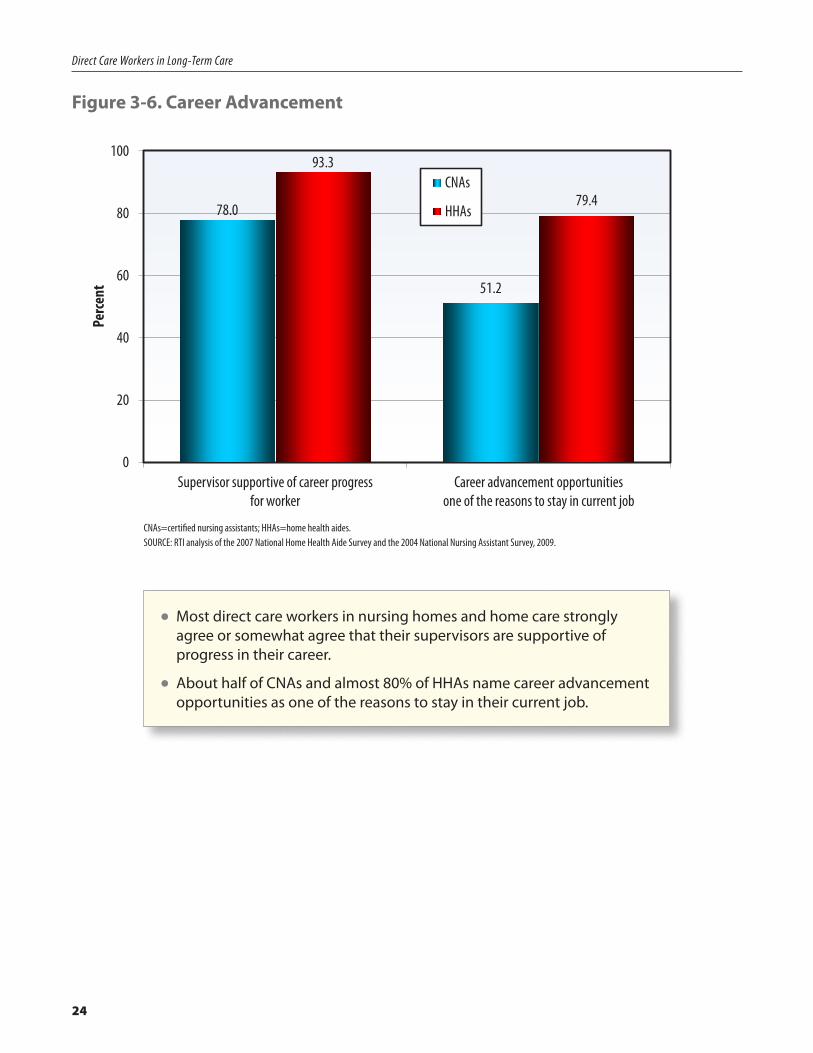
Figure 3-6. Career Advancement
78.0
51.2
93.3
79.4
0
20
40
60
80
100
Supervisor supportive of career progress for worker
Career advancement opportunities one of the reasons to stay in current job
Perc
ent
CNAs
HHAs
CNAs=certified nursing assistants; HHAs=home health aides.SOURCE: RTI analysis of the 2007 National Home Health Aide Survey and the 2004 National Nursing Assistant Survey, 2009.
•Most direct care workers in nursing homes and home care strongly agree or somewhat agree that their supervisors are supportive of progress in their career.
•About half of CNAs and almost 80% of HHAs name career advancement opportunities as one of the reasons to stay in their current job.
25
Chapter 4
A Low-Wage, Low-Fringe Benefits Job
A substantial barrier to recruitment and retention of direct care workers is the low pay and limited fringe benefits that employees receive. While workers are motivated by the desire to help others, they must be concerned with the financial well-being of themselves and their families. Because of the heavy dependence of long-term care providers on Medicare and Medicaid, increasing worker wages and fringe benefits would increase public costs.
• CNAs and HHAs earned between $11 and $12 an hour in 2007 and work between 31 and 37 hours per week. For workers in both nursing homes and home health and hospice agencies, additional years of experience do not translate into substantially higher wages.
• On average, a higher proportion of CNAs than HHAs self-report working in organizations that offer comprehensive fringe benefits. Employers offer health insurance to 91% of CNAs and 75% of HHAs.
• Only about half of CNAs and HHAs participate in their employers’ health insurance plan. Almost 20% of workers are uninsured. Some workers rely on Medicaid or another government program that pays for medical care.
• Among workers who are not participating in health insurance offered by their employers, 39% of CNAs and 28% of HHAs report not being able to afford it because it is too expensive.
• There is no evidence that wages and fringe benefits for immigrant workers are worse than for non-immigrants: immigrant CNAs report slightly higher wages and immigrant HHAs report similar wages to non-immigrants.
26
Direct Care Workers in Long-Term Care
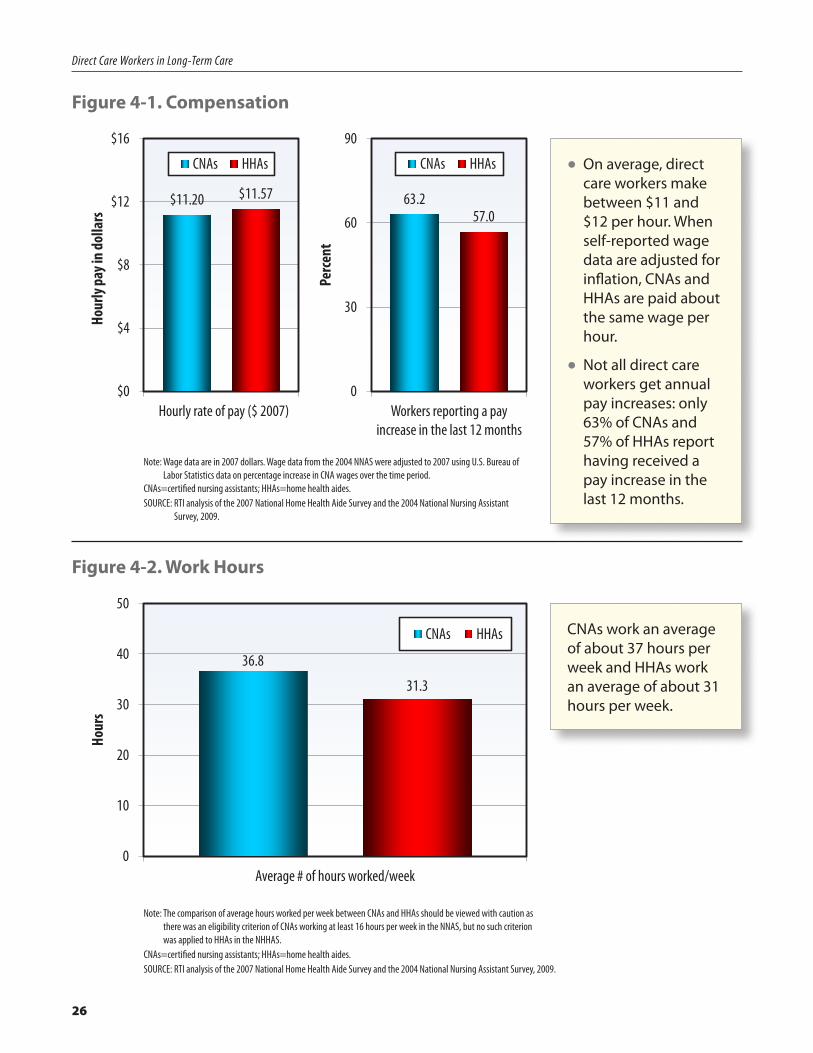
Figure 4-1. Compensation
$11.20 $11.57
$0
$4
$8
$12
$16
Hourly rate of pay ($ 2007)
Hour
ly pa
y in
dolla
rs
CNAs HHAs
63.257.0
0
30
60
90
Workers reporting a pay increase in the last 12 months
Perc
ent
CNAs HHAs
Note: Wage data are in 2007 dollars. Wage data from the 2004 NNAS were adjusted to 2007 using U.S. Bureau of Labor Statistics data on percentage increase in CNA wages over the time period.
CNAs=certified nursing assistants; HHAs=home health aides.SOURCE: RTI analysis of the 2007 National Home Health Aide Survey and the 2004 National Nursing Assistant
Survey, 2009.
•On average, direct care workers make between $11 and $12 per hour. When self-reported wage data are adjusted for inflation, CNAs and HHAs are paid about the same wage per hour.
•Not all direct care workers get annual pay increases: only 63% of CNAs and 57% of HHAs report having received a pay increase in the last 12 months.
Figure 4-2. Work Hours
36.8
31.3
0
10
20
30
40
50
Average # of hours worked/week
Hour
s
CNAs HHAs
Note: The comparison of average hours worked per week between CNAs and HHAs should be viewed with caution as there was an eligibility criterion of CNAs working at least 16 hours per week in the NNAS, but no such criterion was applied to HHAs in the NHHAS.
CNAs=certified nursing assistants; HHAs=home health aides.SOURCE: RTI analysis of the 2007 National Home Health Aide Survey and the 2004 National Nursing Assistant Survey, 2009.
CNAs work an average of about 37 hours per week and HHAs work an average of about 31 hours per week.
27
Direct Care Workers in Long-Term Care
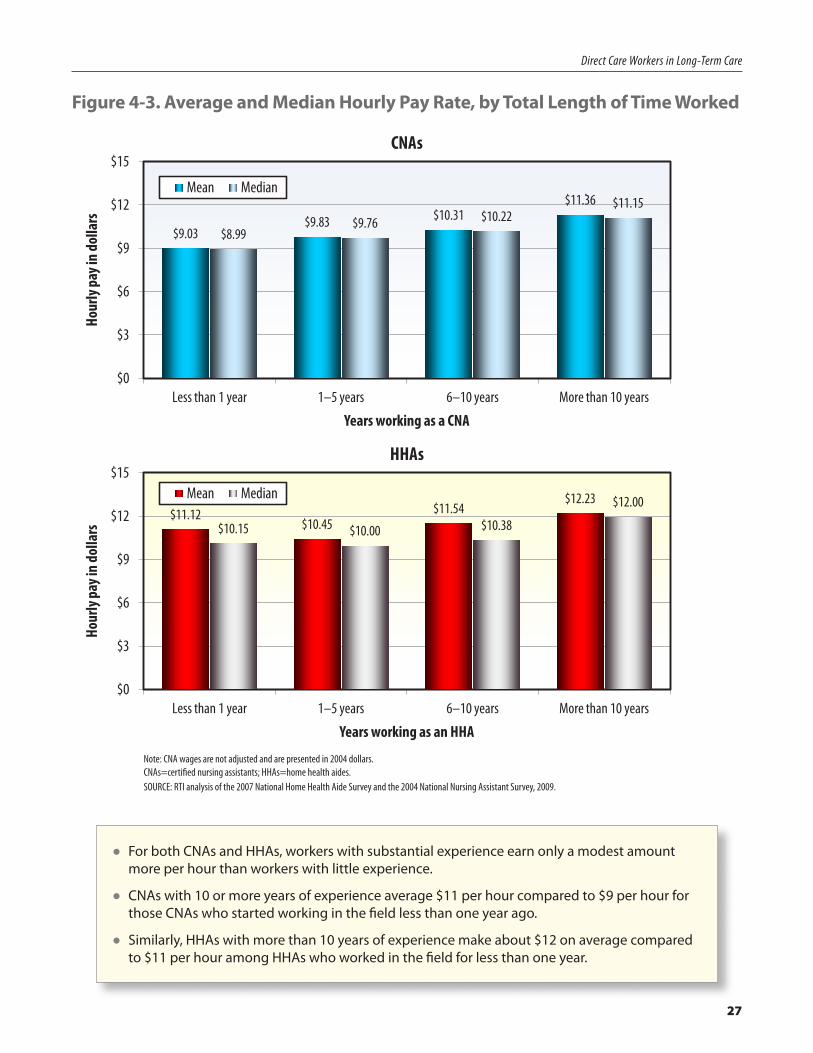
Figure 4-3. Average and Median Hourly Pay Rate, by Total Length of Time Worked
$9.03$9.83 $10.31
$11.36
$8.99$9.76 $10.22
$11.15
$0
$3
$6
$9
$12
$15
Less than 1 year 1–5 years 6–10 years More than 10 years
Hour
ly pa
y in
dolla
rs
Years working as a CNA
Mean Median
CNAs
HHAs
$11.12$10.45
$11.54$12.23
$10.15 $10.00 $10.38
$12.00
$0
$3
$6
$9
$12
$15
Less than 1 year 1–5 years 6–10 years More than 10 years
Hour
ly pa
y in
dolla
rs
Years working as an HHA
Mean Median
Note: CNA wages are not adjusted and are presented in 2004 dollars.CNAs=certified nursing assistants; HHAs=home health aides.SOURCE: RTI analysis of the 2007 National Home Health Aide Survey and the 2004 National Nursing Assistant Survey, 2009.
•For both CNAs and HHAs, workers with substantial experience earn only a modest amount more per hour than workers with little experience.
•CNAs with 10 or more years of experience average $11 per hour compared to $9 per hour for those CNAs who started working in the field less than one year ago.
•Similarly, HHAs with more than 10 years of experience make about $12 on average compared to $11 per hour among HHAs who worked in the field for less than one year.
28
Direct Care Workers in Long-Term Care
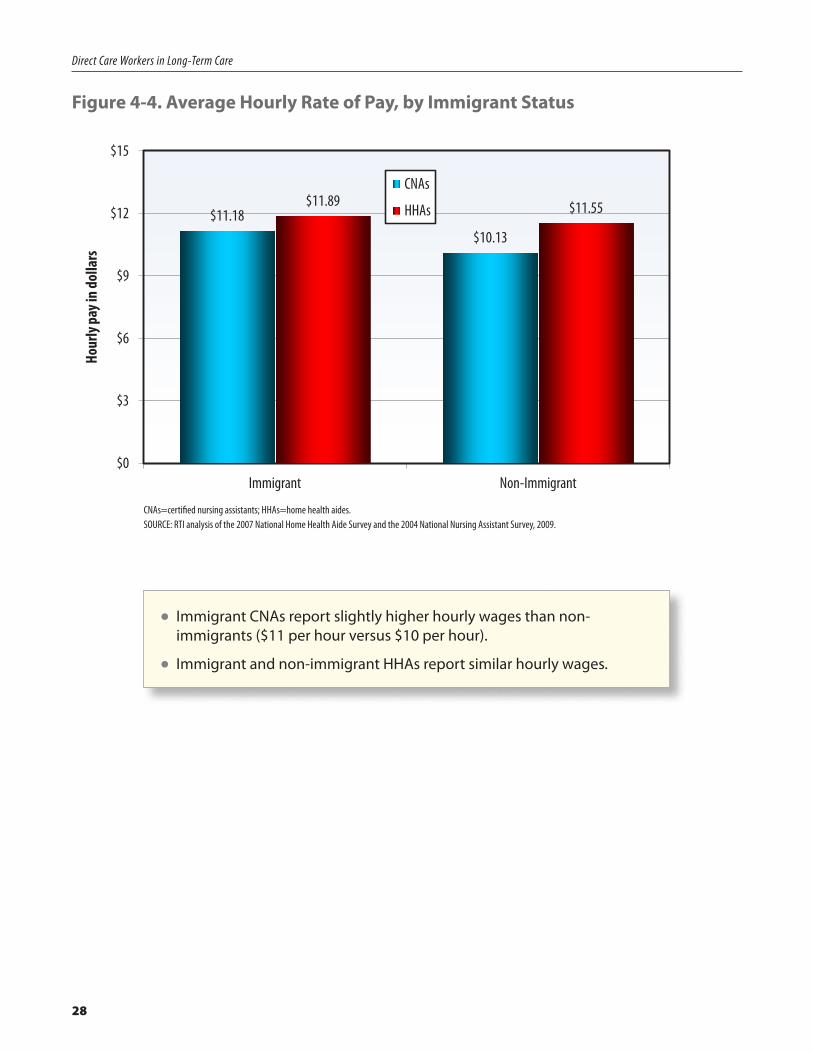
Figure 4-4. Average Hourly Rate of Pay, by Immigrant Status
$11.18$10.13
$11.89 $11.55
$0
$3
$6
$9
$12
$15
Immigrant Non-Immigrant
Hour
ly pa
y in
dolla
rs
CNAs
HHAs
CNAs=certified nursing assistants; HHAs=home health aides.SOURCE: RTI analysis of the 2007 National Home Health Aide Survey and the 2004 National Nursing Assistant Survey, 2009.
•Immigrant CNAs report slightly higher hourly wages than non-immigrants ($11 per hour versus $10 per hour).
•Immigrant and non-immigrant HHAs report similar hourly wages.
29
Direct Care Workers in Long-Term Care
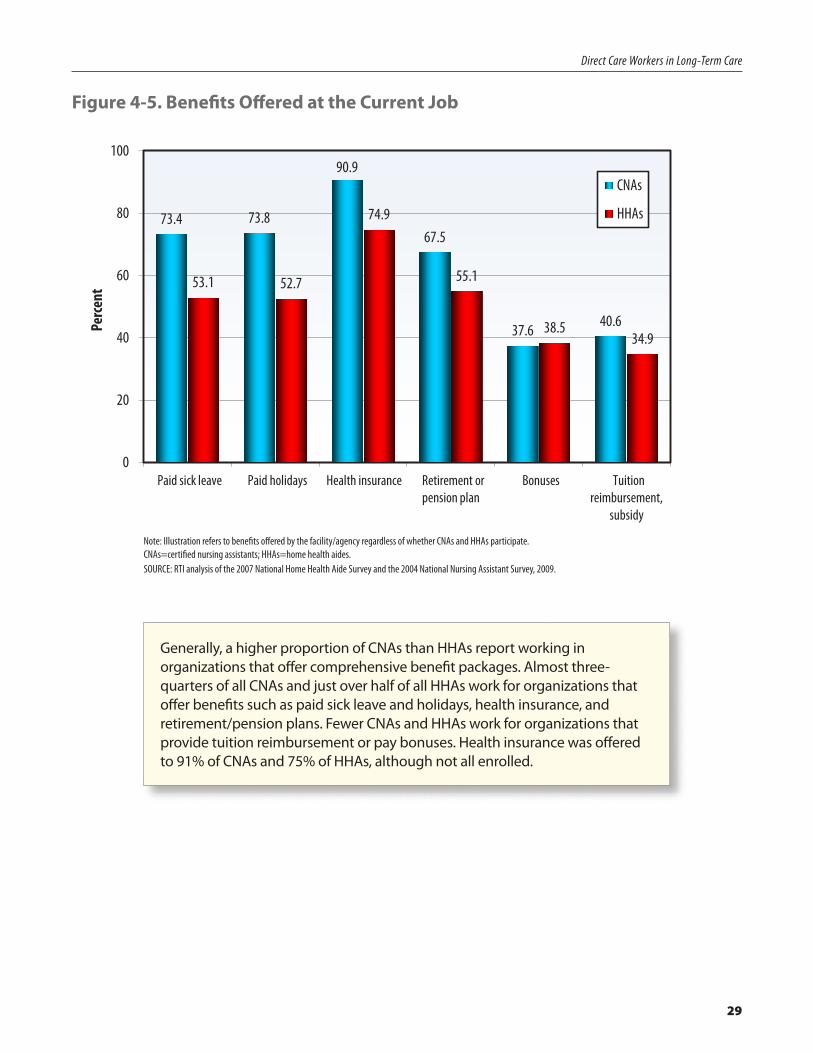
Figure 4-5. Benefits Offered at the Current Job
73.4 73.8
90.9
67.5
37.6 40.6
53.1 52.7
74.9
55.1
38.5 34.9
0
20
40
60
80
100
Paid sick leave Paid holidays Health insurance Retirement or pension plan
Bonuses Tuition reimbursement,
subsidy
Perc
ent
CNAs
HHAs
Note: Illustration refers to benefits offered by the facility/agency regardless of whether CNAs and HHAs participate.CNAs=certified nursing assistants; HHAs=home health aides.SOURCE: RTI analysis of the 2007 National Home Health Aide Survey and the 2004 National Nursing Assistant Survey, 2009.
Generally, a higher proportion of CNAs than HHAs report working in organizations that offer comprehensive benefit packages. Almost three-quarters of all CNAs and just over half of all HHAs work for organizations that offer benefits such as paid sick leave and holidays, health insurance, and retirement/pension plans. Fewer CNAs and HHAs work for organizations that provide tuition reimbursement or pay bonuses. Health insurance was offered to 91% of CNAs and 75% of HHAs, although not all enrolled.
30
Direct Care Workers in Long-Term Care
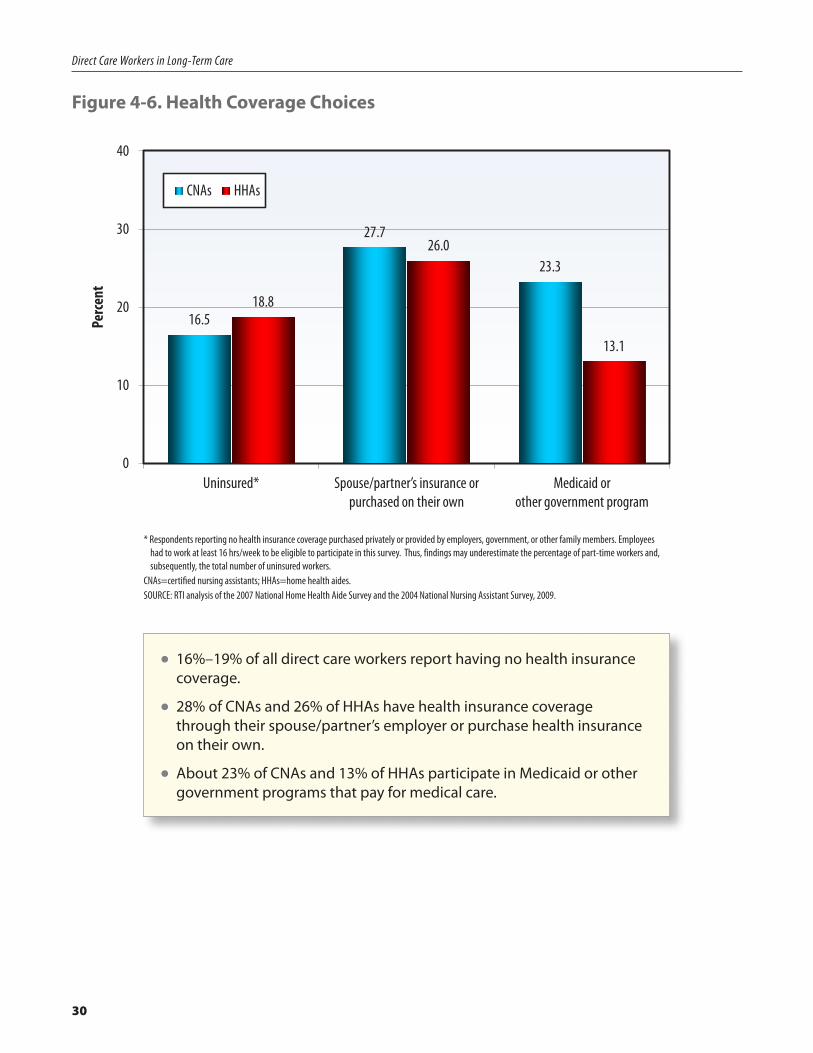
Figure 4-6. Health Coverage Choices
16.5
27.7
23.3
18.8
26.0
13.1
0
10
20
30
40
Uninsured* Spouse/partner’s insurance or purchased on their own
Medicaid or other government program
Perc
ent
CNAs HHAs
* Respondents reporting no health insurance coverage purchased privately or provided by employers, government, or other family members. Employees had to work at least 16 hrs/week to be eligible to participate in this survey. Thus, findings may underestimate the percentage of part-time workers and, subsequently, the total number of uninsured workers.
CNAs=certified nursing assistants; HHAs=home health aides.SOURCE: RTI analysis of the 2007 National Home Health Aide Survey and the 2004 National Nursing Assistant Survey, 2009.
•16%–19% of all direct care workers report having no health insurance coverage.
•28% of CNAs and 26% of HHAs have health insurance coverage through their spouse/partner’s employer or purchase health insurance on their own.
•About 23% of CNAs and 13% of HHAs participate in Medicaid or other government programs that pay for medical care.
31
Direct Care Workers in Long-Term Care
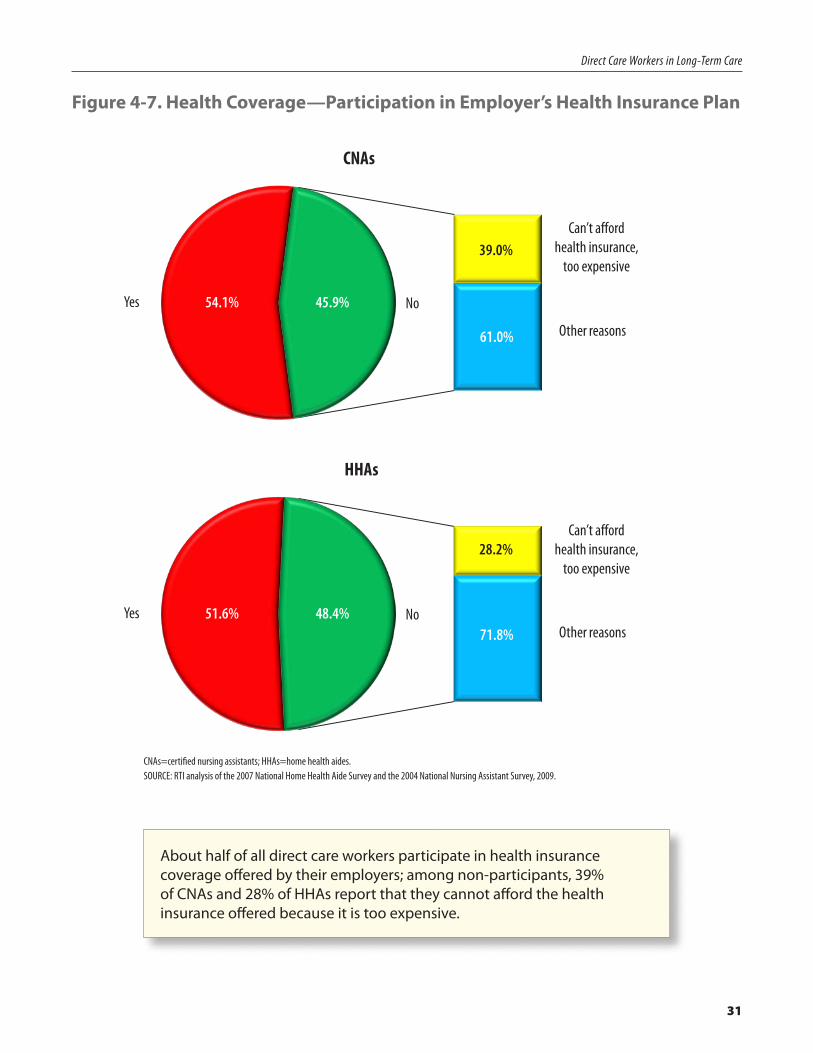
Figure 4-7. Health Coverage—Participation in Employer’s Health Insurance Plan
Yes
Other reasons
No
CNAs
54.1% 45.9%
Can’t afford health insurance,
too expensive39.0%
61.0%
HHAs
YesOther reasons
No51.6% 48.4%
Can’t afford health insurance,
too expensive28.2%
71.8%
CNAs=certified nursing assistants; HHAs=home health aides.SOURCE: RTI analysis of the 2007 National Home Health Aide Survey and the 2004 National Nursing Assistant Survey, 2009.
About half of all direct care workers participate in health insurance coverage offered by their employers; among non-participants, 39% of CNAs and 28% of HHAs report that they cannot afford the health insurance offered because it is too expensive.
32
Direct Care Workers in Long-Term Care
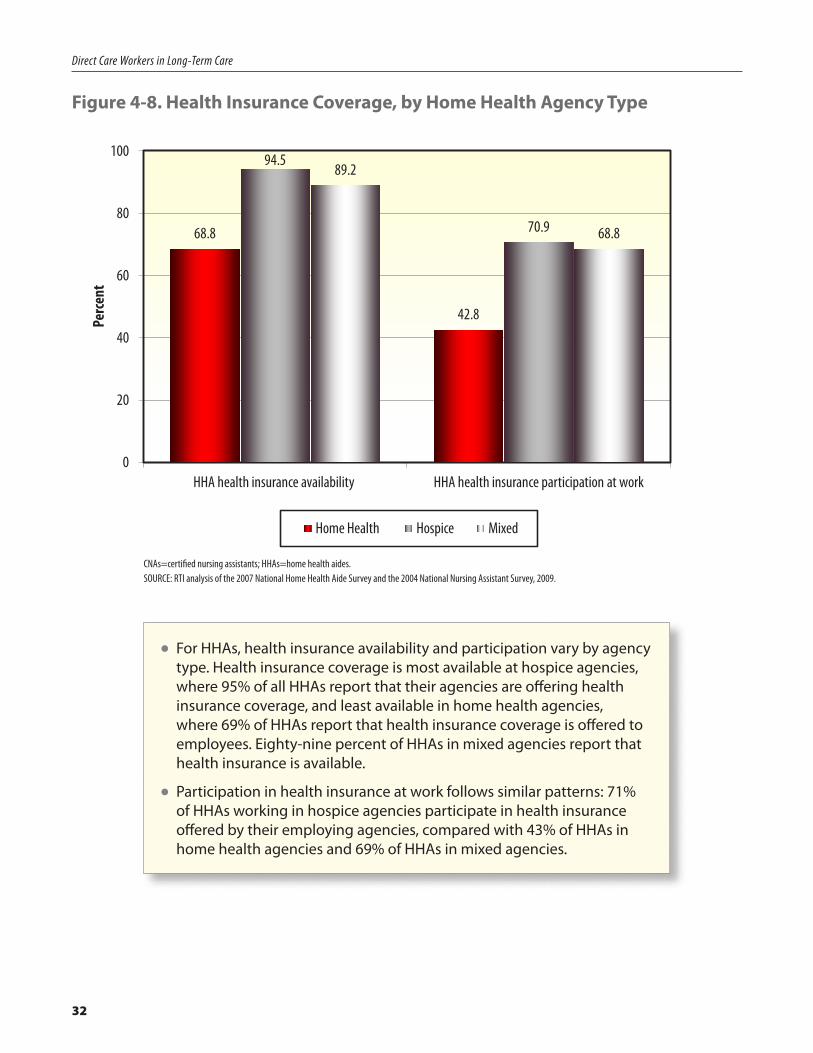
Figure 4-8. Health Insurance Coverage, by Home Health Agency Type
68.8
42.8
94.5
70.9
89.2
68.8
0
20
40
60
80
100
HHA health insurance availability HHA health insurance participation at work
Perc
ent
Home Health Hospice Mixed
CNAs=certified nursing assistants; HHAs=home health aides.SOURCE: RTI analysis of the 2007 National Home Health Aide Survey and the 2004 National Nursing Assistant Survey, 2009.
•For HHAs, health insurance availability and participation vary by agency type. Health insurance coverage is most available at hospice agencies, where 95% of all HHAs report that their agencies are offering health insurance coverage, and least available in home health agencies, where 69% of HHAs report that health insurance coverage is offered to employees. Eighty-nine percent of HHAs in mixed agencies report that health insurance is available.
•Participation in health insurance at work follows similar patterns: 71% of HHAs working in hospice agencies participate in health insurance offered by their employing agencies, compared with 43% of HHAs in home health agencies and 69% of HHAs in mixed agencies.
33
Direct Care Workers in Long-Term Care
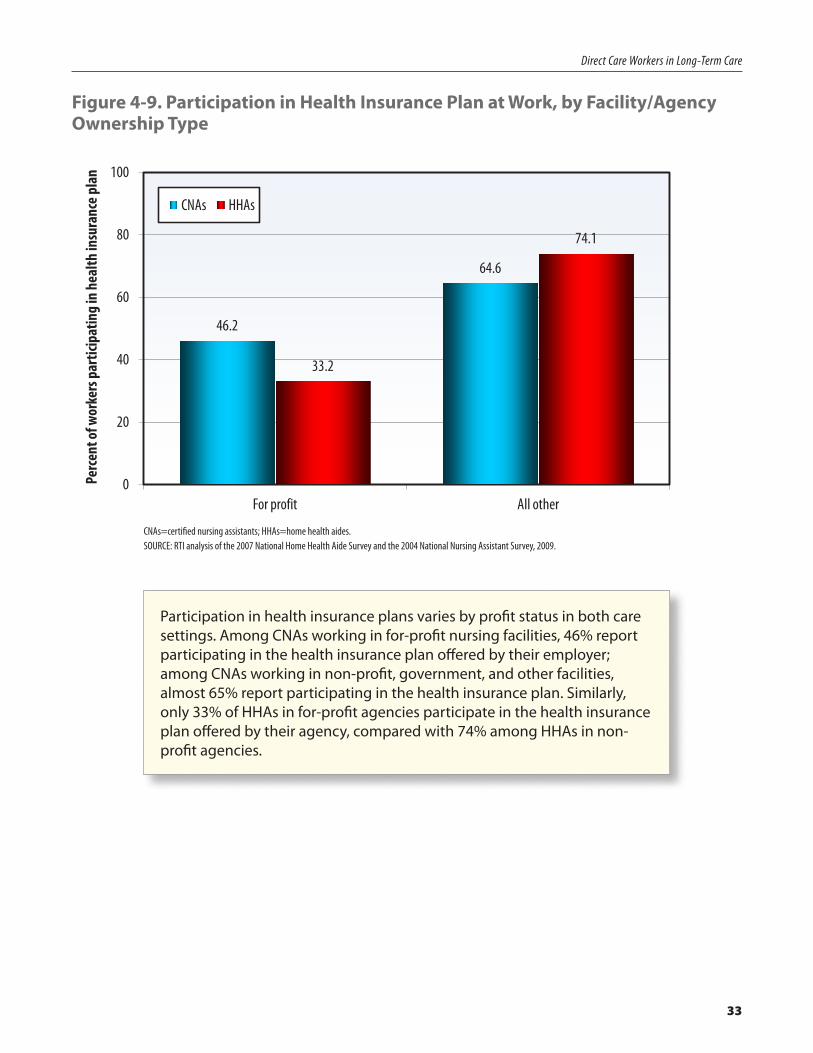
Figure 4-9. Participation in Health Insurance Plan at Work, by Facility/Agency Ownership Type
46.2
64.6
33.2
74.1
0
20
40
60
80
100
For profit All other
Perc
ent o
f wor
kers
par
ticip
atin
g in
hea
lth in
sura
nce p
lan
CNAs HHAs
CNAs=certified nursing assistants; HHAs=home health aides.SOURCE: RTI analysis of the 2007 National Home Health Aide Survey and the 2004 National Nursing Assistant Survey, 2009.
Participation in health insurance plans varies by profit status in both care settings. Among CNAs working in for-profit nursing facilities, 46% report participating in the health insurance plan offered by their employer; among CNAs working in non-profit, government, and other facilities, almost 65% report participating in the health insurance plan. Similarly, only 33% of HHAs in for-profit agencies participate in the health insurance plan offered by their agency, compared with 74% among HHAs in non-profit agencies.
34
Chapter 5
A Difficult Job
Being a CNA or an HHA is a tough job, which adds to the difficulties of recruitment and retention. Residents, patients, and consumers often have life-threatening illnesses and high levels of mortality and cognitive impairment. Nursing facilities and home health agencies are often understaffed and work-related injuries are common. For HHAs, transportation from one client to another is often difficult.
• Struggling to find time for completing work tasks is more prevalent in nursing homes than in home health agencies. A much higher proportion of HHAs than CNAs report having sufficient time for providing personal care to their clients and for performing other duties. Permanent assignment of staff to care recipients is also less common in nursing homes than in home care.
•Workers report that several problems make their direct care work difficult or less satisfying. Most commonly reported are problems with co-workers and supervisors, workload issues, and complaints about pay and benefits.
•Work-related injuries are common among direct care workers and are reported more often in nursing homes than in home health care. Twice as many CNAs as HHAs report missing days at work due to injury. However, assistive technology used to prevent injuries appears to be more available to CNAs than to HHAs. Some of the occupational hazards encountered by direct care workers include abuse and assault from care recipients, back injuries, and needle sticks.
• Access to transportation for getting to work is important for all workers, but it is essential for HHAs, who depend on reliable transportation to reach their geographically dispersed care recipients. Virtually all HHAs drive themselves to work, but not all of their work-related travel time is paid for by employers.
35
Direct Care Workers in Long-Term Care
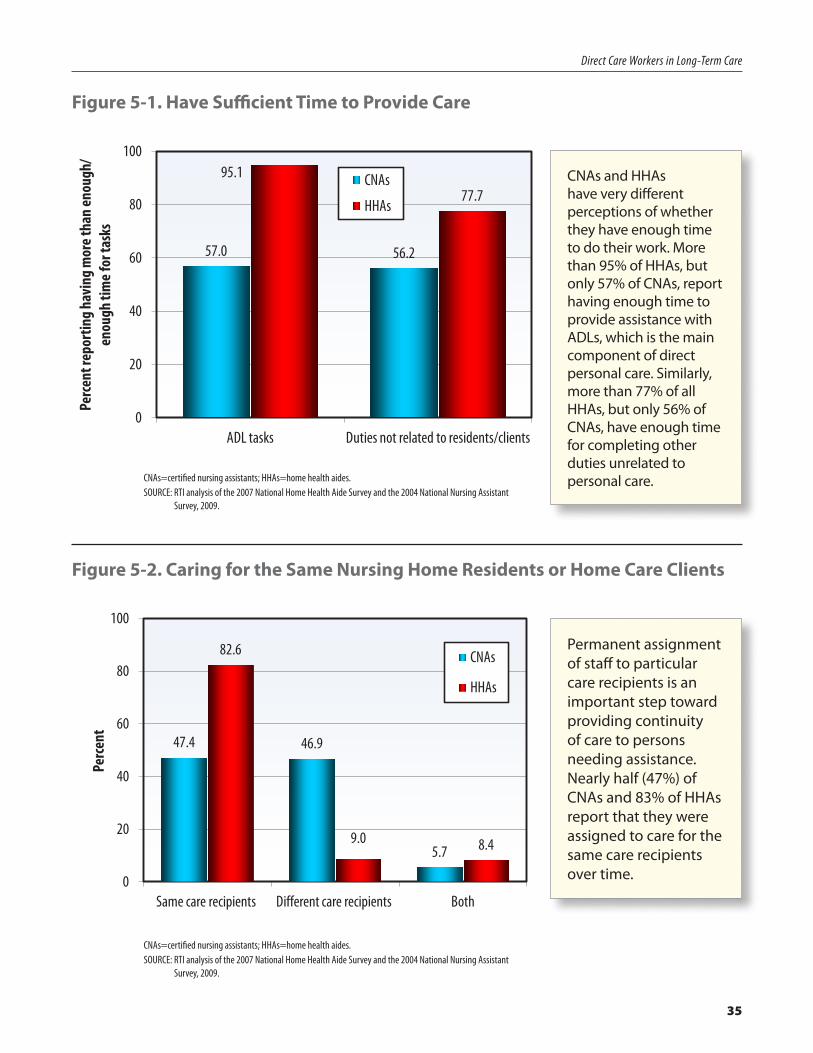
Figure 5-1. Have Sufficient Time to Provide Care
57.0 56.2
95.1 77.7
0
20
40
60
80
100
ADL tasks Duties not related to residents/clients
Perc
ent r
epor
ting h
avin
g mor
e tha
n en
ough
/en
ough
tim
e for
task
s
CNAs
HHAs
CNAs=certified nursing assistants; HHAs=home health aides.SOURCE: RTI analysis of the 2007 National Home Health Aide Survey and the 2004 National Nursing Assistant
Survey, 2009.
CNAs and HHAs have very different perceptions of whether they have enough time to do their work. More than 95% of HHAs, but only 57% of CNAs, report having enough time to provide assistance with ADLs, which is the main component of direct personal care. Similarly, more than 77% of all HHAs, but only 56% of CNAs, have enough time for completing other duties unrelated to personal care.
Figure 5-2. Caring for the Same Nursing Home Residents or Home Care Clients
47.4 46.9
5.7
82.6
9.0 8.4
0
20
40
60
80
100
Same care recipients Different care recipients Both
Perc
ent
CNAs
HHAs
CNAs=certified nursing assistants; HHAs=home health aides.SOURCE: RTI analysis of the 2007 National Home Health Aide Survey and the 2004 National Nursing Assistant
Survey, 2009.
Permanent assignment of staff to particular care recipients is an important step toward providing continuity of care to persons needing assistance. Nearly half (47%) of CNAs and 83% of HHAs report that they were assigned to care for the same care recipients over time.
36
Direct Care Workers in Long-Term Care
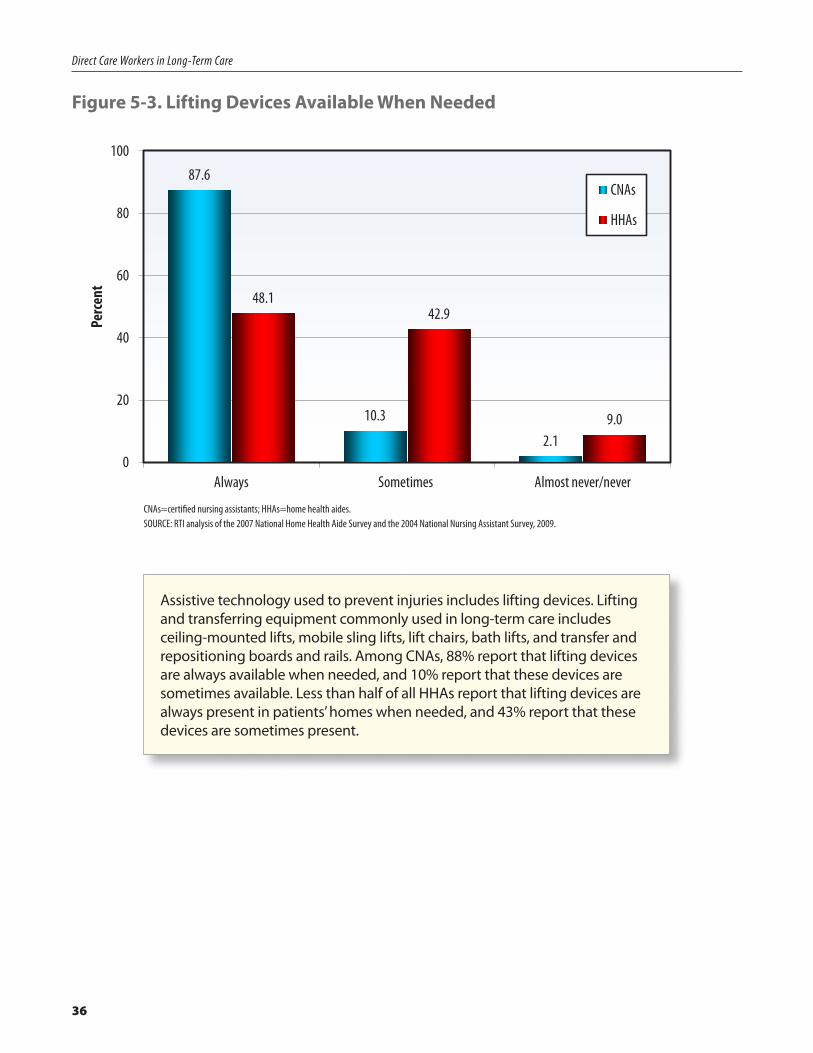
Figure 5-3. Lifting Devices Available When Needed
87.6
10.3
2.1
48.142.9
9.0
0
20
40
60
80
100
Always Sometimes Almost never/never
Perc
ent
CNAs
HHAs
CNAs=certified nursing assistants; HHAs=home health aides.SOURCE: RTI analysis of the 2007 National Home Health Aide Survey and the 2004 National Nursing Assistant Survey, 2009.
Assistive technology used to prevent injuries includes lifting devices. Lifting and transferring equipment commonly used in long-term care includes ceiling-mounted lifts, mobile sling lifts, lift chairs, bath lifts, and transfer and repositioning boards and rails. Among CNAs, 88% report that lifting devices are always available when needed, and 10% report that these devices are sometimes available. Less than half of all HHAs report that lifting devices are always present in patients’ homes when needed, and 43% report that these devices are sometimes present.
37
Direct Care Workers in Long-Term Care
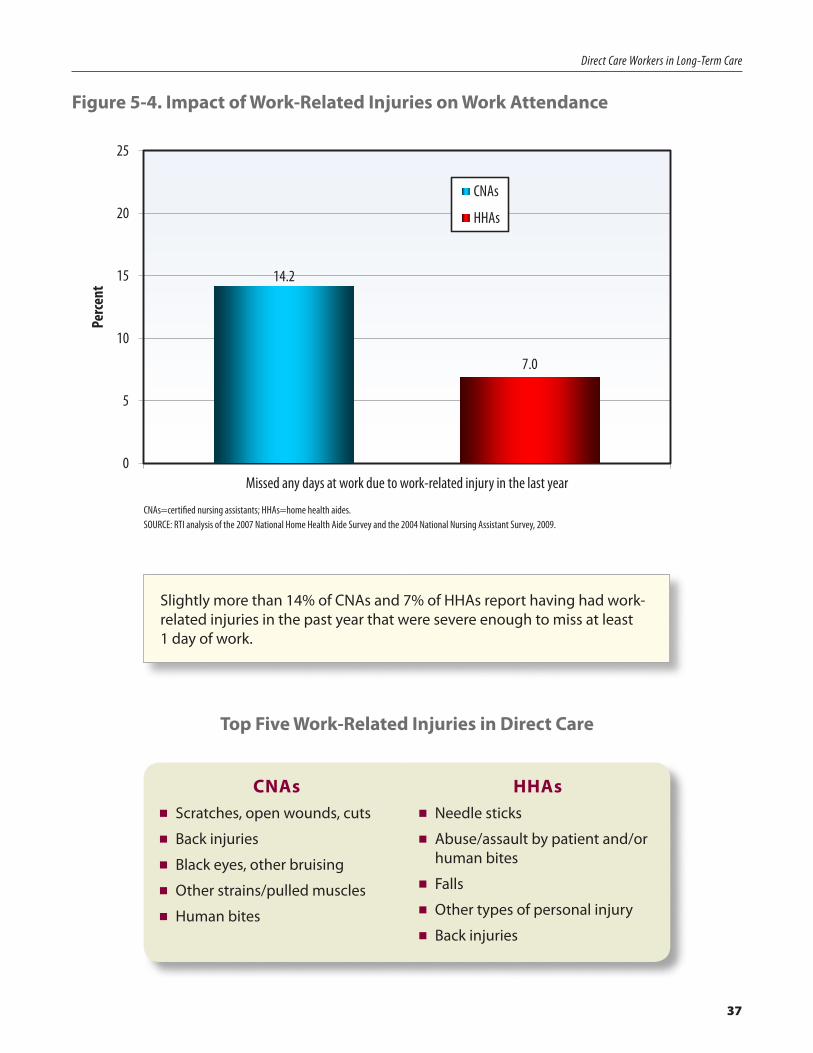
Figure 5-4. Impact of Work-Related Injuries on Work Attendance
14.2
7.0
0
5
10
15
20
25
Missed any days at work due to work-related injury in the last year
Perc
ent
CNAs
HHAs
CNAs=certified nursing assistants; HHAs=home health aides.SOURCE: RTI analysis of the 2007 National Home Health Aide Survey and the 2004 National Nursing Assistant Survey, 2009.
Slightly more than 14% of CNAs and 7% of HHAs report having had work-related injuries in the past year that were severe enough to miss at least 1 day of work.
Top Five Work-Related Injuries in Direct Care
CNAs■ Scratches, open wounds, cuts
■ Back injuries
■ Black eyes, other bruising
■ Other strains/pulled muscles
■ Human bites
HHAs■ Needle sticks
■ Abuse/assault by patient and/or human bites
■ Falls
■ Other types of personal injury
■ Back injuries
38
Direct Care Workers in Long-Term Care
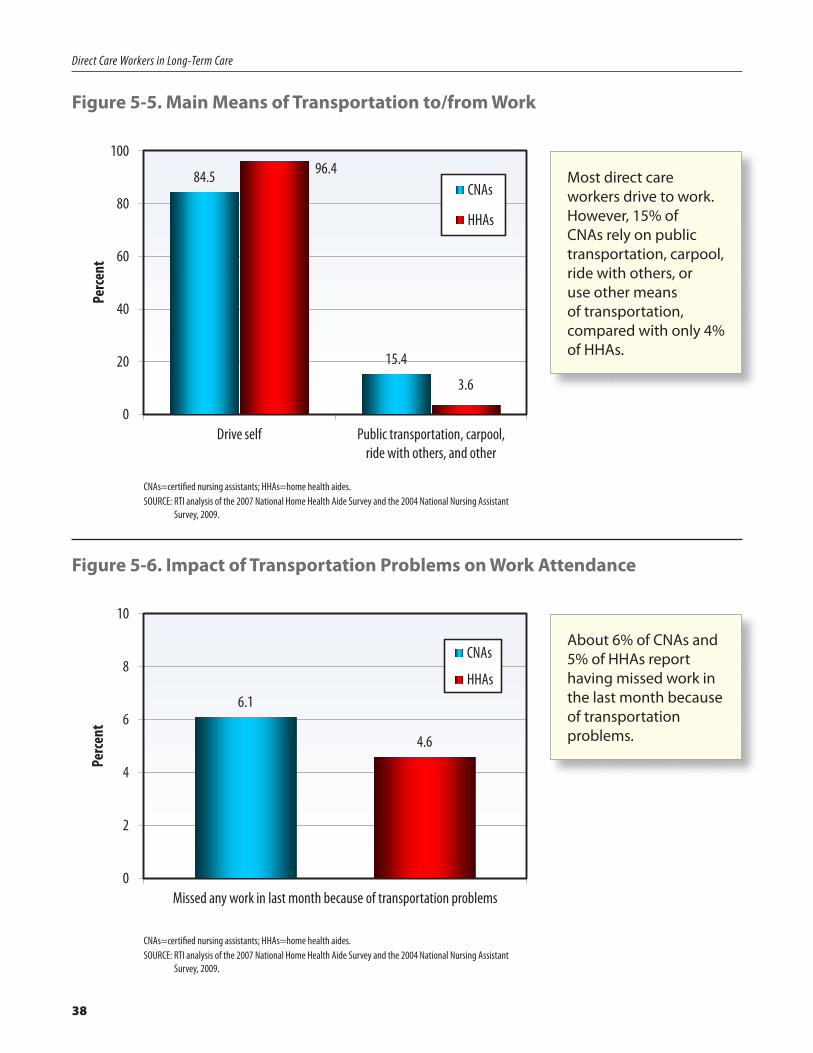
Figure 5-5. Main Means of Transportation to/from Work
84.5
15.4
96.4
3.6
0
20
40
60
80
100
Drive self Public transportation, carpool, ride with others, and other
Perc
ent
CNAs
HHAs
CNAs=certified nursing assistants; HHAs=home health aides.SOURCE: RTI analysis of the 2007 National Home Health Aide Survey and the 2004 National Nursing Assistant
Survey, 2009.
Most direct care workers drive to work. However, 15% of CNAs rely on public transportation, carpool, ride with others, or use other means of transportation, compared with only 4% of HHAs.
Figure 5-6. Impact of Transportation Problems on Work Attendance
6.1
4.6
0
2
4
6
8
10
Missed any work in last month because of transportation problems
Perc
ent
CNAs
HHAs
CNAs=certified nursing assistants; HHAs=home health aides.SOURCE: RTI analysis of the 2007 National Home Health Aide Survey and the 2004 National Nursing Assistant
Survey, 2009.
About 6% of CNAs and 5% of HHAs report having missed work in the last month because of transportation problems.
39
Direct Care Workers in Long-Term Care
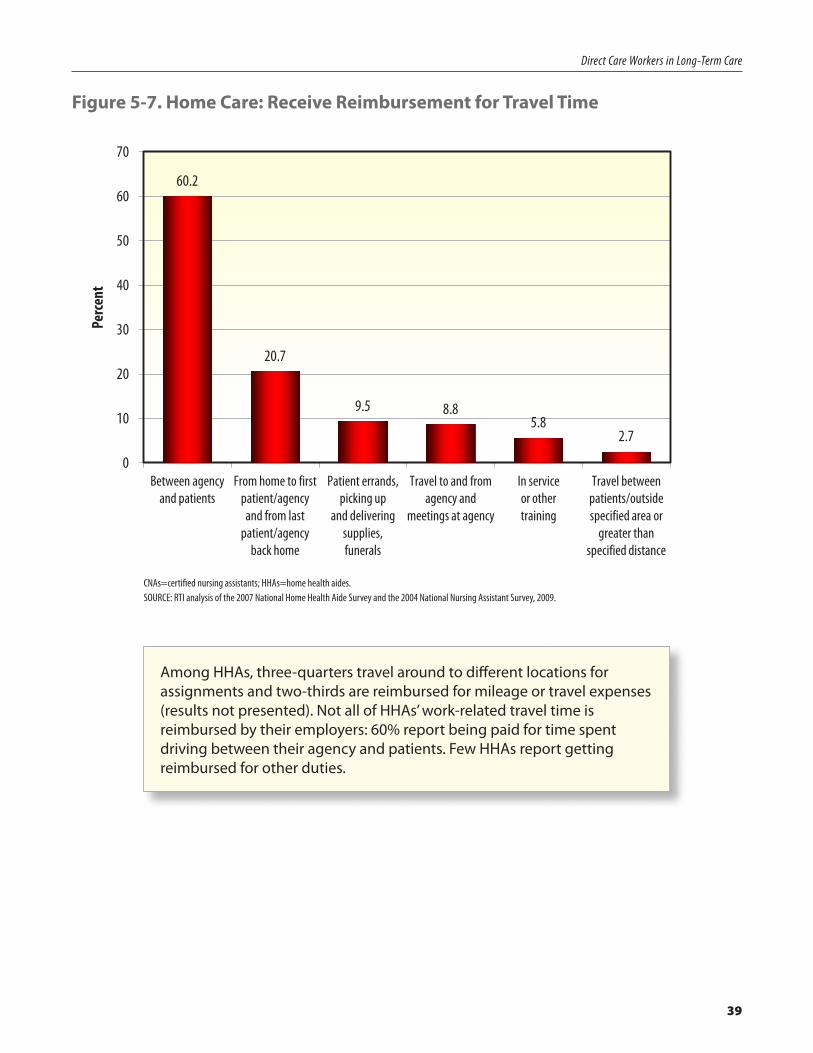
Figure 5-7. Home Care: Receive Reimbursement for Travel Time
60.2
20.7
9.5 8.8 5.8
2.7
0
10
20
30
40
50
60
70
Between agency and patients
From home to first patient/agency
and from last patient/agency
back home
Patient errands, picking up
and delivering supplies, funerals
Travel to and from agency and
meetings at agency
In service or other training
Travel between patients/outside specified area or
greater than specified distance
Perc
ent
CNAs=certified nursing assistants; HHAs=home health aides.SOURCE: RTI analysis of the 2007 National Home Health Aide Survey and the 2004 National Nursing Assistant Survey, 2009.
Among HHAs, three-quarters travel around to different locations for assignments and two-thirds are reimbursed for mileage or travel expenses (results not presented). Not all of HHAs’ work-related travel time is reimbursed by their employers: 60% report being paid for time spent driving between their agency and patients. Few HHAs report getting reimbursed for other duties.
40
Direct Care Workers in Long-Term Care
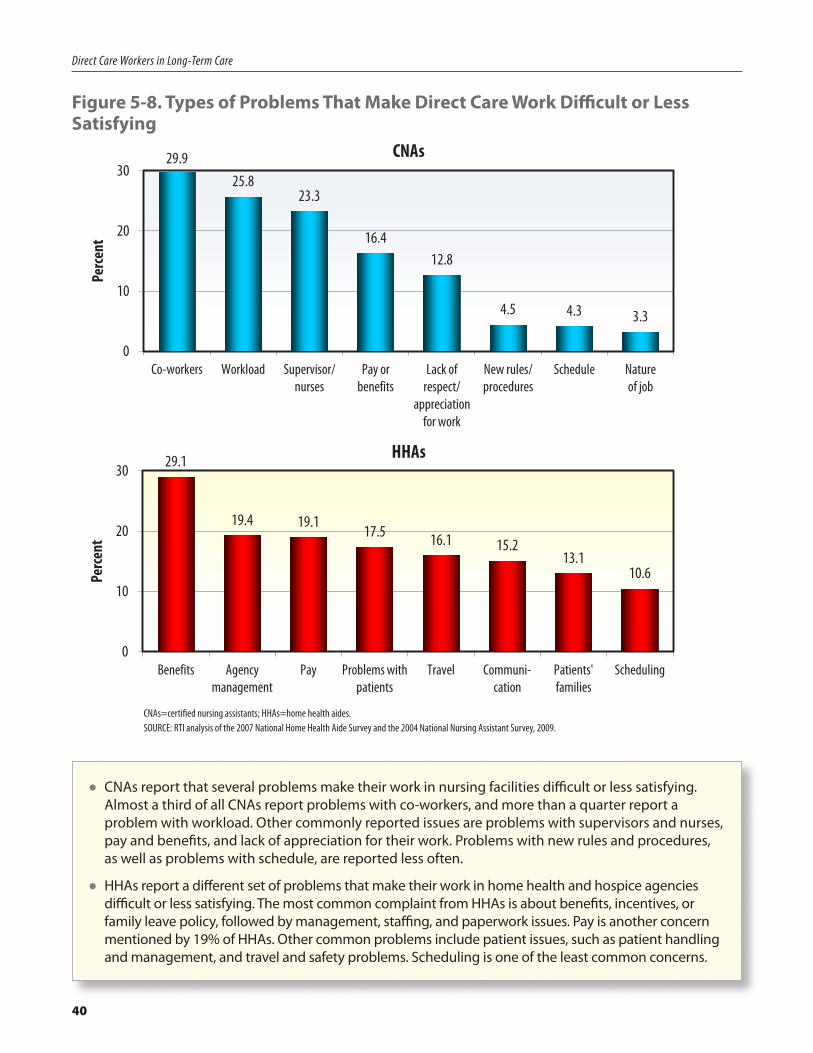
Figure 5-8. Types of Problems That Make Direct Care Work Difficult or Less Satisfying
29.925.8
23.3
16.412.8
4.5 4.3 3.3
0
10
20
30
Co-workers Workload Supervisor/ nurses
Pay or benefits
Lack of respect/
appreciation for work
New rules/ procedures
Schedule Nature of job
Perc
ent
CNAs
HHAs29.1
19.4 19.1 17.5 16.1 15.2
13.1 10.6
0
10
20
30
Benefits Agency management
Pay Problems with patients
Travel Communi-cation
Patients' families
Scheduling
Perc
ent
CNAs=certified nursing assistants; HHAs=home health aides.SOURCE: RTI analysis of the 2007 National Home Health Aide Survey and the 2004 National Nursing Assistant Survey, 2009.
•CNAs report that several problems make their work in nursing facilities difficult or less satisfying. Almost a third of all CNAs report problems with co-workers, and more than a quarter report a problem with workload. Other commonly reported issues are problems with supervisors and nurses, pay and benefits, and lack of appreciation for their work. Problems with new rules and procedures, as well as problems with schedule, are reported less often.
•HHAs report a different set of problems that make their work in home health and hospice agencies difficult or less satisfying. The most common complaint from HHAs is about benefits, incentives, or family leave policy, followed by management, staffing, and paperwork issues. Pay is another concern mentioned by 19% of HHAs. Other common problems include patient issues, such as patient handling and management, and travel and safety problems. Scheduling is one of the least common concerns.
41
Chapter 6
Turnover Is a Serious Problem
Turnover among CNAs and HHAs is high. For example, according to one study, in 2007, annual turnover among CNAs in nursing facilities was 66 percent, and in some states exceeded 100 percent (American Health Care Association, 2008). High turnover means that direct care workers do not get to know the needs and preferences of individual residents or consumers, possibly reducing quality of care.
• CNAs and HHAs have significant job turnover, with almost half of workers employed at more than one job in a 2-year period. HHAs report longer job tenure than CNAs.
• Among CNAs who report turnover in their facilities, two-thirds think that turnover interferes with their ability to do their job.
• Turnover appears to decrease with workers’ age. CNAs and HHAs aged 45 and older are less likely to report that they are looking for another job.
•Workers who feel they do not have enough time to provide ADL care are more likely to report a higher likelihood of leaving their jobs.
• Although direct care workers report relatively high satisfaction with their work, 1 in 4 CNAs and 1 in 5 HHAs reported looking for another job at the time of the surveys. Moreover, between about a third and almost half of direct care workers say that they are very likely or somewhat likely to leave their current job in the next year. Poor pay and having found a better job are the most commonly reported reasons for leaving.
42
Direct Care Workers in Long-Term Care
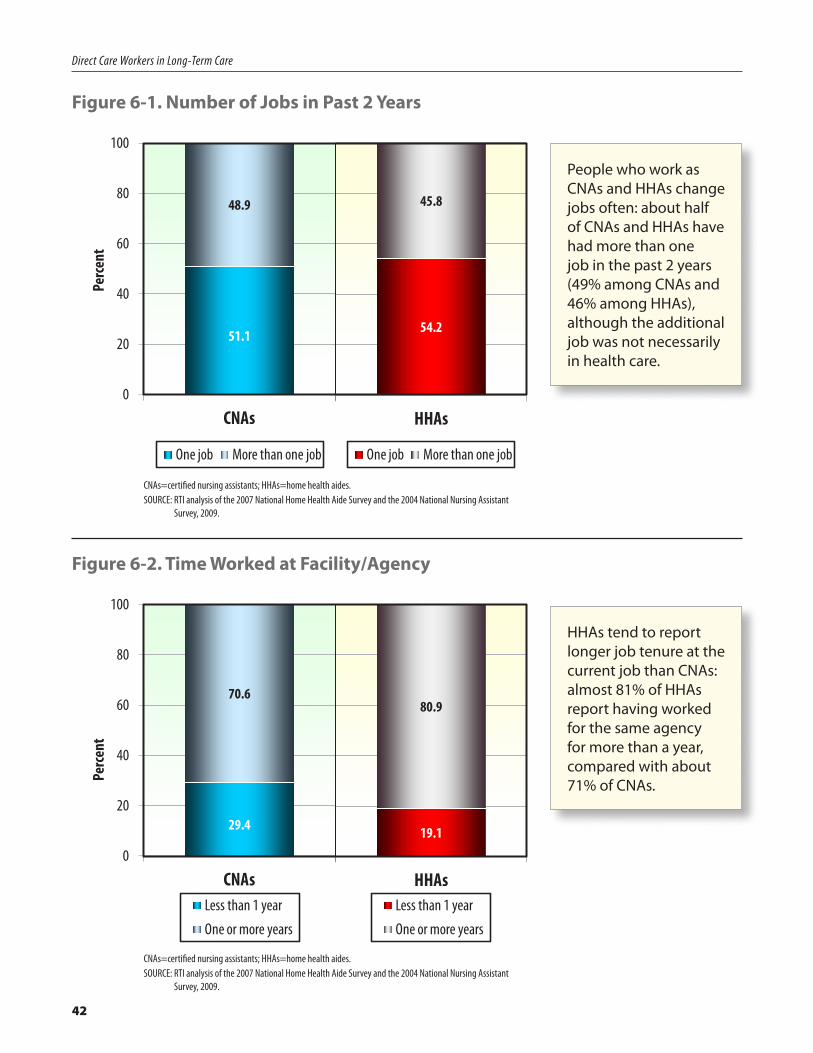
Figure 6-1. Number of Jobs in Past 2 Years
51.1
48.9
0
20
40
60
80
100
CNAs
Perc
ent
One job More than one job
54.2
45.8
HHAs
One job More than one job
CNAs=certified nursing assistants; HHAs=home health aides.SOURCE: RTI analysis of the 2007 National Home Health Aide Survey and the 2004 National Nursing Assistant
Survey, 2009.
People who work as CNAs and HHAs change jobs often: about half of CNAs and HHAs have had more than one job in the past 2 years (49% among CNAs and 46% among HHAs), although the additional job was not necessarily in health care.
Figure 6-2. Time Worked at Facility/Agency
29.4
70.6
0
20
40
60
80
100
CNAs
Perc
ent
Less than 1 year
One or more years
19.1
80.9
HHAsLess than 1 year
One or more years
CNAs=certified nursing assistants; HHAs=home health aides.SOURCE: RTI analysis of the 2007 National Home Health Aide Survey and the 2004 National Nursing Assistant
Survey, 2009.
HHAs tend to report longer job tenure at the current job than CNAs: almost 81% of HHAs report having worked for the same agency for more than a year, compared with about 71% of CNAs.
43
Direct Care Workers in Long-Term Care
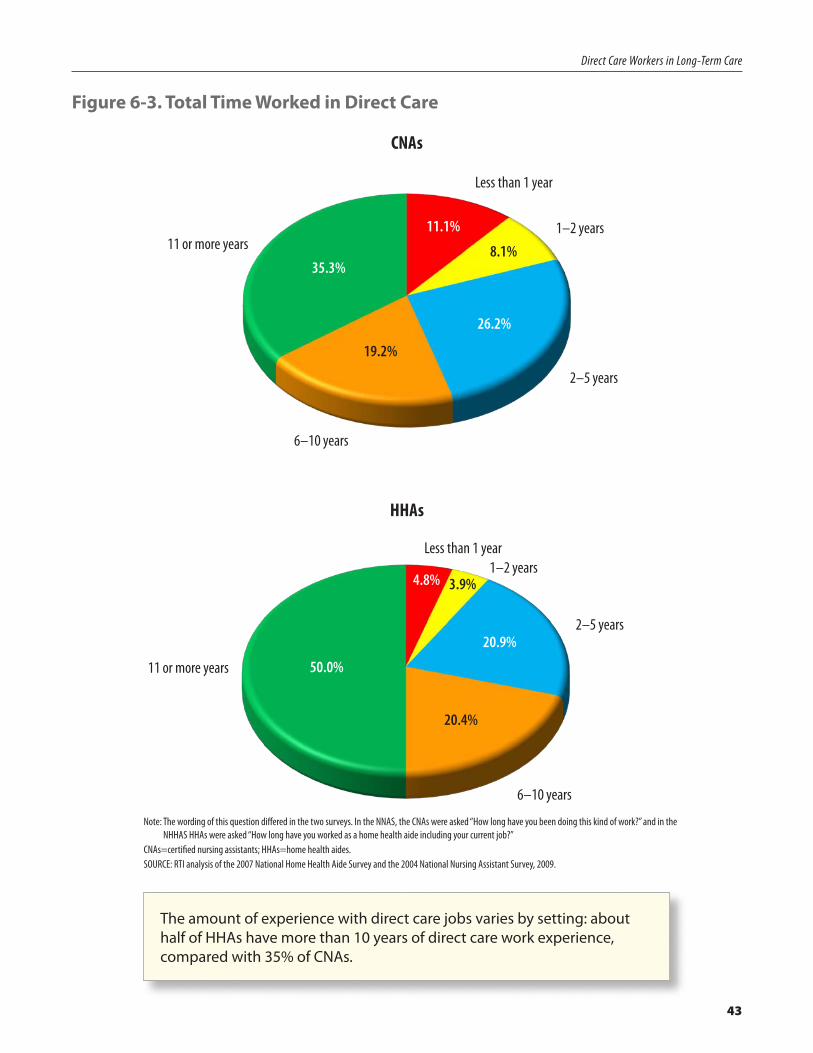
Figure 6-3. Total Time Worked in Direct Care
Less than 1 year
1–2 years
2–5 years
6–10 years
11 or more years
CNAs
11.1%
26.2%
35.3%
19.2%
8.1%
HHAs
Less than 1 year1–2 years
2–5 years
6–10 years
11 or more years
4.8%
20.9%
50.0%
20.4%
3.9%
Note: The wording of this question differed in the two surveys. In the NNAS, the CNAs were asked “How long have you been doing this kind of work?” and in the NHHAS HHAs were asked “How long have you worked as a home health aide including your current job?”
CNAs=certified nursing assistants; HHAs=home health aides.SOURCE: RTI analysis of the 2007 National Home Health Aide Survey and the 2004 National Nursing Assistant Survey, 2009.
The amount of experience with direct care jobs varies by setting: about half of HHAs have more than 10 years of direct care work experience, compared with 35% of CNAs.
44
Direct Care Workers in Long-Term Care
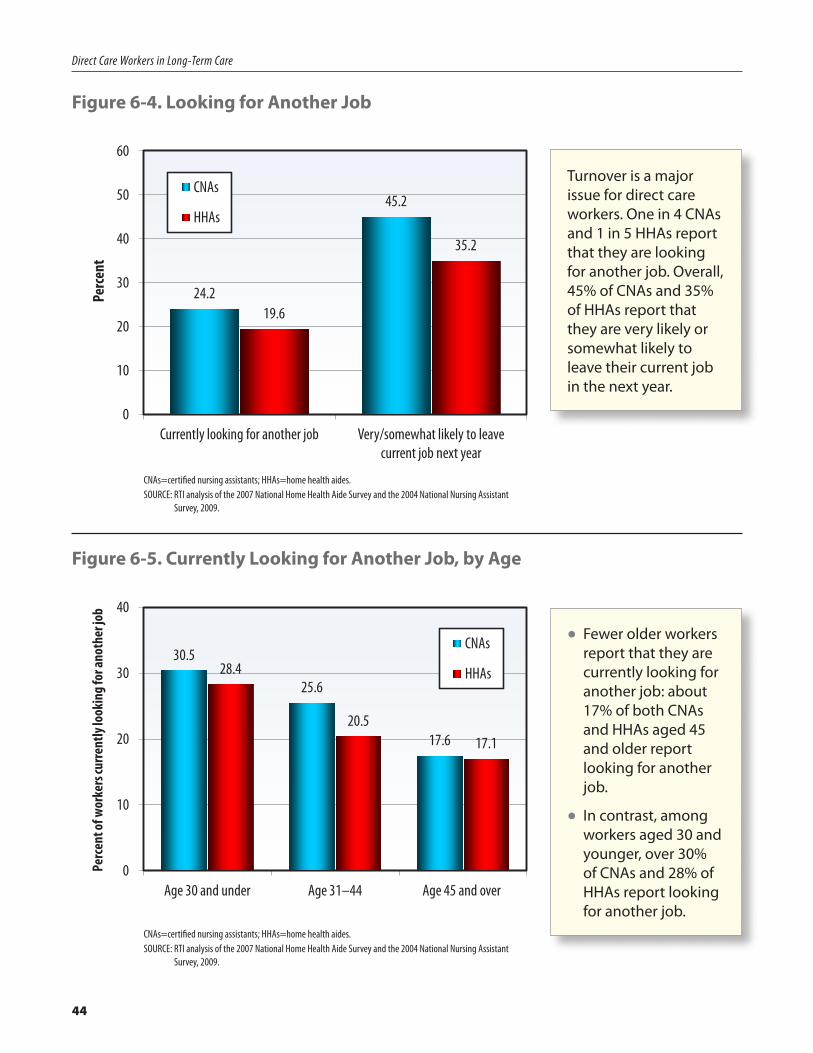
Figure 6-4. Looking for Another Job
24.2
45.2
19.6
35.2
0
10
20
30
40
50
60
Currently looking for another job Very/somewhat likely to leave current job next year
Perc
ent
CNAs
HHAs
CNAs=certified nursing assistants; HHAs=home health aides.SOURCE: RTI analysis of the 2007 National Home Health Aide Survey and the 2004 National Nursing Assistant
Survey, 2009.
Turnover is a major issue for direct care workers. One in 4 CNAs and 1 in 5 HHAs report that they are looking for another job. Overall, 45% of CNAs and 35% of HHAs report that they are very likely or somewhat likely to leave their current job in the next year.
Figure 6-5. Currently Looking for Another Job, by Age
30.5
25.6
17.6
28.4
20.517.1
0
10
20
30
40
Age 30 and under Age 31–44 Age 45 and over
Perc
ent o
f wor
kers
curre
ntly
look
ing f
or an
othe
r job
CNAs
HHAs
CNAs=certified nursing assistants; HHAs=home health aides.SOURCE: RTI analysis of the 2007 National Home Health Aide Survey and the 2004 National Nursing Assistant
Survey, 2009.
•Fewer older workers report that they are currently looking for another job: about 17% of both CNAs and HHAs aged 45 and older report looking for another job.
•In contrast, among workers aged 30 and younger, over 30% of CNAs and 28% of HHAs report looking for another job.
45
Direct Care Workers in Long-Term Care
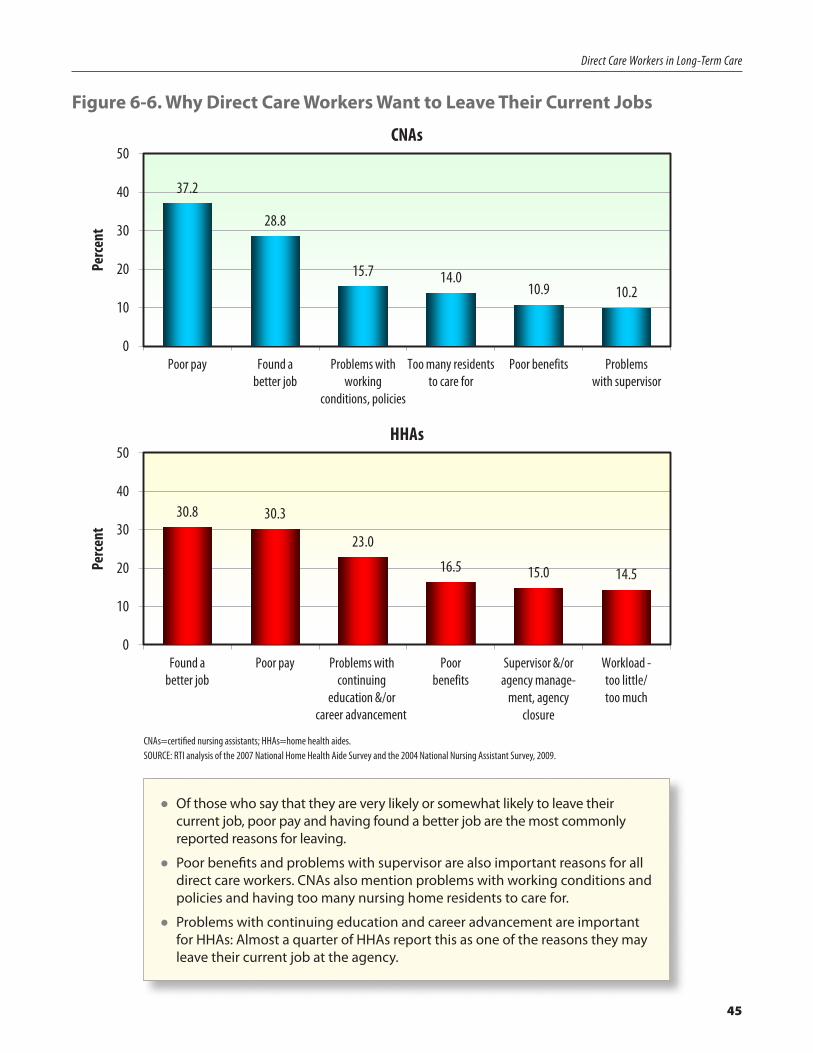
Figure 6-6. Why Direct Care Workers Want to Leave Their Current Jobs
37.2
28.8
15.7 14.0 10.9 10.2
0
10
20
30
40
50
Poor pay Found a better job
Problems with working
conditions, policies
Too many residents to care for
Poor benefits Problems with supervisor
Perc
ent
CNAs
30.8 30.3
23.0
16.5 15.0 14.5
0
10
20
30
40
50
Found a better job
Poor pay Problems with continuing
education &/or
Poor benefits
Supervisor &/or agency manage-
ment, agency closure
Workload -too little/too much
Perc
ent
career advancement
HHAs
CNAs=certified nursing assistants; HHAs=home health aides.SOURCE: RTI analysis of the 2007 National Home Health Aide Survey and the 2004 National Nursing Assistant Survey, 2009.
•Of those who say that they are very likely or somewhat likely to leave their current job, poor pay and having found a better job are the most commonly reported reasons for leaving.
•Poor benefits and problems with supervisor are also important reasons for all direct care workers. CNAs also mention problems with working conditions and policies and having too many nursing home residents to care for.
•Problems with continuing education and career advancement are important for HHAs: Almost a quarter of HHAs report this as one of the reasons they may leave their current job at the agency.
46
Direct Care Workers in Long-Term Care
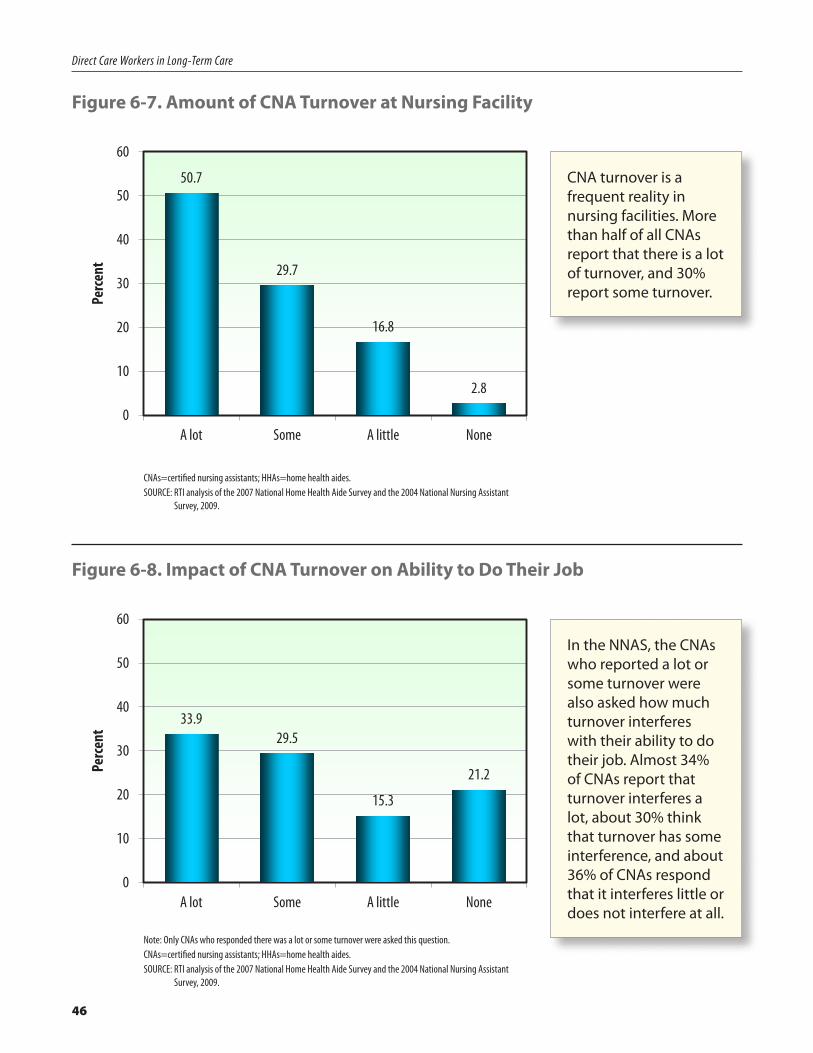
Figure 6-7. Amount of CNA Turnover at Nursing Facility
50.7
29.7
16.8
2.8
0
10
20
30
40
50
60
A lot Some A little None
Perc
ent
CNAs=certified nursing assistants; HHAs=home health aides.SOURCE: RTI analysis of the 2007 National Home Health Aide Survey and the 2004 National Nursing Assistant
Survey, 2009.
CNA turnover is a frequent reality in nursing facilities. More than half of all CNAs report that there is a lot of turnover, and 30% report some turnover.
Figure 6-8. Impact of CNA Turnover on Ability to Do Their Job
33.9 29.5
15.3
21.2
0
10
20
30
40
50
60
A lot Some A little None
Perc
ent
Note: Only CNAs who responded there was a lot or some turnover were asked this question.CNAs=certified nursing assistants; HHAs=home health aides.SOURCE: RTI analysis of the 2007 National Home Health Aide Survey and the 2004 National Nursing Assistant
Survey, 2009.
In the NNAS, the CNAs who reported a lot or some turnover were also asked how much turnover interferes with their ability to do their job. Almost 34% of CNAs report that turnover interferes a lot, about 30% think that turnover has some interference, and about 36% of CNAs respond that it interferes little or does not interfere at all.
47
Direct Care Workers in Long-Term Care
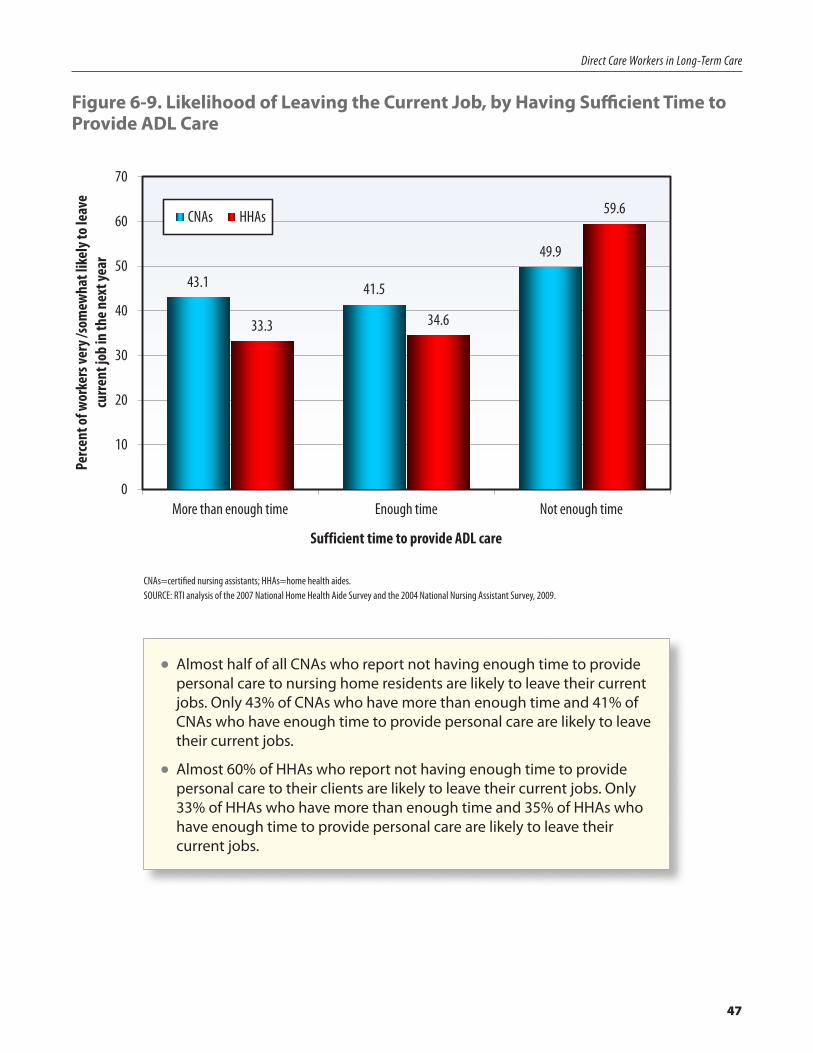
Figure 6-9. Likelihood of Leaving the Current Job, by Having Sufficient Time to Provide ADL Care
43.1 41.5
49.9
33.3 34.6
59.6
0
10
20
30
40
50
60
70
More than enough time Enough time Not enough time
Perc
ent o
f wor
kers
very
/som
ewha
t lik
ely t
o lea
ve
curre
nt jo
b in
the n
ext y
ear
Sufficient time to provide ADL care
CNAs HHAs
CNAs=certified nursing assistants; HHAs=home health aides.SOURCE: RTI analysis of the 2007 National Home Health Aide Survey and the 2004 National Nursing Assistant Survey, 2009.
•Almost half of all CNAs who report not having enough time to provide personal care to nursing home residents are likely to leave their current jobs. Only 43% of CNAs who have more than enough time and 41% of CNAs who have enough time to provide personal care are likely to leave their current jobs.
•Almost 60% of HHAs who report not having enough time to provide personal care to their clients are likely to leave their current jobs. Only 33% of HHAs who have more than enough time and 35% of HHAs who have enough time to provide personal care are likely to leave their current jobs.
48
Chapter 7
The Benefits Outweigh the Risks
Despite the low pay, few fringe benefits, and high rates of injury, direct care workers generally find their jobs satisfying, although they wish that working conditions were better.
•Most direct care workers express overall satisfaction with their work: more than 80% report that they are very or somewhat satisfied with their current job.
• The two top reasons for direct care workers to continue with their current jobs are the desire to care for others and feeling good about doing so.
• Almost all of the workers report that their work is challenging and say that they have learned new skills.
• Respondents are less satisfied with benefits and salary, with approximately 60% of direct care workers reporting being extremely satisfied or somewhat satisfied.
• Nearly half of all workers continue working with their current employers because they like to provide care for others.
• High proportions of workers believe that they are respected by their supervisors, co-workers, and residents and clients.
• Commitment to the current job appears to increase with workers’ age. More than half of workers aged 45 and older report that they would definitely take their current job again.
49
Direct Care Workers in Long-Term Care
Figure 7-1. Overall Satisfaction with Current Job
30.5
51.4
14.4
3.7
47.2
40.9
9.5
2.4
0
10
20
30
40
50
60
Extremely satisfied
Somewhat satisfied
Somewhat dissatisfied
Extremely dissatisfied
Perc
ent
CNAs
HHAs
CNAs=certified nursing assistants; HHAs=home health aides.SOURCE: RTI analysis of the 2007 National Home Health Aide Survey and the 2004 National Nursing Assistant
Survey, 2009.
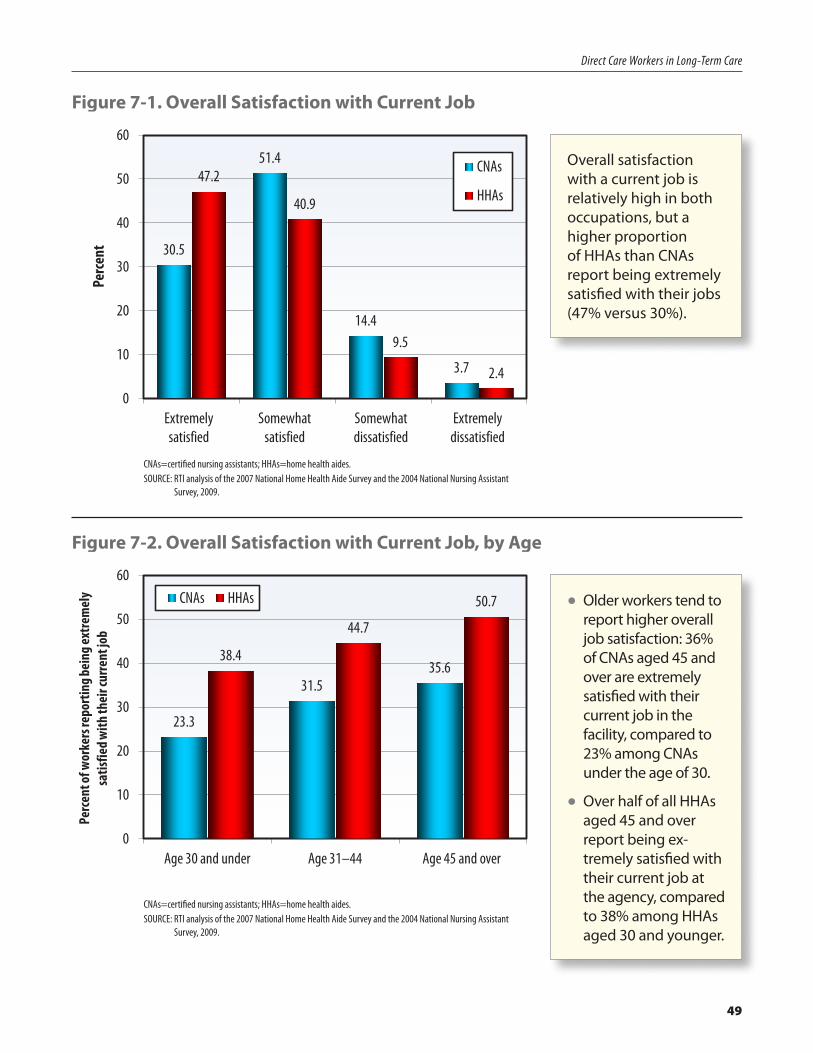
Overall satisfaction with a current job is relatively high in both occupations, but a higher proportion of HHAs than CNAs report being extremely satisfied with their jobs (47% versus 30%).
Figure 7-2. Overall Satisfaction with Current Job, by Age
23.3
31.535.6
38.4
44.7
50.7
0
10
20
30
40
50
60
Age 30 and under Age 31–44 Age 45 and over
Perc
ent o
f wor
kers
repo
rtin
g bei
ng ex
trem
ely
satis
fied w
ith th
eir c
urre
nt jo
b
CNAs HHAs
CNAs=certified nursing assistants; HHAs=home health aides.SOURCE: RTI analysis of the 2007 National Home Health Aide Survey and the 2004 National Nursing Assistant
Survey, 2009.
•Older workers tend to report higher overall job satisfaction: 36% of CNAs aged 45 and over are extremely satisfied with their current job in the facility, compared to 23% among CNAs under the age of 30.
•Over half of all HHAs aged 45 and over report being ex-tremely satisfied with their current job at the agency, compared to 38% among HHAs aged 30 and younger.
50
Direct Care Workers in Long-Term Care
Figure 7-3. Overall HHA Job Satisfaction, by Home Health Agency Type
38.4
46.2
12.0
3.4
44.7 43.1
11.8
0.4
50.7
38.5
7.63.2
0
10
20
30
40
50
60
Extremely satisfied Somewhat satisfied Somewhat dissatisfied Extremely dissatisfied
Perc
ent
Home Health HospiceMixed
CNAs=certified nursing assistants; HHAs=home health aides.SOURCE: RTI analysis of the 2007 National Home Health Aide Survey and the 2004 National Nursing Assistant Survey, 2009.
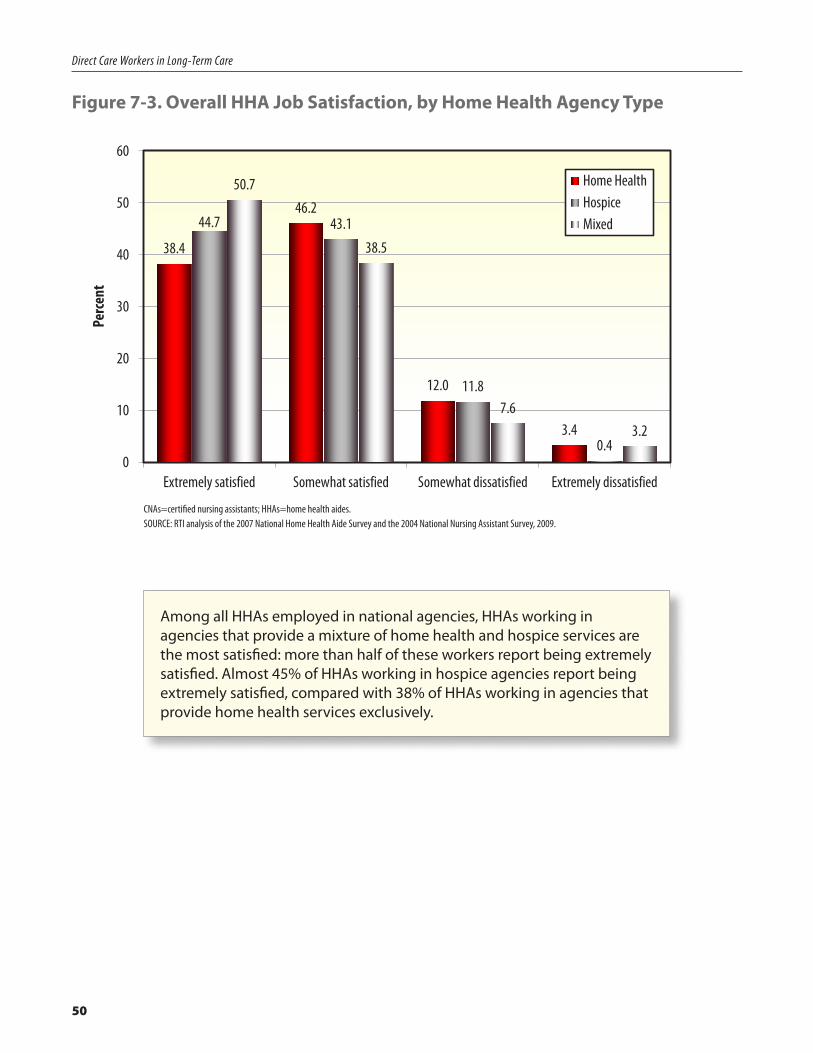
Among all HHAs employed in national agencies, HHAs working in agencies that provide a mixture of home health and hospice services are the most satisfied: more than half of these workers report being extremely satisfied. Almost 45% of HHAs working in hospice agencies report being extremely satisfied, compared with 38% of HHAs working in agencies that provide home health services exclusively.
51
Direct Care Workers in Long-Term Care
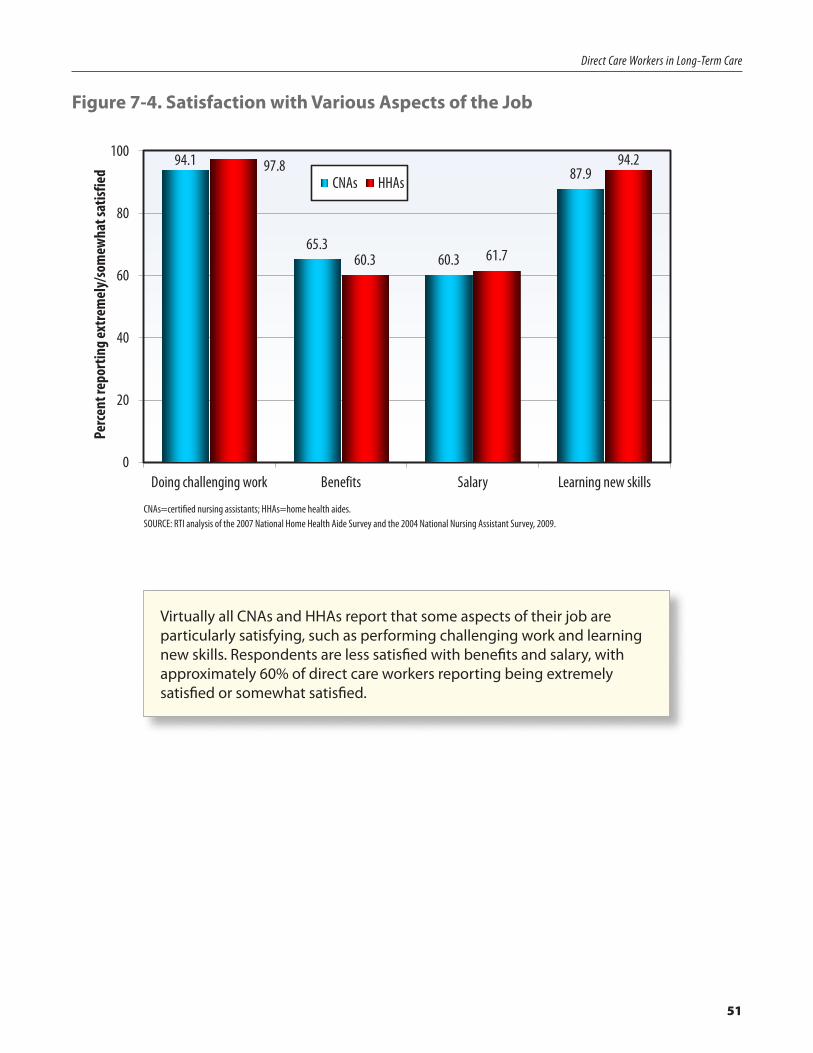
Figure 7-4. Satisfaction with Various Aspects of the Job
94.1
65.360.3
87.997.8
60.3 61.7
94.2
0
20
40
60
80
100
Doing challenging work Benefits Salary Learning new skills
Perc
ent r
epor
ting e
xtre
mel
y/so
mew
hat s
atisf
ied
CNAs HHAs
CNAs=certified nursing assistants; HHAs=home health aides.SOURCE: RTI analysis of the 2007 National Home Health Aide Survey and the 2004 National Nursing Assistant Survey, 2009.
Virtually all CNAs and HHAs report that some aspects of their job are particularly satisfying, such as performing challenging work and learning new skills. Respondents are less satisfied with benefits and salary, with approximately 60% of direct care workers reporting being extremely satisfied or somewhat satisfied.
52
Direct Care Workers in Long-Term Care
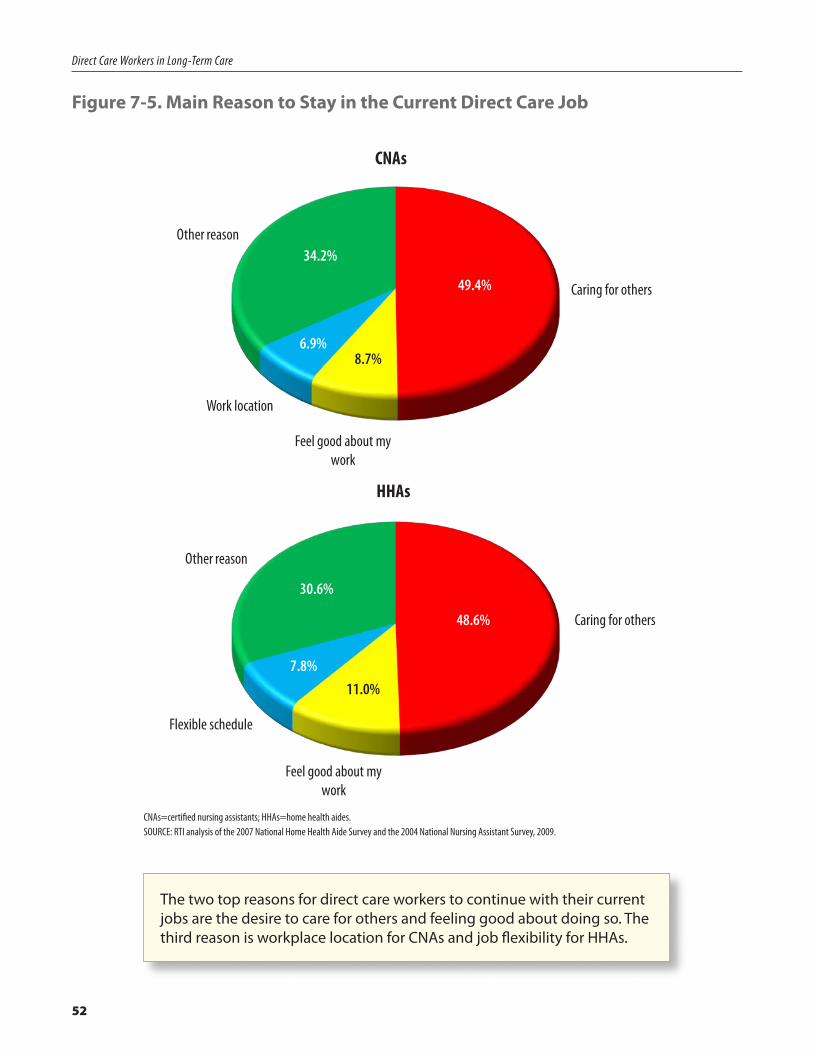
Figure 7-5. Main Reason to Stay in the Current Direct Care Job
Caring for others
Feel good about my work
Work location
Other reason
CNAs
HHAs
Caring for others
Feel good about my work
Flexible schedule
Other reason
34.2%
49.4%
6.9%8.7%
48.6%
7.8%
30.6%
11.0%
CNAs=certified nursing assistants; HHAs=home health aides.SOURCE: RTI analysis of the 2007 National Home Health Aide Survey and the 2004 National Nursing Assistant Survey, 2009.
The two top reasons for direct care workers to continue with their current jobs are the desire to care for others and feeling good about doing so. The third reason is workplace location for CNAs and job flexibility for HHAs.
53
Direct Care Workers in Long-Term Care
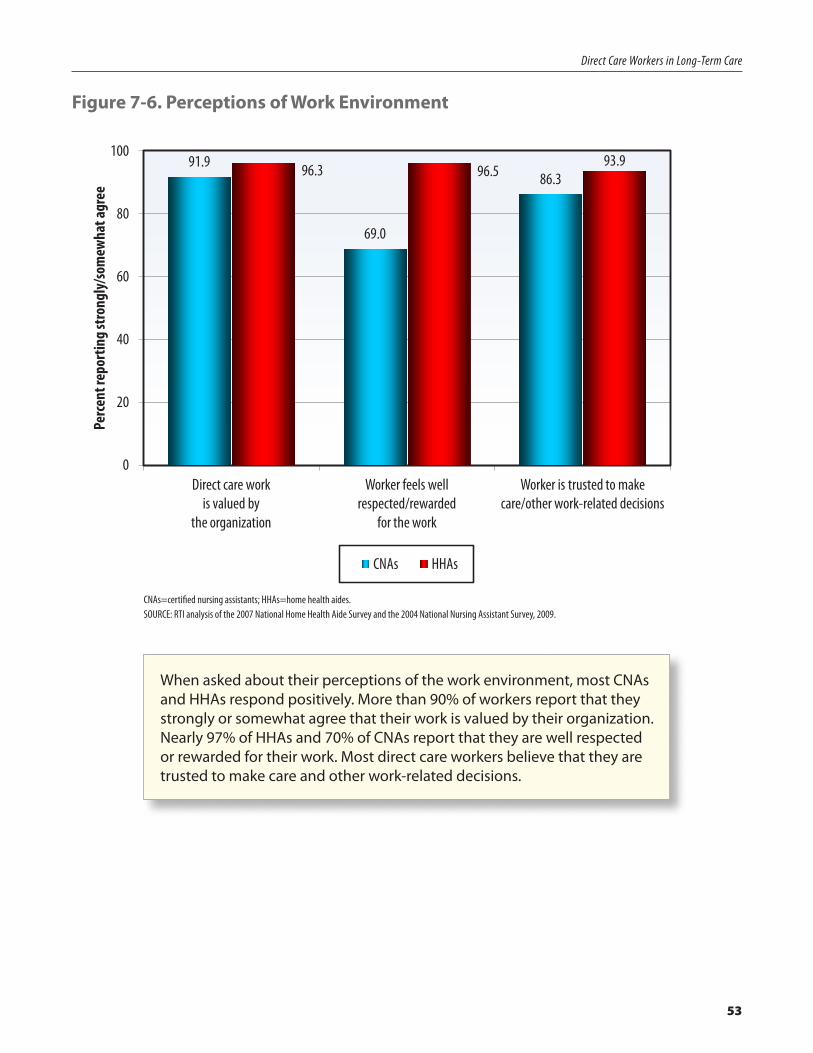
Figure 7-6. Perceptions of Work Environment
91.9
69.0
86.3 96.3 96.5 93.9
0
20
40
60
80
100
Direct care work is valued by
the organization
Worker feels well respected/rewarded
for the work
Worker is trusted to make care/other work-related decisions
Perc
ent r
epor
ting s
trong
ly/so
mew
hat a
gree
CNAs HHAs
CNAs=certified nursing assistants; HHAs=home health aides.SOURCE: RTI analysis of the 2007 National Home Health Aide Survey and the 2004 National Nursing Assistant Survey, 2009.
When asked about their perceptions of the work environment, most CNAs and HHAs respond positively. More than 90% of workers report that they strongly or somewhat agree that their work is valued by their organization. Nearly 97% of HHAs and 70% of CNAs report that they are well respected or rewarded for their work. Most direct care workers believe that they are trusted to make care and other work-related decisions.
54
Direct Care Workers in Long-Term Care
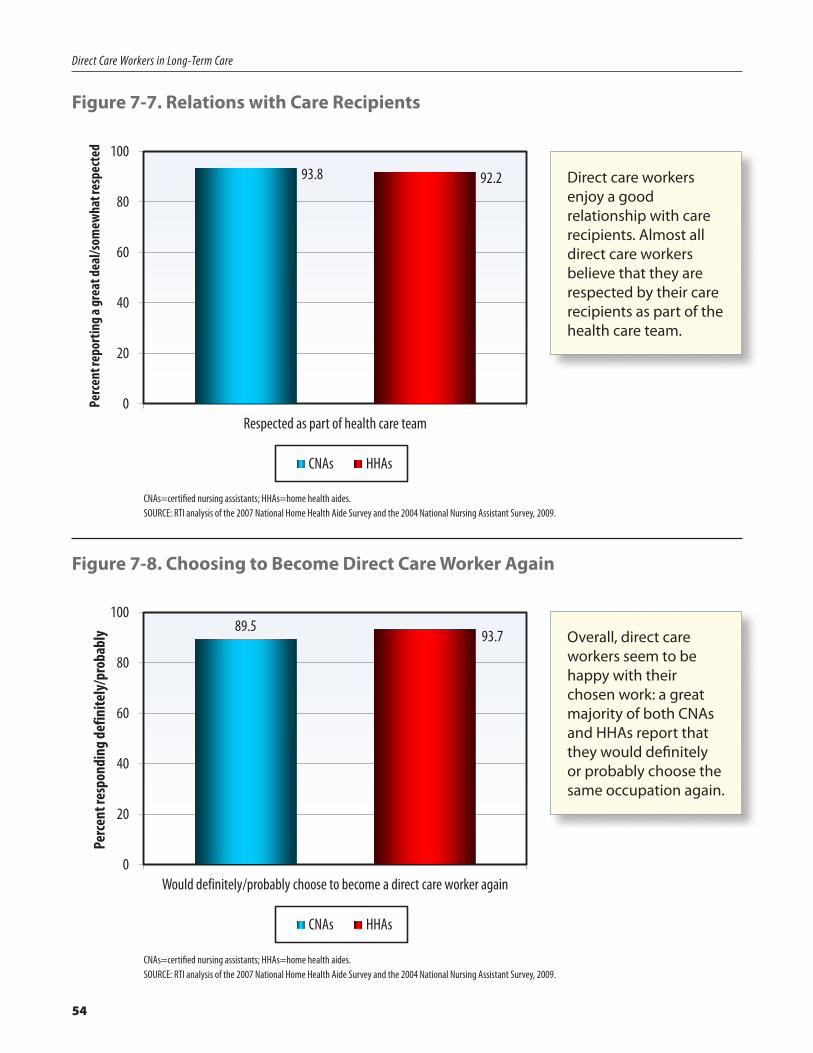
Figure 7-7. Relations with Care Recipients
93.8 92.2
0
20
40
60
80
100
Respected as part of health care team
Perc
ent r
epor
ting a
grea
t dea
l/som
ewha
t res
pect
ed
CNAs HHAs
CNAs=certified nursing assistants; HHAs=home health aides.SOURCE: RTI analysis of the 2007 National Home Health Aide Survey and the 2004 National Nursing Assistant Survey, 2009.
Direct care workers enjoy a good relationship with care recipients. Almost all direct care workers believe that they are respected by their care recipients as part of the health care team.
Figure 7-8. Choosing to Become Direct Care Worker Again
89.5 93.7
0
20
40
60
80
100
Would definitely/probably choose to become a direct care worker again
Perc
ent r
espo
ndin
g def
inite
ly/p
roba
bly
CNAs HHAs
CNAs=certified nursing assistants; HHAs=home health aides.SOURCE: RTI analysis of the 2007 National Home Health Aide Survey and the 2004 National Nursing Assistant Survey, 2009.
Overall, direct care workers seem to be happy with their chosen work: a great majority of both CNAs and HHAs report that they would definitely or probably choose the same occupation again.
55
Direct Care Workers in Long-Term Care
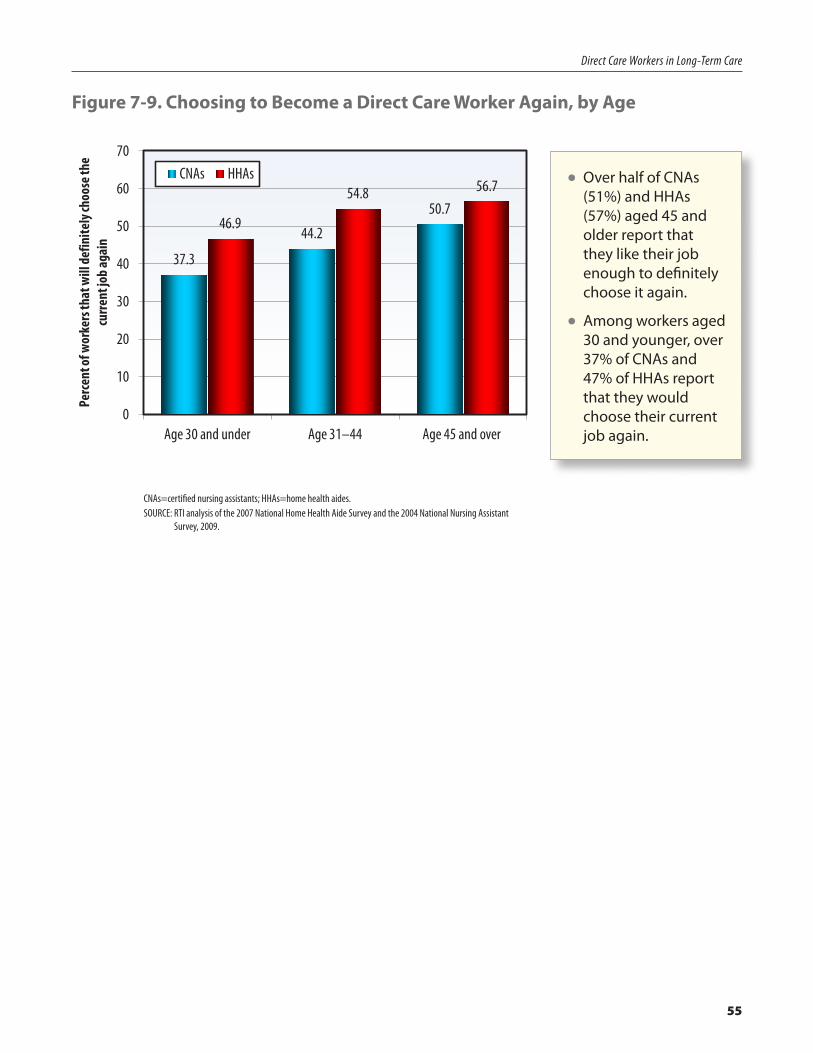
Figure 7-9. Choosing to Become a Direct Care Worker Again, by Age
37.3
44.2
50.746.9
54.8 56.7
0
10
20
30
40
50
60
70
Age 30 and under Age 31–44 Age 45 and over
Perc
ent o
f wor
kers
that
will
defin
itely
choo
se th
e cu
rrent
job a
gain
CNAs HHAs
CNAs=certified nursing assistants; HHAs=home health aides.SOURCE: RTI analysis of the 2007 National Home Health Aide Survey and the 2004 National Nursing Assistant
Survey, 2009.
•Over half of CNAs (51%) and HHAs (57%) aged 45 and older report that they like their job enough to definitely choose it again.
•Among workers aged 30 and younger, over 37% of CNAs and 47% of HHAs report that they would choose their current job again.
56
Conclusion
The Affordable Care Act contains several key provisions to enhance and revitalize direct care jobs and improve the availability of health insurance. The Affordable Care Act also lays the groundwork for wide-ranging continuum-of-care reform and establishes a framework for care coordination and a future in which care is integrated across providers and settings. An integrated system cannot exist without a workforce to care for the population in need.
Direct care workers are the cornerstone of top-quality and essential paid long-term care and daily living services to more than 13 million elderly and disabled Americans. It is critical to recruit, support, and train workers to meet increased responsibilities in a reorganized health care system.
Direct care workforce data collection and monitoring is vital to evaluate new initiatives and expanded programs and to inform a future health care system that is better coordinated and integrated and better able to absorb the substantial demand for long-term care services for our growing population of older Americans.
Future data collection efforts should include State- as well as national-level monitoring to inform current and projected needs and make recommendations for improving direct care worker training, recruitment, and retention strategies. At the federal level, replication of these national surveys will allow for trend analysis as the industry grows, as the need for workers grows, as long-term care needs change, and as individual preferences change.
57
Appendix A Survey Limitations
Insufficient sample sizes for items with low prevalence in the population are a limitation common to all sample surveys. For example, making accurate estimates of responses to many survey items by gender may not be possible since the prevalence of male direct care workers is very low in both surveys (8 percent in the NNAS and 5 percent in the NHHAS). Another limitation of the survey is the use of ‘‘other specify’’ response options for many of the questionnaire items. Although many of these open-ended responses could be back coded to established response categories or new response categories could be created when a sufficient number of nursing assistants provided similar responses, many of the responses could not be coded into a meaningful category or were of low prevalence and hence will not produce reliable estimates.
SOURCES: An overview of the first national probability survey of nursing assistants working in nursing homes, including methodology, data collected, and linkage to the 2004 National Nursing Home Survey (NNHS). Design and Operation of the National Home Health Aide Survey: 2007–2008. Vital and Health Statistics. Series 1, Number 49, March 2010.
58
Appendix B Links to Data Files
2004 National Nursing Assistant SurveyPublic Use Data Files (micro-data) available at the link below include data files and documentation via FTP, as well as SAS, SPSS, and STATA Input Statements
http://www.cdc.gov/nchs/nnas.htm
2007 National Home Health Aide SurveyPublic Use Data Files (micro-data) available at the link below include data files and documentation via FTP, as well as SAS, SPSS, and STATA Input Statements
http://www.cdc.gov/nchs/nhhas.htm
59
Appendix C For More Information
2004 National Nursing Assistant Survey U.S. Department of Health and Human Services, Assistant Secretary for Planning and Evaluation and National Center for Health Statistics Partnership http://www.cdc.gov/nchs/nnas.htm
The 2004 National Nursing Assistant Survey is the first national probability survey of CNAs. A total of 3,017 interviews with CNAs were completed between September 2004 and February 2005.
Federal Project Officers
Marie R. Squillace, Ph.D. Office of the Assistant Secretary for Planning and Evaluation
Robin Remsburg, Ph.D. Previously with the National Center for Health Statistics
Reports/Publications Using NNAS
•An Introduction to the National Nursing Assistant Survey http://aspe.hhs.gov/daltcp/reports/2006/NNASintro.pdf http://www.cdc.gov/nchs/data/series/sr_01/sr01_044.pdf
•An Exploratory Study of Certified Nursing Assistants’ Intent to Leave http://aspe.hhs.gov/daltcp/reports/2008/intent.pdf
•The National Nursing Assistant Survey: Improving the Evidence Base for Policy Initiatives to Strengthen the Certified Nursing Assistant Workforce http://aspe.hhs.gov/daltcp/reports/2009/NNASeb.pdf (See also The Gerontologist, April 1, 2009)
•Why Do They Stay? Job Tenure Among Certified Nursing Assistants in Nursing Homes http://aspe.hhs.gov/daltcp/reports/2009/whystay.pdf (See also The Gerontologist, April 6, 2009)
•Nursing Home Work Practices and Nursing Assistants’ Job Satisfaction http://aspe.hhs.gov/daltcp/reports/2009/NHwork.pdf (See also The Gerontologist, June 8, 2009)
60
Direct Care Workers in Long-Term Care
•IntrinsicJobSatisfaction,OverallJobSatisfaction,andIntentiontoLeavetheJobAmongNursingAssistantsinNursingHomes(The Gerontologist,June9,2009)
•CharacteristicsandRecruitmentPathsofCertifiedNursingAssistantsinRuralandUrbanNursingHomeshttp://www.bmlsearch.com/?&kwr=19566612%5bpmid%5d&cmpgn306037=MGD0306LkmeehbcJXUBs&dt02=&dt03=&xpclps3=Matches(SeealsoThe Journal of Rural Health,2009)
•CaringLabour,IntersectionalityandWorkerSatisfaction:AnAnalysisoftheNationalNursingAssistantStudy(NNAS)http://www.bmlsearch.com/?&kwr=19891615%5bpmid%5d&cmpgn306037=MGD0306LkmeehbcJXUBs&dt02=&dt03=&xpclps3=Matches(SeealsoSociology of Health & Illness,March,2010)
•TheRelationshipbetweenWorkplaceEnvironmentandJobSatisfactionamongNursingAssistants:FindingsfromaNationalSurveyhttp://www.bmlsearch.com/?&kwr=20439043%5bpmid%5d&cmpgn306037=MGD0306LkmeehbcJXUBs&dt02=&dt03=&xpclps3=Matches(SeealsoJournal of the American Medical Directors Association,May,2010)
•ImmigrantandNon-ImmigrantCertifiedNursingAssistantsWorkinginNursingHomes:HowDoTheyDiffer?(Journal of Aging and Social Policy,July2010)
•ANationalOverviewoftheTrainingReceivedbyCertifiedNursingAssistantsWorkinginU.S.NursingHomes(Gerontology & Geriatrics Education,August20,2010)
•PrevalenceofNursingAssistantTrainingandCertificationProgramswithinNursingHomes,1997-2007http://www.bmlsearch.com/?&kwr=20185520%5bpmid%5d&cmpgn306037=MGD0306LkmeehbcJXUBs&dt02=&dt03=&xpclps3=Matches(SeealsoThe Gerontologist,August,2010)
•NationalNursingAssistantSurveyWebtablesavailableathttp://www.cdc.gov/nchs/nnhs/nursing_assistant_tables.htm
CNAcharacteristicsaretabulatedbyfacilitycharacteristics,demographics,jobhistory,workexperience,training,healthinsurancecoverage,wages,raises,benefits,child/adultcarerequirements,publicassistance,workplacepolicies,practices,problems,environment,supervisorrelationsandpractices,jobsatisfaction,careermotivations,commitment,andworkplaceinjuries.
61
2007 National Home Health Aide Survey U.S.DepartmentofHealthandHumanServices,AssistantSecretaryforPlanningandEvaluationandNationalCenterforHealthStatisticsPartnershiphttp://www.cdc.gov/nchs/nhhas.htm
The2007NationalHomeHealthAideSurveyisthefirstnationalprobabilitysurveyofHHAs.Atotalof3,377interviewswithHHAswerecompletedbetweenSeptember2007andApril2008.
Federal Project Officers
MarieR.Squillace,Ph.D.OfficeoftheAssistantSecretaryforPlanningandEvaluation
LaurenHarris-Kojetin,Ph.D.NationalCenterforHealthStatistics
Reports/Publications Using NHHAS
•DesignandOperationoftheNationalHomeHealthAideSurveyhttp://www.cdc.gov/nchs/data/nhhcsd/NHHCS_NHHAS_web_documentation.pdforhttp://www.cdc.gov/nchs/data/series/sr_01/sr01_049.pdf
•AnOverviewofHomeHealthAides:UnitedStates,2007National Health Statistics Report
62
References
1. Report of Findings of 2007 AHCA Survey: Nursing Staff Vacancy and Turnover in Nursing Facilities. Washington, DC: American Health Care Association. Available at http://www.ahcancal.org/research_data/staffing/Documents/Vacancy_Turnover_Survey2007.pdf. Accessed October 10, 2010.)
2. Occupational Outlook Handbook, 2010–2011 Edition. Washington, DC: U.S. Department of Labor. Available at http://www.bls.gov/oco/ocos327.htm#projections_data and http://www.bls.gov/oco/ocos326.htm#projections_data. Accessed October 25, 2010.

This page intentionally left blank

Office of the Assistant Secretary for Planning and Evaluation
U.S. Department of Health & Human Services 200 Independence Avenue, SW
Washington, D.C. 20201
http://aspe.hhs.gov