Embed Size (px)
Citation preview

UNDERSTANDING DIRECT
AND INDIRECT DRIVER
VISION FROM HEAVY GOODS
VEHICLES
Summary Report
Prepared on behalf of Transport for London
Prepared by: Dr Steve Summerskill
Dr Russell Marshall
Loughborough Design School, Loughborough University

1
1. EXECTUTIVE SUMMARY
The research described in this report has been performed by Loughborough Design School (LDS) under the
CLOCS programme funded by TfL. The project was specified to allow an understanding of the variability of
blind spots in direct vision through windows and indirect vision through mirrors for the top selling HGVs in
the UK. The impetus for the research was the increasing number of accidents between Vulnerable Road
Users (VRUs) and HGVs in London. The aim was to compare the manufacturers’ most sold vehicle
specifications to determine which vehicle design variables can affect the size of blind spots, and to explore
issues that have been raised in previous research including the potential for construction HGVs to be
involved in more accidents with VRUs than distribution variants of HGV designs. The LDS team have
utilised a virtual modelling technique to explore this issue. This virtual approach allows multiple accident
scenarios to be modelled and simulated. In order to allow the analysis of vehicle blind spots 19 vehicle
models have been created by digitally scanning the real world vehicles. The vehicles that have been
modelled include construction, distribution and long haul HGV designs, as well as ‘high vision’ low entry
cab designs. These models have been used in combination with simulations of cyclist and pedestrian VRUs
in a manner which recreates critical accident scenarios that have been defined through the analysis of
accident data. This involves placing the simulated VRUs in a number of defined locations adjacent to the
vehicle. Subsequently the simulated VRUs are moved away from the vehicle into a position where they
‘just can’t be seen’ by the driver of the vehicle, i.e. if they were moved further away they would be
partially visible to the driver. The distance that the VRU simulation is away from the side or front of the
vehicle cab determines the size of the direct vision blind spot. In this way vehicle designs and
configurations can be compared. In addition to this further testing was performed to determine if the
VRUs located in the direct vision blind spots could be viewed by the driver through the use of mirrors. The
final analysis technique utilised a method which projects the volume of space that can be seen by a driver
through the windows and mirrors on the surface of sphere. This provides a field of view value which can be
used to compare the glazed area of HGVs and provides a method to distinguish between vehicles that
perform at the same level in the VRU simulation. The results of the work highlight the follow key issues.
1. All standard vehicle configurations have blind spots which can hide VRUs from the driver’s direct
vision
2. The height of the cab above the ground is the key vehicle factor which affects the size of direct
vision and indirect vision blind spots
3. The design of window apertures and the driver location in relation to these window apertures can
reduce the size of the identified blind spots. i.e. two different vehicle designs with the same cab
height can have different results for blind spot size due to window design and driver seat location
4. Low entry cab designs, which are the lowest of the 19 vehicles tested, demonstrated real benefits
in terms of reducing direct vision blind spots when compared to standard vehicle designs
5. The construction vehicles assessed in the project are on average 32% higher than the same cab
design in the distribution configuration
6. For construction vehicles the distance away that a pedestrian in front of the vehicle can be hidden
from the driver’s view is on average nearly three times greater than the distribution vehicles
7. For the construction vehicles the distance away that a cyclist to the passenger side of the vehicle can
be hidden is on average more than two times greater than the distribution vehicles
8. The work has highlighted the need for a new standard which defines what should be visible through
direct vision from the vehicle. Such a standard does not currently exist, and is seen as a key
mechanism for improving future vehicle designs
2
2. ACKNOWLEDGMENTS
The project described in this report would not have possible without with considerable support provided
by vehicle manufacturers. Each manufacturer has allowed access to their vehicles to allow data to be
captured, and provided additional information that relates the vehicle specifications. We would like to
thank the following manufacturers and their representatives for their support,
3. INTRODUCTION
This summary report is the condensed version of the full ‘Understanding direct and indirect driver vision of
heavy goods vehicles’ report produced by Loughborough Design School (LDS) for Transport for London (TfL)
as part of the CLOCS research programme.
The research has been informed by concerns for the safety of vulnerable road users (VRUs) in London and
elsewhere in the UK and EU. Recent research conducted by LDS1 confirms that whilst there has been a
general improvement in road safety in the UK with casualties falling 49% between 2000 and 2012, and the
numbers of those killed and seriously injured (KSI) falling 40% in the same period, cyclist casualties have not
followed this trend. Data shows that over the same period the numbers of cyclists killed or seriously injured
have increased by 21% nationally and in Greater London by 59%.
A common factor in accidents involving cyclists and other VRUs is the overrepresentation of Heavy Goods
Vehicles (HGVs). One of the significant characteristics of these larger vehicles is the higher driving position.
European regulation of HGVs2 which limits maximum values for overall vehicle length for the tractor unit and
trailer has led to a vehicle design process where the driver cab is placed above the engine. A key safety issue
that is derived from the height of the driver position of HGVs is the ability of the driver to view VRUs, and
other road users that are in close proximity to the vehicle directly through the windows. This is currently
mitigated through the use of a range of mirrors that provide indirect vision of the space around the vehicle.
The area of coverage that is required by the mirrors is specified in European regulations. What should be
seen through the windows is not currently regulated. In this report the volume of space that is visible to the
driver through mirrors is described as ‘in-direct vision’ and the volume of space that is visible through
windows is described as ‘direct vision’.
Previous research performed for the UK Department for Transport by the LDS team3 highlighted the potential
for blind spots to exist around HGVs where the driver is unable to see either via direct vision through
windows or indirect vision via mirrors. In addition previous work by TRL4 highlighted the need to explore the
design of HGVs with construction specifications in terms of blind spot variability. In order to understand the
nature and size of these blind spots and restrictions to the driver’s field of view (FOV) the research
1 Pedal Cyclist Fatalities and Serious Injuries in London: Analysis of Police Collision Files (2007-
2011), a report by the TSRC, Loughborough University and the Centre for Transport Studies UCL. As yet unpublished.
2 96/53/EC. Council directive 96/53/EC laying down for certain road vehicles circulating within the Community the maximum authorized dimensions in national and international traffic and the maximum authorized weights in international traffic. The Council of the European Union. 1996.
3 Cook, S. E., et al., (2011). The development of improvements to drivers' direct and indirect vision from vehicles. Phase 2. Loughborough University. Report for Department for Transport.
4 Helman, S et al., (2013). Construction Logistics and cyclist safety. A Transport Research Laboritoty report product for Transport for London. http://content.tfl.gov.uk/construction-logistics-and-cyclist-safety-summary-report.pdf. Accessed (13/10/15)

3
performed by the LDS team has been designed to allow the objective evaluation the best-selling HGVs on
today’s roads using digital techniques.
The following report describes how software based digital human modelling tools have been used to
model HGVs, and VRUs, and to visualise the FOV available to the driver, in order to quantify direct and
indirect vision from a range of top selling distribution (category N3) and construction (N3G) vehicles. The
results allow an objective comparison between the top selling vehicle designs, highlight key design
features which affect the size of blind spots, and illustrate the height differences between distribution
vehicles and construction vehicles.
In addition, there is currently a regulatory gap in that what should be able to be directly seen from the cab of
a HGV by a driver is not covered by European standards. A key issue that is defined by the project results is
the need for a Direct Vision standard which defines what should be visible from a cab design as mechanism
to improve the design of new vehicles.
4. METHODOLOGY: MODELLING BLIND SPOTS USING DIGITAL METHODS
This research uses a software based approach to assess the field of view of the driver from a range of HGV
models present on today’s roads. The software used is a 3D computer aided design program that allows
both vehicles and people to be modelled. This digital human modelling technique then supports the
visualisation of the field of view through the ability to project the volume of space that is visible to the driver
though both windows (direct vision) and mirrors (indirect vision). Figure 1 shows the projection technique
for one mirror, the Class V (look down mirror) being projected as a red volume, and one window, the
passenger side window being projected as an orange volume. The significance of the projections is such that
the volume of space within the projections is visible to the driver. Equally, any space outside of the
combined projections from all windows and all mirrors is not visible to the driver, and is therefore a blind
spot.
Figure 1. The projection of the Class V (look down) mirror (the red volume) and the space visible through the
passenger window (the orange volume)
The projected volumes can also be used to generate an area of visibility on a surface such as the ground. The
analyses also use a specific version of this process in which the projections are mapped onto the surface of a
sphere, centred on the driver’s eye point to create a visual map.

4
5. METHODOLOGY: MODELLING ACCIDENT SCENARIOS TO INFORM THE DESIGN OF
VEHICLE TESTS
The assessments performed were informed by accident data recorded in the UK police accident database
STATS19. These data were used to identify all accidents that occurred in a single year involving any size of
goods vehicle where the term ‘blind spot’ was recorded as being a potential factor. The types of accident
were then identified in the form of scenarios, for example, a HGV turning left at a junction and colliding with
another road user to their passenger side. Figure 2 summarises all of the data highlighting all of the accident
types identified. From the figure it can be seen that blind spots exist to the front, rear and left and right sides
of the cab. For this research accidents occurring directly rearwards of the vehicle were not assessed as these
nearly all involve smaller vehicles (vans) and not HGVs and will not be addressed through improved design of
vehicles for direct vision. Instead this research focused on the three areas (front, left and right) adjacent to
the cab which together represent the majority of the fatalities that occur.
Figure 2. Goods vehicle accidents due to blind spots infographic.

5
The three areas are assessed using the projection technique outlined earlier and a number of models of
VRUs. These VRUs consist of a standing human model to represent a pedestrian, and a human model riding a
bicycle. The pedestrians are used to assess visibility to the front of a vehicle and the cyclists to either side.
The basic analysis approach positions the pedestrian and cyclist models at the furthest point from the cab in
which they cannot be seen by the driver using direct vision through the windows (see Figure 3). The distance
from the vehicle then provides a measure of the size of any blind spot.
Figure 3. The use of the volumetric projections to assess direct field of view to the passenger side of the vehicle. Top
left: cyclist is clearly not visible. Top-Middle: cyclist is at the furthest point from the vehicle in which they are not
visible. Top-Right: cyclist’s head is visible. Bottom: cyclist is fully visible.
For the visibility to the front of the vehicle, three pedestrian VRU models are positioned across the front of
the vehicle. This is designed to represent a pedestrian walking across the road in front of the test vehicle.
Figure 4. The direct field of view analysis to the front of the vehicle highlighting the position of the pedestrian
models. The image to the left shows a front-on view of the vehicle. The image to the centre shows a top-down view.
The image to the right shows the view from the driver’s eyes through the windscreen.
Figure 4 shows that the pedestrians can be between 0.7m and 1.2m from the front of this test vehicle
without being visible to the driver. Thus from the tops of the heads of the pedestrians to the front of the cab
is a blind spot for the driver when looking through the windows. The field of view to the front of the vehicle

6
is also assessed for indirect vision through the mirrors. Figure 5 shows that whilst the three pedestrians are
not visible to the driver when stood in these locations, at least part of all three would be visible in the front
Class VI mirror.
Figure 5. The indirect field of view analysis to the front of the vehicle highlighting the position of the pedestrian
models. The blue projection represents the volume of space visible in the Class VI mirror.
These assessments are repeated to the passenger (left) and driver (right) sides of the vehicle with cyclist
models. The assessments are designed to represent a cyclist moving in the same direction as the vehicle to
either side, or stationary at a junction or in a queue of traffic. The same basic approach is taken for the field
of view assessment to the side, where the cyclists are moved away from vehicle to the furthest point at
which they are not visible to the driver through the windows (Figure 6 and Figure 7).
Figure 6. The direct field of view analysis to the left (passenger side) of the vehicle highlighting the position of the
cyclist models. The image to the left shows a side view of the vehicle. The image to the right shows a top-down
view.

7
Figure 7. The direct field of view analysis to the right (driver side) of the vehicle highlighting the position of the cyclist
models. The image to the left shows a side view of the vehicle. The image to the right shows a top-down view.
6. METHODOLOGY: MODELLING 360 DEGREE VISIBILITY
To support the scenario analysis a final assessment evaluates vision for 360 degrees around the vehicle by
determining the FOV area. The volumetric projections are trimmed to the surface of a sphere centred at the
driver’s eye point. Each projection then creates an area of visibility on the spherical surface. The visual
result is much like a traditional map of the Earth with the areas of visibility equivalent to land and blind spots
equivalent to the sea (see Figure 8). The area of these projections are then calculated to provide an
objective measure of field of view in m2. The advantage of this approach when compared to other 2D
projections such as those on the ground is that the projection surface is always at right-angles to the eye, so
any distortion is minimised. For the analysis of field of view in which the primary concern is other road users,
the benefit of particularly tall windows that provide a view well above the driver’s head are of less interest.
Therefore these FOV area projections are also used in a form that trims the areas to a specified height above
the driver’s eye point (see Figure 8).
Figure 8. Spherical projections of the field of view. The image to the left shows the projected volume trimmed to the
surface of a sphere centred on the driver’s eye point. The image to the right shows the resulting spherical areas for
the windscreen and parts of the passenger side window.

8
A key use of this analysis technique is in the differentiation between vehicle makes and models in specific
scenarios. For example in Figure 13 the results are presented for the Low Entry cab designs for the distance
away at which VRUs can be hidden from the driver. Figure 13 illustrates that all LEC designs can enable all
VRUs to be seen. The use of the spherical projection results allows the LEC designs to be further analysed,
showing which of the five has the best direct vision capability.
7. METHODOLOGY: MODELLING VEHICLES AND DRIVER POSTURE
The assessment techniques described in the previous section require accurate models of the vehicles that
are being analysed as well as consistent approach to the positioning of the virtual drivers in the DHM system.
Manufacturers generally have detailed CAD data for their vehicle designs but it was found to be impractical
to source all of the required data within the time scales of the project. The vehicles were therefore digitised
with interior and exterior data captured using a 3D scanning system that allowed the vehicles to be
modelled.
The modelling of the driver posture is a crucial stage in the analysis techniques described in the previous
section. The projection techniques used to identify the size and location of blind spots around the vehicle use
the eye point of the driver as the starting point. The definition of the driver posture and the subsequent eye
point was the subject of research during the initial phases of the project. An approach was defined which
allowed the consistent location of the eye point for a range of driver sizes in the truck cabs using a dataset
that has been produced for this purpose (Reed, 2005). This process was supported by data provided by each
vehicle manufacturer that described the seat adjustability range for each vehicle cab design.
8. METHODOLOGY: SELECTING THE VEHICLES FOR THE ANALYSIS
With the aim of the project being defined as the analysis of the most sold vehicles that are on the UK roads,
vehicle registration data was sourced from the Society of Motor Manufacturers and Traders. These data
allowed the most sold vehicle makes and models to be identified. In addition, for each model type the range
of vehicle specifications for variables such as tyre size, axle configuration, suspension type and engine size
result in a large range of potential cab heights for each vehicle model. Consultation with manufacturers
defined an approach in which the cab height of the ‘most sold’ configurations for each vehicle model were
created. This has benefits in terms of simulating the most common vehicles on the road, but does not
explore the vehicles with the minimum and maximum mounting heights for the cab as these configurations
are rarer. This pragmatic approach was deemed appropriate by all stake holders in the project. The range of
vehicles that were analysed included low entry cab (LEC) designs, vehicles used for the distribution of goods
within city centres (Category N3), vehicles used for the transportation of materials associated with the
construction industry with specific off-road specifications (Category N3G), and vehicles used for long distance
haulage (Category N3). The vehicles selected for the analysis can be seen in Figure 9, which shows the digital
models that were created by the research team.

9
Figure 9. Images of the vehicle makes and models that were produced during the project
9. RESULTS FOR THE VRU ANALYSIS FOR DIRECT VISION THROUGH WINDOWS
The following section shows the results for the analysis that was performed on the size of the direct vision
blind spots which are located to the sides and front of the vehicle. The images in Figure 10, Figure 11 and
Figure 12 show top-down views of each vehicle that was included in the analysis, along with objects that
represent cyclists to the left and right of the cab, and pedestrians in front of the cab, as described above.
These figures have been grouped by vehicle category to allow direct comparison within each category.
The representations of cyclists and pedestrians which have been coloured red show the distance away from
the vehicle at which they can be obscured from the direct vision of the driver through the windows of the
vehicle. The cyclists and pedestrians that are coloured green show that they can be directly adjacent to the

10
side or front of vehicle and still be visible to the driver of the vehicle through the windows. It should be noted
that the driver that was used for this assessment represents an average sized UK male driver, and that the
cyclists and pedestrian models were also of this size. Therefore it is possible for smaller people to be hidden
from the driver’s view at larger distances than shown in the images in Figure 10, Figure 11 and Figure 12.
Equally a taller, or smaller driver could increase or decrease the distance at which the VRUs could be hidden.
The aim is to perform a consistent test across all vehicles which allows a comparison of the ability of the
driver to see vulnerable road users in different locations.
Construction variants (Category N3G)
MAN TGS N3G DAF CF N3G Scania P N3G
Volvo FM N3G Mercedes Arocs Figure 10. Illustrations of the cyclist and pedestrian models at the maximum distance at which they can be fully
obscured from the driver of the Construction vehicles
Distribution variants (Category N3)
MAN TGS N3 DAF CF N3 Scania P N3
Volvo FM N3 Mercedes Antos N3 Figure 11. Illustrations of the cyclist and pedestrian models at the maximum distance at which they can be fully
obscured from the driver of the distribution vehicles
1m 1m 1m
1m 1m
1m 1m 1m
1m 1m

11
Large Distribution (Category N3)
MAN TGX N3 DAF XF Scania R
Volvo FH N3 Mercedes Actros N3 Figure 12. Illustrations of the cyclist and pedestrian models at the maximum distance at which they can be fully
obscured from the driver of the large distribution vehicles
Low entry cabs (Category N3)
Dennis Eagle Elite LEC Scania LEC N3 Mercedes Econic LEC
Volvo FE LEC Figure 13. Illustrations of the cyclist and pedestrian models at the maximum distance at which they can be fully
obscured from the driver of the large low entry cab vehicles
1m 1m 1m
1m 1m
1m 1m 1m
1m

12
The graphs shown in Figure 14 and Figure 15 show how far away a cyclist can get from the passenger side of
the assessed vehicles without being visible to the driver using direct vision through the windows.
Figure 14. Graph showing the distance in metres from the side of the cab to the passenger side rear cyclist
Figure 15. Graph showing the distance in metres from the side of the cab to the passenger side front cyclist
-1 -1 -1 -1 -1
186 300526
848
1255 1315 1316 1356 14721766 1827 1951
2218
2592
-500
0
500
1000
1500
2000
2500
3000
LEC
Eco
nic
LEC LE
C
P N
3
FE L
EC
FM N
3
An
tos
N3
FMX
N3
G
CF
N3
FH
P N
3G
Act
ros
Aro
cs N
3G
CF
N3
G R XF
TGS
N3
TGS
N3
G
TGX
DennisMerc-edes
ScaniaScania Volvo Volvo Merc-edes
Volvo DAF Volvo Scania Merc-edes
Merc-edes
DAF Scania DAF MAN MAN MAN
Passenger Side Rear Cyclist Obscuration
-1 -1 -1 -1 -1
230354 359
462
725 744 760 769
1102 1114 11151220 1260
1452
-200
0
200
400
600
800
1000
1200
1400
1600
LEC
Eco
nic
LEC LE
C
P N
3
FE L
EC
CF
N3
FM N
3
An
tos
N3
FMX
N3
G FH
CF
N3
G
TGS
N3
P N
3G
TGS
N3
G
Act
ros
Aro
cs N
3G
TGX R XF
DennisMerc-edes
ScaniaScania Volvo DAF Volvo Merc-edes
Volvo Volvo DAF MAN Scania MAN Merc-edes
Merc-edes
MAN Scania DAF
Passenger Side Front Cyclist Obscuration

13
The graphs shown in Figure 16, Figure 17 and Figure 18 show how far away a pedestrian can get from the
front of the assessed vehicles without being visible to the driver using direct vision through the windows.
Figure 16. Graph showing the distance in metres from the front of the cab to the left pedestrian
Figure 17. Graph showing the distance in metres from the front of the cab to the middle pedestrian
-1 -1 -1 -1 -1 -1
40124 154
219295
463546
652749 751 786 843
962
-200
0
200
400
600
800
1000
1200
LEC
Eco
nic
LEC LE
C
P N
3
FE L
EC
FM N
3
An
tos
N3
FMX
N3
G
CF
N3
P N
3G R
CF
N3
G
TGS
N3
FH
Act
ros
Aro
cs N
3G
TGS
N3
G
TGX XF
DennisMerc-edes
ScaniaScania Volvo Volvo Merc-edes
Volvo DAF ScaniaScania DAF MAN Volvo Merc-edes
Merc-edes
MAN MAN DAF
Front Left Pedestrian Obscuration
-1 -1 -1 -1 -1 -1
071
144224
391 429 432
613 621 623 624 647
789
-1000
100200300400500600700800900
LEC
Eco
nic
LEC LE
C
P N
3
FE L
EC
FM N
3
An
tos
N3
FMX
N3
G
CF
N3
P N
3G R
CF
N3
G XF
TGS
N3
FH
Aro
cs N
3G
Act
ros
TGX
TGS
N3
G
DennisMerc-edes
ScaniaScania Volvo Volvo Merc-edes
Volvo DAF ScaniaScania DAF DAF MAN Volvo Merc-edes
Merc-edes
MAN MAN
Front Middle Pedestrian Obscuration

14
Figure 18. Graph showing the distance in metres from the front of the cab to the right pedestrian
10. RESULTS FOR THE VRU ANALYSIS FOR INDIRECT VISION THROUGH MIRRORS
The results for the visibility of the cyclist and pedestrian VRUs through the mirrors indicates that out of the
133 combinations of vehicle cabs and VRU location only three VRUs were able to be completely hidden from
the driver using both direct and indirect vision. This is based upon the assumption that if there is any
intersection of the cyclist or pedestrian VRUs with the projection of the volume of space that is visible to the
driver through a mirror, then they can be seen. This is discussed further in the discussion of the results
below.
11. RESULTS FOR THE FIELD OF VIEW AREA
The graphs shown in Figure 19, Figure 20, Figure 21 and Figure 22 show the projected area of the FOV for
various window combinations.
-1 -1 -1 -1 -1
95 163 191
447 453622
751 781
1034 1084 1122 11401296
1404
-2000
200400600800
1000120014001600
LEC
Eco
nic
LEC LE
C
P N
3
FE L
EC
An
tos
N3
CF
N3
FM N
3
FMX
N3
G
CF
N3
G XF
P N
3G R
Aro
cs N
3G
Act
ros
TGS
N3
TGX
TGS
N3
G FH
DennisMerc-edes
ScaniaScania Volvo Merc-edes
DAF Volvo Volvo DAF DAF ScaniaScania Merc-edes
Merc-edes
MAN MAN MAN Volvo
Front Right Pedestrian Obscuration

15
Figure 19. Area Projection: Total Window Area - graph showing the area in square metres for the projection of all
windows
Figure 20. Area Projection: Clipped Window Area - graph showing the area in square metres for the projection of all
windows clipped to a plane 7° up from the horizontal
Figure 21. Area Projection: Passenger Door Windows(s) Area - graph showing the area in square metres for the
projection of all windows in the passenger door area, clipped to a plane 7° up from the horizontal
166.7 178.04 204.29 204.9 206.95 208.41 216.8 216.98 224.71 245.02 248.37
329.32 342.71
050
100150200250300350400
P N
3 /
N3
G
An
tos
N3
/ A
rocs
N3
G /
Act
ros
R
FE L
EC
TGX XF
FH
FM N
3 /
FM
X N
3G
LEC
TGS
N3
/ N
3G
CF
N3
/ N
3G
LEC
Eco
nic
LEC
Scania Mercedes Scania Volvo MAN DAF Volvo Volvo Scania MAN DAF Dennis Mercedes
Total Window Area
139.07 152.59 161.45 163.65 163.69 165.77 165.81 178.56 182.94 183.92 190.25 191.95 203.95
0
50
100
150
200
250
P N
3 /
N3
G XF
FE L
EC
TGX
An
tos
N3
/ A
rocs
N3
G /
Act
ros
R
CF
N3
/ N
3G
LEC
TGS
N3
/ N
3G
FM N
3 /
FM
X N
3G
Eco
nic
LEC FH LE
C
Scania DAF Volvo MAN Mercedes Scania DAF Scania MAN Volvo Mercedes Volvo Dennis
Clipped Window Area
9.96 10.2 10.59 11.17 11.77 11.85 12.64 12.64 12.83 12.8414.21 15.31
17.14
02468
1012141618
FM N
3 /
FM
X N
3G XF
TGX
CF
N3
/ N
3G
FE L
EC LEC
P N
3 /
N3
G R
TGS
N3
/ N
3G FH
An
tos
N3
/ A
rocs
N3
G /
Act
ros LE
C
Eco
nic
LEC
Volvo DAF MAN DAF Volvo Scania Scania Scania MAN Volvo Mercedes Dennis Mercedes
Passenger Door Window(s) Area

16
Figure 22. Area Projection: Windscreen Area - graph showing the area in square metres for the projection of the
windscreen clipped to a plane 7° up from the horizontal
12. DISCUSSION OF THE RESULTS
1.1. DISCUSSION OF THE DIRECT VISION RESULTS – PASSENGER SIDE CYCLIST VISIBILITY
The LEC cab designs all perform very well in this assessment such that cyclists cannot be hidden from the
view of the driver in the assessed locations. This is illustrated in Figure 13 where the cyclists can be touching
the cab and would still be visible to the driver. The standard cabs show a large variation in performance,
from more or less touching the cab, to nearly 3m away (see Figure 10, Figure 11 and Figure 12). It is
interesting to note that the order of vehicles in Figure 14 and Figure 15 is not the same even though the
assessments are similar. For example, the MAN TGX performs significantly better for visibility of the front
cyclist than for the rear. The reason for this can be seen in the design of the window on the MAN TGX as
shown in Figure 25Figure 27 where the lower edge of the window drops towards the front providing greater
visibility of the driving environment in that area. In addition it is also easy to see the impact of height of the
vehicle, where the N3G construction variants (Figure 10) that are typically higher than the N3 distribution
variants (Figure 11) but with the same cab, show consistently higher values and thus larger blind spots.
1.2. DISCUSSION OF THE DIRECT VISION RESULTS – FRONT PEDESTRIAN VISIBILITY
As with the Passenger side cyclist visibility, the LEC cab designs all perform very well at this assessment such
that pedestrians cannot be hidden from the view of the driver in the assessed locations (see Figure 13). The
variation in performance of the standard cabs is less than that seen for the passenger side cyclists but still
varies from zero to nearly 1.5m away (see Figure 10, Figure 11 and Figure 12). As with the cyclist assessment
the relative order of the vehicles varies between tests. For this assessment is it interesting to note that
visibility to the front right of the cab is typically worse due to obscuration from the steering wheel. As with
the cyclist obscuration tests the height of the vehicle is a critical factor, with N3G construction variants
(Figure 10) showing consistently higher values than the N3 distribution variants (Figure 11).
52.3265.64 67.01 68.38 68.54 68.87 70.84 70.85 71.61 72.66 75.02 79.08 80.54
0102030405060708090
Eco
nic
LEC LE
C XF
TGS
N3
/ N
3G
CF
N3
/ N
3G
TGX R
P N
3 /
N3
G
LEC
FE L
EC
An
tos
N3
/ A
rocs
N3
G /
Act
ros FH
FM N
3 /
FM
X N
3G
Mercedes Dennis DAF MAN DAF MAN Scania Scania Scania Volvo Mercedes Volvo Volvo
Windscreen Area

17
1.3. DISCUSSION OF THE VRU ANALYSIS FOR INDIRECT VISION (USE OF MIRRORS)
On first inspection the indirect vision results indicate that all but three vehicles allow all of the VRU objects
that were tested in the project to be seen through the mirrors. Closer inspection of the results indicates that
often only a small portion of the VRU object can be seen in a mirror, and often at the edge of the mirror. The
curved nature of the mirrors that are currently used on HGVs is defined to allow a larger FOV of the areas
around the vehicle. For example, the Class V which allows the driver to view the side of the passenger door
and the area adjacent to it, has a radius of curvature of approximately 300mm. This produces distorted
images of the objects being viewed. An illustration of the type of view that a driver receives from the mirror
can be seen in Figure 23 which shows a silver car adjacent to the vehicle cab.
Figure 23. The view that a driver has of a Class V ‘Look Down’ mirror showing a silver car adjacent to the cab
Figure 24 shows a number of examples where a small portion of the passenger side cyclist is intersecting with
the volume of space that is visible to the driver through the Class V or Class IV mirrors. The left hand and
middle images show the bottom half of the bicycle wheels being visible in the Class V ‘Look Down’ mirror and
a small portion of the cyclist’s back and helmet being seen in the class IV mirror which is a wide angle mirror
looking rearwards. The right hand image shows that the rear passenger side cyclist is only visible through the
Class IV mirror with a small portion of the upper body of the cyclist being visible. In all three cases shown in
Figure 24 the location of cyclist indicates that the portion of the cyclists visible would be located at the edge
of the mirror, in a similar manner to the car shown in Figure 23.
Figure 24. Examples of small portions of the VRU object intersecting with the volume of space visible through a mirror

18
In all cases shown in Figure 24 the cyclist is not visible to the driver through the windows. This highlights the
difficulty that a driver has in determining if there is a VRU in close proximity to the vehicle. The driver must
be able to use six mirrors to gain awareness and there is a time associated with the viewing of each mirror
and moving the gaze to the mirror. If there is only a small portion of the VRU visible to the driver, in the
distorted edge of the mirror view, then the ability of the driver to recognise the VRU is questionable. In high
work load situations when multiple cyclists and pedestrians are moving round the vehicle in city centre
locations, the task for the driver is difficult. As an example of this, all of the cyclists shown in Figure 25 are
not visible to the driver through the windows, with the eye point being determined by a standard sitting
position (i.e. without leaning to improve the field of view).
Figure 25. The left hand image shows the number and location of cyclists that can be placed around an example
vehicle cab without being seen through direct vison, and the right hand image shows the driver’s view through the
windows

19
1.4. DISCUSSION OF THE COMBINED FOV AREA AND VRU ANALYSES
The dedicated LECs (Dennis and Mercedes Econic) tend to show the largest FOV area values. The LECs based
on standard cabs such as the Scania and the Volvo show variable performance across the assessments shown
in Figure 19, Figure 20, Figure 21 and Figure 22. There are a number of interesting observations that can be
made from the area assessments, especially when considered together with the VRU evaluations.
The FOV area analysis offers a means to differentiate between vehicles that may perform equally well in the
VRU analyses. For example pedestrians and cyclists in the assessed locations cannot be hidden from the
driver’s direct vision in any of the LEC vehicles (Figure 13). However the FOV area analysis shows significant
differences in the FOV available (Figure 19).
To fully understand the impact of vehicle design and configuration on the FOV available to the driver a
combination of the FOV area needs to be understood together with the specific VRU analysis results. In
many ways the results appear relatively predictable. Vehicles such as the Mercedes Econic and Dennis have
large FOV areas and VRU tests show that the cyclists and pedestrians cannot be hidden from direct view in
the locations assessed. Vehicles such as the DAF XF have some of the smallest clipped FOV areas and in the
VRU test show that the distance cyclists and pedestrians can be from the vehicle and still be hidden from the
driver are some of the largest of the vehicles assessed. Thus these results suggest that larger window areas
lead to improved VRU visibility.
However, the DAF XF is towards the middle of the range for total FOV area suggesting that large window
areas are not the complete answer, the FOV needs to be provided in critical areas. This is supported by
examples such as the DAF CF that is in the middle of the range for clipped FOV area but has some of the
smallest distances away from the cab at which the VRUs can be obscured in its N3 configuration. This shows
that whilst the FOV is not the largest it is provided in these critical areas and thus offers reduced blind spots
to direct vision. Equally, the Volvo FM has the smallest passenger door window FOV area and yet exhibits
consistently small distances away from the cab at which the VRUs can be obscured to the passenger side
indicating effective use of the view provided. This is discussed further in Section 1.5.
Further reinforcing the impact of vehicle height, the Mercedes Antos, Arocs, Actros range all share the same
windscreen that provides one of the largest windscreen FOV areas. However the lowest variant, the Antos,
exhibits some of the smallest distances away from the cab at which the VRUs can be obscured, and the
higher variants, the Antos and Actros, exhibit some of the largest distances away from the cab at which the
VRUs can be obscured.
1.5. DISCUSSION OF THE DESIGN FEATURES AND VEHICLE SPECIFICATIONS WHICH
CAUSE THE IDENTIFIED DIRECT VISION BLIND SPOTS
Following the production of the results using the digital human modelling tool, a further analysis was
performed to explore the design features of the different cab designs which have an effect on the distances
at which vulnerable road users can be obscured from the driver’s vision.
This involved performing comparisons and statistical tests between the data associated with the following
design features;

20
The height of the driver’s eye point above the ground for each vehicle
The distance at which the passenger side rear most cyclist can be hidden from the driver using direct
vision
The distance at which the middle pedestrian in front of the cab can be hidden from the direct using
direct vision
The widths of the cabs
The first test performed compared the height of the driver’s eye point above the ground, and therefore the
height of the vehicle cab above the ground, to the distance away that the passenger side cyclist can be
hidden from the driver. The graph in Figure 26 illustrates the two measures being plotted for each vehicle
that was tested with a standard specification, low entry cabs were excluded. In general, the graph shows that
the higher the vehicle is above the ground the further away that the cyclist can be hidden. This trend was
shown to be statistically significant by performing a test for correlation which showed a strong correlation.
Figure 26. Plotting the maximum distance at which the near side rear cyclist can be obscured from the driver, against
the driver eye height above the ground
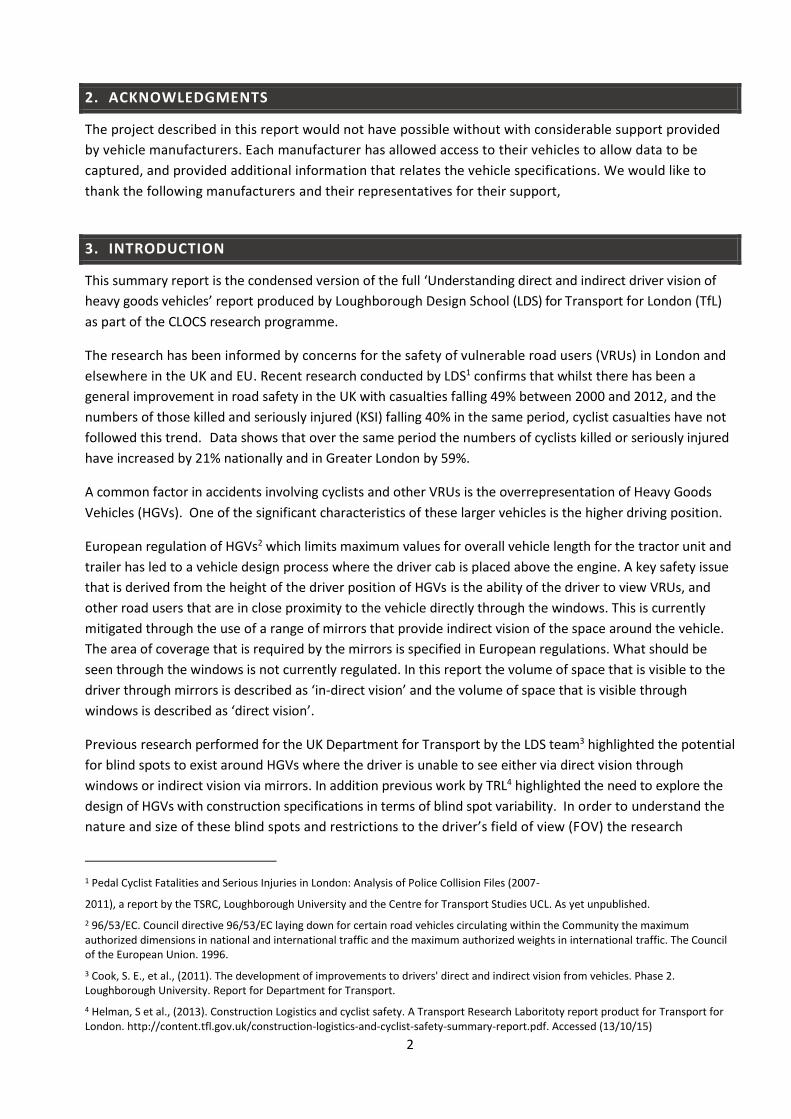
There were however some vehicles which demonstrated variability from this trend as highlighted by their
distance away from the blue trend line in the graph shown in Figure 26. As an example of this when
comparing the Scania R N3 and the MAN TGX N3, the MAN TGX has a lower driver eye height above the
ground than the Scania R, but the cyclist is hidden further away from the vehicle when compared to the
Scania R. A comparison of the design variables shows that this can be attributed to the window design,
where the Scania R has a lower window bottom edge in relation to the eye position in the cab. In effect,
when the looking through the eyes of the driver, the bottom edge of the window would appear lower in the
Scania R due differences in the profile of the window bottom edge as shown in Figure 27 which shows the
driver’s eye view of the passenger window for both vehicles.
Plotting the Driver's eye height against the maximum distance away from the vehicle that the rear passenger side cyclist can be
hidden from the driver
21
Figure 27. Illustrations of the comparison between the Scania R and the MAN TGX where the eye heights of the
drivers are similar, but the cyclist can be hidden further away from the vehicle cab
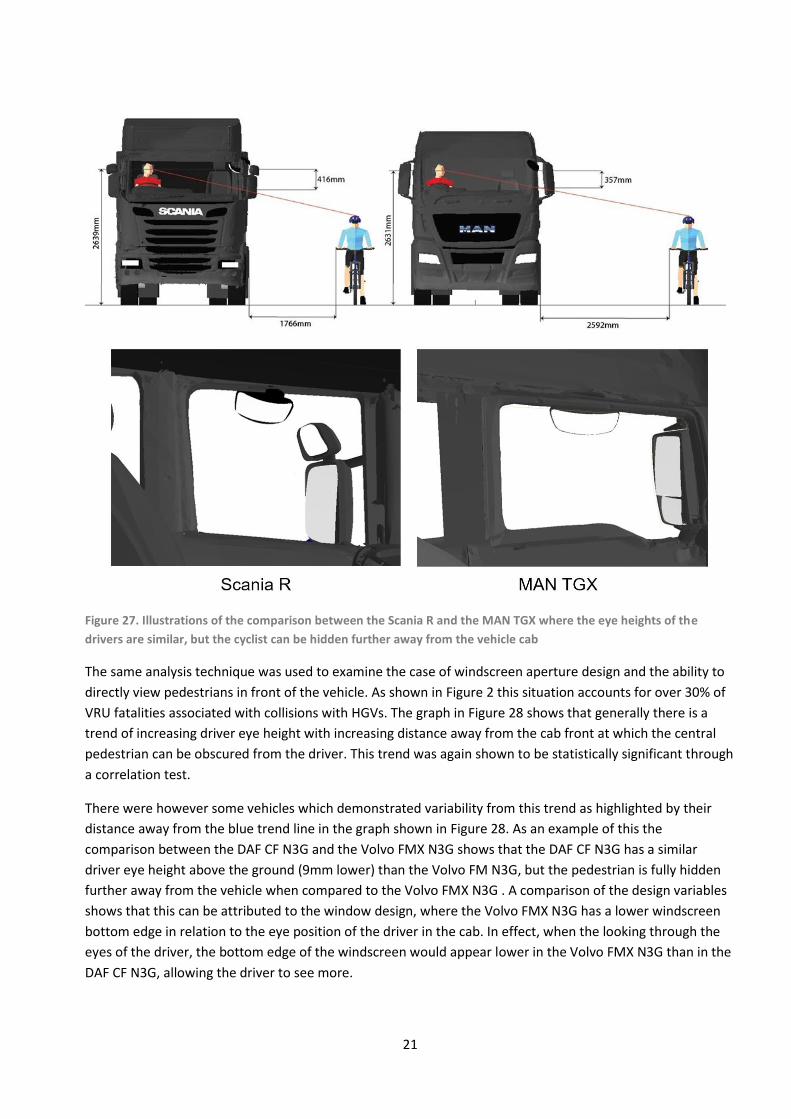
The same analysis technique was used to examine the case of windscreen aperture design and the ability to
directly view pedestrians in front of the vehicle. As shown in Figure 2 this situation accounts for over 30% of
VRU fatalities associated with collisions with HGVs. The graph in Figure 28 shows that generally there is a
trend of increasing driver eye height with increasing distance away from the cab front at which the central
pedestrian can be obscured from the driver. This trend was again shown to be statistically significant through
a correlation test.
There were however some vehicles which demonstrated variability from this trend as highlighted by their
distance away from the blue trend line in the graph shown in Figure 28. As an example of this the
comparison between the DAF CF N3G and the Volvo FMX N3G shows that the DAF CF N3G has a similar
driver eye height above the ground (9mm lower) than the Volvo FM N3G, but the pedestrian is fully hidden
further away from the vehicle when compared to the Volvo FMX N3G . A comparison of the design variables
shows that this can be attributed to the window design, where the Volvo FMX N3G has a lower windscreen
bottom edge in relation to the eye position of the driver in the cab. In effect, when the looking through the
eyes of the driver, the bottom edge of the windscreen would appear lower in the Volvo FMX N3G than in the
DAF CF N3G, allowing the driver to see more.

22
Figure 28. Plotting the max. distance at which the central pedestrian model can be obscured from the driver, against
the driver eye height above the ground
Figure 29. Illustrations of the comparison between the DAF CF N3G and the VOLVO FMX N3G where the eye heights
of the drivers are similar, but the pedestrian can be hidden further away from the vehicle cab with the DAF CF N3G
1.1.1. SUMMARY OF THE DESIGN FEATURES AND VEHICLE SPECIFICATIONS WHICH
CAUSE THE IDENTIFIED DIRECT VISION BLIND SPOTS
The results shown in the graphs in Figure 26 and Figure 28, and the statistical correlation tests illustrate that
in general it is the driver height above the ground that determines the presence and severity of the direct
vision blind spots. Vehicles with higher driver height above the ground generally have larger direct vision
blind spots. However, the further analysis of the situation for the passenger side rear cyclist, and the central
pedestrian in front of the vehicle illustrate that the specific design of features such the driver seat location,
and the design of window and windscreen apertures can affect the size of blind spots. A key aspect of vehicle
Plotting the Driver's eye height against the maximum distance away from the vehicle that the middle pedestrian can be
hidden from the driver

23
specification which affects the overall height of the cab above the ground is the intended purpose for the
vehicle. The research has shown that vehicles which are specified for the activity of distribution of goods (N3
configuration) have lower cabs than the same vehicle which has been specified for construction use (N3G
configuration). This is highlighted by the following key messages.
1. The N3G cabs assessed in the project are on average 32% higher than the same cab design in the N3
configuration
2. For the N3G cabs the distance away that a pedestrian in front of the vehicle can be hidden from the
driver’s view is on average nearly three times greater than the N3 configurations
3. For the N3G cabs the distance away that a cyclist at the passenger side of the vehicle can be hidden
is on average more than two times greater than the N3 configurations
Figure 30 shows examples of the height difference between the ‘most sold’ configurations of distribution and
construction vehicles produced by Mercedes and Scania. The effect of the height difference is demonstrated
by the distance away that a cyclist to the passenger side of the cab can be hidden from the driver’s direct
vision.
Figure 30. Illustrating the height difference between distribution and constriction variants of the same cab design,
and the distance away that a cyclist to the passenger side of the vehicle can be hidden from the driver’s direct vision

24
13. CONCLUSIONS
The project has provided objective comparisons of blind spot size between 19 vehicle models which are the
top selling in the UK. This has allowed the key design features for the cabs to be analysed to determine what
causes the size and location of blind spots. The largest blinds spots identified were associated with direct
vision from the cabs, and the project has shown considerable variability in the size of direct vision blind spots
between vehicles which has been shown to be associated with the height of the cab above the ground. It is
clear that the Low Entry Cab designs allow improved direct vison when compared to the standard cab
designs. The analysis of the blind spots associated with mirror use highlighted that in all but three cases, the
pedestrian and cyclist VRUs where at least partially visible in the mirrors. The project has highlighted the
need for an improved understanding of the strategies used by drivers when interacting with multiple mirrors,
and their ability to recognise partial views of VRUs in curved mirrors.
The analysis of specific vehicle designs has highlighted cases in which the design of window and windscreen
apertures can reduce the size of blinds spots. These findings provide recommendations for the improved
design of vehicle cabs that can be implemented by vehicle designers.
The work has clearly demonstrated that vehicles which are specified for the construction industry (N3G
configurations) have cabs which are higher above the ground that vehicles which are specified for the
distribution industry (N3 configurations). The increased mounting height of construction vehicle cabs
produces larger direct vision blind spots which are a potential contributory factor to accidents between
construction vehicles and vulnerable road users.
In addition the design of window apertures is not regulated by European Commission standards. That is,
there are no criteria by which the design of windows are tested to ensure that they are allowing suitable
direct vision of the world outside of the cab. It is only the indirect vision available to the driver through
mirrors that is regulated. Therefore further work is required in establishing a direct vision standard that
provides guidelines for the ability of the driver to be able to see VRUs and other objects around the vehicle.
This is seen as a key mechanism for improving future vehicle designs.