Embed Size (px)
Citation preview
Understanding demographic trends: Implications for Extension
Bridging the Culture Divide:Inclusive Extension Programming for LatinosOctober 14-15, 2008
Acknowledgement The presenters wish to thank Steve Murdock, Director –
U.S. Census Bureau, for permission to include slides from his presentation “Population Change and Immigration in the United States: Implications for Economic and Socioeconomic Change and the 2010 Census” given at Joint Council of Extension Professionals Galaxy Conference held in Indianapolis, IN, September 16, 2008.
Overview Population trends Demographics
Racial/Ethnic DiversityAge
Role of immigration Implications for Socioeconomic
Development
Overview Population trends Demographics
Racial/Ethnic DiversityAge
Role of immigration Implications for Socioeconomic
Development
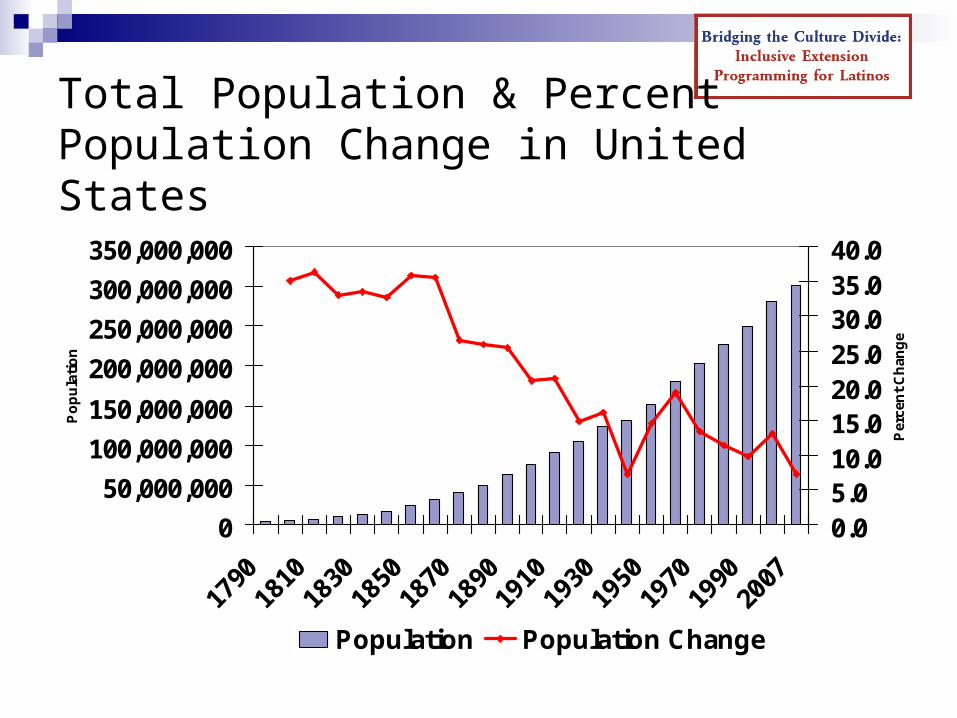
Total Population & Percent Population Change in United States
0
50,000,000
100,000,000
150,000,000
200,000,000
250,000,000
300,000,000
350,000,000
1790
1810
1830
1850
1870
1890
1910
1930
1950
1970
1990
2007
Po
pu
lati
on
0.05.010.015.020.025.030.035.040.0
Per
cen
t C
han
ge
Population Population Change
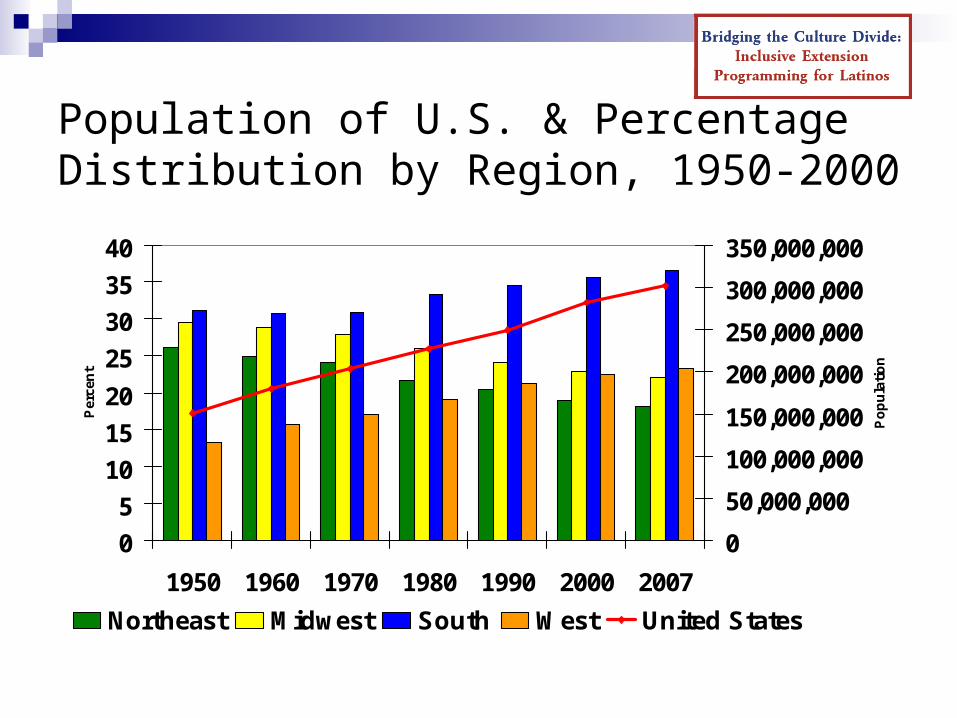
Population of U.S. & Percentage Distribution by Region, 1950-2000
0
5
10
15
20
25
30
35
40
1950 1960 1970 1980 1990 2000 2007
Per
cen
t
0
50,000,000
100,000,000
150,000,000
200,000,000
250,000,000
300,000,000
350,000,000
Po
pu
lati
on
Northeast Midwest South West United States
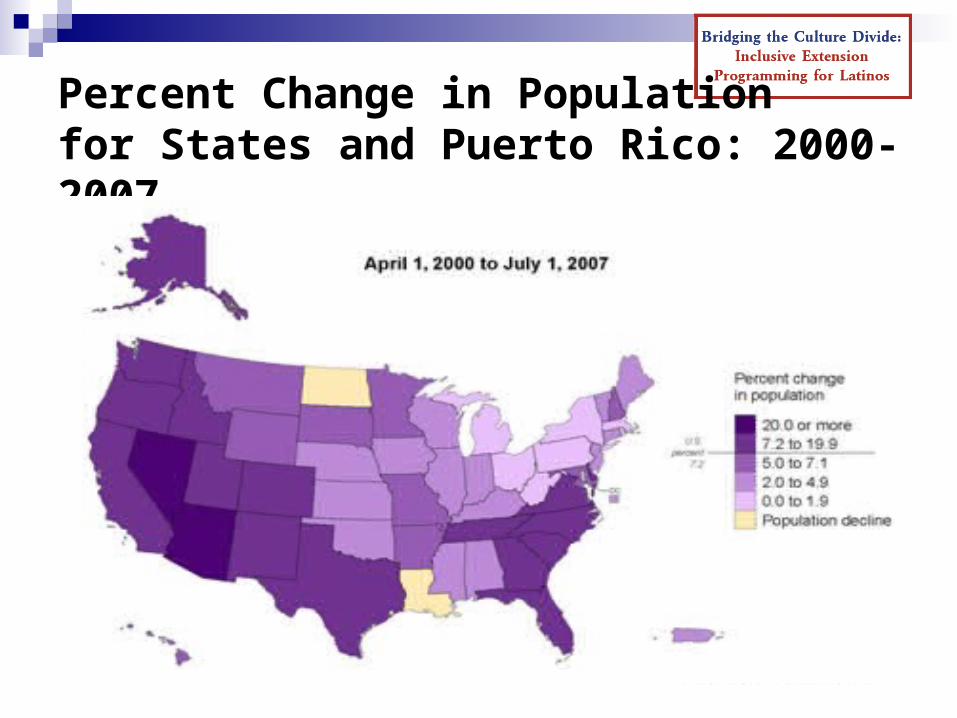
Percent Change in Population for States and Puerto Rico: 2000-2007
Overview Population trends Demographics
Racial/Ethnic DiversityAge
Role of immigration Implications for Socioeconomic
Development
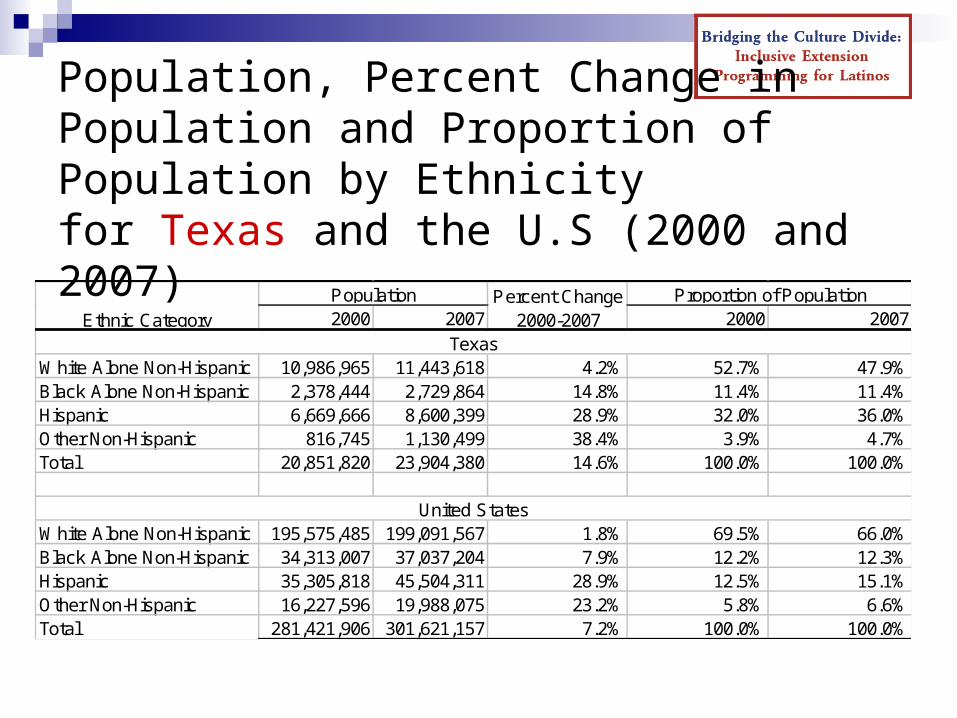
Population, Percent Change in Population and Proportion of Population by Ethnicity for Texas and the U.S (2000 and 2007)
2000 2007 2000 2007
White Alone Non-Hispanic 10,986,965 11,443,618 4.2% 52.7% 47.9%Black Alone Non-Hispanic 2,378,444 2,729,864 14.8% 11.4% 11.4%Hispanic 6,669,666 8,600,399 28.9% 32.0% 36.0%Other Non-Hispanic 816,745 1,130,499 38.4% 3.9% 4.7%Total 20,851,820 23,904,380 14.6% 100.0% 100.0%
White Alone Non-Hispanic 195,575,485 199,091,567 1.8% 69.5% 66.0%Black Alone Non-Hispanic 34,313,007 37,037,204 7.9% 12.2% 12.3%Hispanic 35,305,818 45,504,311 28.9% 12.5% 15.1%Other Non-Hispanic 16,227,596 19,988,075 23.2% 5.8% 6.6%Total 281,421,906 301,621,157 7.2% 100.0% 100.0%
Texas
United States
Proportion of PopulationPercent Change 2000-2007Ethnic Category
Population
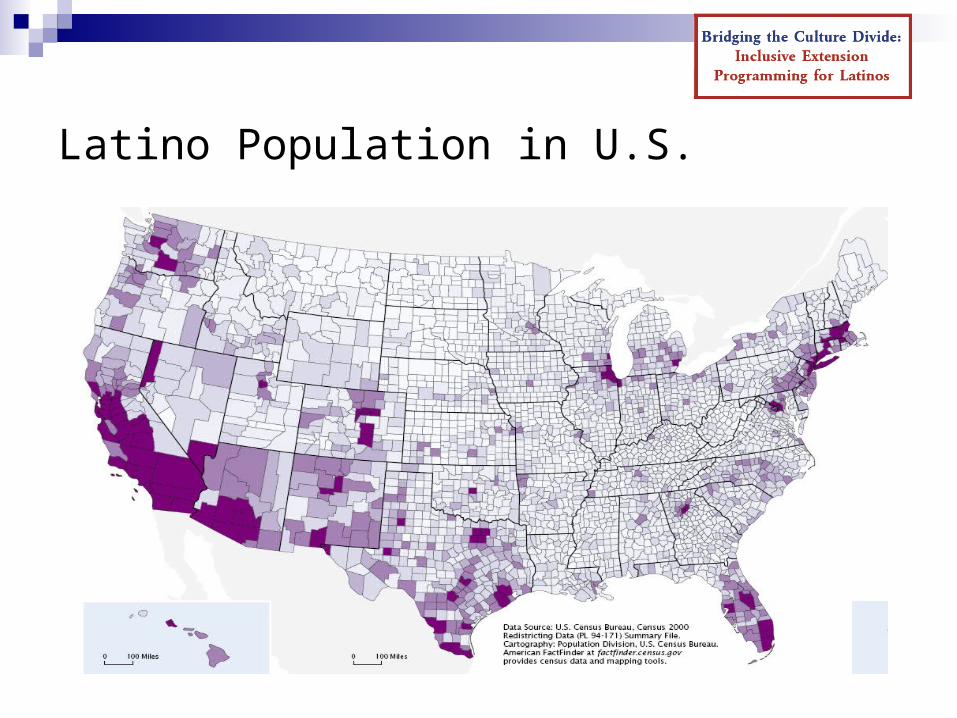
Latino Population in U.S.
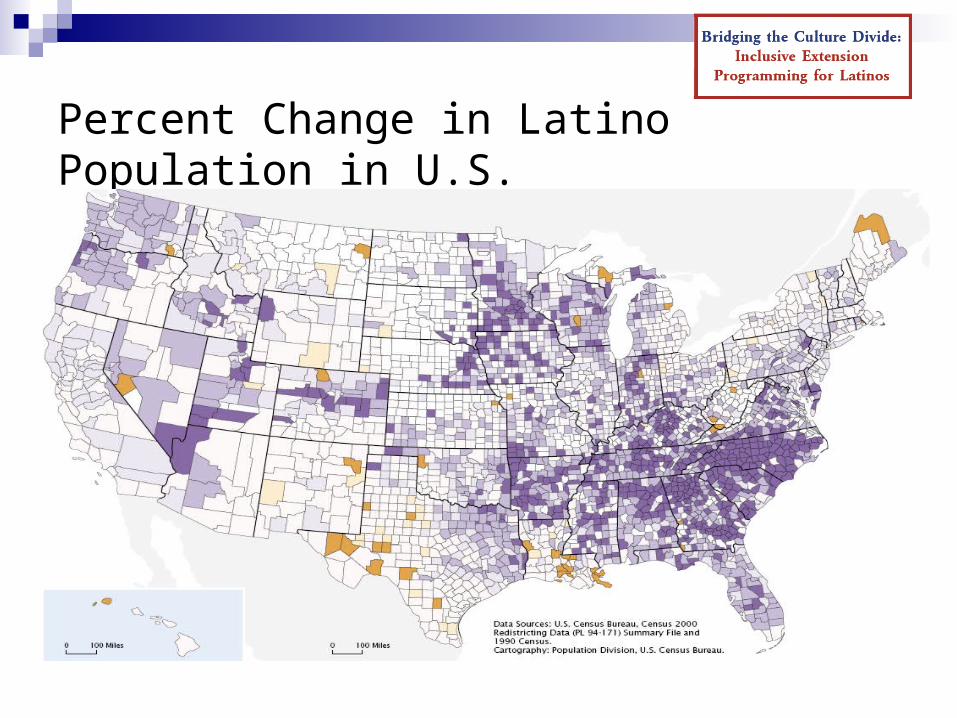
Percent Change in Latino Population in U.S.
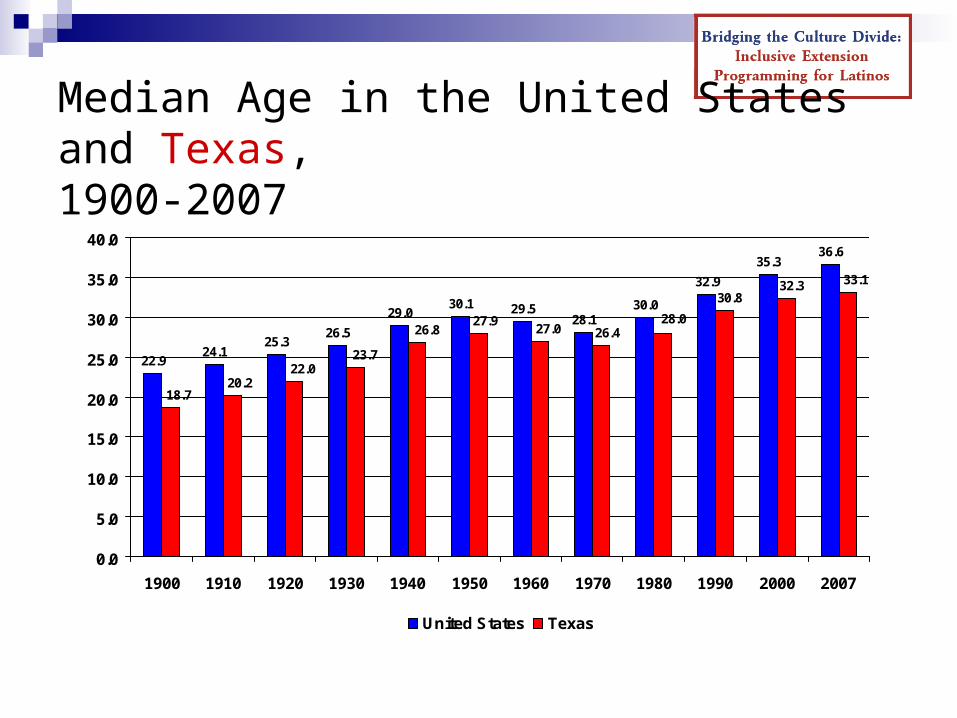
Median Age in the United States and Texas,
1900-2007
22.924.1
25.326.5
29.030.1 29.5
28.130.0
32.9
35.336.6
33.132.330.8
28.026.427.0
27.926.8
23.722.0
20.218.7
0.0
5.0
10.0
15.0
20.0
25.0
30.0
35.0
40.0
1900 1910 1920 1930 1940 1950 1960 1970 1980 1990 2000 2007
United States Texas
Percent Change in Population by Age Group
in the United States and Texas, 1990-2000
13.7
1.55.3
49.4
14.812
21.7
16.3 15.3
60.3
2420.7
<18 18-24 25-44 45-54 55-64 65+
Age Groups
0
10
20
30
40
50
60
70
Percent Change
United States Texas
Percent of U.S. Population By Age Group and Ethnicity, 2000
58
. 4
59
. 9
62
. 8
63
. 1
61
. 1
61
. 9 65
. 2 69 7
1. 9
74
. 2
76
. 6
78
. 3
78
. 5 83
. 6
41
. 6
40
. 1
37
. 2
36
. 9
38
. 9
38
. 1
34
. 8
31
28
. 1
25
. 8
23
. 4
21
. 7
21
. 5
16
. 4
< 5 y
ears
5 to
9 y
ears
10 to
14
year
s
15 to
19
year
s
20 to
24
year
s
25 to
29
year
s
30 to
34
year
s
35 to
39
year
s
40 to
44
year
s
45 to
49
year
s
50 to
54
year
s
55 to
59
year
s
60 to
64
year
s
65 +
yea
rs0
20
40
60
80
100Percent
Anglo Non-anglo
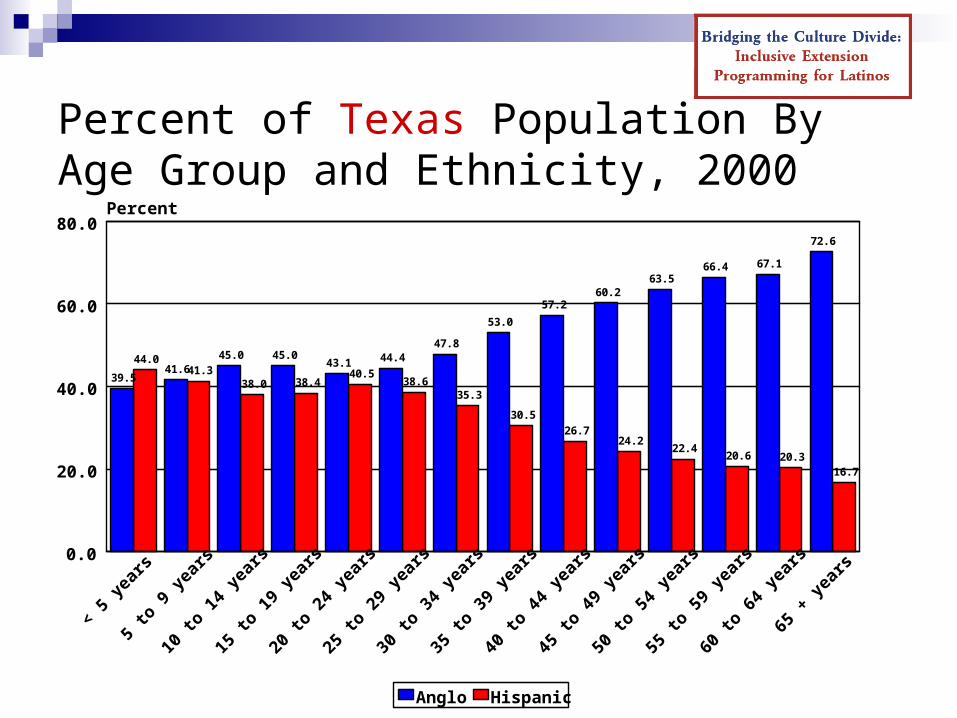
Percent of Texas Population By Age Group and Ethnicity, 2000
39.541.6
45.0 45.043.1 44.4
47.8
53.0
57.260.2
63.566.4 67.1
72.6
44.041.3
38.0 38.440.5
38.635.3
30.526.7
24.222.4
20.6 20.316.7
< 5
year
s
5 to
9 y
ears
10 to
14
year
s
15 to
19
year
s
20 to
24
year
s
25 to
29
year
s
30 to
34
year
s
35 to
39
year
s
40 to
44
year
s
45 to
49
year
s
50 to
54
year
s
55 to
59
year
s
60 to
64
year
s
65 +
yea
rs0.0
20.0
40.0
60.0
80.0Percent
Anglo Hispanic
Overview Population trends Demographics
Racial/Ethnic DiversityAge
Role of immigration Implications for Socioeconomic
Development
Percent of U.S. Population Change Due to Immigration and Natural Increase, 1820 to 2005
1820-301830-401840-501850-601860-701870-801880-90
1890-19001900-101910-201920-301930-401940-501950-601960-701970-801980-90
1990-20002000-2005
Time Period
0% 20% 40% 60% 80% 100%
Percent
Components of ChangeImmigration Natural Increase
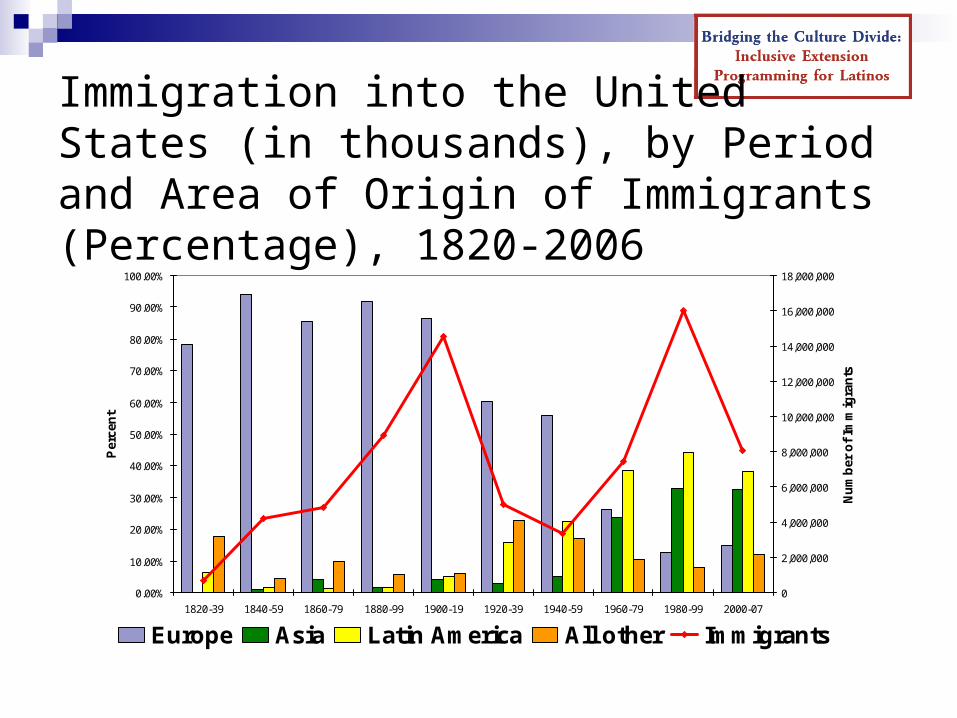
Immigration into the United States (in thousands), by Period and Area of Origin of Immigrants (Percentage), 1820-2006
0.00%
10.00%
20.00%
30.00%
40.00%
50.00%
60.00%
70.00%
80.00%
90.00%
100.00%
1820-39 1840-59 1860-79 1880-99 1900-19 1920-39 1940-59 1960-79 1980-99 2000-07
Per
cen
t
0
2,000,000
4,000,000
6,000,000
8,000,000
10,000,000
12,000,000
14,000,000
16,000,000
18,000,000
Nu
mb
er o
f Im
mig
ran
ts
Europe Asia Latin America All other Immigrants
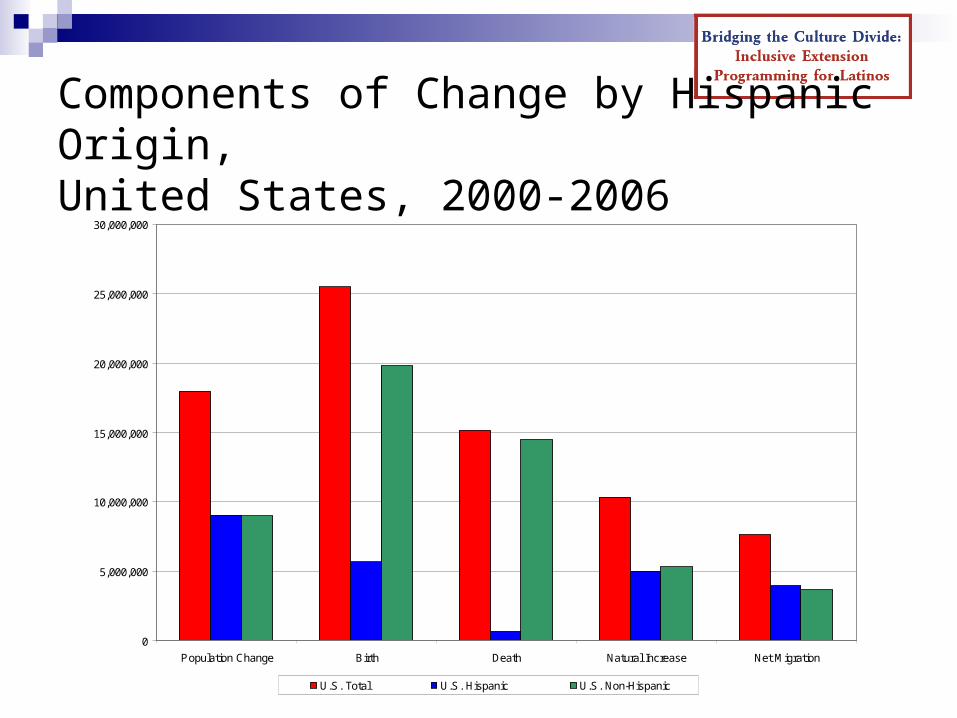
Components of Change by Hispanic Origin, United States, 2000-2006
0
5,000,000
10,000,000
15,000,000
20,000,000
25,000,000
30,000,000
Population Change Birth Death Natural Increase Net Migration
U.S. Total U.S. Hispanic U.S. Non-Hispanic
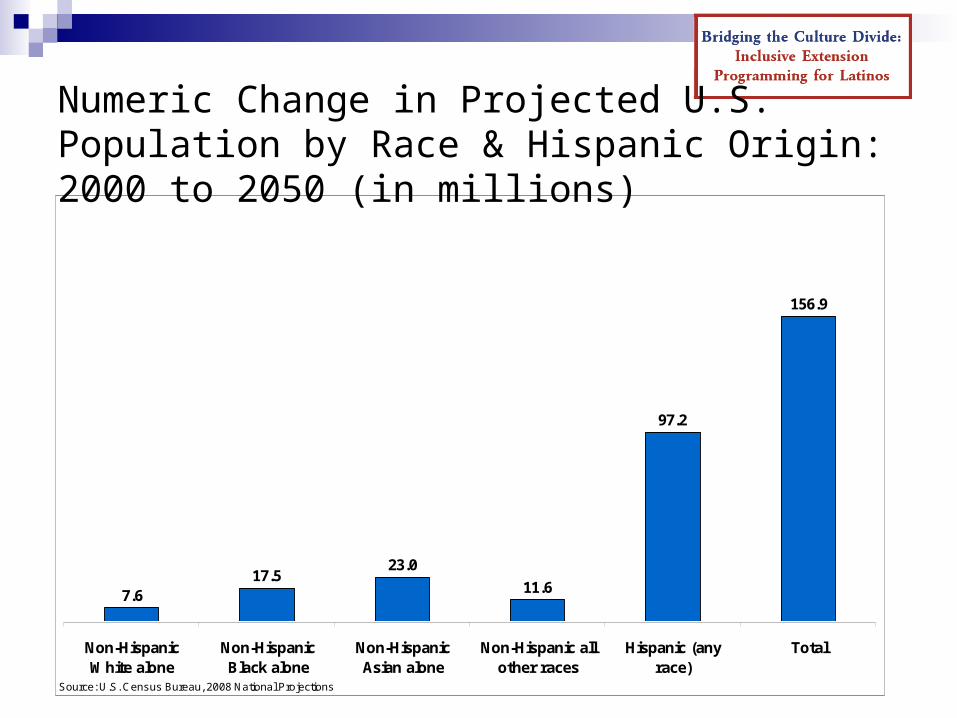
Numeric Change in Projected U.S. Population by Race & Hispanic Origin: 2000 to 2050 (in millions)
7.617.5
23.0
11.6
97.2
156.9
Non-HispanicWhite alone
Non-HispanicBlack alone
Non-HispanicAsian alone
Non-Hispanic allother races
Hispanic (anyrace)
Total
Source: U.S. Census Bureau, 2008 National Projections
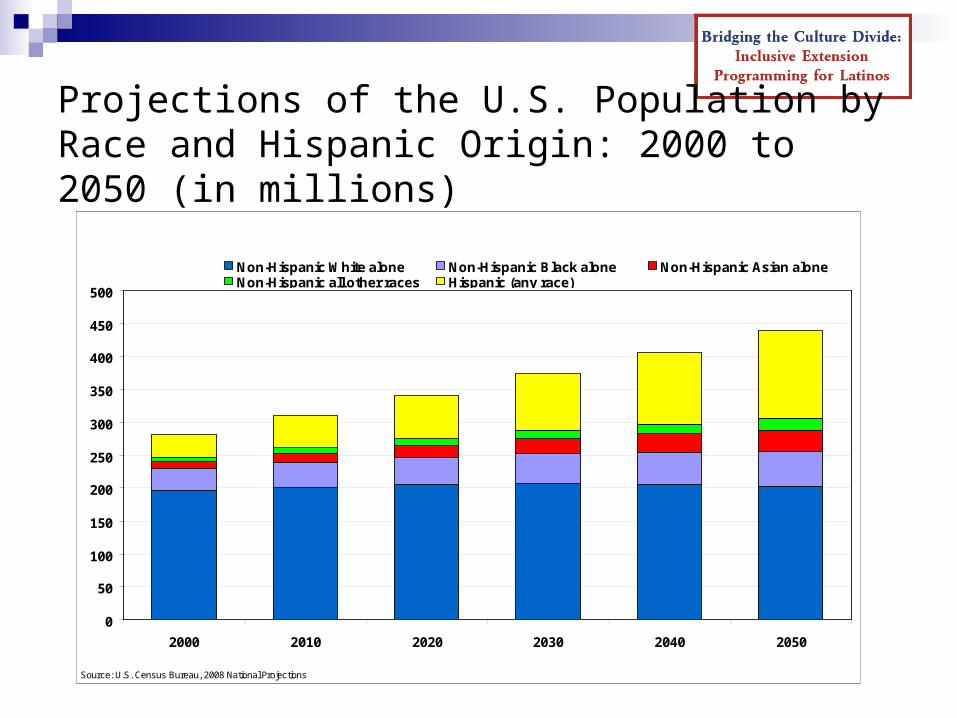
Projections of the U.S. Population by Race and Hispanic Origin: 2000 to 2050 (in millions)
0
50
100
150
200
250
300
350
400
450
500
2000 2010 2020 2030 2040 2050
Non-Hispanic White alone Non-Hispanic Black alone Non-Hispanic Asian aloneNon-Hispanic all other races Hispanic (any race)
Source: U.S. Census Bureau, 2008 National Projections
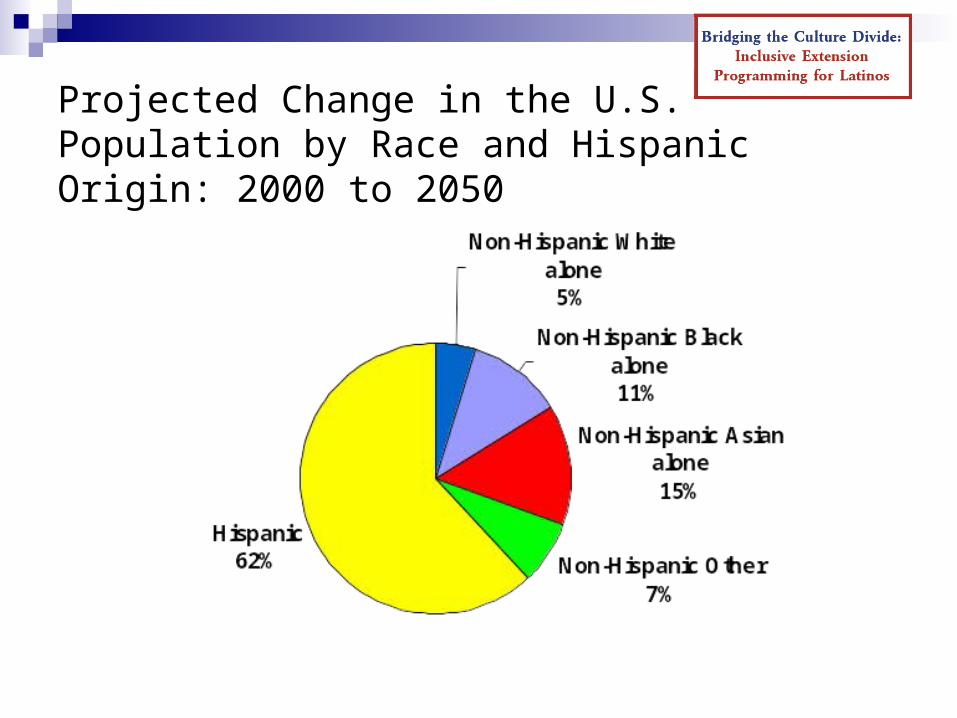
Projected Change in the U.S. Population by Race and Hispanic Origin: 2000 to 2050
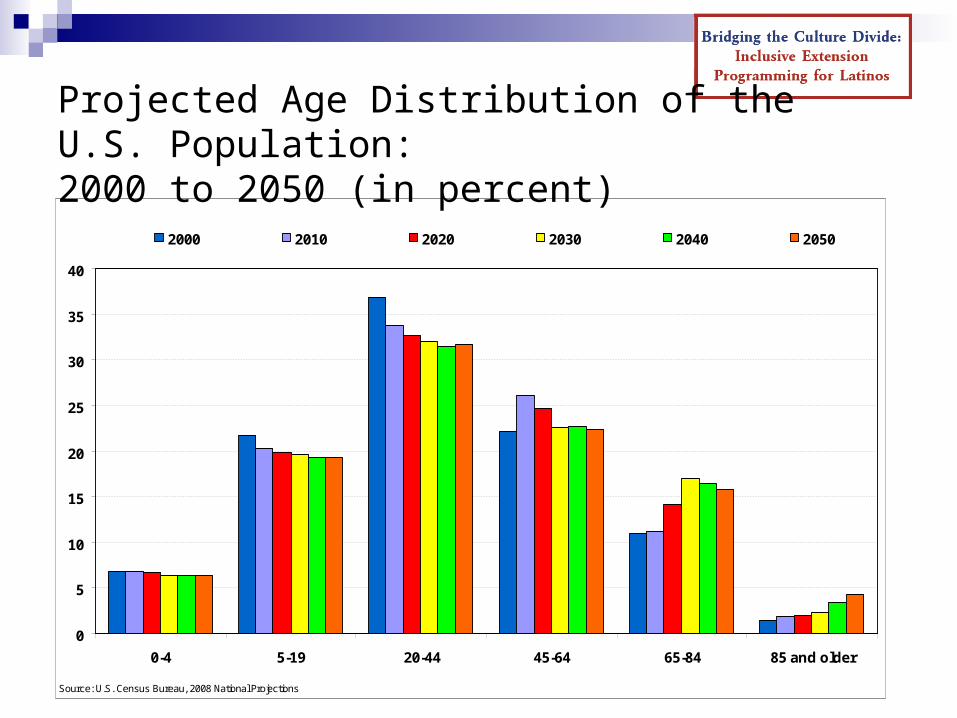
Projected Age Distribution of the U.S. Population: 2000 to 2050 (in percent)
0
5
10
15
20
25
30
35
40
0-4 5-19 20-44 45-64 65-84 85 and older
2000 2010 2020 2030 2040 2050
Source: U.S. Census Bureau, 2008 National Projections
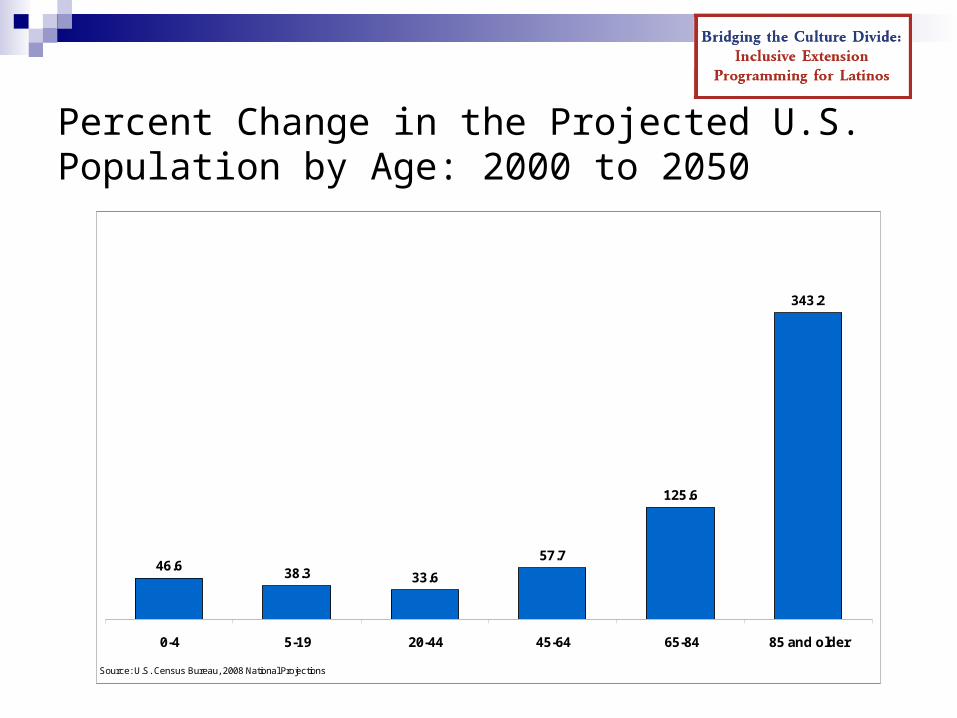
Percent Change in the Projected U.S. Population by Age: 2000 to 2050
46.638.3 33.6
57.7
125.6
343.2
0-4 5-19 20-44 45-64 65-84 85 and older
Source: U.S. Census Bureau, 2008 National Projections
Overview Population trends Demographics
Racial/Ethnic DiversityAge
Role of immigration Implications for Socioeconomic
Development
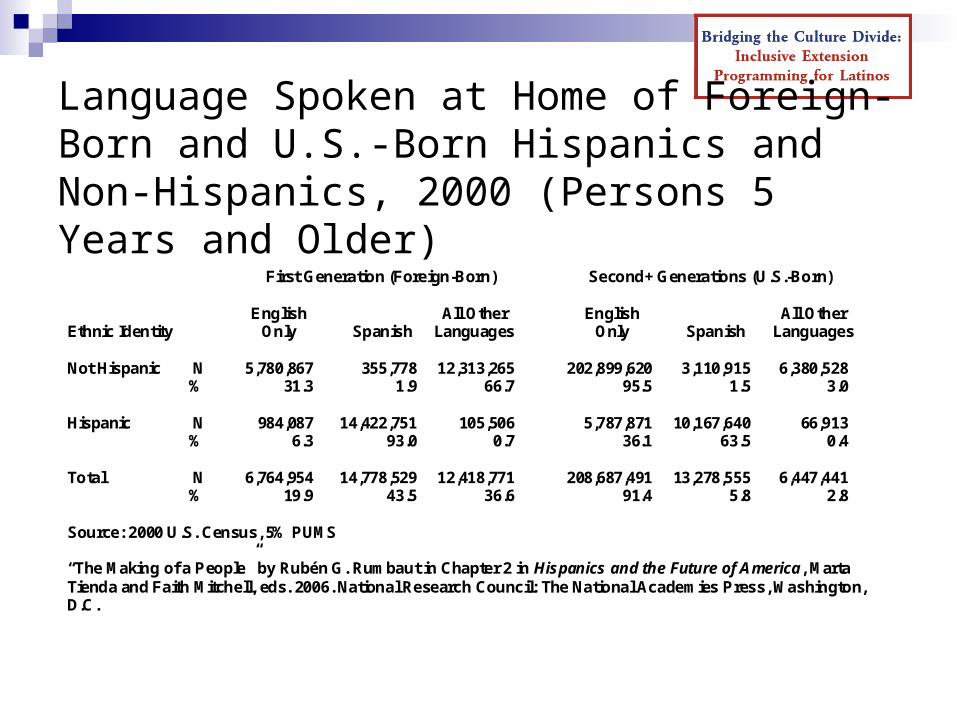
Language Spoken at Home of Foreign-Born and U.S.-Born Hispanics and Non-Hispanics, 2000 (Persons 5 Years and Older)
First Generation (Foreign-Born) Second+ Generations (U.S.-Born)
English All Other English All OtherEthnic Identity Only Spanish Languages Only Spanish Languages
Not Hispanic N 5,780,867 355,778 12,313,265 202,899,620 3,110,915 6,380,528% 31.3 1.9 66.7 95.5 1.5 3.0
Hispanic N 984,087 14,422,751 105,506 5,787,871 10,167,640 66,913% 6.3 93.0 0.7 36.1 63.5 0.4
Total N 6,764,954 14,778,529 12,418,771 208,687,491 13,278,555 6,447,441% 19.9 43.5 36.6 91.4 5.8 2.8
Source: 2000 U.S. Census, 5% PUMS
“The Making of a People” by Rubén G. Rumbaut in Chapter 2 in Hispanics and the Future of America, MartaTienda and Faith Mitchell, eds. 2006. National Research Council: The National Academies Press, Washington,D.C.
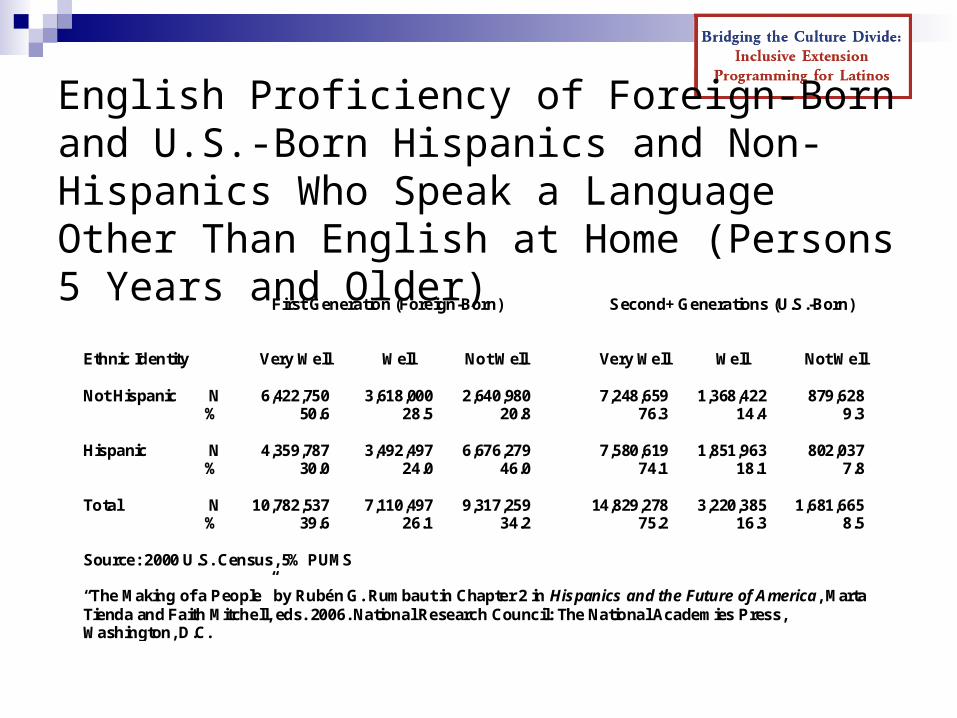
English Proficiency of Foreign-Born and U.S.-Born Hispanics and Non-Hispanics Who Speak a Language Other Than English at Home (Persons 5 Years and Older)
First Generation (Foreign-Born) Second+ Generations (U.S.-Born)
Ethnic Identity Very Well Well Not Well Very Well Well Not Well
Not Hispanic N 6,422,750 3,618,000 2,640,980 7,248,659 1,368,422 879,628% 50.6 28.5 20.8 76.3 14.4 9.3
Hispanic N 4,359,787 3,492,497 6,676,279 7,580,619 1,851,963 802,037% 30.0 24.0 46.0 74.1 18.1 7.8
Total N 10,782,537 7,110,497 9,317,259 14,829,278 3,220,385 1,681,665% 39.6 26.1 34.2 75.2 16.3 8.5
Source: 2000 U.S. Census, 5% PUMS
“The Making of a People” by Rubén G. Rumbaut in Chapter 2 in Hispanics and the Future of America, MartaTienda and Faith Mitchell, eds. 2006. National Research Council: The National Academies Press,Washington, D.C.
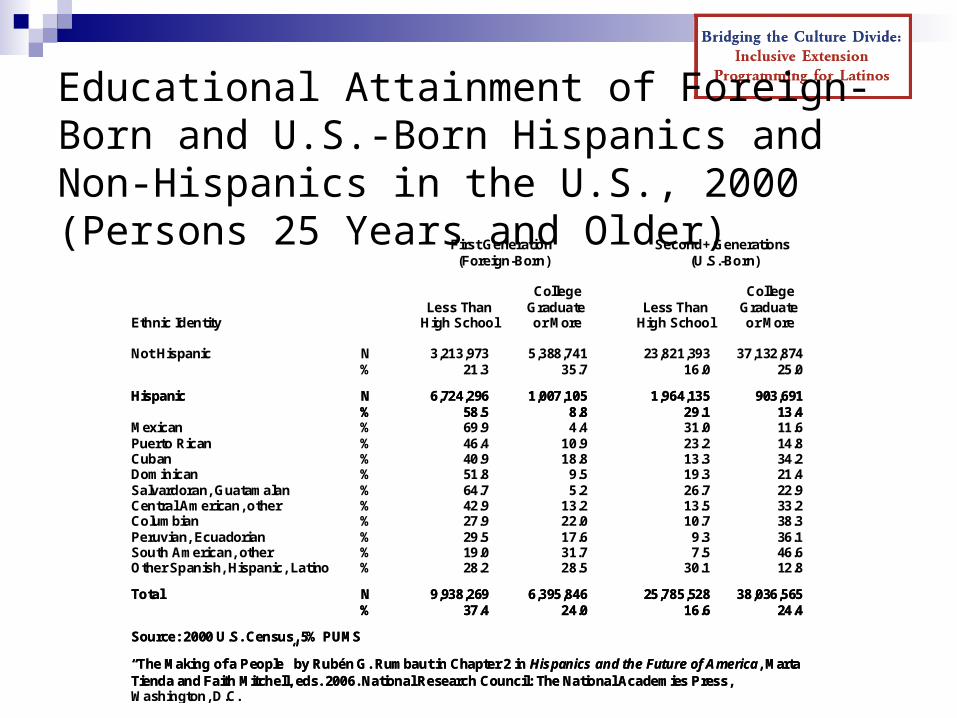
Educational Attainment of Foreign-Born and U.S.-Born Hispanics and Non-Hispanics in the U.S., 2000 (Persons 25 Years and Older)
First Generation Second+ Generations (Foreign-Born) (U.S.-Born)
College CollegeLess Than Graduate Less Than Graduate
Ethnic Identity High School or More High School or More
Not Hispanic N 3,213,973 5,388,741 23,821,393 37,132,874% 21.3 35.7 16.0 25.0
Hispanic N 6,724,296 1,007,105 1,964,135 903,691% 58.5 8.8 29.1 13.4
Mexican % 69.9 4.4 31.0 11.6Puerto Rican % 46.4 10.9 23.2 14.8Cuban % 40.9 18.8 13.3 34.2Dominican % 51.8 9.5 19.3 21.4Salvardoran, Guatamalan % 64.7 5.2 26.7 22.9Central American, other % 42.9 13.2 13.5 33.2Columbian % 27.9 22.0 10.7 38.3Peruvian, Ecuadorian % 29.5 17.6 9.3 36.1South American, other % 19.0 31.7 7.5 46.6Other Spanish, Hispanic, Latino % 28.2 28.5 30.1 12.8
Total N 9,938,269 6,395,846 25,785,528 38,036,565% 37.4 24.0 16.6 24.4
Source: 2000 U.S. Census, 5% PUMS
“The Making of a People” by Rubén G. Rumbaut in Chapter 2 in Hispanics and the Future of America, MartaTienda and Faith Mitchell, eds. 2006. National Research Council: The National Academies Press,Washington, D.C.
Hispanic N 6,724,296 1,007,105 1,964,135 903,691% 58.5 8.8 29.1 13.4
Total N 9,938,269 6,395,846 25,785,528 38,036,565% 37.4 24.0 16.6 24.4
Source: 2000 U.S. Census, 5% PUMS
“The Making of a People” by Rubén G. Rumbaut in Chapter 2 in Hispanics and the Future of America, MartaTienda and Faith Mitchell, eds. 2006. National Research Council: The National Academies Press,
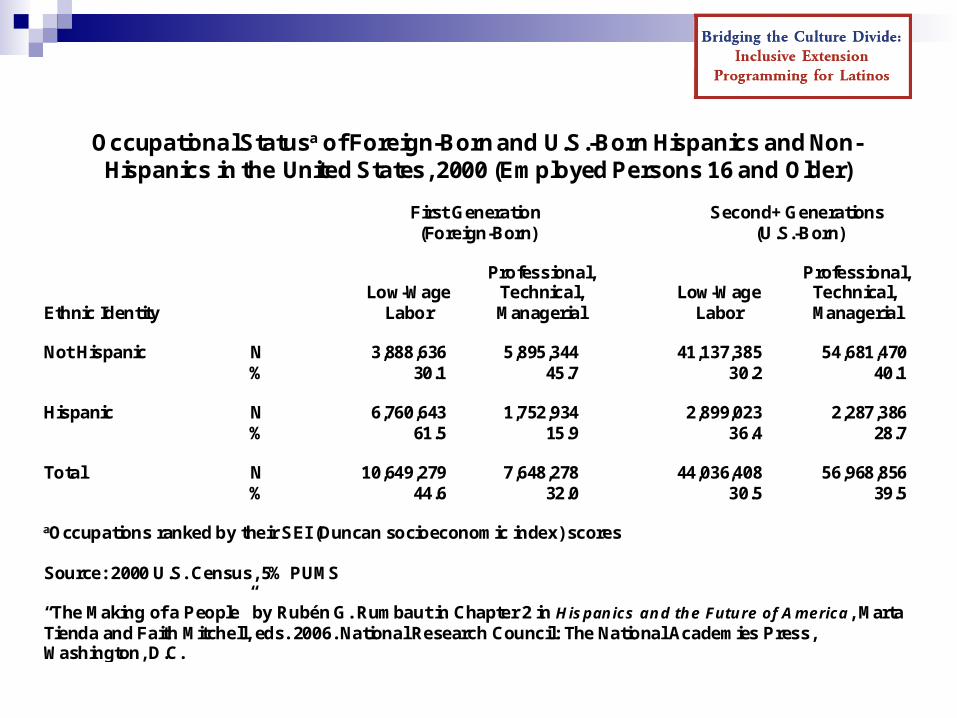
Occupational Statusa of Foreign-Born and U.S.-Born Hispanics and Non-Hispanics in the United States, 2000 (Employed Persons 16 and Older)
First Generation Second+ Generations (Foreign-Born) (U.S.-Born)
Professional, Professional,Low-Wage Technical, Low-Wage Technical,
Ethnic Identity Labor Managerial Labor Managerial
Not Hispanic N 3,888,636 5,895,344 41,137,385 54,681,470% 30.1 45.7 30.2 40.1
Hispanic N 6,760,643 1,752,934 2,899,023 2,287,386% 61.5 15.9 36.4 28.7
Total N 10,649,279 7,648,278 44,036,408 56,968,856% 44.6 32.0 30.5 39.5
aaOccupations ranked by their SEI (Duncan socioeconomic index) scores
Source: 2000 U.S. Census, 5% PUMS
“The Making of a People” by Rubén G. Rumbaut in Chapter 2 in Hispanics and the Future of America, MartaTienda and Faith Mitchell, eds. 2006. National Research Council: The National Academies Press,Washington, D.C.
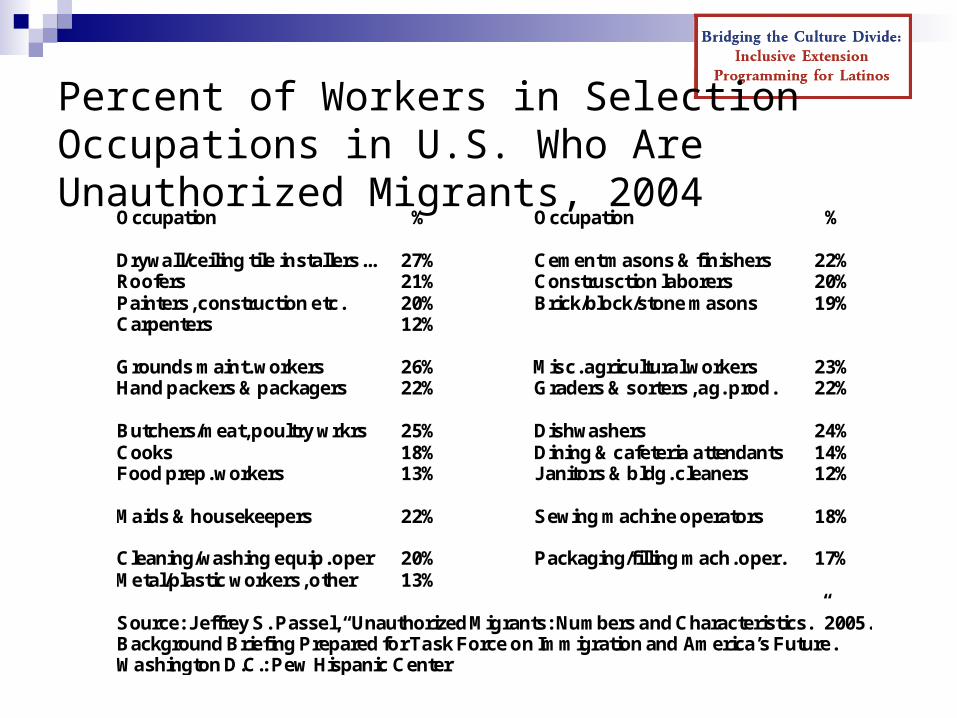
Percent of Workers in Selection Occupations in U.S. Who Are Unauthorized Migrants, 2004
Occupation % Occupation %
Drywall/ceiling tile installers... 27% Cement masons & finishers 22%Roofers 21% Construsction laborers 20%Painters, construction etc. 20% Brick/block/stone masons 19%Carpenters 12%
Grounds maint. workers 26% Misc. agricultural workers 23%Hand packers & packagers 22% Graders & sorters, ag. prod. 22%
Butchers/meat, poultry wrkrs 25% Dishwashers 24%Cooks 18% Dining & cafeteria attendants 14%Food prep. workers 13% Janitors & bldg. cleaners 12%
Maids & housekeepers 22% Sewing machine operators 18%
Cleaning/washing equip. oper 20% Packaging/filling mach. oper. 17%Metal/plastic workers, other 13%
Source: Jeffrey S. Passel, “Unauthorized Migrants: Numbers and Characteristics.” 2005.Background Briefing Prepared for Task Force on Immigration and America’s Future.Washington D.C.: Pew Hispanic Center
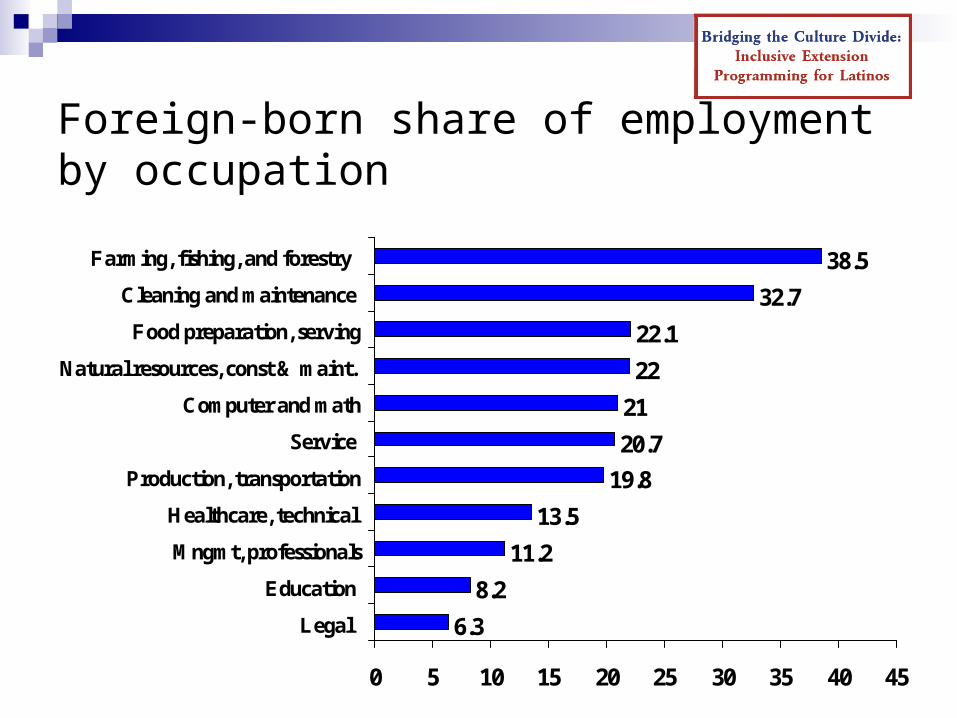
Foreign-born share of employmentby occupation
6.3
8.2
11.2
13.5
19.8
20.7
21
22
22.1
32.7
38.5
0 5 10 15 20 25 30 35 40 45
Legal
Education
Mngmt, professionals
Healthcare, technical
Production, transportation
Service
Computer and math
Natural resources, const & maint.
Food preparation, serving
Cleaning and maintenance
Farming, fishing, and forestry
35
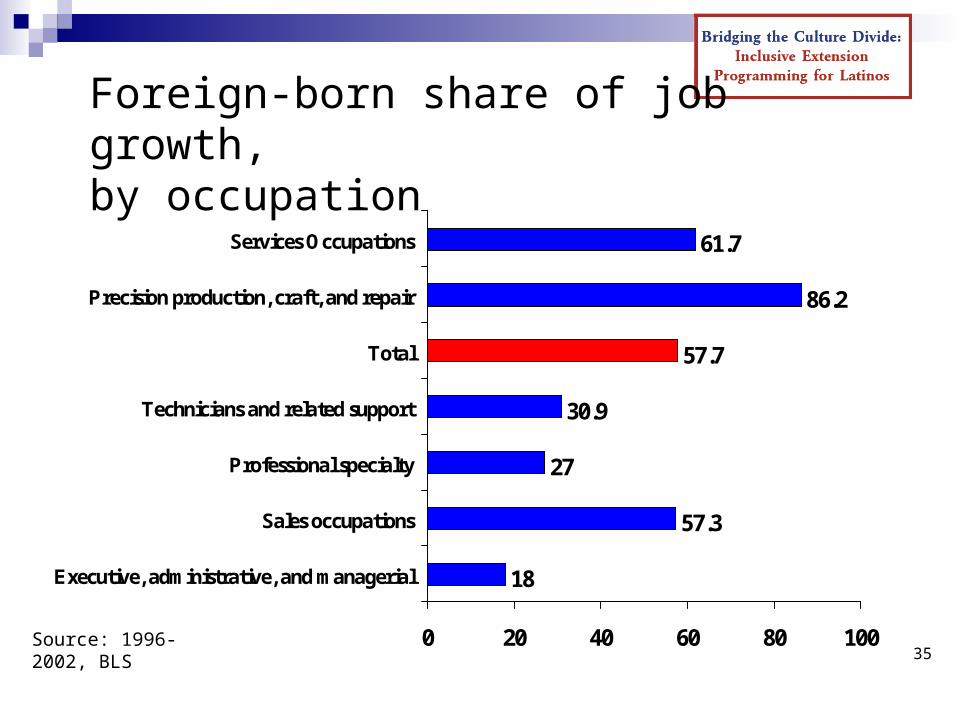
Foreign-born share of job growth,by occupation
18
57.3
27
30.9
57.7
86.2
61.7
0 20 40 60 80 100
Executive, administrative, and managerial
Sales occupations
Professional specialty
Technicians and related support
Total
Precision production, craft, and repair
Services Occupations
Source: 1996-2002, BLS
36
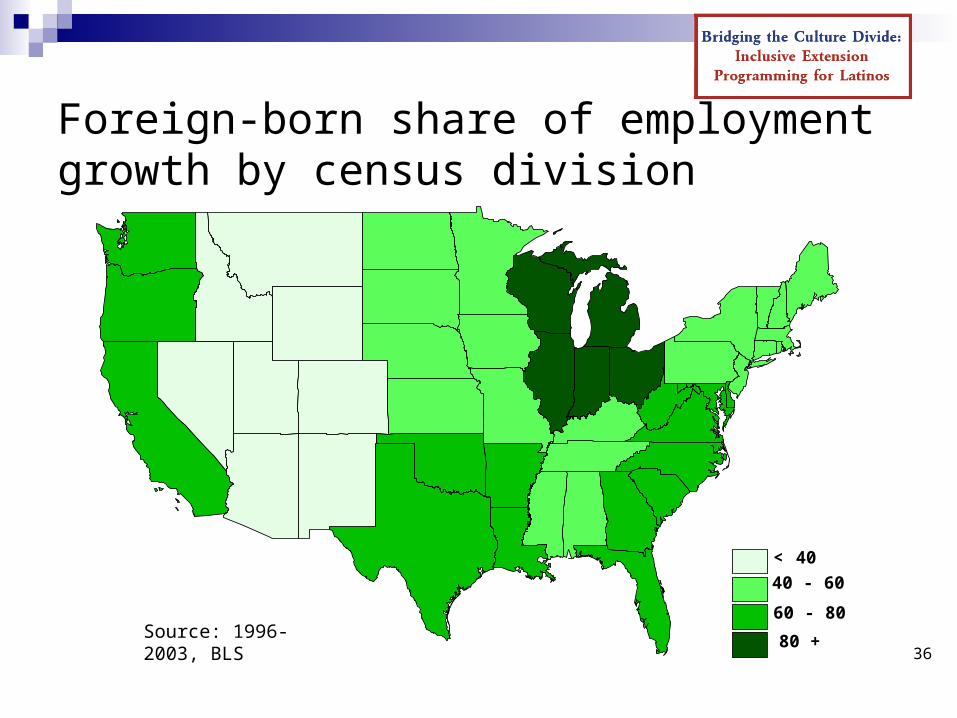
Foreign-born share of employment growth by census division
< 40
40 - 60
60 - 80
80 +Source: 1996-2003, BLS
37
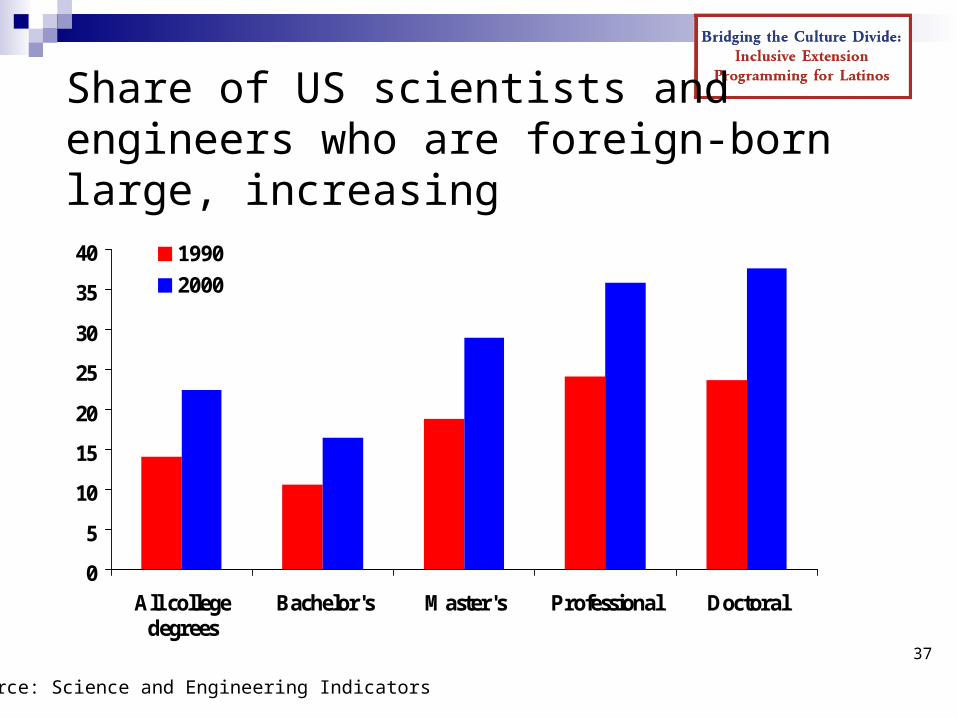
Share of US scientists and engineers who are foreign-born large, increasing
0
5
10
15
20
25
30
35
40
All collegedegrees
Bachelor's Master's Professional Doctoral
1990
2000
Percent
Source: Science and Engineering Indicators
38
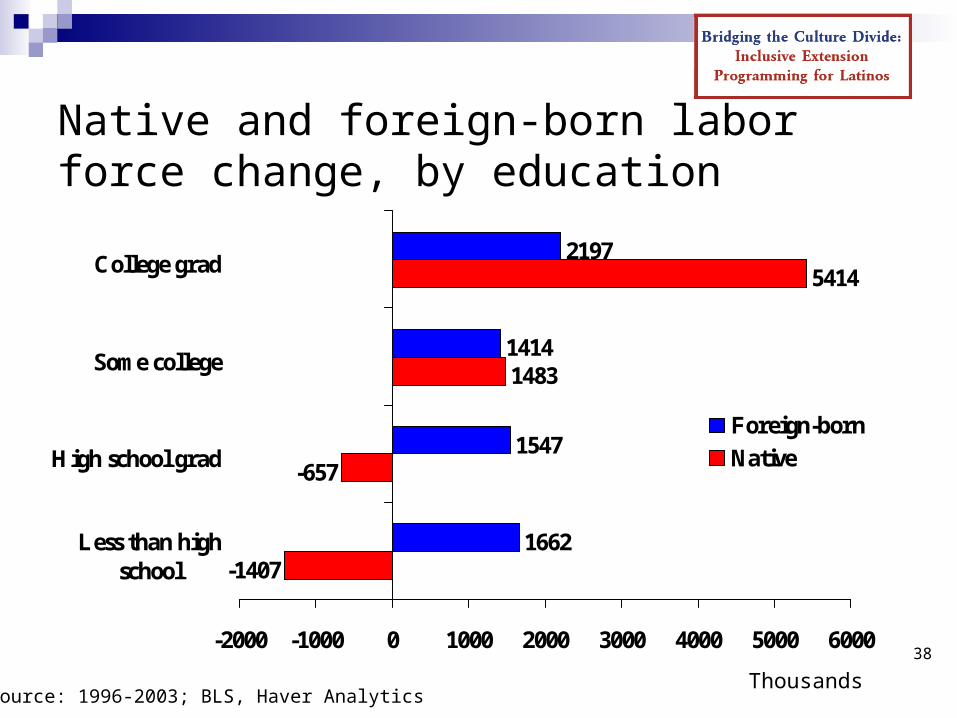
Native and foreign-born labor force change, by education
-1407
-657
1483
5414
1662
1547
1414
2197
-2000 -1000 0 1000 2000 3000 4000 5000 6000
Less than highschool
High school grad
Some college
College grad
Foreign-born
Native
Source: 1996-2003; BLS, Haver AnalyticsThousands
39
Median Household Income in the United States by Age of Householder, 1999
$25,171
$42,174
$50,873
$56,917
$44,597
$27,304
$19,161
15-24 25-34 35-44 45-54 55-64 65-74 75+
Age of Householder
$0
$10,000
$20,000
$30,000
$40,000
$50,000
$60,000
Dollars
Source: U.S. Census Bureau, Money Income in the United States: 1999, Current Population Report P60-209
40
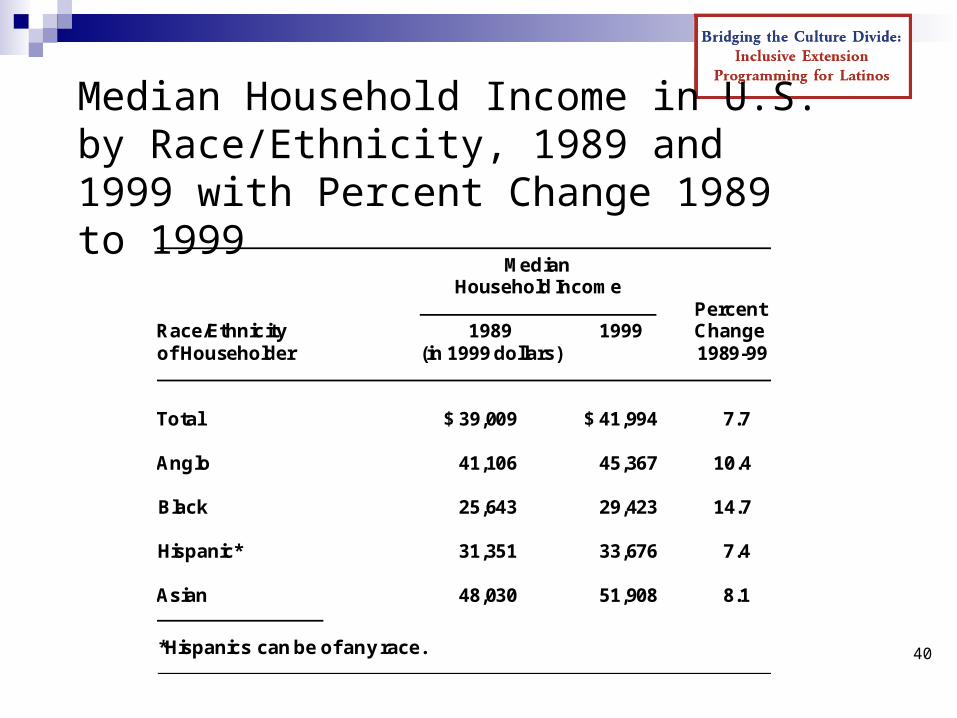
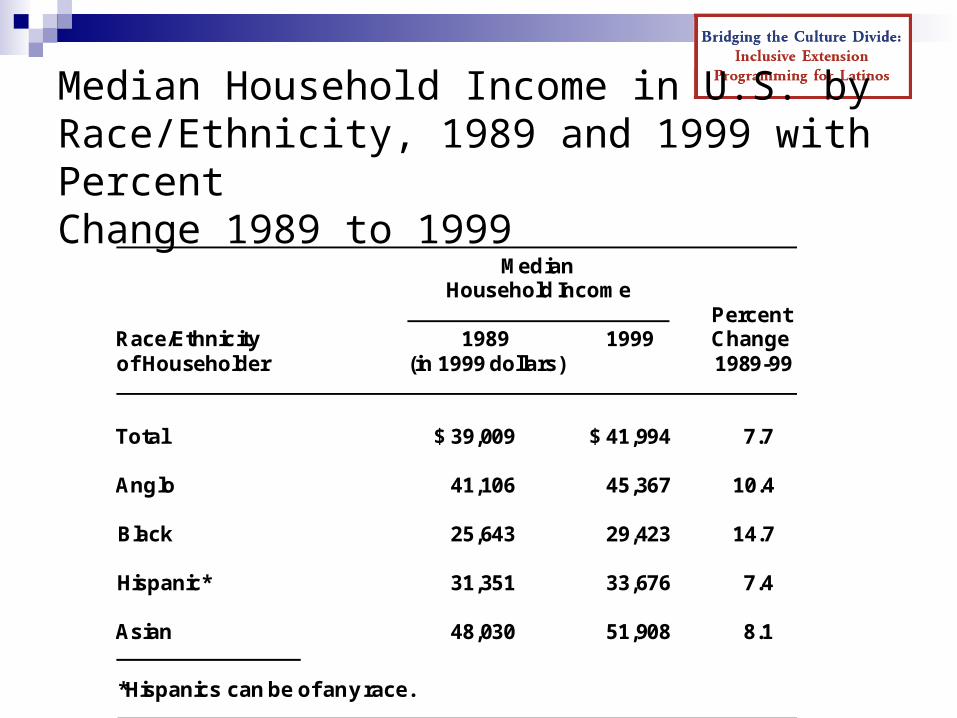
Median Household Income in U.S. by Race/Ethnicity, 1989 and 1999 with Percent Change 1989 to 1999
Median
Household IncomePercent
Race/Ethnicity 1989 1999 Changeof Householder (in 1999 dollars) 1989-99
Total $ 39,009 $ 41,994 7.7
Anglo 41,106 45,367 10.4
Black 25,643 29,423 14.7
Hispanic* 31,351 33,676 7.4
Asian 48,030 51,908 8.1
*Hispanics can be of any race.
Median Household Income in U.S. by Race/Ethnicity, 1999
$42,504
$27,910
$51,205
$30,735
White Black Asian and Pacific Islander
Hispanic$0
$10,000
$20,000
$30,000
$40,000
$50,000
$60,000
Dollars
Median Household Income in U.S. by Race/Ethnicity, 1989 and 1999 with Percent Change 1989 to 1999
Median
Household IncomePercent
Race/Ethnicity 1989 1999 Changeof Householder (in 1999 dollars) 1989-99
Total $ 39,009 $ 41,994 7.7
Anglo 41,106 45,367 10.4
Black 25,643 29,423 14.7
Hispanic* 31,351 33,676 7.4
Asian 48,030 51,908 8.1
*Hispanics can be of any race.
Median Household Income in U.S. by Household Type, 1999
$56,827
$41,838
$26,164$24,566
Married-coupleFamilies
Male Householder,no wife present
Female Householder,no husband present
Non-FamilyHouseholds
Household Type
$0
$10,000
$20,000
$30,000
$40,000
$50,000
$60,000
Dollars
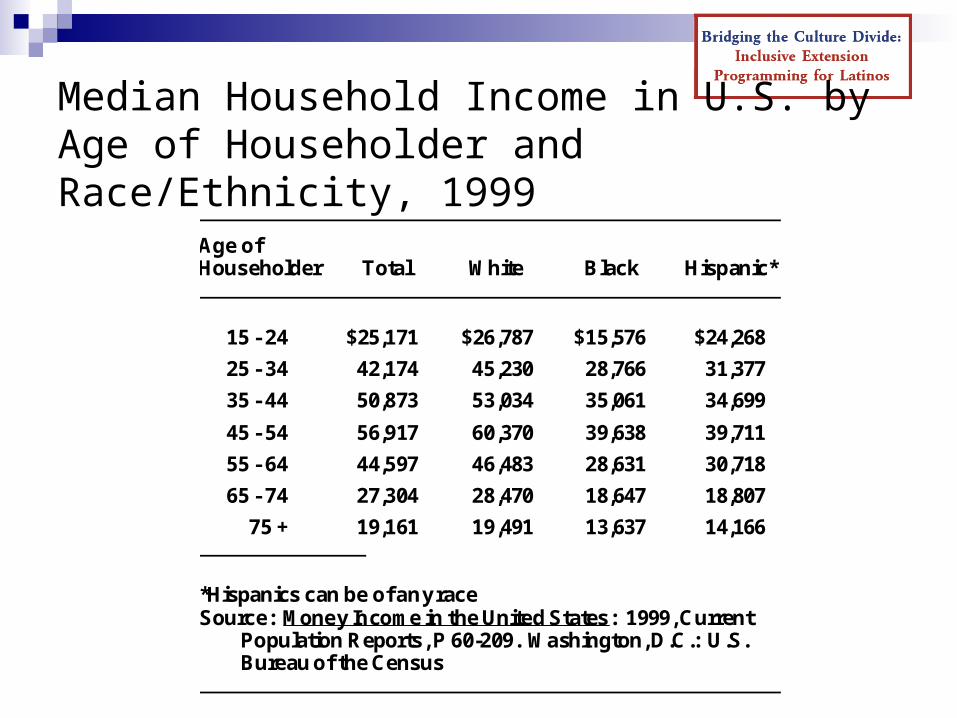
Median Household Income in U.S. by Age of Householder and Race/Ethnicity, 1999
Age ofHouseholder Total White Black Hispanic*
15 - 24 $25,171 $26,787 $15,576 $24,268
25 - 34 42,174 45,230 28,766 31,377
35 - 44 50,873 53,034 35,061 34,699
45 - 54 56,917 60,370 39,638 39,711
55 - 64 44,597 46,483 28,631 30,718
65 - 74 27,304 28,470 18,647 18,807
75 + 19,161 19,491 13,637 14,166
*Hispanics can be of any raceSource: Money Income in the United States: 1999, Current
Population Reports, P 60-209. Washington, D.C.: U.S.Bureau of the Census
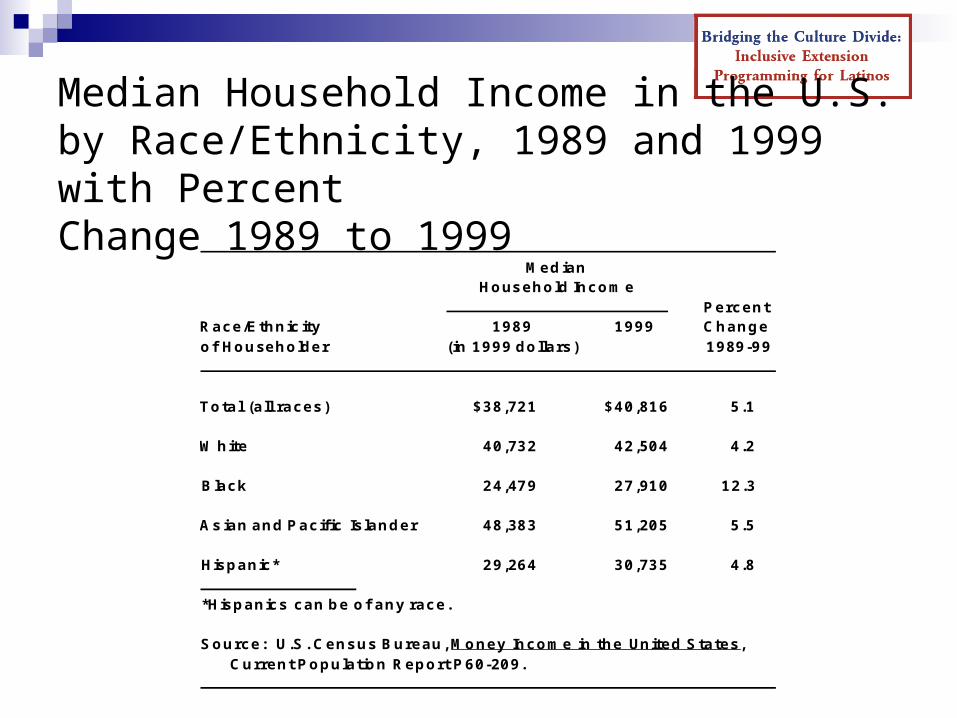
Median Household Income in the U.S. by Race/Ethnicity, 1989 and 1999 with Percent Change 1989 to 1999
Median
Household IncomePercent
Race/Ethnicity 1989 1999 Changeof Householder (in 1999 dollars) 1989-99
Total (all races) $38,721 $40,816 5.1
White 40,732 42,504 4.2
Black 24,479 27,910 12.3
Asian and Pacific Islander 48,383 51,205 5.5
Hispanic* 29,264 30,735 4.8 *Hispanics can be of any race.
Source: U.S. Census Bureau, Money Income in the United States,Current Population Report P60-209.
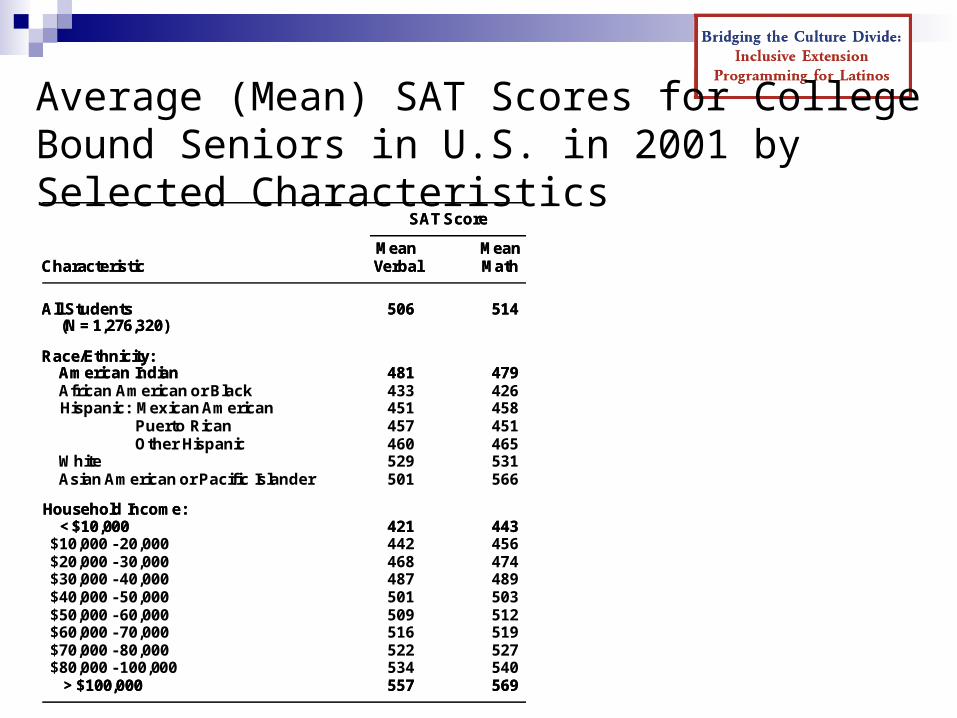
Average (Mean) SAT Scores for College Bound Seniors in U.S. in 2001 by Selected Characteristics
SAT Score
Mean MeanCharacteristic Verbal Math
All Students 506 514(N = 1,276,320)
Race/Ethnicity:American Indian 481 479African American or Black 433 426Hispanic: Mexican American 451 458 Puerto Rican 457 451 Other Hispanic 460 465White 529 531Asian American or Pacific Islander 501 566
Household Income: < $10,000 421 443 $10,000 - 20,000 442 456 $20,000 - 30,000 468 474 $30,000 - 40,000 487 489 $40,000 - 50,000 501 503 $50,000 - 60,000 509 512 $60,000 - 70,000 516 519 $70,000 - 80,000 522 527 $80,000 - 100,000 534 540
> $100,000 557 569
SAT Score
Mean Mean
Characteristic Verbal Math
All Students 506 514(N = 1,276,320)
Race/Ethnicity:American Indian 481 479
Household Income: < $10,000 421 443
> $100,000 557 569
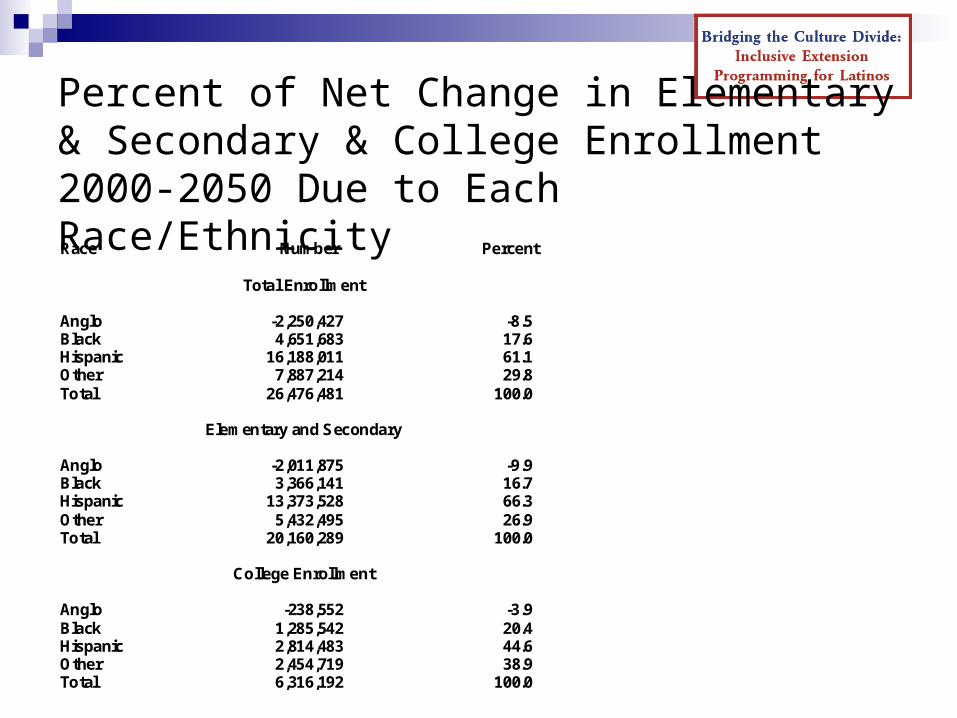
Percent of Net Change in Elementary & Secondary & College Enrollment 2000-2050 Due to Each Race/EthnicityRace Number Percent
Total Enrollment
Anglo -2,250,427 -8.5Black 4,651,683 17.6Hispanic 16,188,011 61.1Other 7,887,214 29.8Total 26,476,481 100.0
Elementary and Secondary
Anglo -2,011,875 -9.9Black 3,366,141 16.7Hispanic 13,373,528 66.3Other 5,432,495 26.9Total 20,160,289 100.0
College Enrollment
Anglo -238,552 -3.9Black 1,285,542 20.4Hispanic 2,814,483 44.6Other 2,454,719 38.9Total 6,316,192 100.0
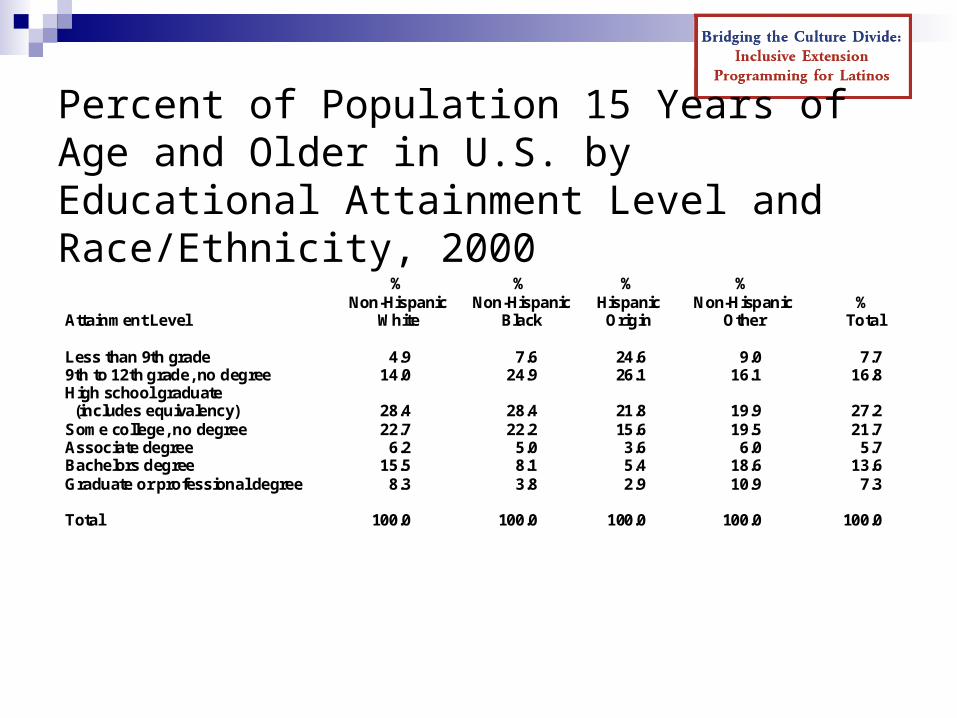
Percent of Population 15 Years of Age and Older in U.S. by Educational Attainment Level and Race/Ethnicity, 2000
% % % %Non-Hispanic Non-Hispanic Hispanic Non-Hispanic %
Attainment Level White Black Origin Other Total
Less than 9th grade 4.9 7.6 24.6 9.0 7.79th to 12th grade, no degree 14.0 24.9 26.1 16.1 16.8High school graduate (includes equivalency) 28.4 28.4 21.8 19.9 27.2Some college, no degree 22.7 22.2 15.6 19.5 21.7Associate degree 6.2 5.0 3.6 6.0 5.7Bachelors degree 15.5 8.1 5.4 18.6 13.6Graduate or professional degree 8.3 3.8 2.9 10.9 7.3
Total 100.0 100.0 100.0 100.0 100.0
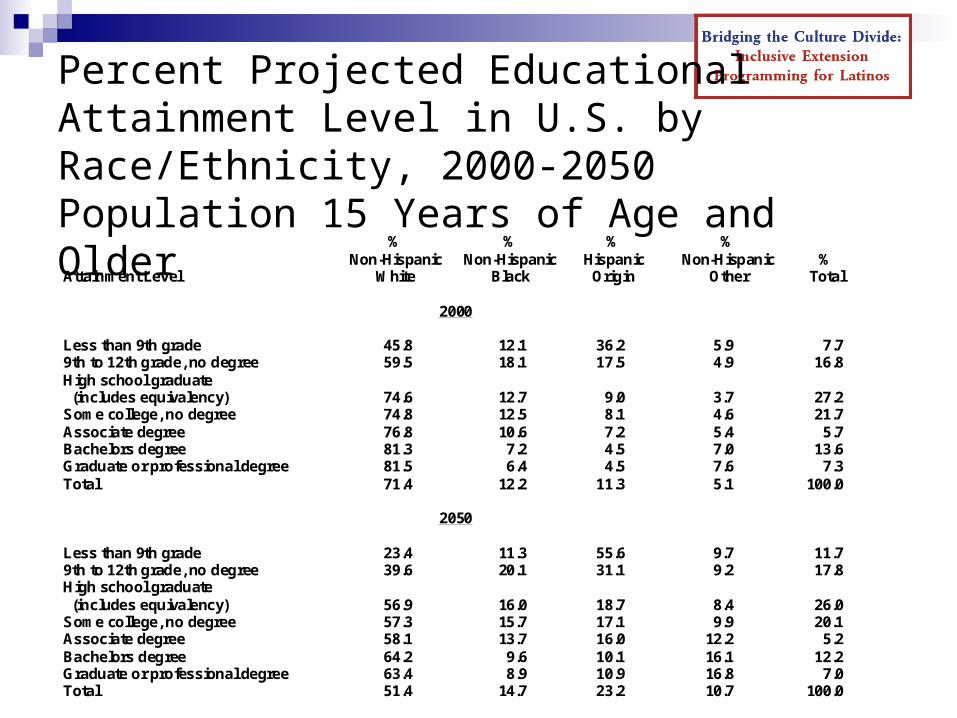
Percent Projected Educational Attainment Level in U.S. by Race/Ethnicity, 2000-2050 Population 15 Years of Age and Older
% % % %Non-Hispanic Non-Hispanic Hispanic Non-Hispanic %
Attainment Level White Black Origin Other Total
2000
Less than 9th grade 45.8 12.1 36.2 5.9 7.79th to 12th grade, no degree 59.5 18.1 17.5 4.9 16.8High school graduate (includes equivalency) 74.6 12.7 9.0 3.7 27.2Some college, no degree 74.8 12.5 8.1 4.6 21.7Associate degree 76.8 10.6 7.2 5.4 5.7Bachelors degree 81.3 7.2 4.5 7.0 13.6Graduate or professional degree 81.5 6.4 4.5 7.6 7.3Total 71.4 12.2 11.3 5.1 100.0
2050
Less than 9th grade 23.4 11.3 55.6 9.7 11.79th to 12th grade, no degree 39.6 20.1 31.1 9.2 17.8High school graduate (includes equivalency) 56.9 16.0 18.7 8.4 26.0Some college, no degree 57.3 15.7 17.1 9.9 20.1Associate degree 58.1 13.7 16.0 12.2 5.2Bachelors degree 64.2 9.6 10.1 16.1 12.2Graduate or professional degree 63.4 8.9 10.9 16.8 7.0Total 51.4 14.7 23.2 10.7 100.0
50
Implications for the 2010 Census (and Extension / Public Services?) The post 9/11 psyche The Immigration Debate Natural and manmade disasters A larger and “hard-to-reach population Increased resistance to providing
personal information
Sources of Data U.S. Census Bureau U.S. Bureau of Labor Statistics Pew Hispanic Center Marta Tienda and Faith Mitchell, (eds.)
Hispanics and the Future of America National Academy Press, Washington D.C.
2006 State Data Centers
Discussion How might you use this data Implications
Youth & 4-H Development Family Consumer Sciences Agriculture Community Development


![Briddging the Ethnic Economic Divide- Claudia Cody- UofM Extension[1]](https://img.pdfslide.us/doc/110x75/58a4dab11a28ab34318b5b11/briddging-the-ethnic-economic-divide-claudia-cody-uofm-extension1.jpg)