Embed Size (px)
Citation preview
HAL Id: hal-01159202https://hal-enac.archives-ouvertes.fr/hal-01159202
Submitted on 4 Jun 2015
HAL is a multi-disciplinary open accessarchive for the deposit and dissemination of sci-entific research documents, whether they are pub-lished or not. The documents may come fromteaching and research institutions in France orabroad, or from public or private research centers.
L’archive ouverte pluridisciplinaire HAL, estdestinée au dépôt et à la diffusion de documentsscientifiques de niveau recherche, publiés ou non,émanant des établissements d’enseignement et derecherche français ou étrangers, des laboratoirespublics ou privés.
Understanding Data Videos: Looking at NarrativeVisualization through the Cinematography Lens
Fereshteh Amini, Nathalie Henry Riche, Bongshin Lee, Christophe Hurter,Pourang Irani
To cite this version:Fereshteh Amini, Nathalie Henry Riche, Bongshin Lee, Christophe Hurter, Pourang Irani. Under-standing Data Videos: Looking at Narrative Visualization through the Cinematography Lens. CHI’15 33rd Annual ACM Conference on Human Factors in Computing Systems, ACM, Apr 2015, Seoul,South Korea. pp.1459-1468 / 978-1-4503-3145-6, �10.1145/2702123.2702431�. �hal-01159202�
Understanding Data Videos: Looking at Narrative Visualization through the Cinematography Lens
Fereshteh Amini1, Nathalie Henry Riche
2, Bongshin Lee
2, Christophe Hurter
3, Pourang Irani
1
1University of Manitoba Winnipeg, MB, Canada
{amini,irani}@cs.umanitoba.ca
2Microsoft Research Redmond, WA, US
{nath,bongshin}@microsoft.com
3ENAC, University of Toulouse Toulouse, France
ABSTRACT
Data videos, motion graphics that incorporate visualizations about facts, are increasingly gaining popularity as a means of telling stories with data. However, very little is systematically recorded about (a) what elements are featured in data videos and (b) the processes used to create them. In this article, we provide initial insights to build this knowledge. We first report on a qualitative analysis of 50 professionally designed data videos, extracting and exposing their most salient constituents. Second, we report on a series of workshops with experienced storytellers from cinematography, graphics design and screenplay writing. We provided them with a set of data facts and visualizations and observed them create storyboards for data videos. From these exploratory studies, we derive broader implications for the design of an authoring tool to enable a wide audience to create data videos. Our findings highlight the importance of providing a flexible tool supporting a non-linear creation process and allowing users to iteratively go back to different phases of the process.
Author Keywords
Information visualization; narrative visualization; data storytelling; data video; qualitative analysis.
ACM Classification Keywords
H.5.m. Information interfaces and presentation (e.g., HCI): Miscellaneous.
INTRODUCTION
Storytelling with data is rapidly becoming prominent both in practice and academia. Leading media outlets such as the New York Times and the Guardian are increasingly exposing the general public to stories with visual depictions of data, or narrative visualizations [20, 27]. Data videos –
custom motion graphics combining both visual and auditory stimuli to promote a data story – are one among the seven
genres of narrative visualizations [27]. The popularity of data videos could be attributed to the diverse forms of narrative structures and the wide range of visuals they expose an audience to within a short presentation time. As a result, researchers have argued that data videos can be highly impactful, making it a particularly interesting form of narrative visualization to study.
Despite the great potential that data videos can offer, we know very little about their constituent characteristics to help create narratives using this medium. Such knowledge can be instrumental in allowing a broader audience to design and craft data videos. We consider this work as a first step toward understanding data videos and a basis for developing, in the future, novel tools geared towards generating compelling data stories using this medium.
As empirical knowledge can be the cornerstone for early design implications [11], we attain our goals with two exploratory studies. In a first exploration, we identify the high-level narrative structures found in professionally created data videos and expose their key components. We carry out a qualitative examination of the narrative structures in 50 professional data videos collected from a range of reputable sources through the lens of established disciplines such as film theory and cinematography [13, 15]. Our findings are structured around the four narrative categories classically used in cinematography: Establisher, Initial, Peak, and Release [13, 25]. We report on the different types of narrative structures formed by the sequencing of these categories and characterize the videos’ contents through the varied types of data visualizations, and attention cues used.
Furthermore, to gain an understanding of the various strategies used in the process of creating visual narratives, we observed professional storytellers create storyboards from data and visualizations we provided them. We gain valuable insights through a series of workshops we conducted with 13 experienced storytellers, such as screenwriters, video makers, and motion graphics designers. We describe our observations on the most common processes they employ to build a narrative structure and their consultations for making their video storyboards visually compelling.
RELATED WORK
While the perspective of using data visualizations as a means to communicate is not a recent topic [4], storytelling with data has recently begun to gain more attention in the research community [20, 22, 27]. In particular, the spread of infographics to a wide audience and the development of fields like data journalism create unique opportunities for research in information visualization [16, 23, 29].
Many researchers have taken a step towards filling the gap between data exploration to gain insights and tell stories from these insights. Examples of these efforts include the expansion of data exploration tools to support storytelling scenarios such as GeoTime Stories [14] or Tableau Story Points [18]. Furthermore, several visual analytics systems have integrated storytelling into their designs [18, 28], to allow analysts to annotate stories within the exploratory visual process for example.
Research pieces directly aimed at providing solutions to help people craft narrative visualizations are scarce [12, 21]. We believe that our community needs to develop a larger body of knowledge on narrative visualizations, characterizing their key components but also studying the process to craft them. Such knowledge will inform the design of tools that would help a wide range of people consume and craft stories with data visualization.
Segel and Heer [27] initiated a first step in identifying genres of narrative visualizations by conducting an analysis of 58 narrative visualizations. They proposed a broad view of narrative visualizations integrating in their analysis static infographics, comics, slide-shows, video, and animations. Their insights offer a general sense of the range of visual and narrative components used in storytelling with data.
More focused studies of narrative visualizations have explored specific genres or aspects of narrative visualizations. Bateman et al. [9] and Borkin et al. [10] specifically focused on understanding infographics and what makes them appealing or memorable to a large audience. Hullman et al. [19] discussed categories of rhetorical techniques drawn from an online journalism corpus. The more relevant to ours is Hullman et al.’s [20] work on the analysis of sequences in storytelling with data. While this work focused on specific transitions between visuals, we take a more holistic view of the narrative structure and characterize higher-level structure in data videos.
While these previous studies have deepened our knowledge on the composition of narrative visualizations, identifying what makes them compelling or memorable, none of these studies have looked at the process involved in crafting them. We also aim to fill this gap and report insights on the creation process involved in crafting data videos.
Even though research is sparse regarding the structure of storytelling with data visualizations, there is a wealth of research on narrative story structure in other fields such as literature [15], cinematography [24], or comics [13, 25]. We
aimed at building on this body of work, looking at the composition of data videos through this lens. In particular, we analyzed data videos using the theory of visual narrative structures described by Cohn [13]. This approach attempts to unify different perspectives on narrative structures in different genres. Derived from the structure of comics, we also believe it particularly suited to analyzing stories featuring data visualizations.
STUDY 1: ANALYSIS OF DATA VIDEOS
To better understand the content and structure of data videos, we conducted a qualitative analysis of 50 data videos from 8 reputable online sources. A complete list of the videos is included in a companion website1.
Methodology
Data Video Selection
To ensure videos collected have a good quality and likely to have been created by experienced professionals, we selected several from a range of reputable sources as well as those with a high number of views on YouTube.com and Vimeo.com. We collected data via online magazines, government and research center websites, graphic design company websites, and visualization blogs.
In addition, a data video had to meet the following three inclusion criteria to be added to our dataset: 1) it contains a core message and presents arguments supported by data; 2) it includes at least one data visualization; and 3) it follows a narrative format which refers to the spoken or written account of connected events given in a sequence [3].
Data Video Analysis
We conducted both open [17] and close [26] coding of the data. In the first phase, the lead researcher used an open-coding approach to characterize the content of 10 (20%) of the videos. Through the discussion of these codes among three researchers over three sessions, we selected two dimensions: Data Visualization Type and Attention Cues. Since our final code-set was composed of well-defined types such as bar charts and scatterplots for visualizations or animation and highlighting for attention cues, the lead researcher completed the coding on the remaining set.
In the second phase, we sought to characterize the Narrative
Structure of data videos. Looking at this data through the cinematography lens [13], we opted to analyze the data around four main narrative categories: Establisher, Initial,
Peak, and Release. We analyzed the type of content included. Two researchers independently coded five (10%) data videos and refined the coding until they had reached agreement on the segmentation of each sequence (at about 2 seconds precision) and their codes. The lead researcher completed the coding on the remaining videos.
1http://hci.cs.umanitoba.ca/projects-and-research/details/ data-videos
Characterizing the Content of Data Videos
We describe the content of data videos along the two identified dimensions: Data Visualization Types and the types of Attention Cues.
Data Visualizations
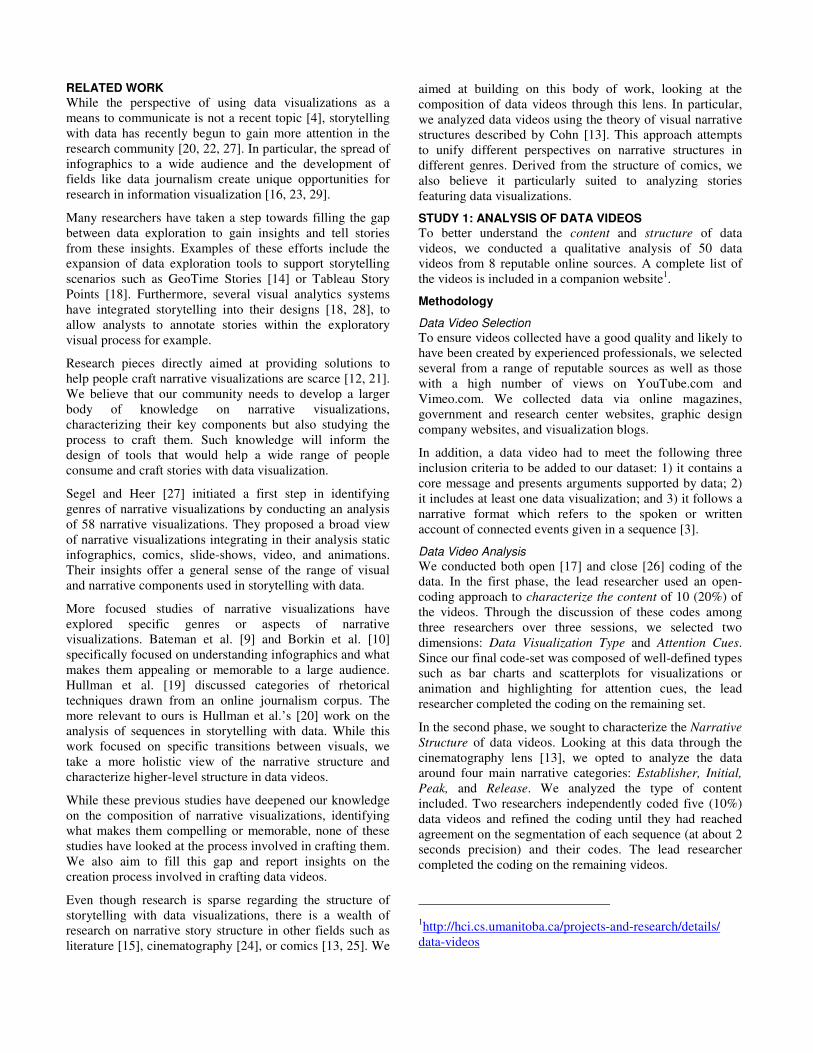
In data videos, visual data representations are the primary means for conveying a story. Overall, data videos we collected present a large amount of visuals in a short amount of time. While the average duration of a data video was found to be 3 minutes (ranging from 1 to 7.5 minutes), the average number of data visualizations presented is six (ranging from 1 to 19 visualizations). On average, 48% of the total duration of a data video is dedicated to data visualizations. However, despite this high content dedicated to visualizations, 72% of the data videos tend to rely on only 5 different types of visualizations on average (Figure 2-left). For example, more than half of the data video duration in [7] contains data visualizations but they are limited to only 3 types of representations (scatter plots, bar charts, and maps).
Attention Cues
One of the most important and unique design dimensions with regards to data videos are Attention Cues or tactics used to keep viewers engaged during the delivery of a story. We identified nine major types of visual and auditory effects, aimed at drawing the viewer’s attention. These include camera motion effects such as zooming, building tension in the story via soundtracks, and emphasizing salient information via gradual text appearance or highlighting (Figure 2-right). The top three most commonly used effects were animation, appearing/disappearing, and highlighting (e.g., the data video in [6] includes several attention cues). Surprisingly, we did not identify many cues specifically related to data visualizations except for animated sequential data presentation.
Characterizing the Narrative Structure of Data Videos
Narrative is defined as a spoken or written account of connected events [3]. The organization and ordering, in
which these connected events are presented (i.e., the narrative structure) may greatly impact the understanding of the narrative and, in case of data videos, the viewing experience. In this section, we present our findings regarding the narrative structure of data videos. We analyzed them through the lens of the dramatic structure as initially defined by Freytag [15] and further refined for visual narratives by Cohn [13]. Below we describe different types of narrative structures encountered, and present findings regarding their content.
Narrative Structure and Categories
Following Cohn’s theory of visual narrative structure, we split data videos into temporal sequences and coded these sequences regarding their role in the narrative. We used Cohn’s definitions for the four major narrative categories:
o Establisher (E): sequences that “provide referential information without engaging them in the actions or events of a narrative.”
o Initial (I): sequences that “set the action or event in motion.”
o Peak (P): sequences where “the most important things happen; the culmination of an event or the confluence of numerous events.”
o Release (R): sequences that show “the aftermath of the Peak.”
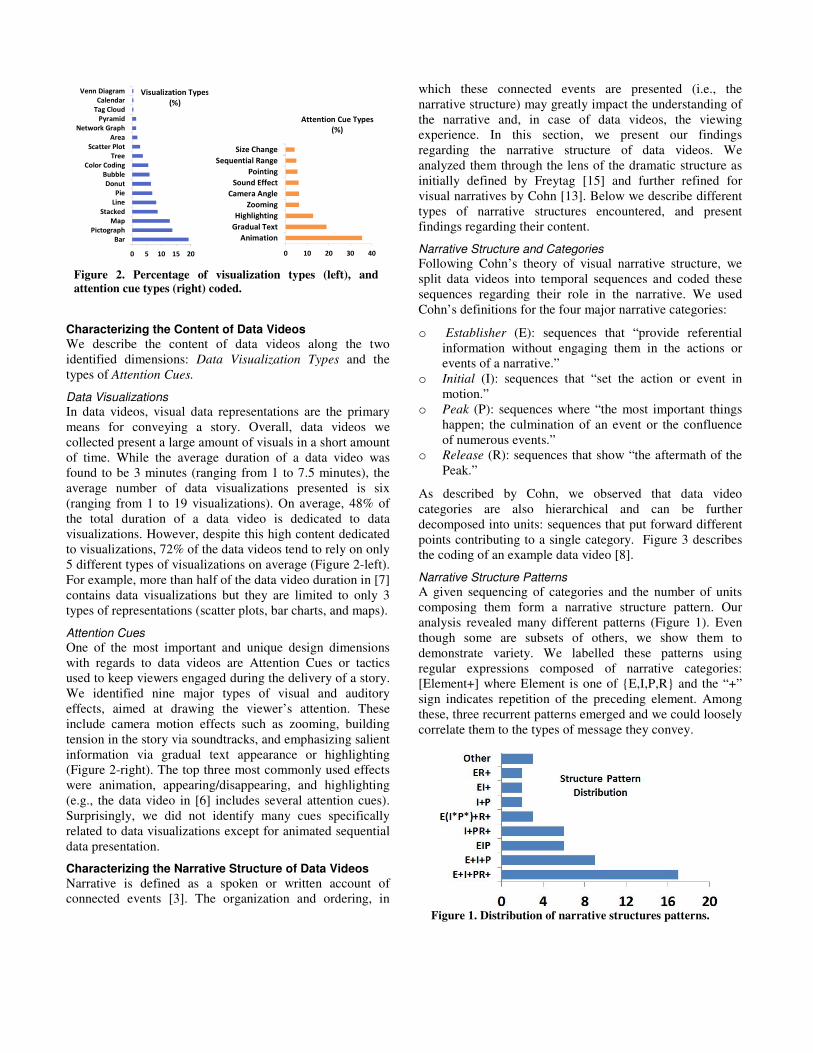
As described by Cohn, we observed that data video categories are also hierarchical and can be further decomposed into units: sequences that put forward different points contributing to a single category. Figure 3 describes the coding of an example data video [8].
Narrative Structure Patterns
A given sequencing of categories and the number of units composing them form a narrative structure pattern. Our analysis revealed many different patterns (Figure 1). Even though some are subsets of others, we show them to demonstrate variety. We labelled these patterns using regular expressions composed of narrative categories: [Element+] where Element is one of {E,I,P,R} and the “+” sign indicates repetition of the preceding element. Among these, three recurrent patterns emerged and we could loosely correlate them to the types of message they convey.
Figure 2. Percentage of visualization types (left), and
attention cue types (right) coded.
0 5 10 15 20
Bar
Pictograph
Map
Stacked
Line
Pie
Donut
Bubble
Color Coding
Tree
Scatter Plot
Area
Network Graph
Pyramid
Tag Cloud
Calendar
Venn Diagram Visualization Types
(%)
0 10 20 30 40
Animation
Gradual Text
Highlighting
Zooming
Camera Angle
Sound Effect
Pointing
Sequential Range
Size Change
Attention Cue Types
(%)
Figure 1. Distribution of narrative structures patterns.
The most common pattern we identified in 34% of the videos is the “E+I+PR+” pattern. Videos following this pattern are usually well-balanced, solidly grounding their story with several units in Establisher (E+), building some tension with several units in Initial (I+) and leading to a single Peak (P), usually occurring around the middle of the video. The multiple Release units (R+) ensure ample time for conveying the take away message.
Two other dominant patterns are “E+I+P” and its subset pattern of “EIP”; these structures contain a single Peak unit (P) without any Release units. Cohn [13] refers to this complex structure as the left-branching tree not commonly seen in comics. Data videos of this narrative structure finish the narrative by leaving the viewer with a “question” or “something to think about” after presenting some facts within the data (e.g., [5]).
We also observed structures that break away from the common pattern with an escalating tension followed by a single Peak [15]. First is “E(I*P*)+R+” which depicts data videos including multiple Peak units proceeded by multiple Initial units. The videos pertaining to this pattern are longer in duration when compared to other patterns and include alternative visualizations of the same aspect of the data or multiple new facts all having the same tension level. Two other surprising patterns are somewhat similar: “EI+” and “ER+,” both of which do not contain a distinct Peak unit in the narrative structure. The data videos following these patterns present “multiple problems” or “multiple solutions,” respectively.
Composition of Narrative Categories
To gain an overview of the relative importance of these categories, we report on the proportion of average time devoted to each category as well as the proportion of data visualizations and attention cues in each of these.
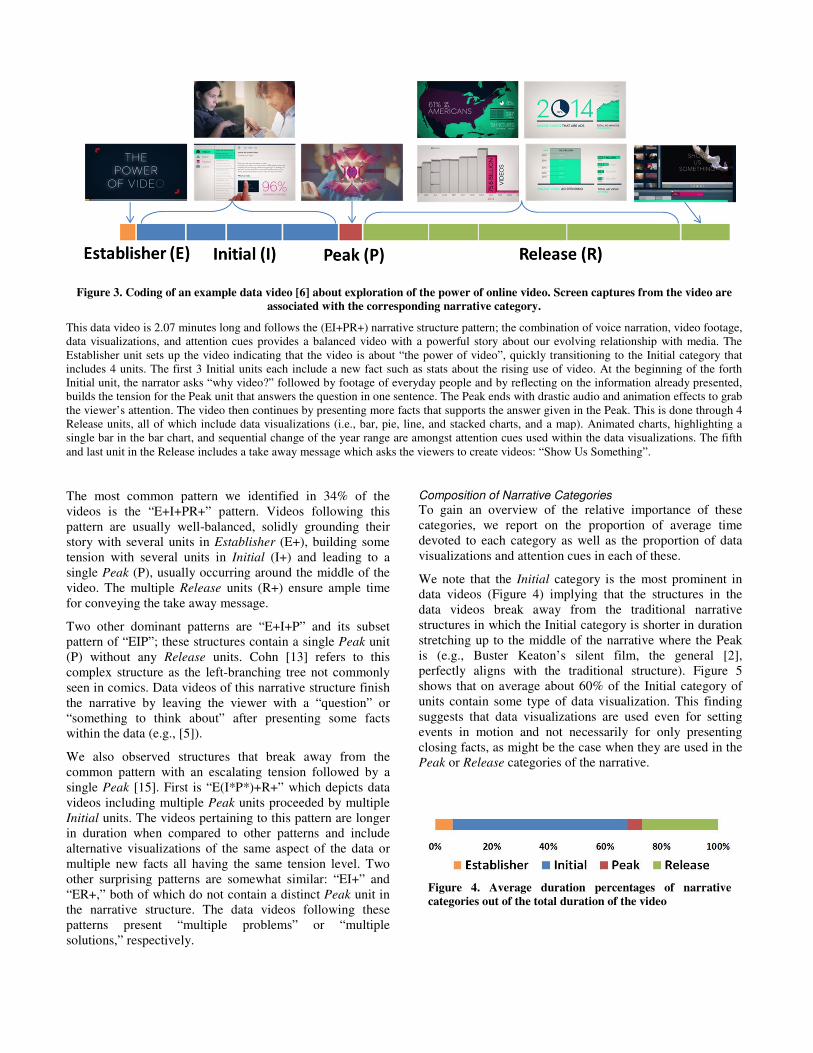
We note that the Initial category is the most prominent in data videos (Figure 4) implying that the structures in the data videos break away from the traditional narrative structures in which the Initial category is shorter in duration stretching up to the middle of the narrative where the Peak is (e.g., Buster Keaton’s silent film, the general [2], perfectly aligns with the traditional structure). Figure 5 shows that on average about 60% of the Initial category of units contain some type of data visualization. This finding suggests that data visualizations are used even for setting events in motion and not necessarily for only presenting closing facts, as might be the case when they are used in the Peak or Release categories of the narrative.
Figure 3. Coding of an example data video [6] about exploration of the power of online video. Screen captures from the video are
associated with the corresponding narrative category.
This data video is 2.07 minutes long and follows the (EI+PR+) narrative structure pattern; the combination of voice narration, video footage, data visualizations, and attention cues provides a balanced video with a powerful story about our evolving relationship with media. The Establisher unit sets up the video indicating that the video is about “the power of video”, quickly transitioning to the Initial category that includes 4 units. The first 3 Initial units each include a new fact such as stats about the rising use of video. At the beginning of the forth Initial unit, the narrator asks “why video?” followed by footage of everyday people and by reflecting on the information already presented, builds the tension for the Peak unit that answers the question in one sentence. The Peak ends with drastic audio and animation effects to grab the viewer’s attention. The video then continues by presenting more facts that supports the answer given in the Peak. This is done through 4 Release units, all of which include data visualizations (i.e., bar, pie, line, and stacked charts, and a map). Animated charts, highlighting a single bar in the bar chart, and sequential change of the year range are amongst attention cues used within the data visualizations. The fifth and last unit in the Release includes a take away message which asks the viewers to create videos: “Show Us Something”.
Figure 4. Average duration percentages of narrative
categories out of the total duration of the video
.
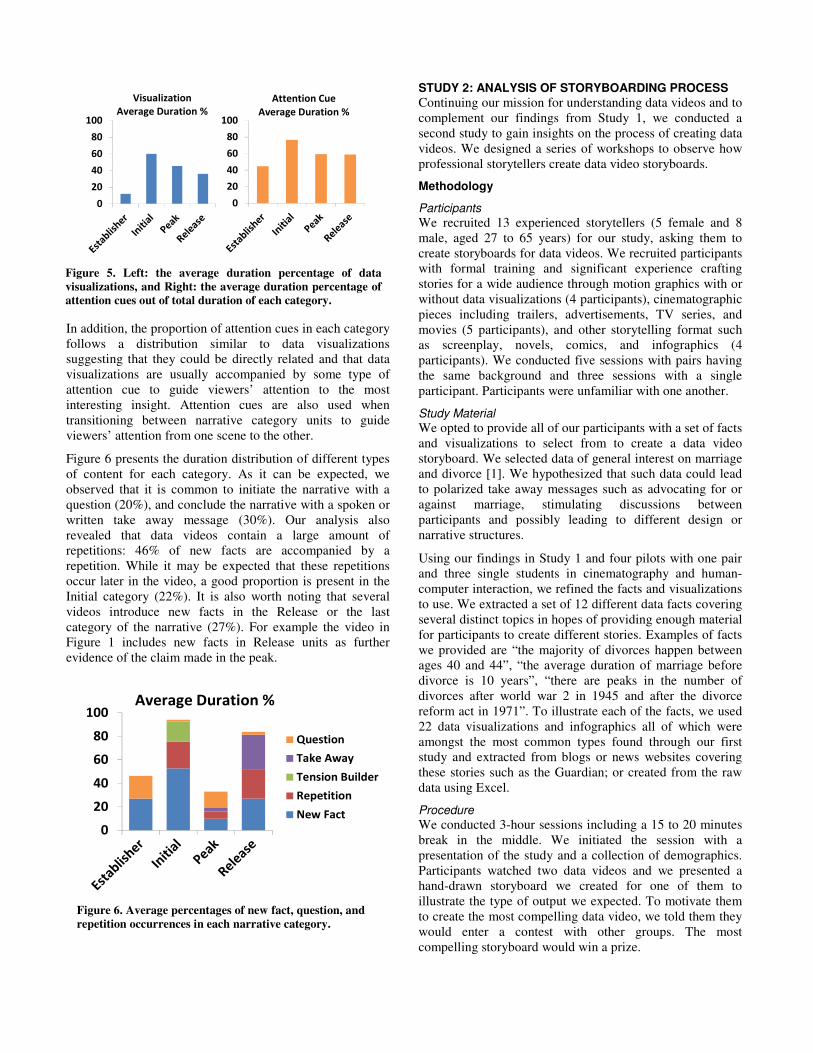
In addition, the proportion of attention cues in each category follows a distribution similar to data visualizations suggesting that they could be directly related and that data visualizations are usually accompanied by some type of attention cue to guide viewers’ attention to the most interesting insight. Attention cues are also used when transitioning between narrative category units to guide viewers’ attention from one scene to the other.
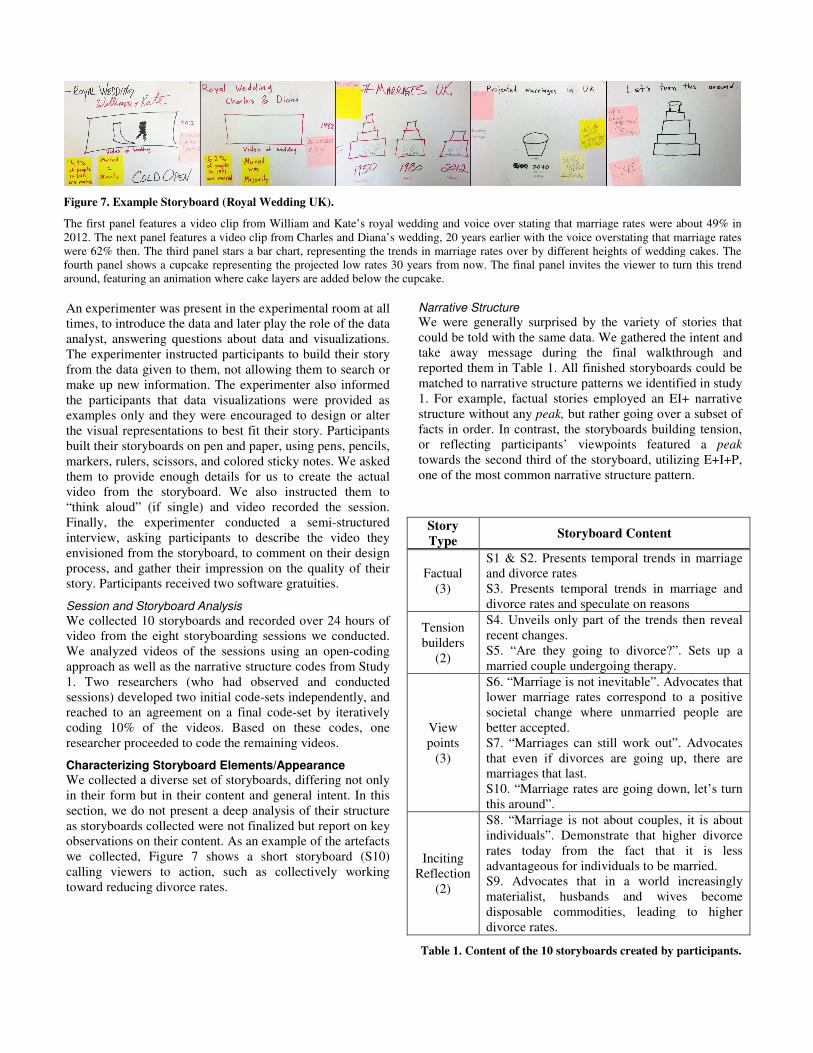
Figure 6 presents the duration distribution of different types of content for each category. As it can be expected, we observed that it is common to initiate the narrative with a question (20%), and conclude the narrative with a spoken or written take away message (30%). Our analysis also revealed that data videos contain a large amount of repetitions: 46% of new facts are accompanied by a repetition. While it may be expected that these repetitions occur later in the video, a good proportion is present in the Initial category (22%). It is also worth noting that several videos introduce new facts in the Release or the last category of the narrative (27%). For example the video in Figure 1 includes new facts in Release units as further evidence of the claim made in the peak.
STUDY 2: ANALYSIS OF STORYBOARDING PROCESS
Continuing our mission for understanding data videos and to complement our findings from Study 1, we conducted a second study to gain insights on the process of creating data videos. We designed a series of workshops to observe how professional storytellers create data video storyboards.
Methodology
Participants
We recruited 13 experienced storytellers (5 female and 8 male, aged 27 to 65 years) for our study, asking them to create storyboards for data videos. We recruited participants with formal training and significant experience crafting stories for a wide audience through motion graphics with or without data visualizations (4 participants), cinematographic pieces including trailers, advertisements, TV series, and movies (5 participants), and other storytelling format such as screenplay, novels, comics, and infographics (4 participants). We conducted five sessions with pairs having the same background and three sessions with a single participant. Participants were unfamiliar with one another.
Study Material
We opted to provide all of our participants with a set of facts and visualizations to select from to create a data video storyboard. We selected data of general interest on marriage and divorce [1]. We hypothesized that such data could lead to polarized take away messages such as advocating for or against marriage, stimulating discussions between participants and possibly leading to different design or narrative structures.
Using our findings in Study 1 and four pilots with one pair and three single students in cinematography and human-computer interaction, we refined the facts and visualizations to use. We extracted a set of 12 different data facts covering several distinct topics in hopes of providing enough material for participants to create different stories. Examples of facts we provided are “the majority of divorces happen between ages 40 and 44”, “the average duration of marriage before divorce is 10 years”, “there are peaks in the number of divorces after world war 2 in 1945 and after the divorce reform act in 1971”. To illustrate each of the facts, we used 22 data visualizations and infographics all of which were amongst the most common types found through our first study and extracted from blogs or news websites covering these stories such as the Guardian; or created from the raw data using Excel.
Procedure
We conducted 3-hour sessions including a 15 to 20 minutes break in the middle. We initiated the session with a presentation of the study and a collection of demographics. Participants watched two data videos and we presented a hand-drawn storyboard we created for one of them to illustrate the type of output we expected. To motivate them to create the most compelling data video, we told them they would enter a contest with other groups. The most compelling storyboard would win a prize.
Figure 6. Average percentages of new fact, question, and
repetition occurrences in each narrative category.
0
20
40
60
80
100
Question
Take Away
Tension Builder
Repetition
New Fact
Average Duration %
Figure 5. Left: the average duration percentage of data
visualizations, and Right: the average duration percentage of
attention cues out of total duration of each category.
0
20
40
60
80
100
Visualization
Average Duration %
0
20
40
60
80
100
Attention Cue
Average Duration %
An experimenter was present in the experimental room at all times, to introduce the data and later play the role of the data analyst, answering questions about data and visualizations. The experimenter instructed participants to build their story from the data given to them, not allowing them to search or make up new information. The experimenter also informed the participants that data visualizations were provided as examples only and they were encouraged to design or alter the visual representations to best fit their story. Participants built their storyboards on pen and paper, using pens, pencils, markers, rulers, scissors, and colored sticky notes. We asked them to provide enough details for us to create the actual video from the storyboard. We also instructed them to “think aloud” (if single) and video recorded the session. Finally, the experimenter conducted a semi-structured interview, asking participants to describe the video they envisioned from the storyboard, to comment on their design process, and gather their impression on the quality of their story. Participants received two software gratuities.
Session and Storyboard Analysis
We collected 10 storyboards and recorded over 24 hours of video from the eight storyboarding sessions we conducted. We analyzed videos of the sessions using an open-coding approach as well as the narrative structure codes from Study 1. Two researchers (who had observed and conducted sessions) developed two initial code-sets independently, and reached to an agreement on a final code-set by iteratively coding 10% of the videos. Based on these codes, one researcher proceeded to code the remaining videos.
Characterizing Storyboard Elements/Appearance
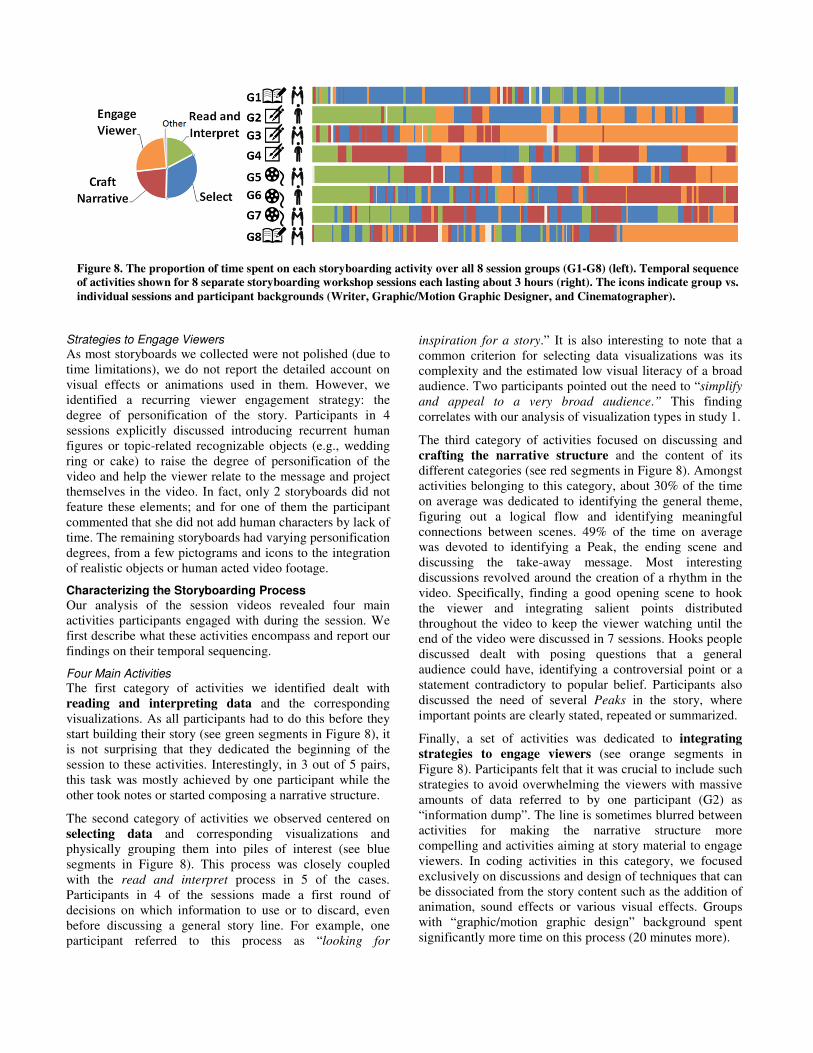
We collected a diverse set of storyboards, differing not only in their form but in their content and general intent. In this section, we do not present a deep analysis of their structure as storyboards collected were not finalized but report on key observations on their content. As an example of the artefacts we collected, Figure 7 shows a short storyboard (S10) calling viewers to action, such as collectively working toward reducing divorce rates.
Narrative Structure
We were generally surprised by the variety of stories that could be told with the same data. We gathered the intent and take away message during the final walkthrough and reported them in Table 1. All finished storyboards could be matched to narrative structure patterns we identified in study 1. For example, factual stories employed an EI+ narrative structure without any peak, but rather going over a subset of facts in order. In contrast, the storyboards building tension, or reflecting participants’ viewpoints featured a peak towards the second third of the storyboard, utilizing E+I+P, one of the most common narrative structure pattern.
Story
Type Storyboard Content
Factual (3)
S1 & S2. Presents temporal trends in marriage and divorce rates S3. Presents temporal trends in marriage and divorce rates and speculate on reasons
Tension builders
(2)
S4. Unveils only part of the trends then reveal recent changes. S5. “Are they going to divorce?”. Sets up a married couple undergoing therapy.
View points
(3)
S6. “Marriage is not inevitable”. Advocates that lower marriage rates correspond to a positive societal change where unmarried people are better accepted. S7. “Marriages can still work out”. Advocates that even if divorces are going up, there are marriages that last. S10. “Marriage rates are going down, let’s turn this around”.
Inciting Reflection
(2)
S8. “Marriage is not about couples, it is about individuals”. Demonstrate that higher divorce rates today from the fact that it is less advantageous for individuals to be married. S9. Advocates that in a world increasingly materialist, husbands and wives become disposable commodities, leading to higher divorce rates.
Table 1. Content of the 10 storyboards created by participants.
Figure 7. Example Storyboard (Royal Wedding UK).
The first panel features a video clip from William and Kate’s royal wedding and voice over stating that marriage rates were about 49% in 2012. The next panel features a video clip from Charles and Diana’s wedding, 20 years earlier with the voice overstating that marriage rates were 62% then. The third panel stars a bar chart, representing the trends in marriage rates over by different heights of wedding cakes. The fourth panel shows a cupcake representing the projected low rates 30 years from now. The final panel invites the viewer to turn this trend around, featuring an animation where cake layers are added below the cupcake.
Strategies to Engage Viewers
As most storyboards we collected were not polished (due to time limitations), we do not report the detailed account on visual effects or animations used in them. However, we identified a recurring viewer engagement strategy: the degree of personification of the story. Participants in 4 sessions explicitly discussed introducing recurrent human figures or topic-related recognizable objects (e.g., wedding ring or cake) to raise the degree of personification of the video and help the viewer relate to the message and project themselves in the video. In fact, only 2 storyboards did not feature these elements; and for one of them the participant commented that she did not add human characters by lack of time. The remaining storyboards had varying personification degrees, from a few pictograms and icons to the integration of realistic objects or human acted video footage.
Characterizing the Storyboarding Process
Our analysis of the session videos revealed four main activities participants engaged with during the session. We first describe what these activities encompass and report our findings on their temporal sequencing.
Four Main Activities
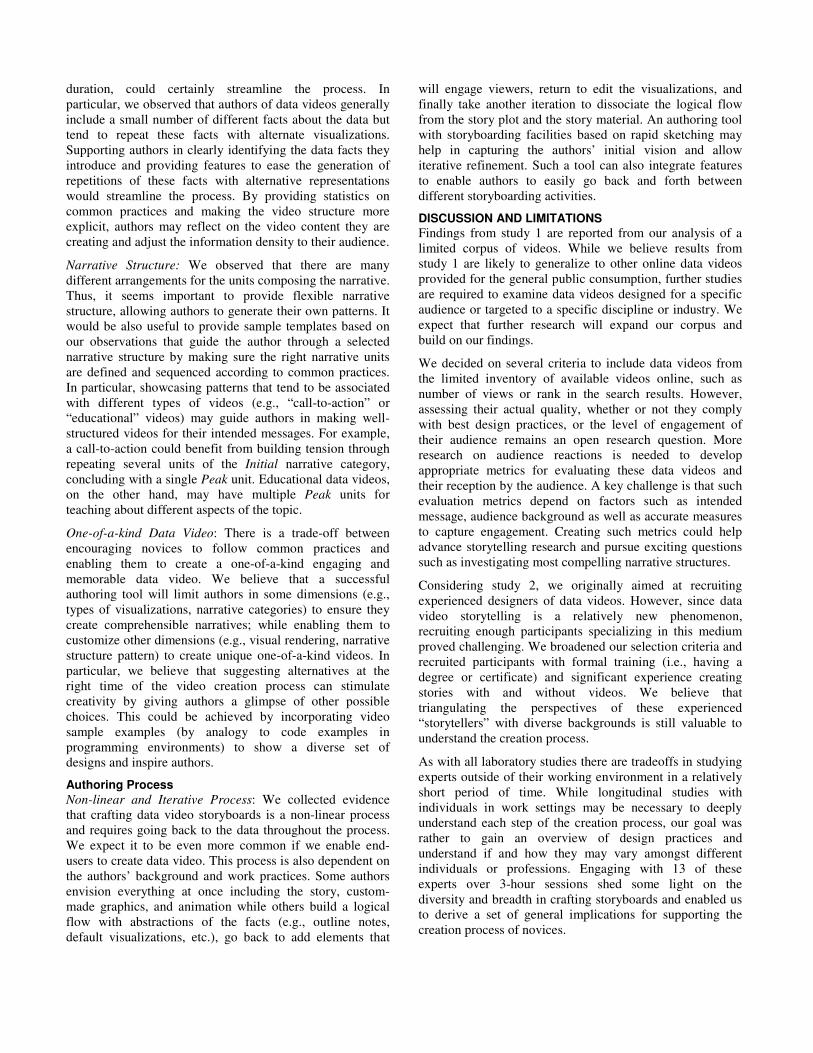
The first category of activities we identified dealt with reading and interpreting data and the corresponding visualizations. As all participants had to do this before they start building their story (see green segments in Figure 8), it is not surprising that they dedicated the beginning of the session to these activities. Interestingly, in 3 out of 5 pairs, this task was mostly achieved by one participant while the other took notes or started composing a narrative structure.
The second category of activities we observed centered on selecting data and corresponding visualizations and physically grouping them into piles of interest (see blue segments in Figure 8). This process was closely coupled with the read and interpret process in 5 of the cases. Participants in 4 of the sessions made a first round of decisions on which information to use or to discard, even before discussing a general story line. For example, one participant referred to this process as “looking for
inspiration for a story.” It is also interesting to note that a common criterion for selecting data visualizations was its complexity and the estimated low visual literacy of a broad audience. Two participants pointed out the need to “simplify
and appeal to a very broad audience.” This finding correlates with our analysis of visualization types in study 1.
The third category of activities focused on discussing and crafting the narrative structure and the content of its different categories (see red segments in Figure 8). Amongst activities belonging to this category, about 30% of the time on average was dedicated to identifying the general theme, figuring out a logical flow and identifying meaningful connections between scenes. 49% of the time on average was devoted to identifying a Peak, the ending scene and discussing the take-away message. Most interesting discussions revolved around the creation of a rhythm in the video. Specifically, finding a good opening scene to hook the viewer and integrating salient points distributed throughout the video to keep the viewer watching until the end of the video were discussed in 7 sessions. Hooks people discussed dealt with posing questions that a general audience could have, identifying a controversial point or a statement contradictory to popular belief. Participants also discussed the need of several Peaks in the story, where important points are clearly stated, repeated or summarized.
Finally, a set of activities was dedicated to integrating
strategies to engage viewers (see orange segments in Figure 8). Participants felt that it was crucial to include such strategies to avoid overwhelming the viewers with massive amounts of data referred to by one participant (G2) as “information dump”. The line is sometimes blurred between activities for making the narrative structure more compelling and activities aiming at story material to engage viewers. In coding activities in this category, we focused exclusively on discussions and design of techniques that can be dissociated from the story content such as the addition of animation, sound effects or various visual effects. Groups with “graphic/motion graphic design” background spent significantly more time on this process (20 minutes more).
Figure 8. The proportion of time spent on each storyboarding activity over all 8 session groups (G1-G8) (left). Temporal sequence
of activities shown for 8 separate storyboarding workshop sessions each lasting about 3 hours (right). The icons indicate group vs.
individual sessions and participant backgrounds (Writer, Graphic/Motion Graphic Designer, and Cinematographer).

Non-Linear and Iterative Process
While participants devoted about the same amount of time for each set of activities overall (Figure 8-left), our detailed analysis of the activities during the sessions (Figure 8-right) confirmed that the creation process was non-linear. Participants in all eight sessions alternated between different set of activities. For example G3 (3rd sequence from top in Figure 8) closely coupled selecting data and crafting the narrative structure (blue and red segments) and later in the session alternated between crafting the narrative structure and integrating strategies to engage viewers (red and orange segments). We were surprised to observe some participants (e.g. G3) incorporating user engagement strategies early in the session, before having crafted an end-to-end narrative structure or even before deciding on a take-away message.
We also observed that the process was iterative. Participants may craft an end-to-end narrative structure with a first set of data and visualizations and iteratively add to their storyboard. This could either be done by selecting additional data visualization to expand on some points, or by altering the narrative structure to integrate elements to engage viewers. Semi-structured interviews at the end of the session revealed two types of iterative process. A writer in G1 explained that she works in waves, as she write novels: first crafting a logical flow from end-to-end, second reviewing this flow to extract the most exciting plot, adding and removing elements, third integrating engaging elements such as humor or recurring characters and fourth designing visual materials to provide a consistent feel. In contrast, a motion graphics designer in G3 explained that he would build a complete vision in his head, capture it through a rough draft and iterate on this draft to turn it into a product.
DESIGN IMPLICATIONS
We summarize our main findings regarding common practices for data videos design and derive a set of implications for data video authoring tool for novices.
Data Video Content
Visualization types: It is not surprising that the designers of data videos heavily rely on data visualizations to present the facts within data (48% of the total duration on average). However, despite the viewers’ general impression that data videos each feature diverse custom visualizations, most videos rely on only a few types of well-known visualizations (e.g. bar charts, pictographs, and maps).
Limiting novice designers to a small set of commonly used visualization types but giving them the flexibility to customize their rendering options and color palette would appear as a good strategy to enable the creation of data videos that may be comprehensible to a large audience. Along this line, one of the most powerfully customizable, yet easily understood visual representations is certainly the pictograph, composed of icons representing data units. While most visual analytics tools and commercial charting tools do not offer much support to create these
visualizations, they are heavily present in data videos and certainly should feature in data video authoring software.
Whether an authoring tool should also support the creation of more advanced visual representations, or even help authors design their own custom visual encodings remains an open question. We believe that such a direction could prove beneficial but would require assisting the author into creating an accompanying set of visuals and attention cues to help a general viewer correctly decode and understand the visualization. Further research is needed to understand how to preserve viewer engagement while respecting the general level of visual literacy as seen in our current day society.
Attention Cues: Attention cues are used throughout data videos to guide viewer attention, highlight specific parts of the data, or help a seamless transition between different aspects of data. While camera effects, highlighting, and text animations are commonly integrated in presentation software such as PowerPoint, data video authoring should also provide support for including voice narration and soundtrack which are present in almost all data videos we studied. Enabling authors to carefully time these different cues to support the narrative rather than obfuscating the facts poses a challenge. By guiding authors into using an explicit narrative structure for their videos, hints on the type, frequency and strength of attention cues they can use, based on concrete examples as from our sample list, can help authors achieve the right balance.
We were also surprised that only few of these attention cues were tightly coupled with the data (mostly highlighting and filtering). Other cues such as gradually changing the layout or visual encoding according to different data attributes could enhance data videos with data-driven attention cues.
Engaging Viewers: Our observations in both studies indicate that the audience is more engaged if facts told in the story relate to something they know. Observations from workshops hinted at several degrees of personification, such as including human figures or object icons, introducing recurring characters or human-acted video footages (e.g., initiating the video on marriage statistics by the video footage of the UK royal wedding in Figure 7). Supporting authors in finding such assets and enabling them to tightly couple them with visualizations (e.g., animating a pie chart into a wedding ring, using the wedding ring in a pictograph) would ease one of the most tedious part of visual editing. In addition, providing features to tie the video together, such as including recurring animated characters or objects (e.g., whiteboard sketching hand as in the VideoScribe software) could help create more engaging videos.
Narrative Structure
Narrative Categories: We believe that identifying different building blocks of a narrative (Establisher, Initial, Peak, and Release) could play a central role in a data video authoring tool. Making these building blocks explicit and suggesting the types of content commonly used in them, as well as their
duration, could certainly streamline the process. In particular, we observed that authors of data videos generally include a small number of different facts about the data but tend to repeat these facts with alternate visualizations. Supporting authors in clearly identifying the data facts they introduce and providing features to ease the generation of repetitions of these facts with alternative representations would streamline the process. By providing statistics on common practices and making the video structure more explicit, authors may reflect on the video content they are creating and adjust the information density to their audience.
Narrative Structure: We observed that there are many different arrangements for the units composing the narrative. Thus, it seems important to provide flexible narrative structure, allowing authors to generate their own patterns. It would be also useful to provide sample templates based on our observations that guide the author through a selected narrative structure by making sure the right narrative units are defined and sequenced according to common practices. In particular, showcasing patterns that tend to be associated with different types of videos (e.g., “call-to-action” or “educational” videos) may guide authors in making well-structured videos for their intended messages. For example, a call-to-action could benefit from building tension through repeating several units of the Initial narrative category, concluding with a single Peak unit. Educational data videos, on the other hand, may have multiple Peak units for teaching about different aspects of the topic.
One-of-a-kind Data Video: There is a trade-off between encouraging novices to follow common practices and enabling them to create a one-of-a-kind engaging and memorable data video. We believe that a successful authoring tool will limit authors in some dimensions (e.g., types of visualizations, narrative categories) to ensure they create comprehensible narratives; while enabling them to customize other dimensions (e.g., visual rendering, narrative structure pattern) to create unique one-of-a-kind videos. In particular, we believe that suggesting alternatives at the right time of the video creation process can stimulate creativity by giving authors a glimpse of other possible choices. This could be achieved by incorporating video sample examples (by analogy to code examples in programming environments) to show a diverse set of designs and inspire authors.
Authoring Process
Non-linear and Iterative Process: We collected evidence that crafting data video storyboards is a non-linear process and requires going back to the data throughout the process. We expect it to be even more common if we enable end-users to create data video. This process is also dependent on the authors’ background and work practices. Some authors envision everything at once including the story, custom-made graphics, and animation while others build a logical flow with abstractions of the facts (e.g., outline notes, default visualizations, etc.), go back to add elements that
will engage viewers, return to edit the visualizations, and finally take another iteration to dissociate the logical flow from the story plot and the story material. An authoring tool with storyboarding facilities based on rapid sketching may help in capturing the authors’ initial vision and allow iterative refinement. Such a tool can also integrate features to enable authors to easily go back and forth between different storyboarding activities.
DISCUSSION AND LIMITATIONS
Findings from study 1 are reported from our analysis of a limited corpus of videos. While we believe results from study 1 are likely to generalize to other online data videos provided for the general public consumption, further studies are required to examine data videos designed for a specific audience or targeted to a specific discipline or industry. We expect that further research will expand our corpus and build on our findings.
We decided on several criteria to include data videos from the limited inventory of available videos online, such as number of views or rank in the search results. However, assessing their actual quality, whether or not they comply with best design practices, or the level of engagement of their audience remains an open research question. More research on audience reactions is needed to develop appropriate metrics for evaluating these data videos and their reception by the audience. A key challenge is that such evaluation metrics depend on factors such as intended message, audience background as well as accurate measures to capture engagement. Creating such metrics could help advance storytelling research and pursue exciting questions such as investigating most compelling narrative structures.
Considering study 2, we originally aimed at recruiting experienced designers of data videos. However, since data video storytelling is a relatively new phenomenon, recruiting enough participants specializing in this medium proved challenging. We broadened our selection criteria and recruited participants with formal training (i.e., having a degree or certificate) and significant experience creating stories with and without videos. We believe that triangulating the perspectives of these experienced “storytellers” with diverse backgrounds is still valuable to understand the creation process.
As with all laboratory studies there are tradeoffs in studying experts outside of their working environment in a relatively short period of time. While longitudinal studies with individuals in work settings may be necessary to deeply understand each step of the creation process, our goal was rather to gain an overview of design practices and understand if and how they may vary amongst different individuals or professions. Engaging with 13 of these experts over 3-hour sessions shed some light on the diversity and breadth in crafting storyboards and enabled us to derive a set of general implications for supporting the creation process of novices.
CONCLUSION
Data videos are a relatively new yet popular medium for storytelling with data. Our research community can benefit from in-depth studies than help to catalog our knowledge on this exciting medium. Such knowledge can also inform the design of tools to make it possible for a broader audience to craft compelling ones. We consider our work a step toward this goal. Through two exploratory studies, we advance the body of knowledge on what constitutes data videos as well as provide insights on the processes involved to create them. We first reported on the qualitative analysis of 50 data videos, extracting their most salient elements including types of visualizations and attention cues. We also examined their narrative structure and described the wide range of patterns used in data videos. Finally, we observed how experienced storytellers from cinematography and screenplay writing design storyboards for data videos and reported on their process. We concluded on a set of broader implications for the design of data video authoring tools to enable general users to create the necessary pieces. In the future, we plan to iteratively design a data video authoring tool to assist novice users in creating engaging and memorable one-of-a-kind data videos.
ACKNOWLEDGMENTS
We acknowledge a NSERC grant awarded to the last author for part of this work. We also thank MSR for recruiting participants and Ashkan Hagshenas for helping with Study2.
REFERENCES
1. Divorces in 2012. http://www.ons.gov.uk/ons/rel/vsob1/divorces-in-england-and-wales/index.html.
2. The general (1926). http://explore.bfi.org.uk/ 4ce2b6aae85f3.
3. Oxford online dictionary. http://www.oxforddictionaries.com.
4. Use a picture. it’s worth a thousand words. Speakers Give Sound Advice, Syracuse Post Standard (page 18), March 28, 1911.
5. 99% v 1%: the data behind the occupy movement. http://www.theguardian.com/news/datablog/video/2011/nov/16/99-v-1-occupy-data-animation, 2012.
6. Global air traffic. http://www.rightcolours.com/portfolio2.html, 2012.
7. Racing against history. http://www.nytimes.com/ interactive/2012/08/01/sports/olympics/racing-against-history.html?_r=0, 2012.
8. An infographic exploration of online video. http://www.shutterstock.com/blog/an-infographic-exploration-of-online-video, Shutterstock, 2014.
9. Bateman, S., Mandryk, R. L., Gutwin, C., Genest, A., McDine, D., and Brooks, C. Useful junk?: the effects of visual embellishment on comprehension and memorability of charts. Proc. CHI, 2573–2582, 2010.
10. Borkin, M. A., Vo, A. A., Bylinskii, Z., Isola, P., Sunkavalli, S., Oliva, A., and Pfister, H. What makes a
visualization memorable? IEEE TVCG (InfoVis ’13) 19, 12 (2013), 2306–2315.
11. Brehmer, M., Carpendale, S., Lee, B., and Tory, M. Pre-design empiricism for information visualization: Scenarios, methods, and challenges. Proc. BELIV
Workshop, ACM Press (2014), 147–151. 12. Satyanarayan, A. and Heer, J. Authoring narrative
visualizations with ellipsis. Proc. EuroVis, (2014). 13. Cohn, N. Visual narrative structure. Cognitive science
37, 3 (2013), 413–452. 14. Eccles, R., Kapler, T., Harper, R., and Wright, W.
Stories in geotime. Information Visualization 7, 1 (2008), 3–17.
15. Freytag, G. Technique of the Drama: An Exposition of Dramatic Composition and Art. University Press of the Pacific, 1904.
16. Gershon, N., and Page, W. What storytelling can do for information visualization. CACM 44, 8 (2001), 31–37.
17. Glaser, B. G., and Strauss, A. L. The discovery of grounded theory: Strategies for qualitative research. Transaction Publishers, 2009.
18. Heer, J., Mackinlay, J., Stolte, C., and Agrawala, M. Graphical histories for visualization: Supporting analysis, communication, and evaluation. IEEE TVCG
(InfoVis ’08) 14, 6 (2008), 1189–1196. 19. Hullman, J., and Diakopoulos, N. Visualization rhetoric:
Framing effects in narrative visualization. IEEE TVCG
(InfoVis ’11) 17, 12 (2011), 2231–2240. 20. Hullman, J., Drucker, S., Riche, N. H., Lee, B., Fisher,
D., and Adar, E. A deeper understanding of sequence in narrative visualization. IEEE TVCG (InfoVis ’13) 19, 12 (2013), 2406–2415.
21. Jern, M., Rogstadius, J., Astrom, T., and Ynnerman, A. Visual analytics presentation tools applied in html documents. Proc. IV, IEEE (2008), pp. 200–207.
22. Kosara, R., and Mackinlay, J. Storytelling: The next step for visualization. IEEE Computer 46, 5 (2013), 44–50.
23. Ma, K.-L., Liao, I., Frazier, J., Hauser, H., and Kostis, H.-N. Scientific storytelling using visualization. IEEE
CG&A 32, 1 (2012), 12–19. 24. Mascelli, J. V. The five C’s of cinematography. 25. McCloud, S. Understanding comics: The invisible art.
William Morrow Paperbacks, 1994. 26. Richards, L. Handling qualitative data: A practical guide.
Sage Publications, 2009. 27. Segel, E., and Heer, J. Narrative visualization: Telling
stories with data. IEEE TVCG (InfoVis ’10) 16, 6 (2010), 1139–1148.
28. Viegas, F. B., Wattenberg, M., van Ham, F., Kriss, J., and McKeon, M. Manyeyes: a site for visualization at internet scale. IEEE TVCG (InfoVis ’07) 13, 6 (2007), 1121–1128.
29. Wojtkowski, W. and Wojtkowski, W. G. Storytelling: its role in information visualization. European Systems
Science Congress (2002).