Embed Size (px)
Citation preview

Understanding Consumer Behaviour in Information and Communication Technologies
(ICTs)
Alastair W [email protected] of Management ScienceLancaster University Management SchoolLancasterLA1 4YXUnited Kingdom
What are ICTs?
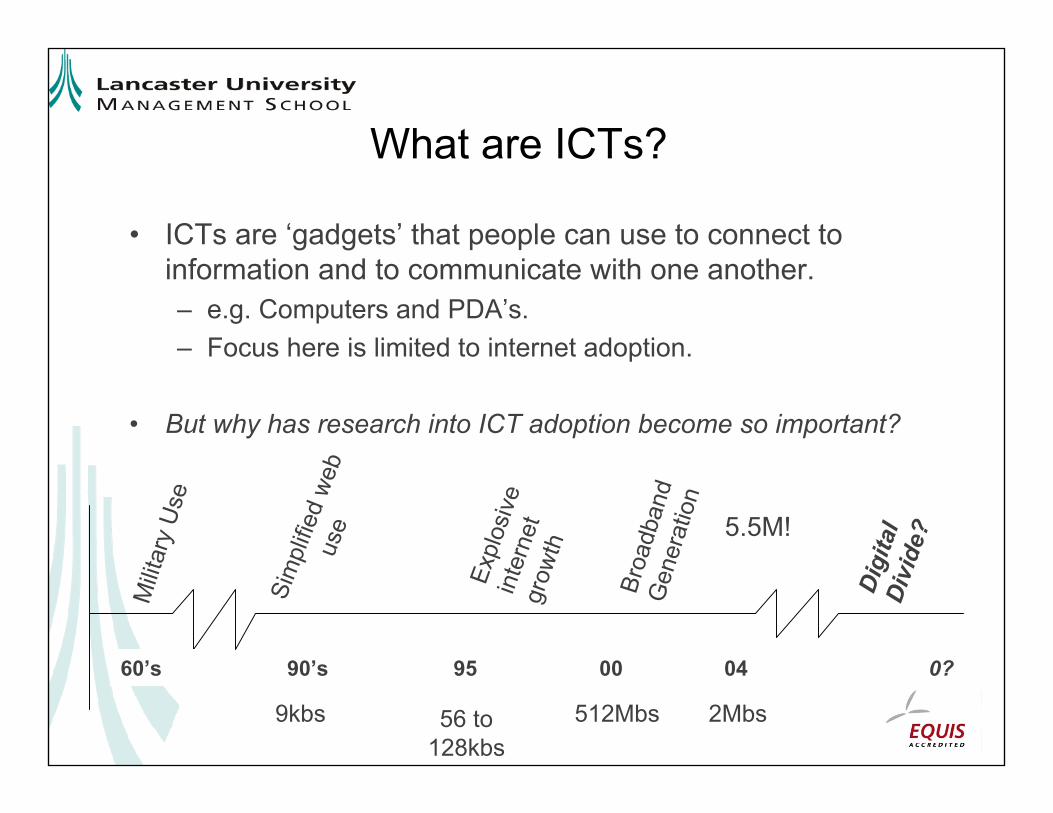
• ICTs are ‘gadgets’ that people can use to connect to information and to communicate with one another.– e.g. Computers and PDA’s. – Focus here is limited to internet adoption.
• But why has research into ICT adoption become so important?
Milit
ary
Use
Sim
plifi
ed w
eb
use
Expl
osiv
e in
tern
et
grow
th
Broa
dban
d G
ener
atio
n
5.5M!
Digi
tal
Divi
de?
60’s 90’s 95 00 0?04
9kbs 56 to 128kbs
512Mbs 2Mbs
Discussion highlights a fast changing market
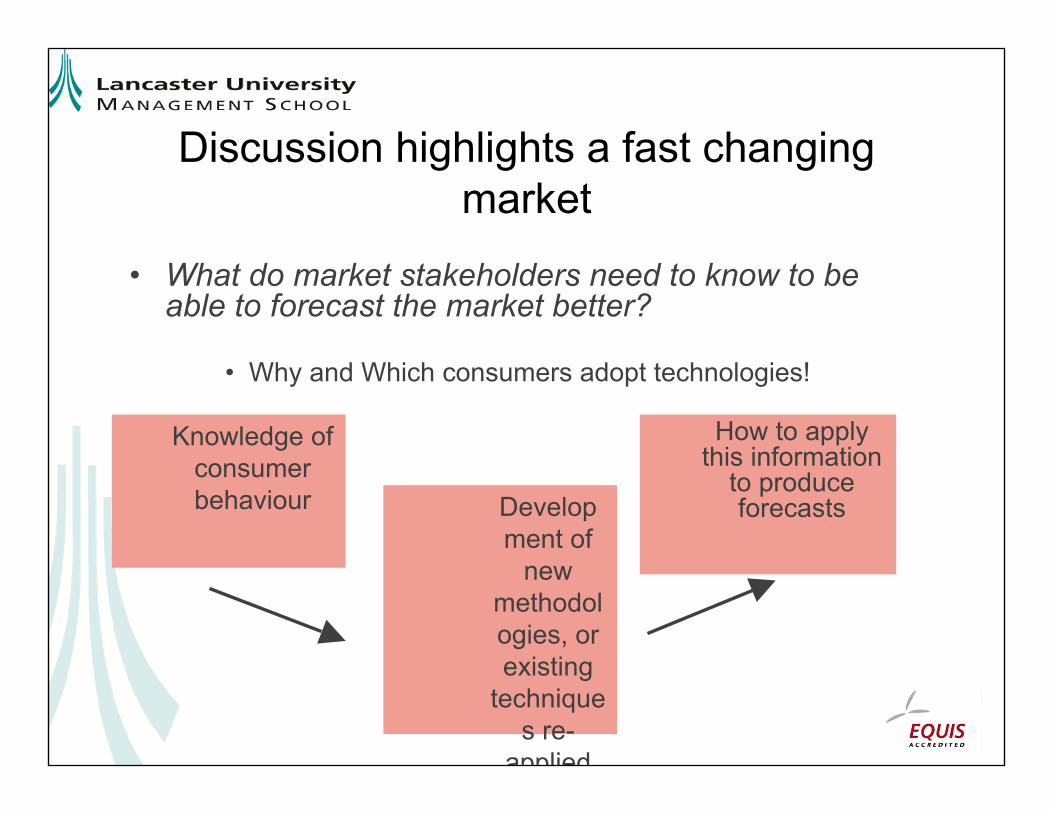
• What do market stakeholders need to know to be able to forecast the market better?
• Why and Which consumers adopt technologies!
Knowledge of consumer behaviour
How to apply this information
to produce forecastsDevelop
ment of new
methodologies, or existing
techniques re-
applied
The stakeholder positions
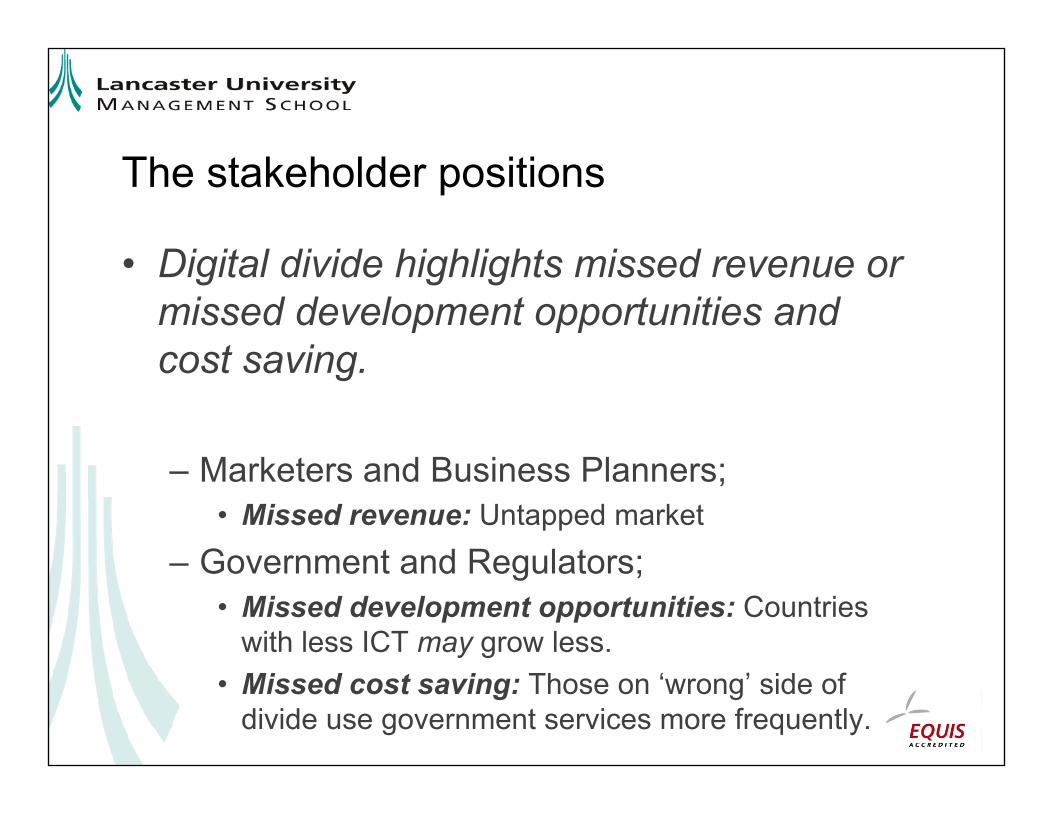
• Digital divide highlights missed revenue or missed development opportunities and cost saving.
– Marketers and Business Planners;• Missed revenue: Untapped market
– Government and Regulators;• Missed development opportunities: Countries
with less ICT may grow less. • Missed cost saving: Those on ‘wrong’ side of
divide use government services more frequently.
Focus of the Research
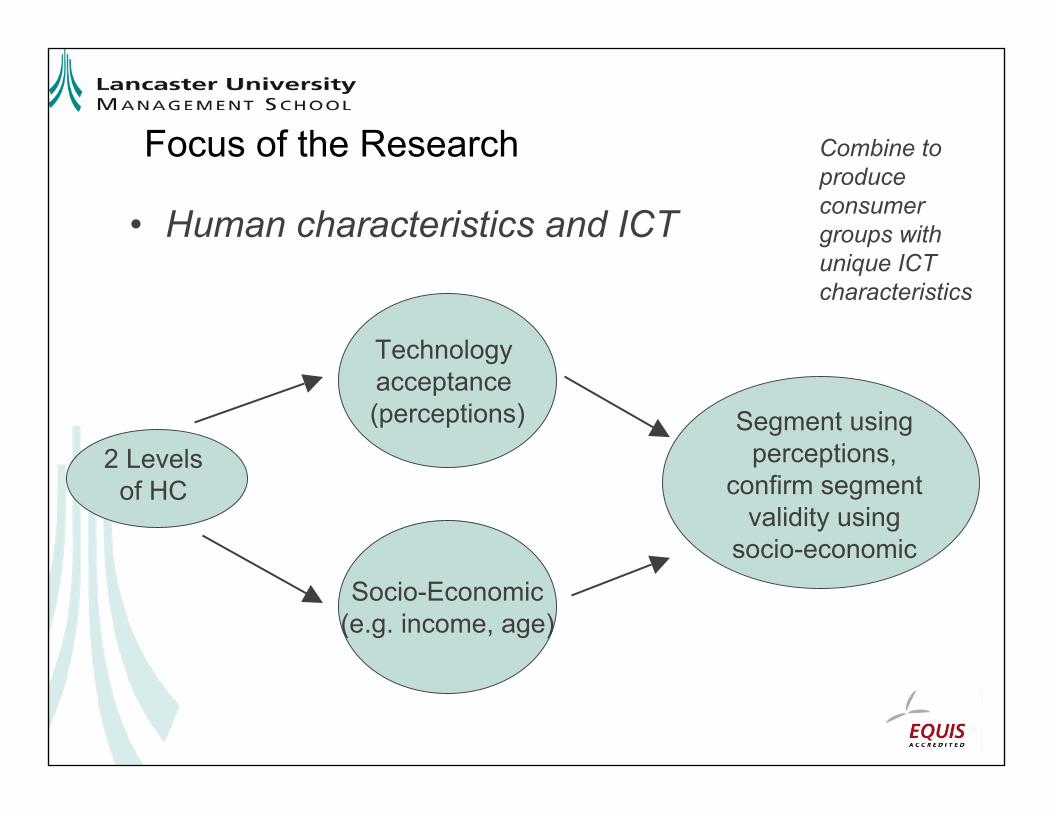
• Human characteristics and ICT
Combine to produce consumer groups with unique ICT characteristics
Technology acceptance (perceptions)
2 Levels of HC
Segment using perceptions,
confirm segment validity using
socio-economicSocio-Economic
(e.g. income, age)
Application of Human Characteristics
• Segmentation; – measure of the digital divide?
• Model estimation; – Application of choice modelling.– confirmation of what drives the digital divide.
• Experimentally, applied to the diffusion modelling process; – Introduces idea that that segmental diffusion curves can be
estimated.– Estimate of how digital divide may evolve over time.
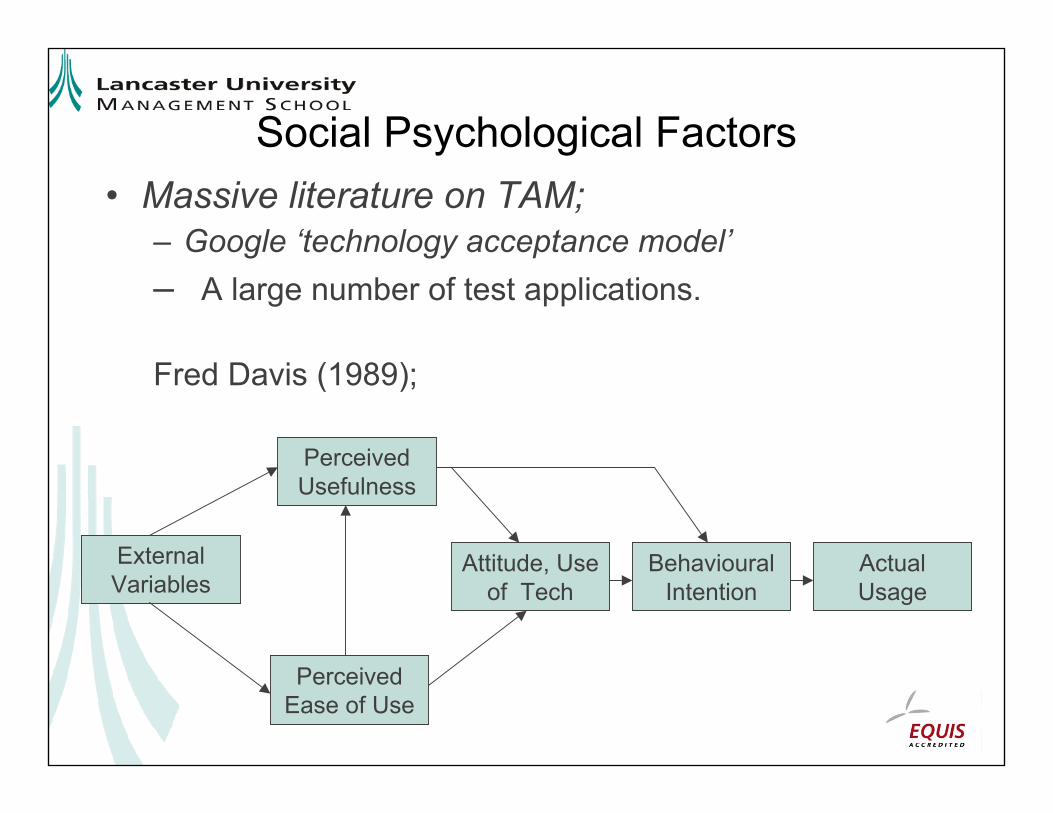
Social Psychological Factors• Massive literature on TAM;
– Google ‘technology acceptance model’– A large number of test applications.
Fred Davis (1989);
External Variables
Perceived Ease of Use
Perceived Usefulness
Attitude, Use of Tech
Behavioural Intention
Actual Usage
• Adams (1992): Usefulness and Ease of Use perceptions
– Applicable to diagnosis of user acceptance in technologies in general
– Especially applicable when adoption is voluntary
• Igbaria et al (1996): TAM research justified due to extensive expansion into ICTs by businesses, but low final use
– Similar to residential ICT adoption?
Enjoyment and ICT adoption
• An obvious point,
– If computers become more enjoyable to use, their adoption and usage will increase, Igbaria (1996)
– Perceived enjoyment distinct from U and EoU
– Three perceptions are measurable at the consumer level
• EoU, U and E
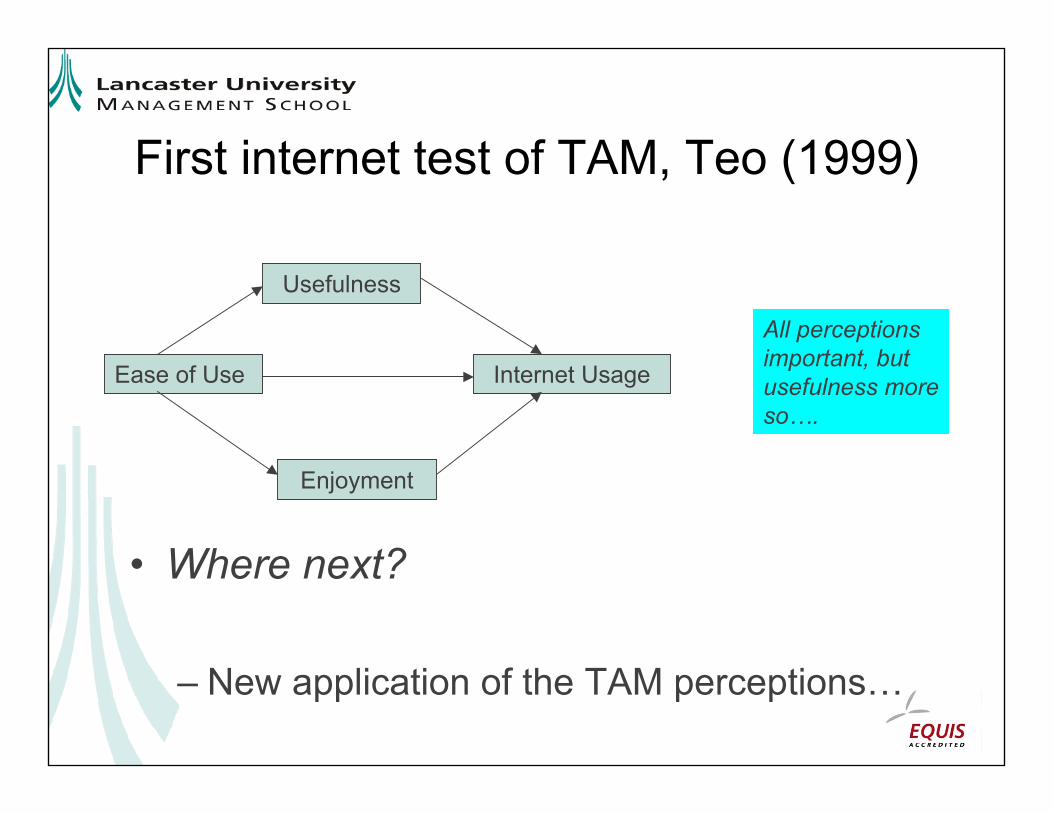
First internet test of TAM, Teo (1999)
• Where next?
– New application of the TAM perceptions…
Ease of Use
Enjoyment
Usefulness
Internet Usage
All perceptions important, but usefulness more so….
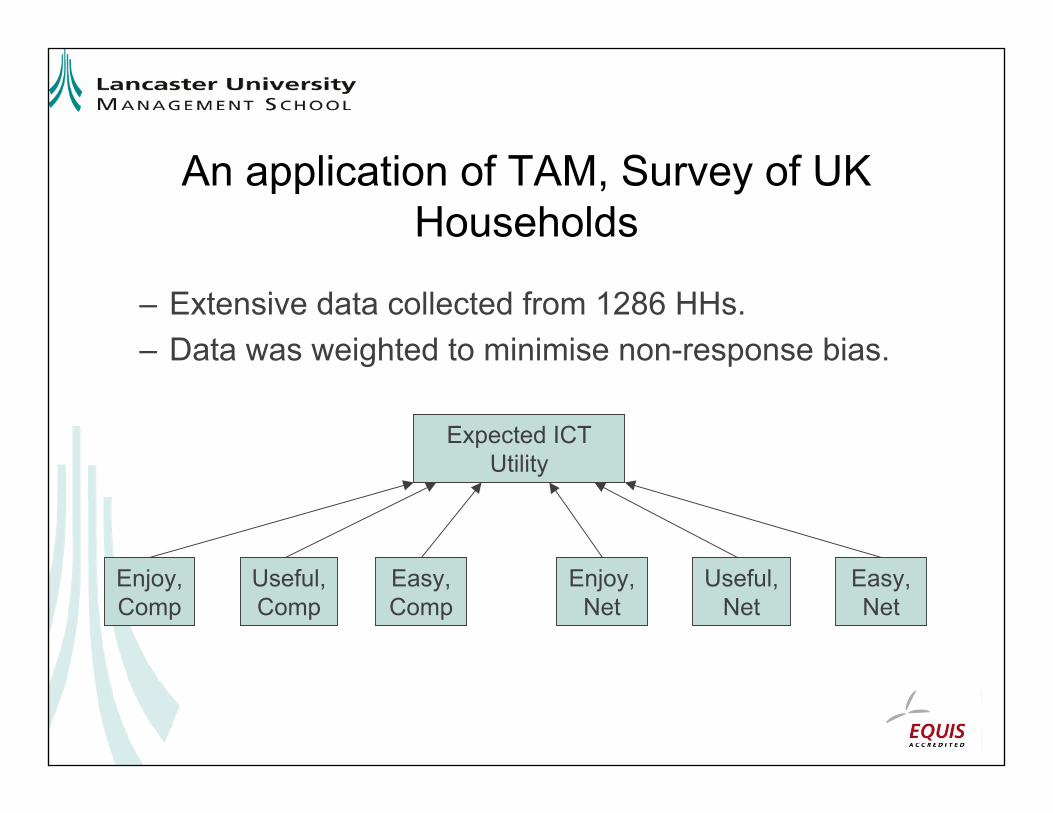
An application of TAM, Survey of UK Households
– Extensive data collected from 1286 HHs.– Data was weighted to minimise non-response bias.
Expected ICT Utility
Enjoy, Comp
Easy, Comp
Useful, Comp
Enjoy, Net
Useful, Net
Easy, Net
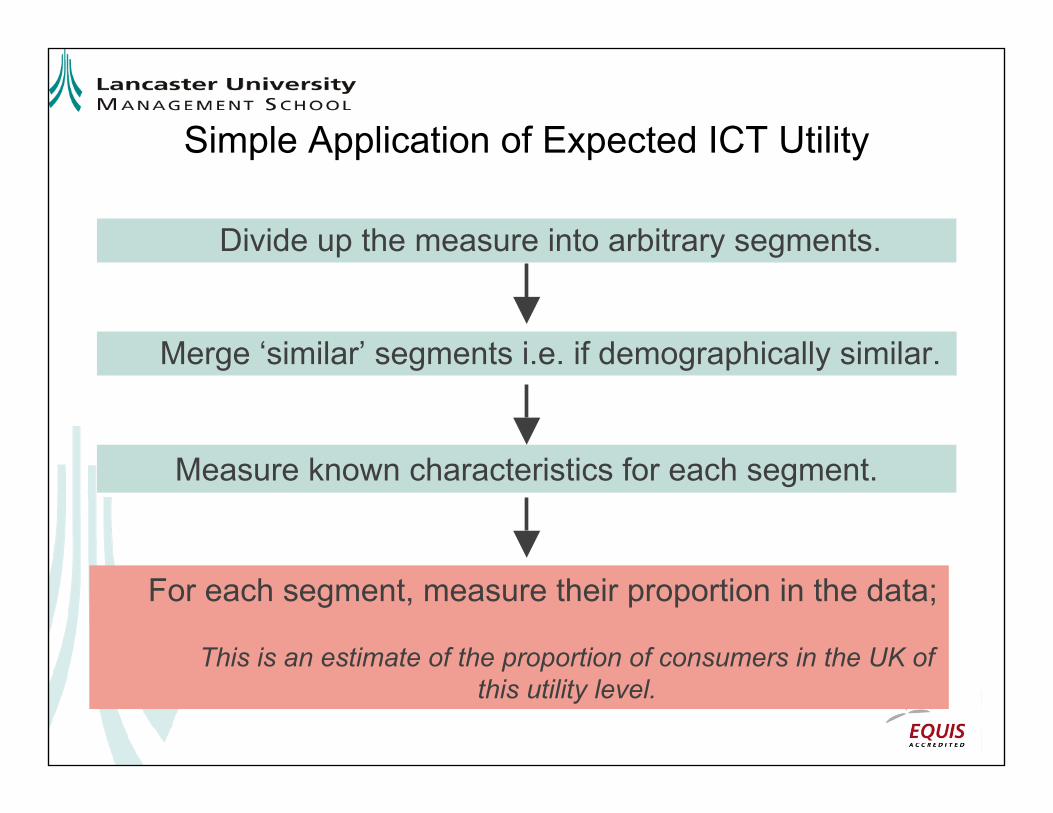
Simple Application of Expected ICT Utility
Divide up the measure into arbitrary segments.
Measure known characteristics for each segment.
Merge ‘similar’ segments i.e. if demographically similar.
For each segment, measure their proportion in the data;
This is an estimate of the proportion of consumers in the UK of this utility level.
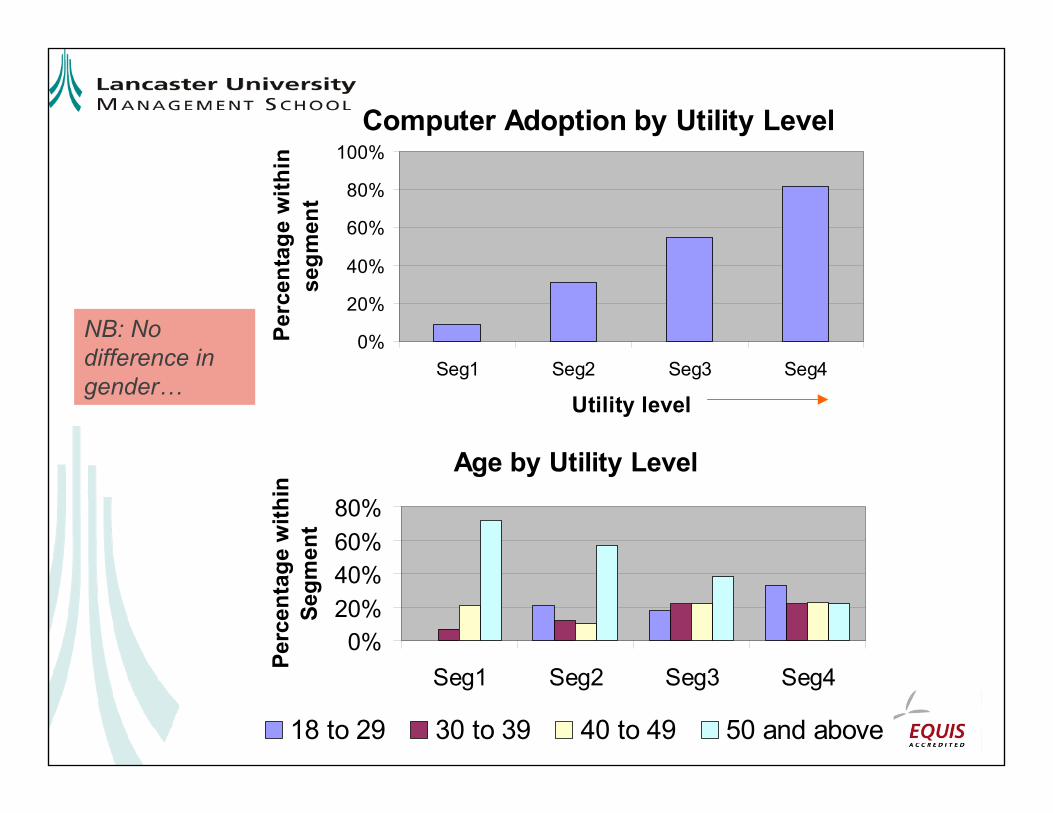
Computer Adoption by Utility Level
0%
20%
40%
60%
80%
100%
Seg1 Seg2 Seg3 Seg4
Utility level
Perc
enta
ge w
ithin
se
gmen
tNB: No difference in gender…
Age by Utility Level
0%20%40%60%80%
Seg1 Seg2 Seg3 Seg4
Perc
enta
ge w
ithin
Se
gmen
t
18 to 29 30 to 39 40 to 49 50 and above
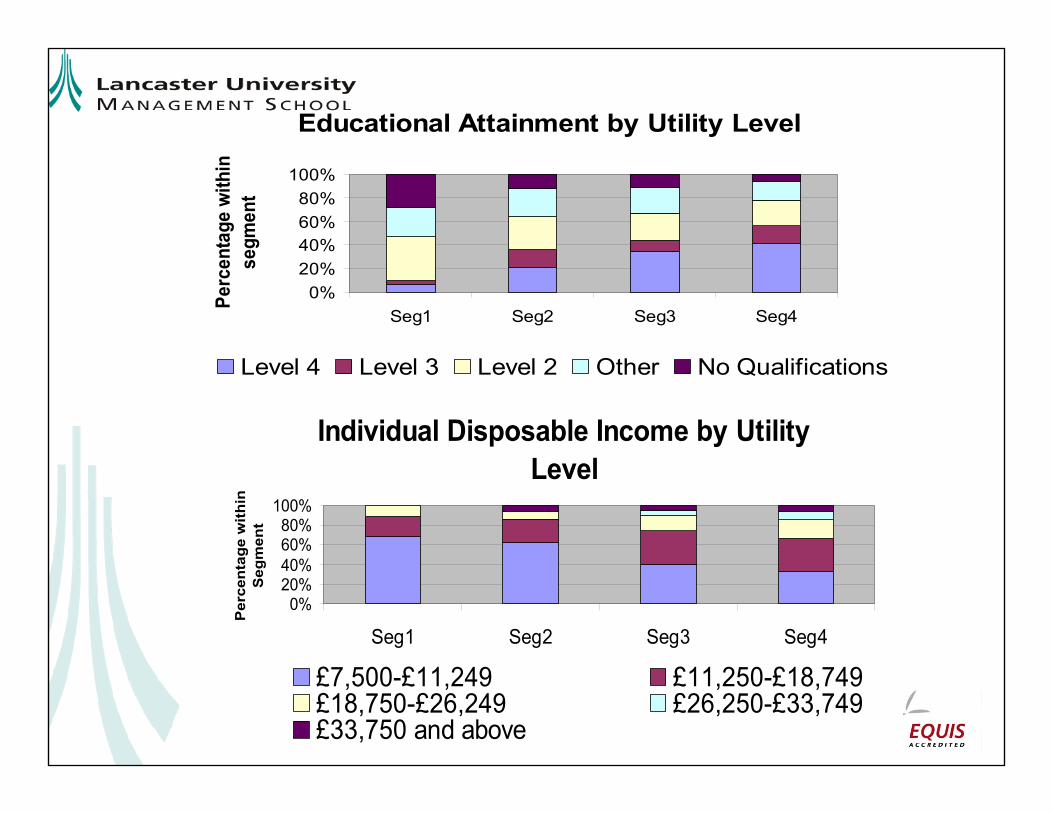
Educational Attainment by Utility Level
0%20%40%60%80%
100%
Seg1 Seg2 Seg3 Seg4
Perc
enta
ge w
ithin
se
gmen
t
Level 4 Level 3 Level 2 Other No Qualifications
Individual Disposable Income by Utility Level
0%20%40%60%80%
100%
Seg1 Seg2 Seg3 Seg4
Per
cent
age
with
in
Seg
men
t
£7,500-£11,249 £11,250-£18,749£18,750-£26,249 £26,250-£33,749£33,750 and above
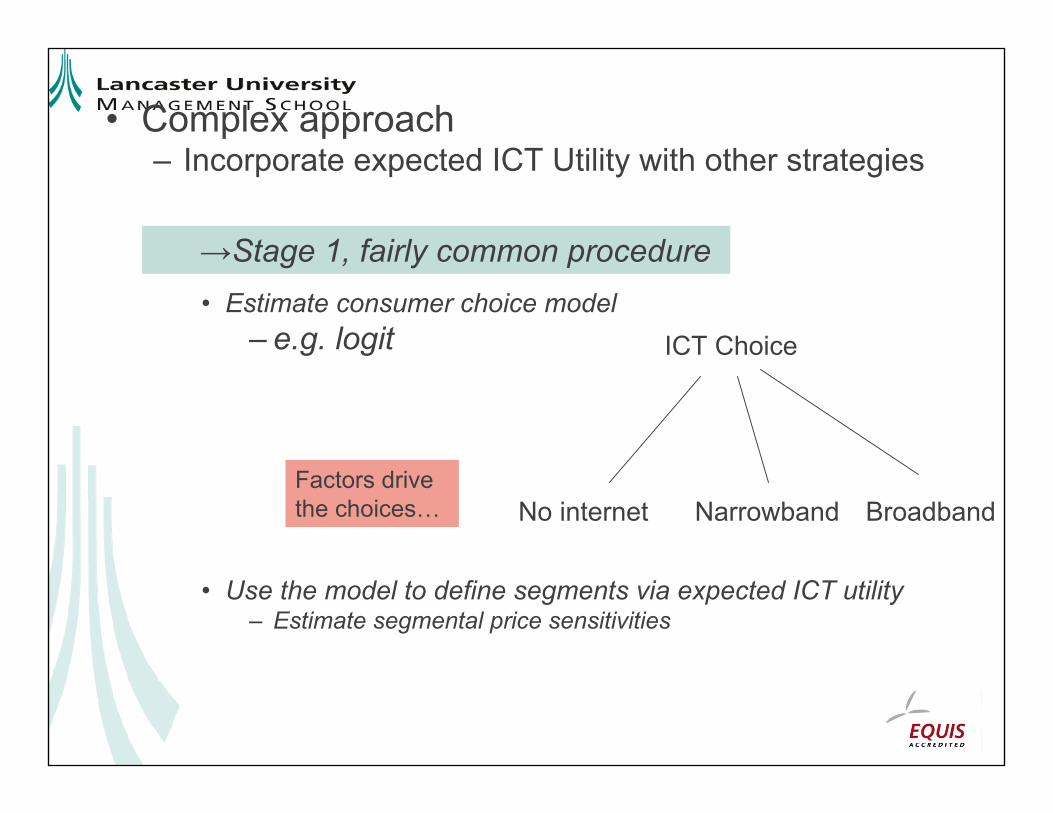
• Complex approach– Incorporate expected ICT Utility with other strategies
• Estimate consumer choice model– e.g. logit
• Use the model to define segments via expected ICT utility– Estimate segmental price sensitivities
ICT Choice
No internet Narrowband BroadbandFactors drive the choices…
→Stage 1, fairly common procedure
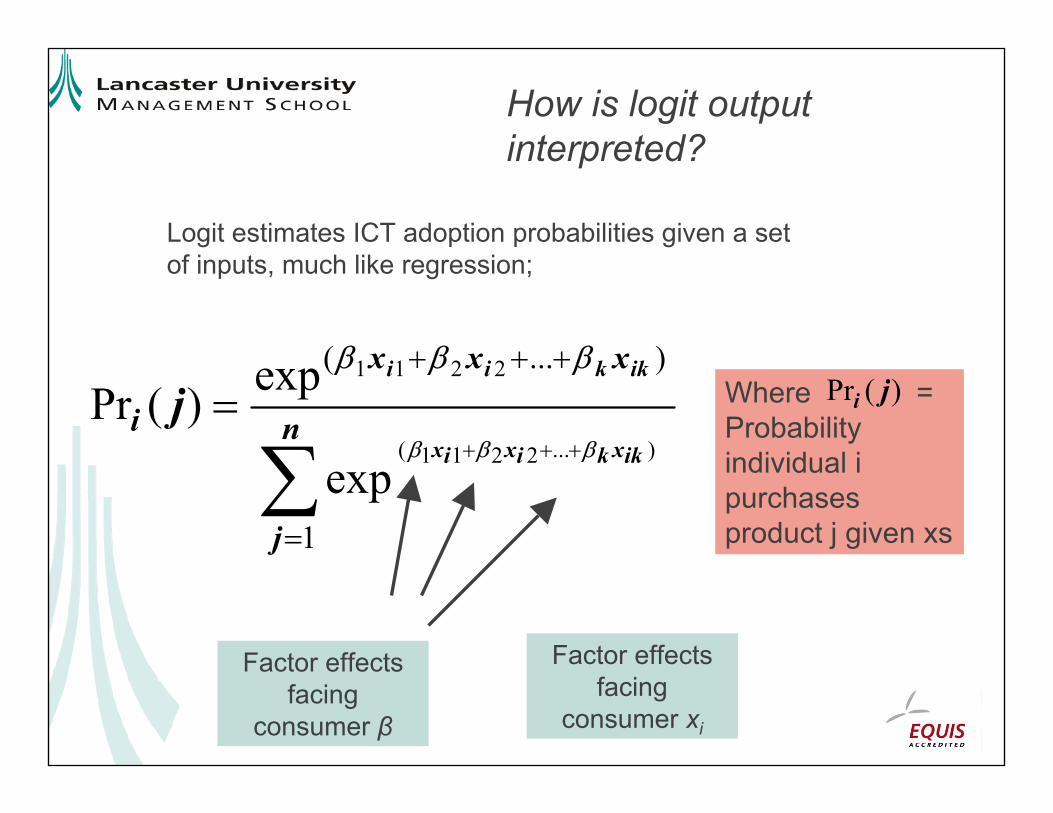
How is logit output interpreted?
Logit estimates ICT adoption probabilities given a set of inputs, much like regression;
∑=
+++
+++
= n
j
xxx
iikxkixix
ikkii
j
1
)...(
)...2211(
2211
exp
exp)(Prβββ
βββWhere = Probability individual i purchases product j given xs
)(Pr ji
Factor effects facing
consumer β
Factor effects facing
consumer xi
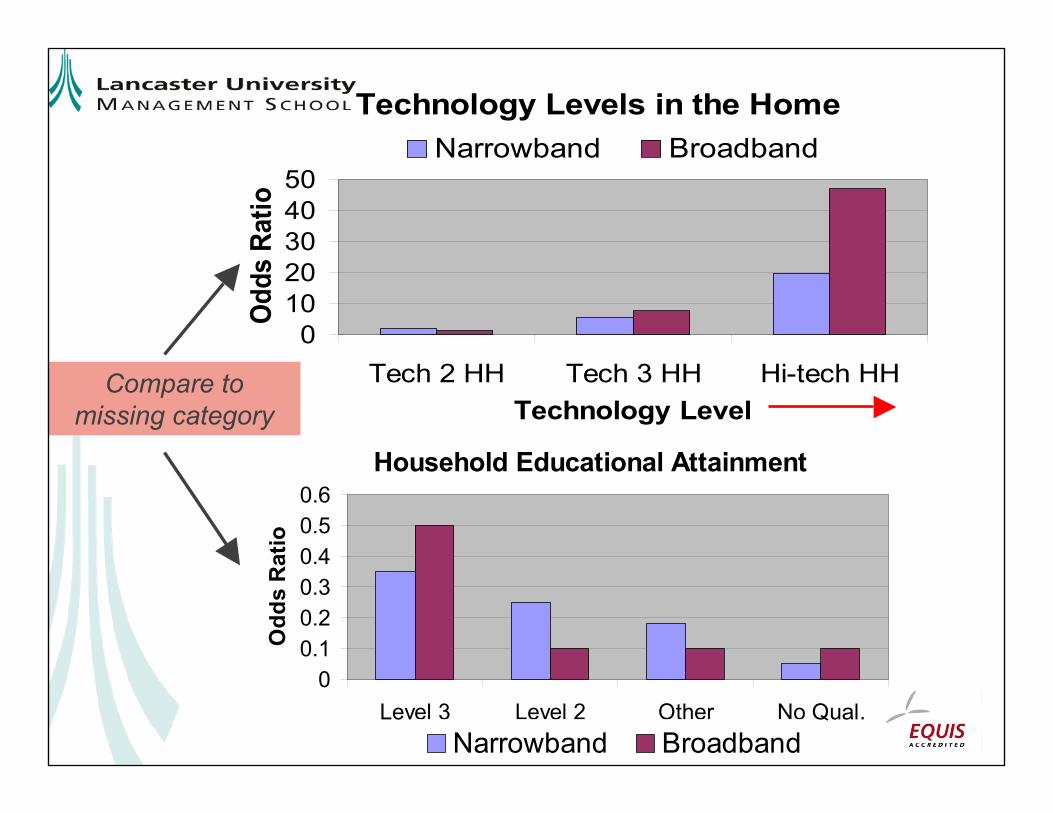
Technology Levels in the Home
01020304050
Tech 2 HH Tech 3 HH Hi-tech HHTechnology Level
Odds
Rat
io
Narrowband Broadband
Household Educational Attainment
00.10.20.30.40.50.6
Level 3 Level 2 Other No Qual.
Odd
s R
atio
Narrowband Broadband
Compare to missing category
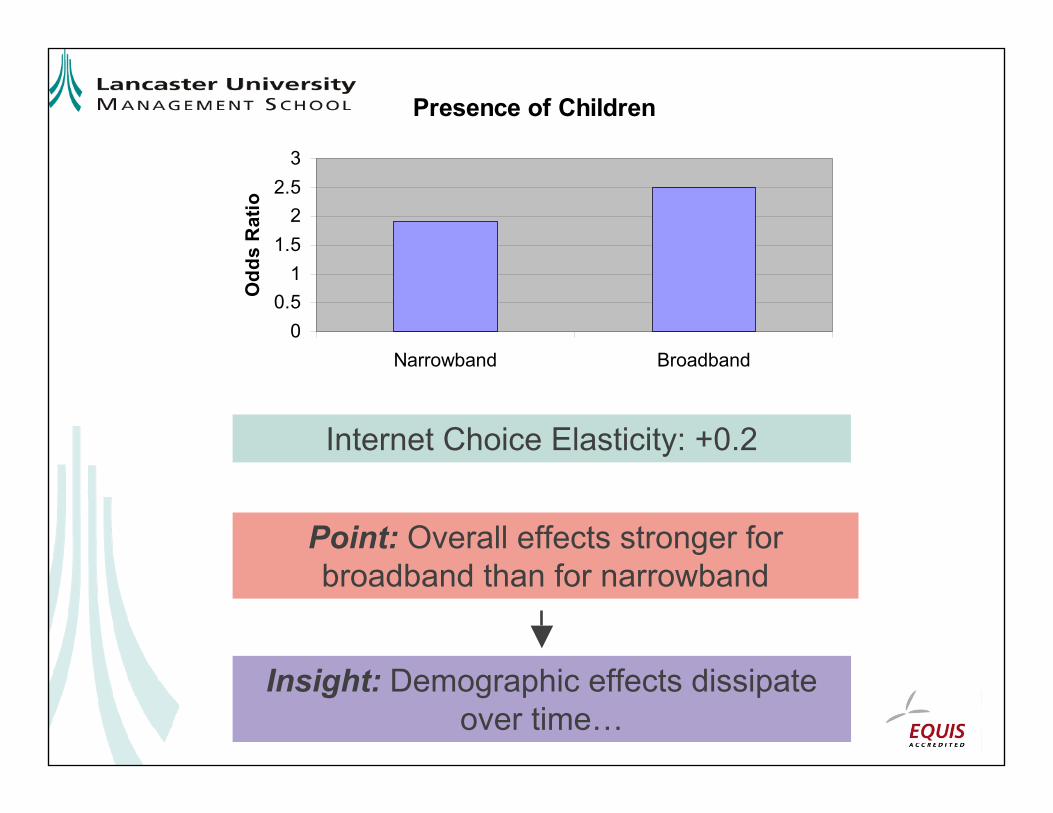
Presence of Children
00.5
11.5
22.5
3
Narrowband Broadband
Odd
s R
atio
Point: Overall effects stronger for broadband than for narrowband
Insight: Demographic effects dissipate over time…
Internet Choice Elasticity: +0.2
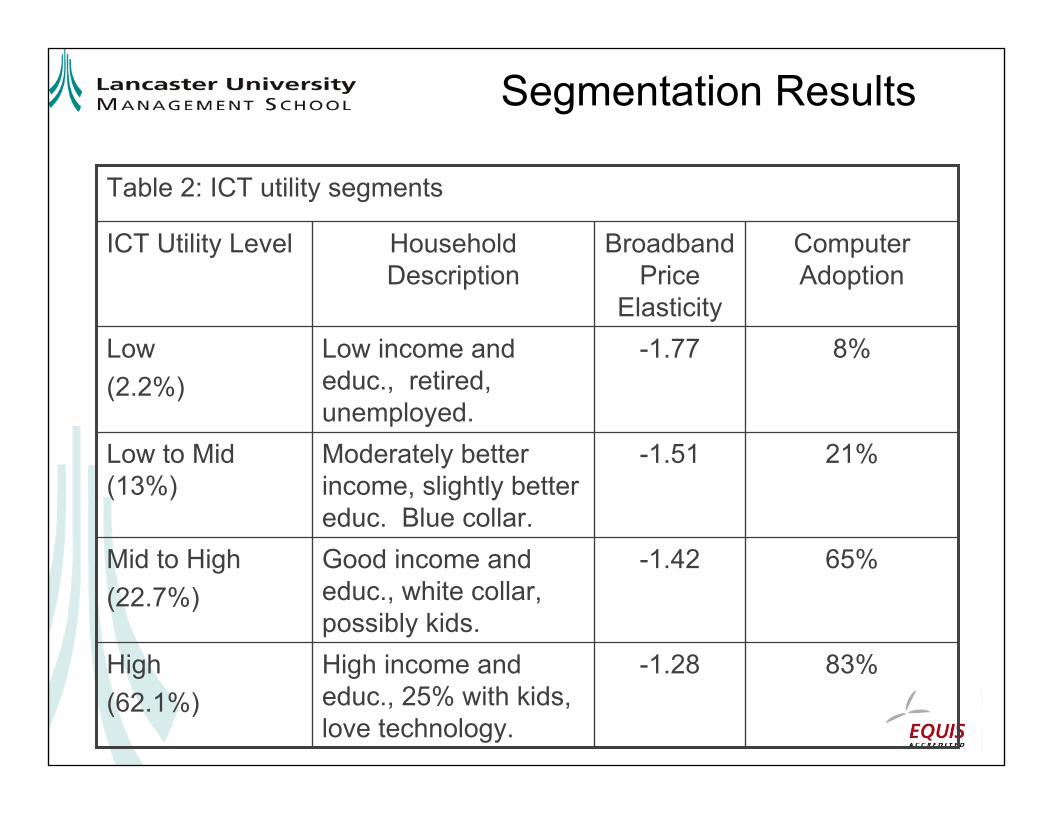
Segmentation Results
Table 2: ICT utility segments
83%-1.28High income and educ., 25% with kids, love technology.
High(62.1%)
65%-1.42Good income and educ., white collar, possibly kids.
Mid to High(22.7%)
21%-1.51Moderately better income, slightly better educ. Blue collar.
Low to Mid (13%)
8%-1.77Low income and educ., retired, unemployed.
Low (2.2%)
Computer Adoption
Broadband Price
Elasticity
Household Description
ICT Utility Level
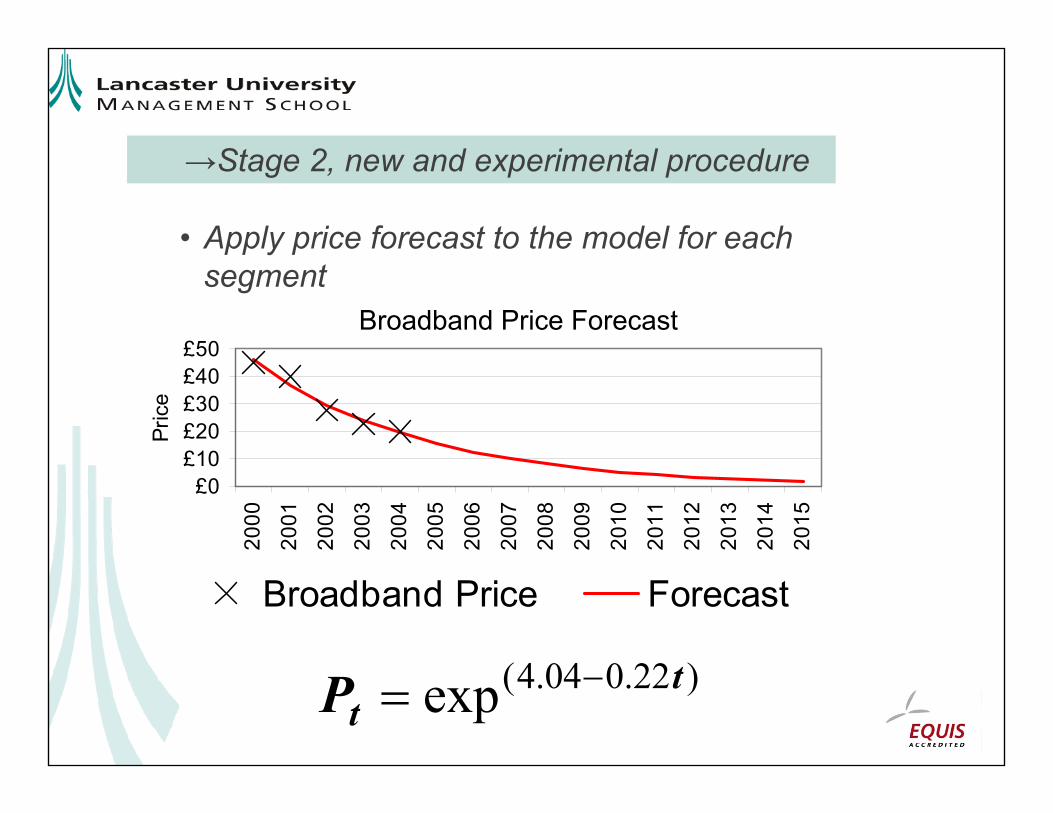
• Apply price forecast to the model for each segment
→Stage 2, new and experimental procedure
£0£10£20£30£40£50
2000
2001
2002
2003
2004
2005
2006
2007
2008
2009
2010
2011
2012
2013
2014
2015
Pric
e
Broadband Price Forecast
Broadband Price Forecast
)22.004.4(exp ttP
−=
+
−=
+−
+−
).tq(p
s
s
).tq(p
tsss
ss
epq1
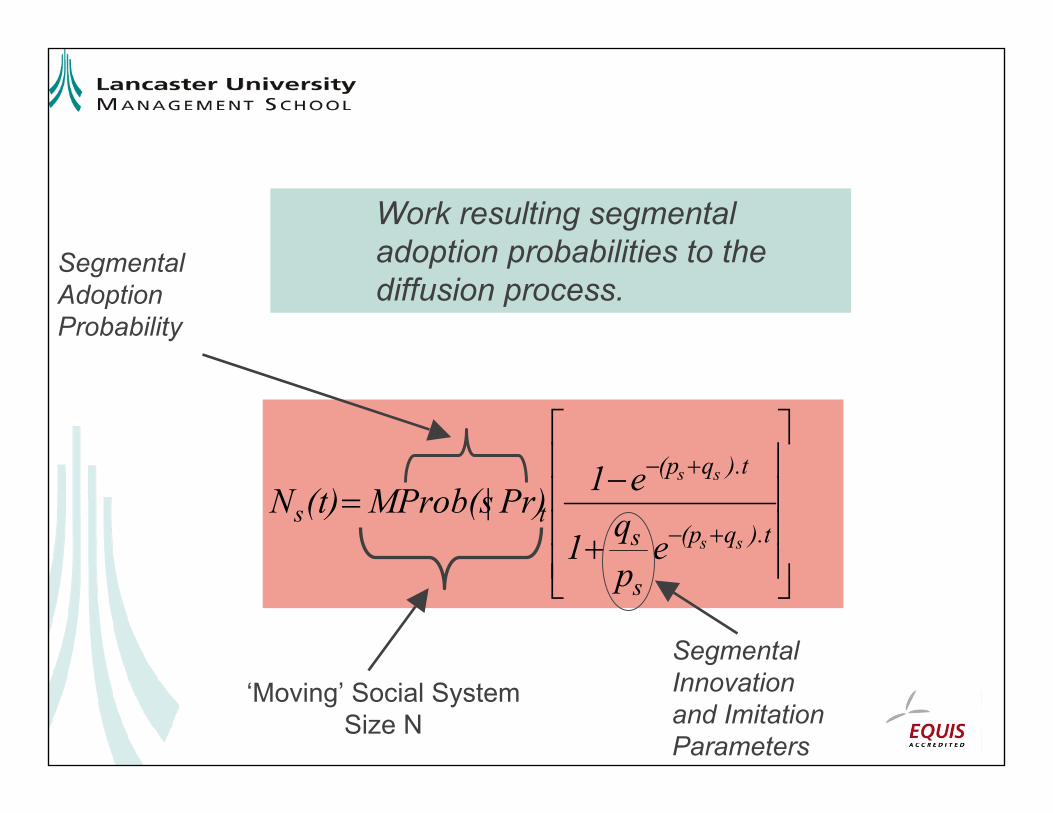
e1Pr)|MProb(s(t)N
Work resulting segmental adoption probabilities to the diffusion process.
Segmental Adoption Probability
Segmental Innovation and Imitation Parameters
‘Moving’ Social System Size N
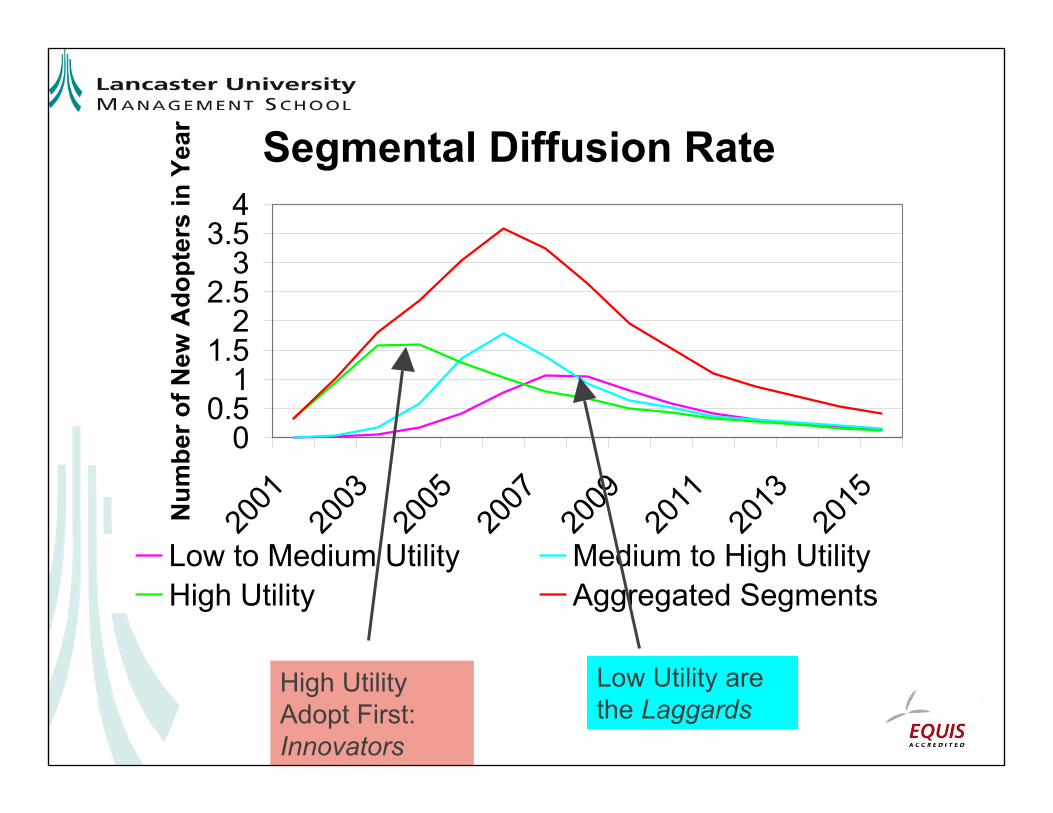
Segmental Diffusion Rate
00.5
11.5
22.5
33.5
4
2001
2003
2005
2007
2009
2011
2013
2015N
umbe
r of N
ew A
dopt
ers
in Y
ear
Low to Medium Utility Medium to High UtilityHigh Utility Aggregated Segments
High Utility Adopt First: Innovators
Low Utility are the Laggards
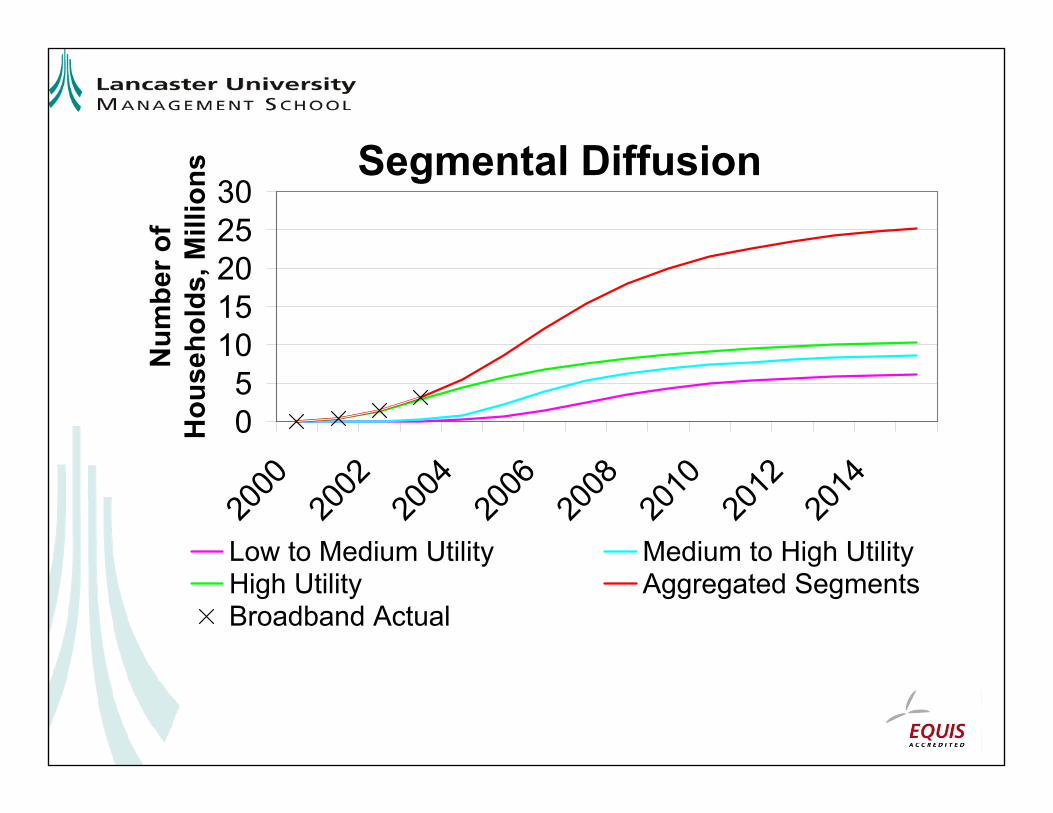
Segmental Diffusion
05
1015202530
2000
2002
2004
2006
2008
2010
2012
2014
Num
ber o
f H
ouse
hold
s, M
illio
ns
Low to Medium Utility Medium to High UtilityHigh Utility Aggregated SegmentsBroadband Actual
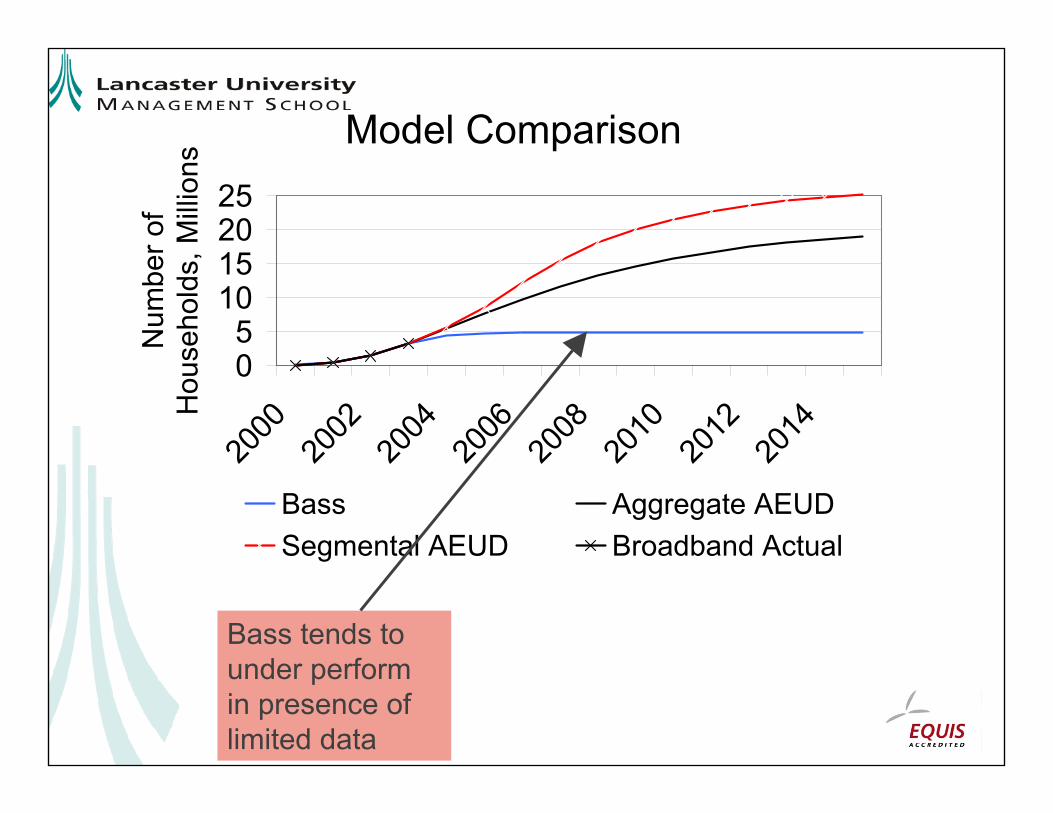
Model Comparison
05
10152025
2000
2002
2004
2006
2008
2010
2012
2014
Num
ber o
f H
ouse
hold
s, M
illio
ns
Bass Aggregate AEUDSegmental AEUD Broadband Actual
Bass tends to under perform in presence of limited data
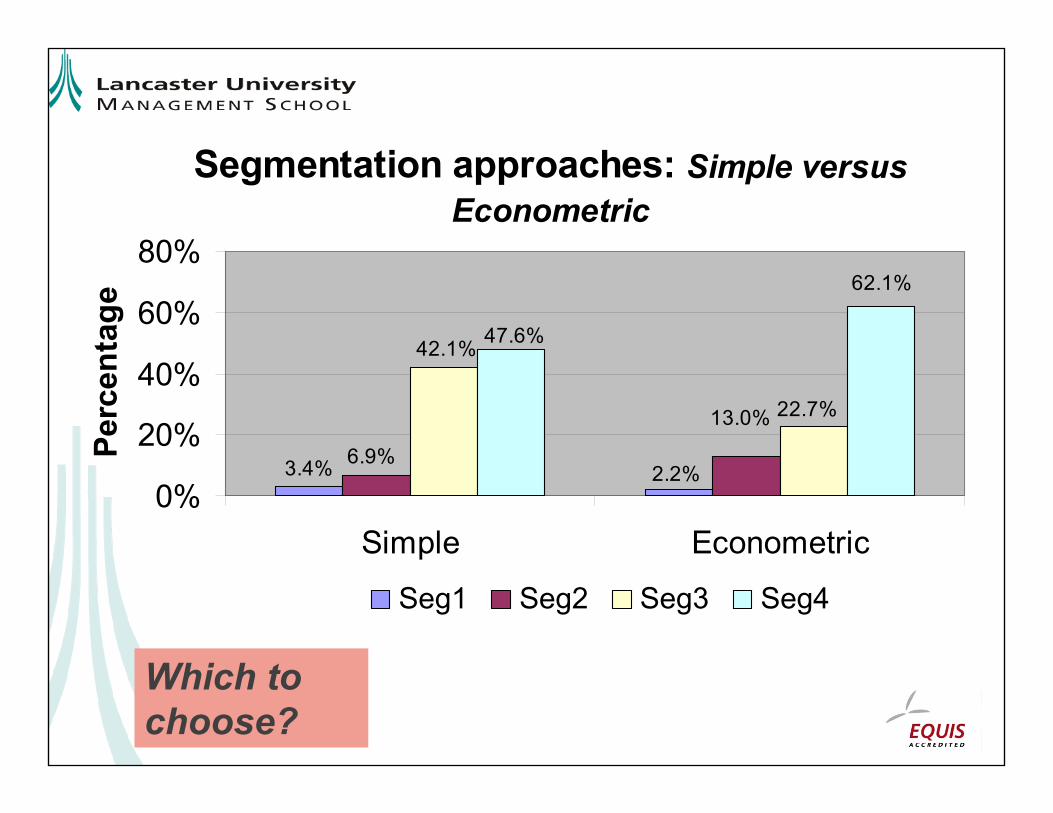
Segmentation approaches: Simple versus Econometric
0%
20%
40%
60%
80%
Simple Econometric
Perc
enta
ge
Seg1 Seg2 Seg3 Seg4
2.2%
13.0% 22.7%
62.1%
47.6%42.1%
6.9%3.4%
Which to choose?
Recap.
• The presentation has introduced expected ICT utility as a segmentation variable for residential ICTs;
– Created from a sound theoretical foundation.
– Applications go some way to confirm validity of the measure.
Issues• More testing needed to confirm validity;
– New survey is proposed for next year.– Same HHs, two year interval.– Track segmental shifts.
• Wider tests required;– Different applications (e.g. wireless apps.).– Different countries.
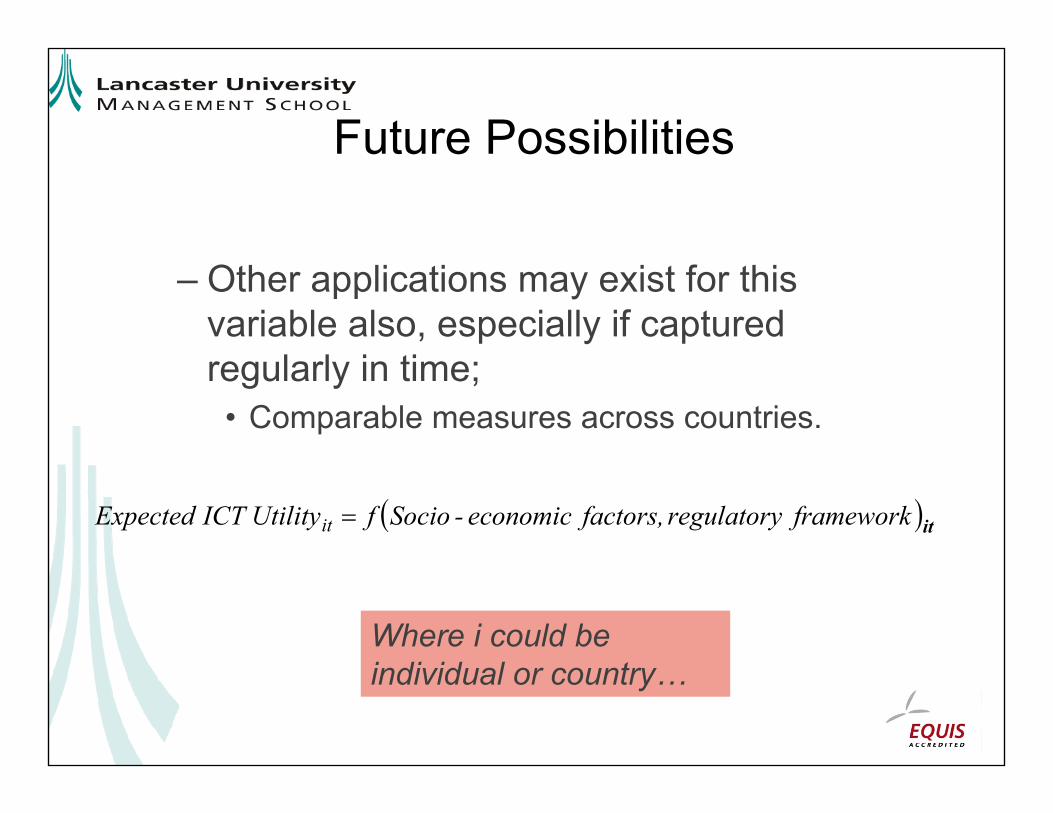
Future Possibilities
– Other applications may exist for this variable also, especially if captured regularly in time;
• Comparable measures across countries.
( )itframework regulatory factors, economic-Sociof Utility ICT Expected it =
Where i could be individual or country…