Embed Size (px)
Citation preview
1
Course: International Marketing
Instructor: Mahmood Hussain, PhD
Understanding Consumer Behavior in the Asia
Pacific Market and Developing Appropriate
Marketing Strategies.
Country: Australia& Hong Kong
Group: # 3
Student Name 1
Student Name 2
Student Name 3
Student Name 4
Date: ____________
2
Contents I.Summary of the Project 4
II.Introduction 5
III.Country Profiles—Australia& Hong Kong
• Population, age/ gender distribution, literacy rate. 6
• GDP, GDP per capita. 6
• Foreign Trade and Investment:
1. Export-Import-by products, 1990-2004 6-7
2. Foreign Direct Investment-by sector/products,
1990-2004 7
• Multinational Enterprises Investment operations and
performance: 1990-2004. 7-8
• Stage of economic development- size of
manufacturing/ service sectors v. s agriculture
sector. 8-9
• Significant economic/ social change(s) in the past
10-20 years. 9-10
IV.Reasons (Psychological/ Sociological/ Historical) for
differences in behavior between Australia and
Hong Kong.
• Differences in the purchase experience by countries. 10-11
3
• Cultural differences in negative product assessment-
Safety Equipment. 11-12
• Cultural differences on Internet buying behavior and
product customization -Telecommunication. 13-15
• Cross-cultural differences in sensitivity to
advertising. 15-17
• The value of promotions across cultures. 17-18
• How can we satisfy consumers in these countries? 18-20
V.Three potentially marketable products/service
• Hybrid car 20-21
• Cosmetics- Skincare 21-22
• Wine 22-23
VI.The product we choose to market in Australia&
Hong Kong-Skincare
• Target market 23
• Positioning strategy that matches behavior of this
target group. 23-24
• Marketing strategies based on 4 P’s. 24-27
VII.Appendices 28-31
VIII.References 32-35
4
Executive Summary
The purpose and scope of our project is to understand consumer behavior in
Australia and Hong Kong and developing appropriate marketing strategies. First of all,
from the first part, country profiles, we planned to get a general idea how these two
countries performed in terms of GDP, exports and imports, foreign direct investment,
stage of economic development as well as any significant economic/social changes in
the part 10 years. In addition, we analyzed cross-cultural differences in these two
countries regarding to different marketing issues including sensitivity to advertising,
negative product assessment, Internet buying behavior, product customization,
purchase experience and value of promotions. Based on our analysis, we came up
with a brief solution in order to satisfy consumers in these two countries. Moreover,
given a specific product, anti-aging for Australia and whitening for Hong Kong
market, a series of marketing strategies including how to position the target market
and a brief discussion with four P’s, were developed so as to successfully introduce
our new product in a new market.
The methods we used for our project were varied. In order to get the most
updated data, we searched from some official and professional website for both
countries, such as WTO, Bureau of East Asian and Pacific Affairs, U.S. Department
of State, and so on. Additionally, school library database was a good resource center.
From there we got plenty of information we need. The major database we used were
ABI/Inform, EIU, Factiva, Lexis Nexis, etc. Also, journal articles, newspapers,
internet data were helpful for our research.
The results of our project were positive and important. Basically trough the
project we know it is true that operating business in foreign markets is more that just
having offices and production facilities scattered throughout the globe. Understanding
the foreign consumer behavior and develop appropriate marketing strategies to satisfy
their needs become very important issues for marketers. More important, through the
project, we learned how it is vital and difficult for those marketers to keep their
strategies successfully in a long run.
5
Introduction
Australia and Hong Kong, two major countries of Asia Pacific Region, are
playing important roles in world trade activities. According to WTO ‘s statistic of
world trade profile released in 2003(WTO,2005), Australia’s export and import
performance ranked No. 26 and No.19 respectively in merchandise category in the
world; Hong Kong ranked No.11 in the same category of both export and import
performance. Hong Kong government is deepening its economic interaction with the
Pearl River Delta in an effort to maintain Hong Kong's position as a gateway to China
(U.S. Department of State, 2004). Since China has relaxed the restriction about
Chinese people travel in Hong Kong, more and more affluent Chinese people come
across the river for sightseeing and shopping. Therefore, the market scale is extended
rapidly and market potential is unlimited. Looking at Australia, it commenced various
economic reforms in the 1980s and has successfully transformed itself from
agricultural, import-substitution country to an internationally competitive one. Its role
in global business is becoming critical. As result of growing business opportunities
and increasing global competition in both markets, Corporate America has to
understand and respond to different cultural values and different consumer behavior
as well in order to successfully explore local markets.
Country Profiles:
Population, age/gender distribution, literacy rate
Australia—Australia had a population of 20.2 million with an annual growth rate of
1.2% (U.S. Department of State, 2004). People between 0 and 14 years old distributed
20.1% of total population. People between 15 and 64 years old occupied 67.2% of
total population and others aged over 65 years were 12.8% of total population. And in
Australia, the gender distribution was found that female and male distributed almost
equally in half (Nationmaster.com, 2005). The literacy rate was 85% (U.S.
Department. of State, 2004).
Hong Kong--Hong Kong’s population in 2003 was 6.81 million with 0.2% of growth
rate (U.S. Department of State, 2005). People between 0 and 14 years old distributed
14.2% of total population with 52.3% male and 47.7% female, people between 15 and
64 years old occupied 73.3% of total population with 49% male and 51% female,
6
others aged 65 years and over were 12.5% of total population with 46.1% male and
53.9% female (Nationmaster.com, 2005). The literacy rate was 92%, specifically with
95% male and 88% female (U.S. Department of State, 2005).
GDP, GDP per capita
Australia—Australia’s GDP in 2003 was $504.4 billion and per capita real GDP
(2002) was $21,233.
Hong Kong—Hong Kong’s GDP (2003) was $158 billion and per capita GDP (2002)
was $22,988.
Foreign Trade and Investment:
Export-Import-by products, 1990-2004
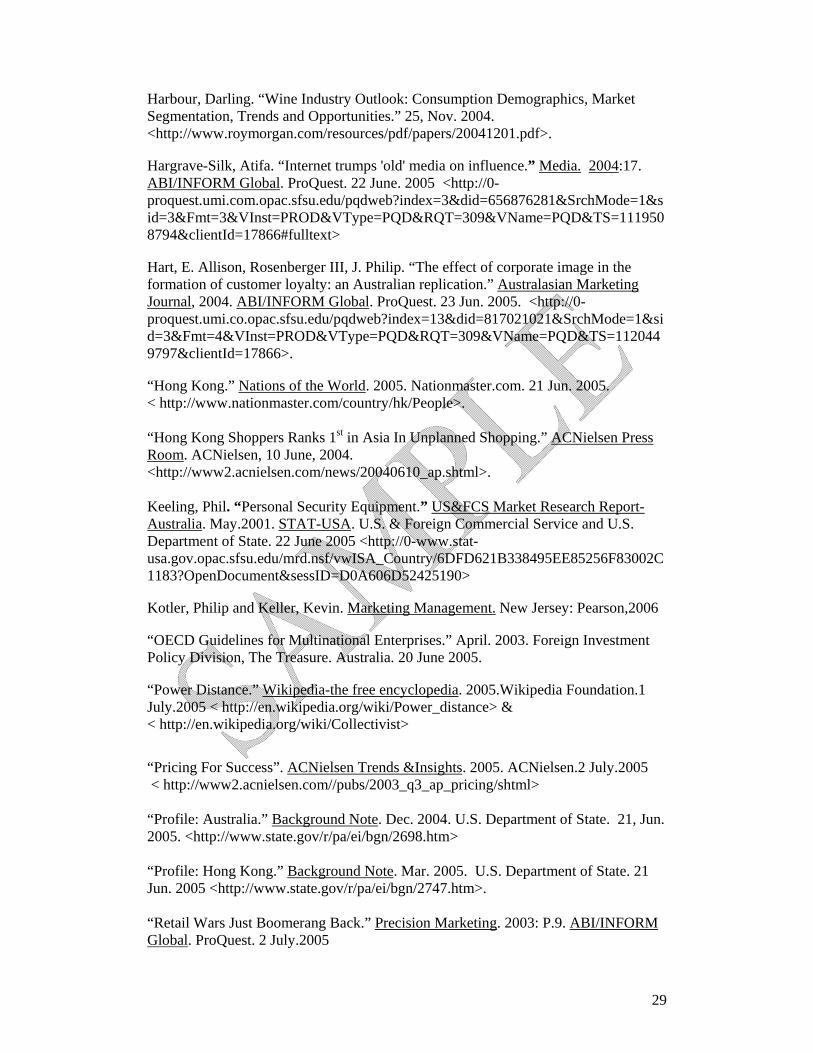
Australia—Australia’s major exports were fuels and mining products, agricultural
products, manufactures, and food. Generally, from 1990 to 2003 all four major
exports products were in an increasing trend. Specifically, fuels and mining products
increased over the years. Agricultural products, manufactures and food products
increased from 1990 to mid 1990s and then decreased from that time (See Graph 1 &
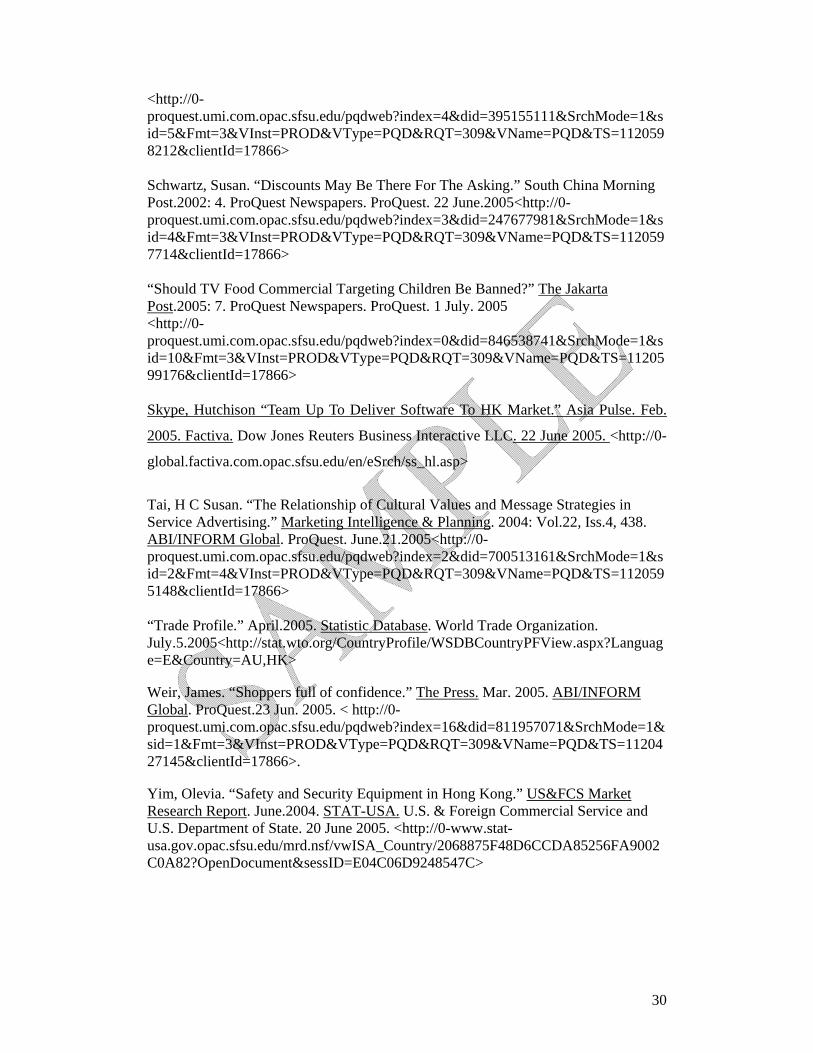
Table 1). Three major imports products for Australia were manufactures, machinery
and transport equipment, office and telecom equipment. Specifically, manufactures
increased a lot from 1990 to 2003, especially from 1990 to mid 1990s. The trend for
machinery and transport equipment was kind of stable over the years with an
increasing but not much. Office and telecom equipment didn’t increase a lot over the
years but in a kind of stable situation (See Graph2 & Table 2).
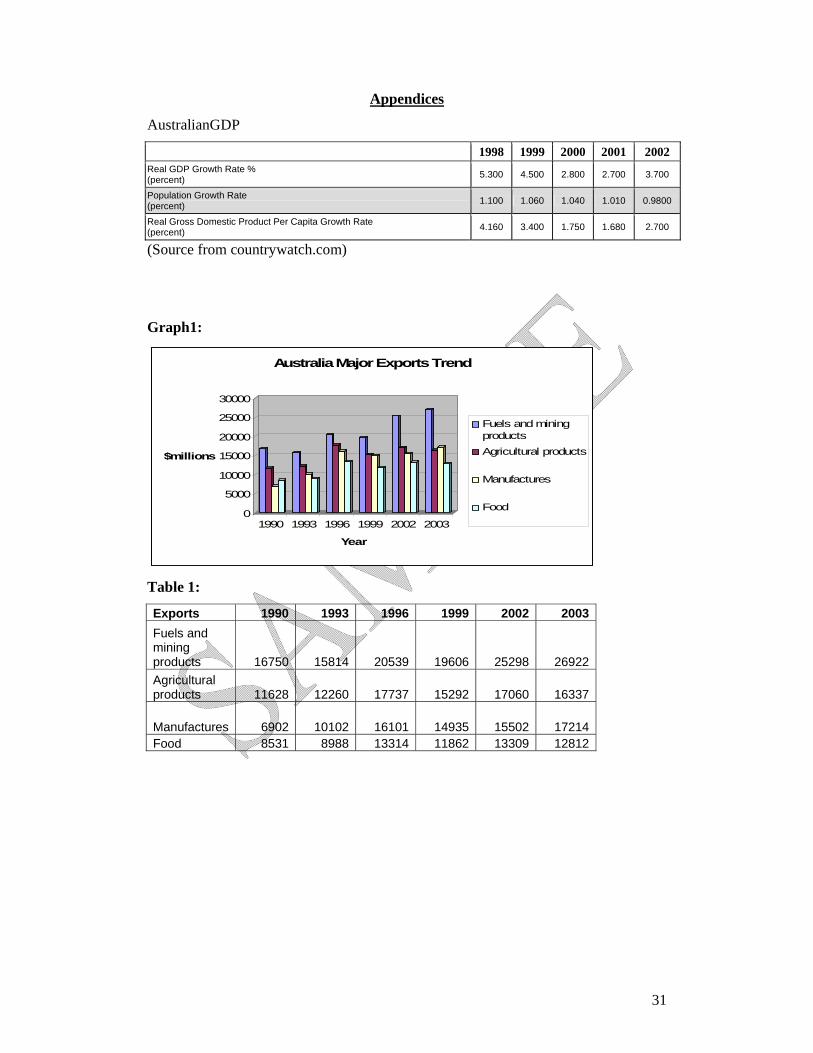
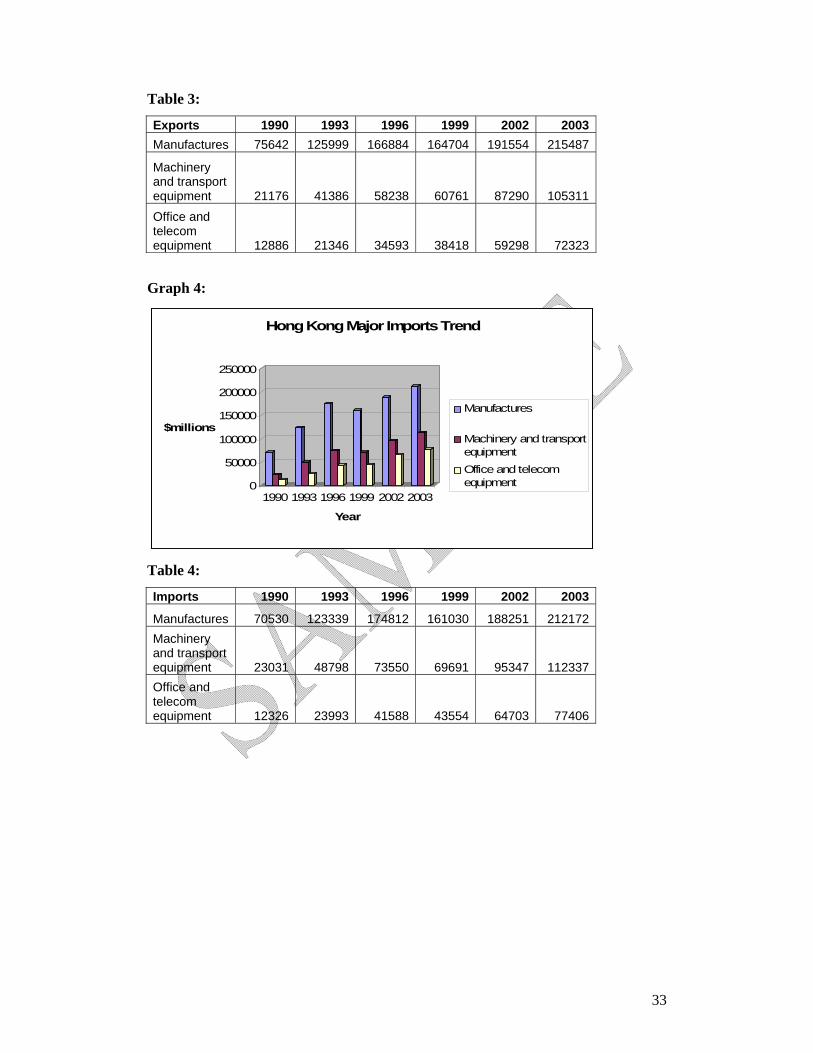
Hong Kong—It is very interesting that major exports and imports products for Hong
Kong from 1990 to 2003 were same. They were manufactures, machinery and
transport equipment, office and telecom equipment. Over the past years, they were all
increased, especially for manufactures for both exports and imports (See graph 3 ,4 &
Table 3, 4).
Foreign Direct Investment:
Australia--One of Australia’s biggest challenges was finding sufficient capital to
finance growth. Partly in response to the country heavy burden or external debt, both
the conservative Liberal-National coalition and the Labor Party have relaxed limits on
foreign ownership, even in such traditionally sensitive areas as broadcasting, airlines
and telecommunications. So, from 1996 to 2004, the largest concentration of foreign
investment has been in finance and insurance. Also, the USA was Australia’s largest
single foreign investor, with ranging from 24% to 29% of total investment and the UK
7
was next with ranging from 12% in 1996 to 27% in 2004. In 2004, the accumulated
investment for the US was A$242.1bn (up 3% on 2000/01), A$223.9bn for the UK
(up 9.2% on 2000/01) (EIU—Australia, 2005).
Hong Kong— Hong Kong’s market is small which is attractive to foreign retailers
because of the population’s high disposable income and the sophistication of its
brand-conscious consumer market; also with its geographic location, communications
network, infrastructure, free-port status and the relatively low level of taxes.
Moreover, there are no restrictions on foreign ownership of property or companies
and no foreign-exchange controls. Hong Kong is a premier capital-raising centre,
especially for mainland Chinese companies. From 1996 to 2004, the major sources of
inward direct investment were mainland China with average of 29% of total, The
British Virgin Islands with average of 28% of total, Bermuda, and the United States.
Since the services sector generated more than 80% of Hong Kong’s GDP, the Hong
Kong government actually made a push to attract more investment in service
industries, such as transportation, insurance, regional header quarters, environmental
consulting and building and project management (EIU—Hong Kong, 2005).
Multinational Enterprises Investment operations and performance
Australia— According to OECD guidelines for multinational enterprises, government
addresses guidelines to multinational enterprises operating in or from 30 OECD
member countries and non-member adhering countries. The Guidelines are a set of
recommendations for responsible business conduct covering a broad range of issues
including information disclosure, employment and industrial relations, environment,
combating bribery, consumer interests, science and technology, competition and taxation.
The guidelines aim to ensure that the operations of business enterprises are in harmony
with Government policies, to strengthen the basis of mutual confidence between
enterprises and the societies in which they operate, to help improve the foreign
investment climate and to enhance the contribution to sustainable development made by
multinational enterprises. Moreover, the ANCP has formal procedures in place to address
specific issues of multinationals operating in a manner which is not consistent with the
Guidelines. The ANCP offers a forum for discussion and will mediate discussions where
appropriate to help resolve the issues (Legg, 2003).
Hong Kong— As at June 1, 2001, there were a total of 3 237 regional operations,
representing a 7.9% increase over 2000, a record high since the survey started 11
years ago. More and more multinational corporations (MNCs) are flocking to set up
8
beachheads in Hong Kong, taking advantage of the territory's competitive advantages
over other Asian cities, in particular, as a gateway to China. With China's accession to
WTO, Hong Kong's status as the preferred location for regional headquarters for
multinationals was strengthened further. United States topped the list of countries
with the largest number of regional headquarters in Hong Kong with a total of 221
companies. This was followed by Japan with 160 companies and the UK with 90
companies. The major lines of business of these regional headquarters were wholesale,
retail and trade-related services and financial services. Japan topped the list of
countries with the largest number of regional offices in Hong Kong with 533
companies. The United States was next, with 420 companies, and followed by
Mainland China, with 172 companies. Major lines of business for the regional offices
were wholesale, retail and trade-related services as well as business and professional
services. Japan topped the list with 220 companies setting up local offices in Hong
Kong. The United States and Mainland China followed with 167 and 160 respectively.
Major lines of business for the local offices were wholesale, retail and trade-related
services and financial services (Foreign-owned regional operations in HK…).
Stage of economic development—size of manufacturing/service sectors vs.
agricultural sectors
Australia— In Australia, services was the largest distribution section in terms of
percentage of GDP fro the past years, followed by industry and agriculture.
Table: ?
2000 2001 2003 2004Agriculture 4.00% 4.10% 4.00% 0.10%Services 68.60% 68% 67.60% 86.80%Industry 27.40% 27.90% 28.30% 13.10%GDP 100% 100% 100% 100%
(Source from EIU--Australia)
Hong Kong—In Hong Kong, services distributed most as % of GDP followed by
industry and agriculture.
Table: ?
2000 2001 2002 2003 2004 Agriculture 0.10% 0.10% 0.10% 0.10% 0.10% Services 85.70% 86.40% 84.40% 86.10% 86.80% Industry 14.20% 13.40% 14.30% 13.80% 13.10% GDP 100% 100% 100% 100% 100%
(Source from EIU—Hong Kong)
9
Any significant economic/social changes(s) in the past 10-20 years
Australia—Australia was one of the OECD’s fastest-growing economies throughout
the 1990s, a performance that owed much to the economic reform program. Despite a
transient slowdown in late 2000, it has been 14 years since Australia experienced a
recession and economic growth remains robust. Economic growth should be around
3% in 2004, despite the negative effect of the prolonged drought on Australian
agricultural exports. The latest predictions suggest that GDP growth will exceed 3%
Political condition: Over the next 2 years (U.S. Department of State, 2004).
The liberal Party/National Party coalition came to power in the March 1996 election,
ending 13 years of ALP government and electing John Howard prime minister.
Howard’s conservative coalition moved quickly to reduce Australia’s government
deficit and the influence of organized labor, placing more emphasis on workplace-
based collective bargaining for wages. The Howard government also has accelerated
the pace of privatization, beginning with the government-owned telecommunication
corporations (Country Watch--Australia, 2005).
Hong Kong--Being a free port, Hong Kong has become a manufacturing, commercial
and tourism center with few equals. Its achievements make it one of the four "small
dragons" in East Asia characterized by its rapid economic growth and high per capita
income. Negotiations started in 1982 between the British and Chinese governments
for the future of Hong Kong. In December 1984 the Sino-British Joint Declaration
was signed for the British to hand over Hong Kong to China at the end of their lease
on July 1, 1997. China agreed to make Hong Kong a special administrative region
(SAR) after its handover. According to the agreement, as an SAR, Hong Kong would
enjoy considerable autonomy except in areas of defense and foreign policy. The
Chinese government also promised to let Hong Kong retain its political, economic
and judicial systems for 50 years after the reversion. All these measures for taking
over Hong Kong are known as the "one China, two systems" policies. (Country
Watch—Hong Kong, 2005).
Consumer Behaviors:
Differences in the purchase experience cultures:
Hong Kong—According to the 2003 ACNielsen Asia Pacific ShopperTrends, Hong
Kong consumers are by far the most impulsive shoppers in the region with 67% who
make unplanned purchases.Specifically, in Hong Kong, a relatively small and
10
concentrated market, 44% of shoppers claimed to use 3 or more stores regularly for
grocery shopping, compared to an average of just two in South-East Asian countries
That might be a sign that Hong Kong consumers were less likely to be brand loyal.
Moreover, Hong Kong consumers might be in an increasingly price sensitivity as it
seemed that Hong Kong consumers were spreading their spending across more
grocery stores. They are more likely to shop around for special offers, promotional
activies, more attentive and responsive to store brochures. Actually, this kind of
shoppers are tending to be more open to new ideas and are willing to try new things.
In fact, several factors could influence the Hong Kong grocery shoppers’ decisions to
choose which stores to visit. According to the survey, first of all, location was most
important factor for Hong Kong shoppers to make choices of store. Ever since the
SARS incident, cleanliness and hygiene beame the second improtant factor to choose
store. Value for money ranked 3rd and convenience ranked the fourth in importance.
More over, more than 70% of the main shoppers are women and men are usually the
influencers. One point are also worth of noting that despite the increasing popularity
of internet around the world, Asian shoppers prefer personal visits to the stores over
virtual shopping. (ACNielsen, 2004).
Another purchase experience for Hong Kong consumers was based on their
lifestyle and psychographic profiles. From the PAX survey from Synovate, a survey
samples 19,000 people in several Asian countries, including Hong Kong, Singapore,
Taipei, Sydney and Tokyo, etc., Asia's nouveau riche was the most brand-conscious,
gadget-hungry consumers. Across all markets covered by the survey, but excluding
Japan, 62% said they thought it was worth paying extra for good quality, and 23%
said they preferred to buy designer goods or brands. Respondents in top management
positions were more like than other respondents to be among the first to buy a new
product or gadget, to pay extra for quality, and to regard international brands as
superior quality. They're more likely to treat themselves to something special, but
enjoy shopping less than those further down the corporate ladder (Bowman, 2004).
Australia—A record net 49.5% of all shoppers said it was a good time to buy a big
household item, according to the latest Westpac McDermott Miller consumer survey.
That was the highest-ever level of confidence to spend in the survey which has been
running since 1988. Record numbers of shoppers are in the mood to spend, chasing
big discounts on such things as fridges and falling prices for imported TVs, making it
a great time to buy. Actually, a rising number of low- income earners were feeling
11
better off financially and are more optimistic. However, high and middle-income
consumers were showing increased uncertainty about their financial future and their
confidence in the economy was eroding because of the anxiety about rising costs of
living which could undermine their willingness to spend in the future. Moreover, the
latest survey shows overall consumer confidence dipped a little this month. (Weir,
2005). Also, in Australia, the market with highest percentage of shoppers using the
net to buy grocery store, according to the 2003 ACNielsen Asia Pacific
ShopperTrends (ACNielsen, 2004).
Another mall-intercept survey also related to Australian female consumers’
purchasing experience with brand loyalty. This survey was created for customers who
had had a shopping experience at the up-market department store in the previous six
months. It evaluated how corporate image and its influence on customer loyalty. The
results showed that corporate image had a significant impact on core service and
customer satisfaction perceptions. Also, this study did find a marginally significant
influence, which could be explained by the greater importance placed upon store
image by retailers, as well as the overall more involved (both cognitive and affective)
consumer storefront retail experience. Therefore, based on this study, we can have an
idea that the Australian female consumers would be likely to more satisfied with their
purchasing experience at the up-market department store as long as the corporate kept
a strong image (Hart, 2004).
Cultural differences in negative product assessments
-- Safety and Security Equipment
Australia:
According to the article “PERSONAL SECURITY EQUIPMENT”( US&FCS
Market Research Reports—Australia), the Crime statistics provided by the Australian
Institute of Criminology show that the most commonly mentioned crimes as assault
and theft from the person, and during the same year, one in three households
experienced an incident of personal crime. In Australia, there are increasing violent
crime rate and property offense rate occurred in residential locations. Therefore,
recently, the focus of security product market has turned to lower cost systems for
residential use even though commercial and industrial premises still comprise an
important feature of the market. The position of U.S. companies in this market is
strong. Taxi security screens have been introduced recently to prevent attacks on
12
drivers by surrounding the driver's seat with a plastic shield. They are not universally
popular and they are manufactured locally. It would be difficult for overseas suppliers
to compete with these items.( Keeling, 2001)
Hong Kong:
According to the article “Safety and Security Equipment in Hong Kong” ( US&FCS
Market Research Reports—Hong Kong), Since 911, Hong Kong has introduced
tighter security checks at its airport, border crossings, and container terminals. Being
one of the world’s major trading ports, Hong Kong has committed itself to
safeguarding the global trading system against potential threats from terrorists. In
2003, the overall number of crimes reported was 88,377, representing a 16.5%
increase from 2002 (75,877). As a result of the SARS outbreak in 2003, local
hospitals are now investing in special access control systems to protect patients,
visitors and healthcare practitioners. With these systems in place, the movements of
the patients can be regulated and the possible spread of infection contained. Although
China has the largest import market share, Japan and the U.S. still dominate the high-
end market in Hong Kong because of the technological superiority of their
products. The reason it’s worth nothing that China accounts for 58% market share is
that Hong Kong’s factory owners have been moving their production base to China to
take advantage of Southern China’s lower rental and labor costs since the 1980’s. The
finished products which are largely low-end transit Hong Kong for foreign markets
such as North America and Europe. The Hong Kong market only absorbed a less than
10% of the total imports from China (Yim, 2004).
Cultural differences on Internet buying behavior --
Australia:
According to “Internet Shopper Demographics and Buying Behaviour in
Australia2004 ”,the growth of online shopping in Australia has been predicted to be
rapid. Based on the Australia Bureau of Statistics report ‘Use of Internet by
Householders’ (2001), the acceptance of online shopping grew strongly amongst
Australian consumers; more than 1.33 million Australian adults (one in every ten
adults) purchased or ordered goods and services for their own private use over the
Internet within the 12-month period to November 2000. According to MacDermott
(2000), the share of online shopping in retail sales is forecast to increase to 2.1
percent by 2005 and 5.3 percent by 2010, to reach a total value of $10.3 billion. It is
expected that the online purchasing frequency and expenditure patterns of Internet
13
users in Australia will be associated with different demographic profiles. The findings
reveal that online shoppers who shop frequently tend to be male, aged 24 to 44, are
high-income earners (with Aus$70,000 and above), and live in metropolitan areas.
The dominance of middle aged (aged 24 to 44) shoppers suggests that they are young
enough to be progressive, and old enough to be affluent vis-a-vis the age groups on
either side of them. As for shoppers who spend higher amounts on purchases, the
findings are similar to that reported above. The difference is that shoppers are older,
i.e. in the 45 and over age group. The dominance of shoppers aged 45 and over
spending higher amounts suggest that they are earning higher incomes, and hence
more affluent. The implication is that the richness and reach trade-off, as manifested
in online purchasing frequency and expenditure, has a variable impact by gender, age,
income and location. (Chang, Sep 2004)
Hong Kong:
According to the article “Internet trumps 'old' media on influence2004”, there is more
than 50% of working adults have made purchase decisions based on an online ad,
according to the results of a report by the Hong Kong University's public opinion
program. We can get the following result based on the survey which polled nearly 660
men and women over the phone, studied media consumption patterns and usage of
traditional and online media, as well as perceptions of online advertising and its affect
on purchase decisions. It provides agencies and marketers more information in
considering the important role of the internet in (influencing) purchasing decisions of
consumers. After seeing an online ad, half of the respondents said they wanted to
know more about a product and would be aware of a brand, whether they clicked on
the ad or not. The survey also found that while consumers first turn to newspapers and
magazines when researching products or services, more than 50 per cent see the web
as the fastest and most convenient medium to obtain product information. Generally,
in Hong Kong, the population spends a similar amount of time on TV and the web.
AnnyLeung, strategic planning and development manager at Yahoo Hong Kong said
that "Over one-third of the consumers forwarded online campaigns to friends. This
shows that viral marketing is getting popular. (Hargrave-Silk, Jun 18 2004)
14
Cultural differences on product customization--
In the 21st Century, telecommunication is an indispensable technology. However,
based on the cultural difference, the demand tendency of Australia customers and
Hong Kong customers would be different.
Australia:
According to “Digital Distribution Australia Selects SPECTRUM(R) Infinity”,
Digital Distribution Australia (DDA) has selected Aprisma's SPECTRUM(R)
Infinity(TM) to monitor the performance and reliability of its digital video broadcast
and telecommunications infrastructure. DDA's network enables over 90% of
Australia's Telco carriers and major television broadcasters to offer voice, video, data,
and Internet services to consumers. DDA is a carrier's carrier, providing mission-
critical services to broadcast and telecommunications customers. It has built and
deployed one of the world's largest microwave radio networks, consisting of over
8,500 route kilometers with a capacity of 1 Gigabit-per-second along Australia's
eastern coast and into Tasmania. DDA work behind the scenes to ensure that the
solutions service providers offer to Australian consumers over our network
consistently meet or exceed all service quality objectives. As DDA begins offering
Digital Video Broadcasting (DVB), a new technology in Australia that requires
extensive customization of multi-vendor devices, SPECTRUM's ability to easily
discover and configure network devices will prove especially valuable in helping
them quickly roll out and manage this new technology.
The major implications: Australia is the world's smallest continent but sixth-largest
country; population concentrated along the eastern and southeastern coasts. Therefore,
the core considerable factor for customer-oriented DDA to customize their service is
to ensure that they can offer the good service quality for the Australian customers in
the large local network.
Hong Kong:
According to the article “SKYPE, HUTCHISON TEAM UP TO DELIVER
SOFTWARE TO HK MARKET”, the Global Internet Telephony Company(TM) and
Hutchison Global Communications Limited ("HGC"), the operator of the largest
fiber-to-the-building network in Hong Kong will bring Skype to Hong Kong through
a co-branded "HGC-Skype" portal, which is scheduled to be in service in March 2005.
Hutchison Global Communications Limited (HGC) owns the largest fiber-to-the-
building telecommunication network in Hong Kong. With the scalability of its global
15
bandwidth capacities and direct links to networks in Mainland China, HGC provides
instant connectivity around the world, including Asia, North America and Europe.
The "HGC-Skype" portal will offer Hong Kong users free and unlimited Skype-to-
Skype voice calls worldwide and the pre-paid SkypeOut service, which enables users
to call any fixed or mobile phone in the world at special rates.
The major implications: Because of the special location effect of Hong Kong,
providing instant connectivity around the world becomes more important than
providing that in limited local network. "HGC-Skype" portal will not only provide
Hong Kong users some personalized service which similar to MSN messenger but
also deliver superior quality voice communications to its user.
Cross-culture difference in sensitivity to advertising
Hong Kong
According to H.C. Susan Tai, Hong Kong’s advertisers use more transformational
messages strategy in service advertising, and this phenomenon is highly correlated to
Hong Kong’s cultural values. Hong Kong can be characterized as a high power-
distance culture (people see authority as a basic fact of society) and a culture with
long–term orientation, idealism, and collectivism; therefore, people in Hong Kong
illustrate their unique preference to advertisement. Here are some interesting findings
(Tai, 2004):
1. High power-distance culture: Consumers in Hong Kong tend to prefer advertising
offering expert advice and clear, specific recommendations.
2. Collectivist cultures: People prefer non-verbal communication; therefore,
advertisers use more image-based or symbolic appeals.
3. High context cultures: Consumers are likely to be emotional, so marketers use
more soft sell approach including indirect and harmony-seeking appeals, and depth
brand image perception.
4. Idealism: People are more emotional and focus on subjective feeling. With eastern
thinking oriented, people are less interested in factual objects. Due to this point, more
emotional appeals are found in Hong Kong advertisement.
5. Long term orientation: Advertisements are more likely to use tradition as a symbol
of quality.
6. Materialism: People are encouraged to pursue an affluent, prosperous and rich life
style. Therefore, price-related dimensions such as prices, discounts and special offers
16
are often to be highlighted in commercial advertisement.
Based on these features of cultural values, Hong Kong advertisers tend to
frequently use the transformational advertisement, which attempts to impact
consumer’s emotion, and to stimulate his/her desire to make purchase in the end. For
example, the most common strategy is using celebrities as their advocators on TV
commercials and press media.
Australia
Although Australia was not covered in Susan Tai’s research, we think the same logic
and method can be applied to explain Australia‘s advertisement as well. Australia
shares very similar cultural values with U.S.A. Compared with Hong Kong, Australia
can be characterized as a low power-distance culture (Wikipedia, 2005) and a culture
with realism, and individualism (Wikipedia, 2005). Again, based on Susan Tai’s
research, we infer that Australian advertisers may employ informational message
strategy in their advertisement. Here are some features related to Australian cultural
values (Tai, 2004):
1. Low power-distance culture: Consumers may like to have presentation of
information and facts which can assist them in reasoning.
2. Individual cultures: Advertisers are used to present facts that can help
people make decision.
3. Short term orientation culture: Consumers seeks explicit and verbal
information. Therefore, Australian advertising focuses more on the need to
plan and be concerned about the short-run future.
4. Low context cultures: People tend to use more argumentation, data and facts.
Therefore, advertisements are prone to be more informative, and have more
direct, confrontational appeals
5. Realism: People tend to focus on objective evidence and prefer rational
thinking.
Based on this reasonable inference, we think Australian advertisers should
use informational advertisement more often. In other word, they tend to provide
consumers with factual, relevant brand data in clear and logical manner. It allows
consumers to make their own judgment by evaluating the merits of buying the
brand.
17
The value of promotions across cultures
According to ACNielsen’s research across Asia (ACNielsen, 2005), Hong Kong
consumers are the most responsive to price fluctuations. In other word, people are
very sensitive to price change and have average brand elasticity well above the Asia
norm. Therefore, Hong Kong people are used to wait for the traditional sales season to
go in search of a bargain. This phenomenon becomes especially obvious during the
recently economic downturn. Due to lack of confidence about the future economic
situation, most Hong Kong people feel reluctant and conservative toward shopping,
and they get used to seek various sales promotions like using the credit card offering
additional sales discount, collecting coupons for grocery shopping or looking for
interest- free payment (South China Morning Post, 2002). Based on the above
information, we may conclude that price sensitivity is part of Hong Kong peoples’
characteristic, but the degree of price sensitivity may be varied by economic situation.
With an emerging trend of “Every Day Low Price” among Australian’s
retailer stores, some media start to talk about the possible impact on Australians’
shopping behavior. According to ACNielsen’s point of view (ACNielsen, 2005), the
absence of promotions may remove some of the excitement from the shopping
occasion, particularly some consumers who thrive on finding a bargain. This
argument might be partially true, but the other report maybe better reflect most
Australians’ attitude toward price. According to “Precision Marketing”, Australians
are becoming more price and time conscious, with an increasing proportion prepared
to switch store for offers (Precision Marketing, 2003). This finding came from the
observation when two largest supermarket retailers in Australia - Coles and
Woolworths/Safeway tried to compete by using two different promotion strategies.
While Coles introduced the EDLP strategy, Woolworths followed by introducing
price roll back plus gas discounting for shoppers who spend over AUS$30.
Woolworths’s promotion successfully enticed customers and help it slowly gain
market share. From this repot, one thing that we can assure that price promotion
strategy is workable in Australian retailer stores.
The other interesting case was about McDonald’s promotion strategy in Hong
Kong. McDonald not only used low price strategy (A big Mac here costs less than
most countries in the world), but also exerted agile promotions in order to adapt to
local market. According to Asian Wall Street Journal, “As thousands of people lined
up for hours in front of the hamburger restaurants to buy Hello Kitty dolls, cute little
18
Japanese cat figures” (Asian Wall Street Journal, 1999). Customers paid $ 2.32 for a
Hello Kitty with a minimum food purchase of $1.95, and this promotion helped
McDonald boost sales about 10% at its 158 outlets (BusinessaWeek, 1999).
McDonald successfully manipulated Hong Kong people’s obsession with speculating
on everything. In addition, McDonald was good at using TV commercial to draw
kids’ attention. According to Asian Wall Street Journal, “McDonald also made kids’
birthday party as a big deal, by promoting them in television ads”. Although many
parents and nutritionists didn’t like McDonald’s promotion, which might encourage
kids eating too much fatty food, they didn’t show any concrete action to against its
promotion. In contrast with Hong Kong, McDonald in Australia seemed not so lucky.
According The Jakarta Post, McDonald used very similar promotion to appeal kids’
attention and its TV commercial told kids to collect small toys by buying lots of
Happy Meal set-menu. A lot of social workers including nutritional experts, medical
experts and parent started to give pressure to government and called for stricter rules
on food commercials (The Jakarta Post, 2005). From McDonald’s case, we saw
people in two different cultures expressed totally different values when facing
attractive promotions.
How can we satisfy consumers in these countries?
Hong Kong
In accordance with Hong Kong peoples’ consumer behavior and cultural values,
we sum up several points that are worth for most markers to think about:
First, a lot of consumers’ buying decisions are led by impulse. In other word,
they often make purchase without plans. Therefore, marketers can create more excited
incentives via sales promotion in order to draw customers’ attention; this is especially
for people who love surprise. A well-designed promotion not only stimulates
customer’s shopping desire, but also makes shopping become enjoyable.
Second, general Hong Kong consumers show less brand loyalty for grocery
shopping. They tend to be more sensitive to price and focus on value of money. In this
case, using promotional activity like special offers, samples and coupons is one of
these options. Or marketers can consider winning loyal customers by offering a fairly
low price for high quality products. They may take” every day low price” strategy
into account.
19
Third, Hong Kong customers prefer face-to-face shopping instead of on-line
shopping. They regard convenience, cleanness and hygiene as three important factors
when they choose shopping location. Thus, how to create a comfortable and
convenient shopping environment is an important issue. By the way, although on-line
shopping is still unpopular, lots customers are used to collect product information on
the internet. Consequently, marketers should put more efforts on maintaining a user
friendly website and it is good for companies to create positive brand images.
Fourth, in response to Hong Kong’s cultural values, marketers should
skillfully use transformation message strategy in advertisement. From marketers’
stand point, employing more imaged-based appeals can stir customers’ buying desire.
In addition, marketers should provide more experts’ advice or recommendations in
their advertisement, because many customers like to listen to experts’ opinions and
believe products will be more reliable if these advocators are trustworthy. It helps
customers confidently make decision. .
Australia
According to our study, Australian’s consumer behavior is somewhat very
different from Hong Kong people. Here are some points that are worth to know:
First, marketers should always offer safety and health products. Without saying,
this is a norm that every marketer should follow, but we want to emphasize that
Australian has relatively high standard to exam marketers’ practice when compared
with most Hong Kong people (Asian people). In McDonald’s case, we see that
Australian much concerned about whether this product is offering public good (like
hamburger will cause obesity). They behaved more rational when see promotional
activities (Like Hello Kitty promotion). Moreover, Australian may take action to
against any inappropriate practice.
Second, Australians pretty enjoy on-line shopping, so creating a safe and user-
friendly on-line shopping environment is definitely a key. Besides, marketers should
offer a high-quality customer service, which is consistent with the service that
physical stores provide.
Third, since Australians are becoming more and more price conscious, marketers
should use various sales promotion or change pricing strategy in order to entice
customers.
Fourth, Australians in average are rational shoppers, and they like to read
product information before making purchase. Therefore, Australian marketers should
20
apply more informational message strategy in their advertisement. In other word, they
should present more facts and verbal information related to products in logical manner.
Three Potentially marketable products/services
Hybrid Car--With the soaring gas price, people start to look at something that can
save their pocket, so Hybrid car can be one of the suitable products in both countries.
Hybrid car is still in the introduction stage of the product life cycle in both markets.
Honda and Toyota, who own the technology, are current market leaders. Toyota’s
Prius and Honda’s Civic are the only two hybrids available in Australian’s local
market, and their sales records have been successful since launching in Australia in
2001, and 2004 respectively. Compared with the Australia, Toyota’s Prius is the only
model of Hong Kong market. There are several factors that we believe purchasing
hybrid cars will be the trend in the future.(Fallon, 2005)
1. Environmental benefits of cutting emissions: Hybrid car were designed to cut
carbon–dioxide emissions by half, while those of carbon monoxide,
hydrocarbons and nitrogen oxide would be reduced by 90%. Therefore, as people
get rich , they are more willing to spend on ecological preservation
2. Being able to enjoy and show off the new concept car: Since most people regard
hybrid as a high –tech product, driving hybrid can be a cool thing. .
3. Improved fuel economy: Because oil prices keep rising steadily, people may shift
their preference from conventional cars to gas economy cars.
Our target markets of hybrid car will be people who are middle class, age
between 30-50 and relatively high education level with upper middle income. In
addition, their psychological traits tend to be more innovative. We think this group of
people is more likely to be economical conscious and willing to try some high-tech
products. Besides, due to their high education background, they are more likely to pay
attention on environmental protection issue.
Cosmetics--One of the three potentially marketable products we choose to market in
both countries is Cosmetics. Firstly, according to the US& FCS Market Research
Reports-Hong Kong Cosmetics and Toiletries Market Review(2004), Hong Kong’s
cosmetics and toiletries imports totaled USD897 million in 2003. The importance of
Hong Kong for the international cosmetics companies is it doesn’t only represent its
local market but also acts as a launch pad into the large Chinese market. In addition to
21
selling to China from Hong Kong, there are also opportunities for exporting to other
Asian countries from Hong Kong. According to the research, a major resource of user
of imported cosmetics and skincare is Hong Kong’s Mainland Chinese tourists.
About 80% of the Mainland Chinese tourists “went shopping” and cosmetics and
skincare products are among their top 3 shopping purchases. The reason is that there
is wider choice of brands in Hong Kong and retail prices are about 30% lower than
those in China. Therefore, there are tremendous opportunities for U.S. cosmetics and
skincare companies to export to Hong Kong as cosmetic retailers are eager to increase
the brands that they can offer to the Mainland Chinese tourists. (Cheong, 2004)
On the other hand, according to the US& FCS Market Research Reports-
Australia Cosmetics and Toiletries Market Review(2004) , the cosmetic and toiletries
market in Australia is valued at US$984 million, with the market for skincare
estimated at US $220million. Australia is the third largest in the Asia-Pacific region.
The sector is expected to grow by three percent annually from 2004 to 2006. U.S.
products have received considerable interest in Australian market, with many
distributors searching the U.S. for innovative brands. The baby-boomer generation is
a principle driver for growth in the cosmetic and toiletries sector, and in particularly,
anti-aging product because older Australians are mindful of their appearance, with
many encouraged to stay in the workforce longer. Furthermore, the older market
(which includes baby boomers) encompasses women between the ages of 35-60 years
old. This group accounts for approximately 37% of the total female population. In
other words, concern about looks, a greater understanding of skin care and often a
high disposable income means the consumers in this segment are willing to spend. In
addition, a significant number of Australians (75%) suffer from allergies. Therefore,
Australians prefer the products which are non-scented, based on natural ingredient,
and suitable for sensitive skin (Ahern, 2004).
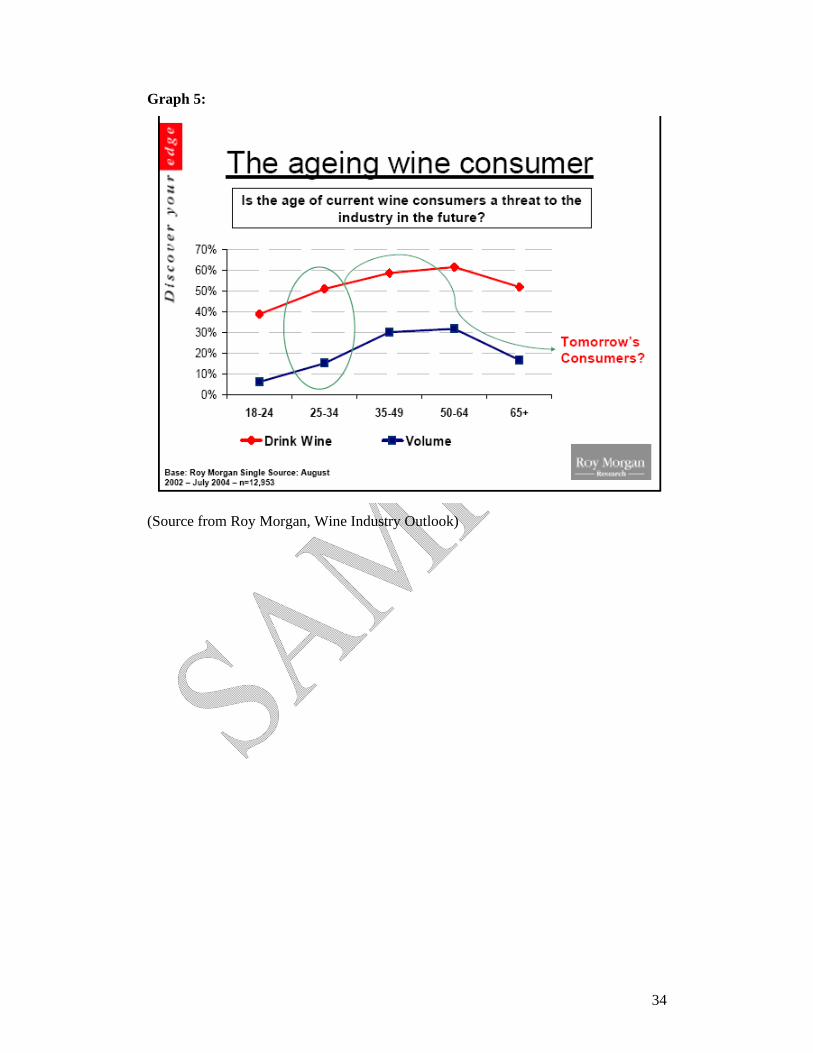
Wine Consumption—
Australia:
According to Roy Morgan International Wine Industry Outlook, Australia has the
highest per drinker consumption of wine compared to 3 or our top 4 export markets.
For example, 21 glasses per wine drinker in Australia vs. 10 for American wine
drinkers and 17 for U.K. wine drinkers. Around 30% of wine volume is consumed by
people aged between 50 and 64(See Graph 5). The step over to the 65+ age group sees
22
share of volume drop dramatically. And those younger segments, aged 18-24
represent only 6% of wine consumed. So, there is a need now to focus on the 50-64s
of tomorrow and well into the future to ensure that domestic consumption remains
supported as its current main supporters age and begin to reduce consumption.
Moreover, Australian wine consumers are more likely to look for price and medals to
guide them in their purchase decision. And they are more likely to be more highly
involved in the category, purchasing wine by the case and being members of wine
clubs (Harbour, 2004).
Hong Kong:
Wine consumption has increased worldwide by 5.6% since 1994. Asian recorded the
world’s highest wine consumption growth rate. Specifically, not only has wine
consumption increased in Hong Kong, wine-drinking patterns have also changed.
Hong Kong people have shifted from drinking spirits such as whisky and brandy to
drinking wine instead. This change has been motivated by an increasing awareness of
the health benefits of wine, the escalating prices of spirits due to increased taxes, and
the moving of business entertaining from Hong Kong to Mainland China. Also, wine
sales show that Hong Kong people prefer red wine to white wine. In addition to the
suggested beneficial health effects of red wine, the more full-bodied and fruity flavor
of red wine is attractive to the Asian palate. So based on those factors, wine marketers,
restaurateurs, and wine retailers should be able to better understand and target
potential customers, segmented with college graduates working as managers,
professionals and service and sales staff, with overall higher incomes. The future of
wine sales in Asia is bright and according to predictions by Vinexpo (2002) there will
be a 61.8% rise in wine consumption in Greater China by the year 2006 (Dewald,
2003).
Cosmetics was chosen as our product to be marketed and positioned in Australia
and Hong Kong
Target Market
Australia-- The cosmetic and toiletries market in Australia is valued at US$984
million, with the market for skincare estimated at US $220million. Australia is the
third largest in the Asia-Pacific region. The sector is expected to grow by three
percent annually from 2004 to 2006. The baby-boomer generation is a principle driver
for growth in the cosmetic and toiletries sector. Furthermore, the older market (which
23
includes baby boomers) encompasses women between the ages of 35-60 years old.
This group accounts for approximately 37% of the total female population. In other
words, concern about looks, a greater understanding of skin care and often a high
disposable income means the consumers in this segment are willing to spend
(Australia Cosmetics and Toiletries Market Review(2004).
Hong Kong-- Imported cosmetics and toiletries meet 95% of local demand, as there is
very little domestic production. Hong Kong’s cosmetics and toiletries imports totaled
USD897million in 2003. Hong Kong increasingly represents a launch pad into the
Chinese market; it creates the trends and acts as a showcase for this market. Apart
from selling to China from Hong Kong, there are also opportunities for exporting to
other Asian countries from Hong Kong (Hong Kong Cosmetics and Toiletries Market
Overview). Women aged between 25 and 45 are our whitening product’s main target
market.
Positioning strategy that matches needs/behavior of this target group.
In order to design the cosmetics company’s offering and image to occupy a distinctive
place in the mind of the target market, we, as marketers, must define the appropriate
points-of-difference and points-of-parity associations. To avoid the commodity trap,
we also have the differentiation strategies with product, personnel and distribution
channel.(Textbook, Chap10)
Australia—Regarding to the differentiation strategies, our new anti-aging product is
definitely safe to the consumers and with high quality. From the US& FCS Market
Research Reports, a significant number of Australians (75%) suffer from allergies.
Australians prefer the products which are non-scented, based on natural ingredient,
and suitable for sensitive (Cosmetics and Toiletries Market Review (2004)).
Therefore, the attributes of the new anti-aging product definitely include natural
ingredients for sensitive skin. Also through our better-trained sales agents and
expertise offering professional advice of skin care to our customers, our cosmetics
company can gain a competitive advantage against other competitors. For the
distribution channels, we use three main types of stores including high-end
department stores, boutique cosmetic stores and online stores.
Hong Kong—Compared to Australia, we have a slightly different positioning
strategies for Hong Kong’s consumers since our new product is whitening line. Be
sure, like we mentioned in the Australian part, our whitening product is definitely safe
to the consumers and with high quality. Some brands with whitening function contain
24
chemical ingredients, which might be harmful to human being’s skin. Therefore,
based on the needs of Hong Kong consumers, our whitening product is containing
such natural stuff as herbal extract. The rest parts of our strategies actually are kind of
same as that of Australia with friendly and professional sales agent and expertise. For
the distribution we use the local distributor/agent, high-end department stores and
exhibiting at local trade fair as our main channel ((US&FCS Market Research
Reports2004).
Positioning Statement:
Anti-aging in Australia:
To glamour, stylish and elegant (fashionable) women who want to have illuminated
and healthy skin, (**--brand name) is the skin care product that we blend and balance
several ingredients extracted from healing herbs, aromatic plants and sea substance;
we give you the best answer to improve your skin and stay young!
Whitening in Hong Kong:
To glamour, stylish and elegant (fashionable) women who want to have illuminated
and healthy skin, (**--brand name) is the skin care product that we blend and balance
several ingredients extracted from healing herbs, aromatic plants and sea substance;
we provide you remarkable whitening benefits.
Develop successful Marketing Strategies dealing with differences in consumer
behavior between these two countries/ cultures.
Product:
Australia--From our skin care product line, we choose anti-aging product which help
to correctly prepare, restore, replenish and revive the skin for a more youthful
appearance as the main product line in Australia market. According to “The Color
Cosmetics Industry” (US&FCS Market Research Reports 2000), 75% of Australians
suffer from allergies. Therefore, our anti-aging product will be non-scented, based on
natural plant extracts, and suitable for sensitive. In addition, according to “Australian
Cosmetics and Toiletries Market” (US&FCS Market Research Reports 2004), the skin
care market in Australia are seeking the products with unique benefit. Therefore, we
will highlight our product included unique natural marine ingredient which would
reduce skin irritation while increasing its firmness, elasticity, and smoothness.
Hong Kong-- From our skin care product line, we choose skin-whitening product as
the main product line in Hong Kong market. The reason demand for skin-whitening
products will remain strong in Hong Kong market is local Chinese people prefer fair-
25
faced females than those with dark skin. According to “Hong Kong Cosmetics and
Toiletries Market Overview” (US&FCS Market Research Reports2004), 40% of a
skin care product’s success is directly attribute to the visible results that consumers
using the product are able to obtain, and local consumers view Japanese skin care
product as most suitable to Asian skin type. Therefore, the benefits of our skin-
whitening product would be a noticeably fairer skin, deep moisturisation, spot
reduction, and “formulated for Asian skin”. Also, its intensive do-it-yourself
treatment is easy to follow.
Price:
Australia, Hong Kong--Based on the chapter 14, the basic critical step to set the
price is “Selecting the Pricing Objective”. To target at the high-end market,
“PRODUCT-QUALITY LEADERSHIP” is the objective we pursue in both countries.
Because skincare products are infrequent buying products, we assume skincare
product is less elastic. Compared to other general cosmetic companies, the price of
our product will be higher but affordable because of our high quality products to
target at “loyalty-buyer”. We believe the best way to keep the loyal consumer is not
lower the price but providing them the desirable high quality product and service.
However, we will adjust the price in each country based on the currency exchange
rate. Compared to Australia, because the target market in Hong Kong is from 25 years
old, they are more price sensitive. Therefore, the pricing level between Australia and
Hong Kong will also be different.
Place:
Australia--According to “Australian Cosmetics and Toiletries Market” (US&FCS
Market Research Reports 2004), in Australia, around 45% of cosmetics and toiletries
are purchased through major supermarkets, and pharmacies and cosmetic retailers,
including department stores, now represent 35% of cosmetic and toiletry sales.
Because our anti-aging product planned to target at high-end market, one of the places
we sell through will be the high-end department stores, such as the two major
department stores in Australia-Myer/Grace Brothers and David Jones., instead of
supermarket. Secondly, according to “The Color Cosmetics Industry” (US&FCS
Market Research Reports 2000), in these few years, one of the trend in retail sector is
to move toward the stand-alone boutique cosmetic stores. Therefore, we will also
26
open our own boutique skin care stores in Australia. Moreover, although there are a
handful of Australian websites selling beauty products, they are still very small and at
this stage don’t offer much choice. Based on above internet buying behavior part in
Australia, we know the acceptance of online shopping is growing strongly amongst
Australian consumers. Therefore, we will offer as much as choice to our consumers
through our website.
Hong Kong--According to “Hong Kong Cosmetics and Toiletries Market Overview”
(US&FCS Market Research Reports2004), to enter the Hong Kong market, there are
two major ways. The best way is through appointing a local agent/distributor. In Hong
Kong, selling to department stores such as the Hong Kong Seibu, Land Crawford, and
Sogo is essential for cosmetic and skincare products that are branded. Those
department stores will certainly be the place we sell through, and also Joyce Boutique,
which is a high-end specialty apparel store, also retails a wide range of high-end
skincare and cosmetic products. Another way is through exhibiting at local trade fairs.
Cosmopro Asia which is an international cosmetics trade show is popular with U.S.
manufacturers because buyers from around the world and local distributor.
Furthermore, the U.S. Department of Commerce certified the show for the past few
years.
Promotion:
Australia--According to “Luxury Packs in the Value”, with the recent proliferation of
fragrance brands and their shorter life cycles, well-executed promotional packaging
can have a significant impact on trial and sustaining sales. Especially for the
consumers of Anti-aging market in Australia, choice, quality, and recognition are
important, and they are willing to pay for personalized service and products because
this group often has a high disposable income.
Hong Kong--According to “Hong Kong Cosmetics and Toiletries Market Overview”
(US&FCS Market Research Reports2004), local importers complain frequently about
the large sizes of U.S. product because young consumers prefer small-sized items that
they can carry with them. Therefore, we will adjust the packaging and product size
adapted to local taste. To sell through department stores, we will support the
promotional activities with free samples and promotional literature. To build
awareness, we will also post the update product information and online ads on website
based on Hong Kong consumers are inclined to search product information online
more than shopping online. Furthermore, because many international women and
27
fashion magazines publish their Chinese editions in Hong Kong, to be featured in
these famous magazines is also essential in building brand and product awareness.
Reference
Ahern, Annette. “Australian Cosmetics and Toiletries Market.” US&FCS Market Research Report. Aug. 2004.STAT-USA. U.S. & Foreign Commercial Service and U.S. Department of State. 20 June. 2005 <http://0-www.stat- usa.gov.opac.sfsu.edu/mrd.nsf/vwIMI_CountryAll/4B4728893A775BEF85256FBB0031C565?OpenDocument&sessID=F09D069D23C5894> “Australia.” Nations of the World. 2005. Nationmaster.com. 21 Jun. 2005. < http://www.nationmaster.com/country/as/People>. Bartak, Elly. “The Color Cosmetics Industry.” US&FCS Market Research Report-Australia. Sep.2000. STAT-USA. U.S. & Foreign Commercial Service and U.S. Department of State. 20 June 2005 <http://0-www.stat-usa.gov.opac.sfsu.edu/mrd.nsf/vwISA_Country/06EE5CF08EE05C1B85256F82002C26B8?OpenDocument&sessID=404A07460615A5D> “Background Notes: Hong Kong (China).” International Trade Library. Mar. 2005. STAT-USA. Bureau of East Asian and Pacific Affairs. 19 June 2005 < http://0-www.stat-usa.gov.opac.sfsu.edu/miscfiles.nsf/BNOTES/C86A463C9C76D34485256FD2004EA3A9?OpenDocument&sessID=E08207730675970> Bolan, Cristen. “Luxury Packs in the Value.” Global Cosmetic Industry. Oct 2004. Vol. 172, Iss, 10.22. ABI/INFORM Global. ProQuest. 25 June.2005 <http://proquest.umi.com/pqdweb?did=449842091&Fmt=4&clientId=17866&RQT=309&VName=PQD> Boman, Jo. “Ready to Pay for Their Brands.” Media. Oct. 2004. ABI/INFORM Global. ProQuest. 25 June<http://0-proquest.umi.com.opac.sfsu.edu/pqdweb?index=8&did=723924151&SrchMode=1&sid=6&Fmt=3&VInst=PROD&VType=PQD&RQT=309&VName=PQD&TS=1120434872&clientId=17866> “Cantonese Macs: Hong Kong Success Shows McDonald’s Adaptability”. The Asian Wall Street Journal.1999: 1. ProQuest Newspapers. ProQuest.22 June.2005 <http://0-proquest.umi.com.opac.sfsu.edu/pqdweb?index=0&did=42930206&SrchMode=1&sid=8&Fmt=3&VInst=PROD&VType=PQD&RQT=309&VName=PQD&TS=1120598786&clientId=17866> Chang, Joshua. Samuel, Nicholas. “Internet Shopper Demographics and Buying Behaviour in Australia.” Journal of American Academy of Business. 2004: Vol.5, Iss.1/2.171. ABI/INFORM Global. ProQuest. 22 June. 2005 <http://0-
28
proquest.umi.com.opac.sfsu.edu:80/pqdweb?did=653884971&sid=1&Fmt=4&clientId> Cheong, Swee-keng. “Hong Kong Cosmetics and Toiletries Market Overview.” US&FCS Market Research Report. Aug.2004. STAT-USA. U.S. & Foreign Commercial Service and U.S. Department of State. 19 June 2005 <http://0-www.stat-usa.gov.opac.sfsu.edu/mrd.nsf/vwIMI_Country/FD52ADBF7FA0418E85256FBB0031C567?OpenDocument&sessID=E010078C0655738> Cheung, Michael. “Hong Kong ‘s Kitty Craze.” Business Week. 1999: Iss.3641, 6. ABI/INFORM Global. ProQuest. 2.July.2005 <http://0-proquest.umi.com.opac.sfsu.edu/pqdweb?index=0&did=44118930&SrchMode=1&sid=7&Fmt=3&VInst=PROD&VType=PQD&RQT=309&VName=PQD&TS=1120598508&clientId=17866> “Country Background Notes: Australia.” International Trade Library. Sep. 2004. STAT-USA. Bureau of East Asian and Pacific Affairs. 19 June 2005 < http://0-www.stat-usa.gov.opac.sfsu.edu/miscfiles.nsf/BNOTES/0D9080E05178C8FB85256F1E005FE27B?OpenDocument&sessID=204C072F0635730> “Country Commerce Australia.” EIU. 2005. The Economist. 21 Jun. 2005. <http://www.eiu.com>. “Country Commerce Hong Kong.” EIU. 2005. The Economist. 21 Jun. 2005. <http://www.eiu.com>. “Country Watch – Hong Kong.” Country Review.2005. Country Watch. 22 Jun. 2005. <http://www.countrywatch.com>. “Country Watch – Australia.” Country Review. 2005.Country Watch. 22 Jun. 2005. <http://www.countrywatch.com> “Digital Distribution Australia Selects Spectrum,(R) Infinity.” Asia Pulse. Jan. 2005. Factiva. Dow Jones Reuters Business Interactive LLC. 22 June. 2005. <http://0-global.factiva.com.opac.sfsu.edu/en/eSrch/ss_hl.asp> “Every Day Low Price-An Emerging Trend”. ACNielsen Trends &Insights. 2005. ACNielsen.2 July.2005 < http://www2.acnielsen.com//pubs/2003_q3_ap_edlp/shtml> Fallon, Daniel. “Green Machines.” The Sunday Herald. 2005. Factiva. Dow Jones Reuters Business Interactive LLC. 28 June.2005. < http://0-global.factiva.com.opac.sfsu.edu/en/eSrch/ss_hl.asp > “Foreign-owned regional operations in HK hit an all time high.” Nov. 2001. Government Information Centre Hong Kong Special Administrative Region of The People's Republic of China. 22 June. 2005 <http://www.info.gov.hk/censtatd/eng/press/ops/1101/061101.htm>
29
Harbour, Darling. “Wine Industry Outlook: Consumption Demographics, Market Segmentation, Trends and Opportunities.” 25, Nov. 2004. <http://www.roymorgan.com/resources/pdf/papers/20041201.pdf>.
Hargrave-Silk, Atifa. “Internet trumps 'old' media on influence.” Media. 2004:17. ABI/INFORM Global. ProQuest. 22 June. 2005 <http://0-proquest.umi.com.opac.sfsu.edu/pqdweb?index=3&did=656876281&SrchMode=1&sid=3&Fmt=3&VInst=PROD&VType=PQD&RQT=309&VName=PQD&TS=1119508794&clientId=17866#fulltext>
Hart, E. Allison, Rosenberger III, J. Philip. “The effect of corporate image in the formation of customer loyalty: an Australian replication.” Australasian Marketing Journal, 2004. ABI/INFORM Global. ProQuest. 23 Jun. 2005. <http://0-proquest.umi.co.opac.sfsu.edu/pqdweb?index=13&did=817021021&SrchMode=1&sid=3&Fmt=4&VInst=PROD&VType=PQD&RQT=309&VName=PQD&TS=1120449797&clientId=17866>.
“Hong Kong.” Nations of the World. 2005. Nationmaster.com. 21 Jun. 2005. < http://www.nationmaster.com/country/hk/People>. “Hong Kong Shoppers Ranks 1st in Asia In Unplanned Shopping.” ACNielsen Press Room. ACNielsen, 10 June, 2004. <http://www2.acnielsen.com/news/20040610_ap.shtml>. Keeling, Phil. “Personal Security Equipment.” US&FCS Market Research Report-Australia. May.2001. STAT-USA. U.S. & Foreign Commercial Service and U.S. Department of State. 22 June 2005 <http://0-www.stat-usa.gov.opac.sfsu.edu/mrd.nsf/vwISA_Country/6DFD621B338495EE85256F83002C1183?OpenDocument&sessID=D0A606D52425190>
Kotler, Philip and Keller, Kevin. Marketing Management. New Jersey: Pearson,2006
“OECD Guidelines for Multinational Enterprises.” April. 2003. Foreign Investment Policy Division, The Treasure. Australia. 20 June 2005.
“Power Distance.” Wikipedia-the free encyclopedia. 2005.Wikipedia Foundation.1 July.2005 < http://en.wikipedia.org/wiki/Power_distance> & < http://en.wikipedia.org/wiki/Collectivist>
“Pricing For Success”. ACNielsen Trends &Insights. 2005. ACNielsen.2 July.2005 < http://www2.acnielsen.com//pubs/2003_q3_ap_pricing/shtml> “Profile: Australia.” Background Note. Dec. 2004. U.S. Department of State. 21, Jun. 2005. <http://www.state.gov/r/pa/ei/bgn/2698.htm> “Profile: Hong Kong.” Background Note. Mar. 2005. U.S. Department of State. 21 Jun. 2005 <http://www.state.gov/r/pa/ei/bgn/2747.htm>. “Retail Wars Just Boomerang Back.” Precision Marketing. 2003: P.9. ABI/INFORM Global. ProQuest. 2 July.2005
30
<http://0-proquest.umi.com.opac.sfsu.edu/pqdweb?index=4&did=395155111&SrchMode=1&sid=5&Fmt=3&VInst=PROD&VType=PQD&RQT=309&VName=PQD&TS=1120598212&clientId=17866> Schwartz, Susan. “Discounts May Be There For The Asking.” South China Morning Post.2002: 4. ProQuest Newspapers. ProQuest. 22 June.2005<http://0-proquest.umi.com.opac.sfsu.edu/pqdweb?index=3&did=247677981&SrchMode=1&sid=4&Fmt=3&VInst=PROD&VType=PQD&RQT=309&VName=PQD&TS=1120597714&clientId=17866> “Should TV Food Commercial Targeting Children Be Banned?” The Jakarta Post.2005: 7. ProQuest Newspapers. ProQuest. 1 July. 2005 <http://0-proquest.umi.com.opac.sfsu.edu/pqdweb?index=0&did=846538741&SrchMode=1&sid=10&Fmt=3&VInst=PROD&VType=PQD&RQT=309&VName=PQD&TS=1120599176&clientId=17866> Skype, Hutchison “Team Up To Deliver Software To HK Market.” Asia Pulse. Feb.
2005. Factiva. Dow Jones Reuters Business Interactive LLC. 22 June 2005. <http://0-
global.factiva.com.opac.sfsu.edu/en/eSrch/ss_hl.asp>
Tai, H C Susan. “The Relationship of Cultural Values and Message Strategies in Service Advertising.” Marketing Intelligence & Planning. 2004: Vol.22, Iss.4, 438. ABI/INFORM Global. ProQuest. June.21.2005<http://0-proquest.umi.com.opac.sfsu.edu/pqdweb?index=2&did=700513161&SrchMode=1&sid=2&Fmt=4&VInst=PROD&VType=PQD&RQT=309&VName=PQD&TS=1120595148&clientId=17866> “Trade Profile.” April.2005. Statistic Database. World Trade Organization. July.5.2005<http://stat.wto.org/CountryProfile/WSDBCountryPFView.aspx?Language=E&Country=AU,HK>
Weir, James. “Shoppers full of confidence.” The Press. Mar. 2005. ABI/INFORM Global. ProQuest.23 Jun. 2005. < http://0-proquest.umi.com.opac.sfsu.edu/pqdweb?index=16&did=811957071&SrchMode=1&sid=1&Fmt=3&VInst=PROD&VType=PQD&RQT=309&VName=PQD&TS=1120427145&clientId=17866>.
Yim, Olevia. “Safety and Security Equipment in Hong Kong.” US&FCS Market Research Report. June.2004. STAT-USA. U.S. & Foreign Commercial Service and U.S. Department of State. 20 June 2005. <http://0-www.stat-usa.gov.opac.sfsu.edu/mrd.nsf/vwISA_Country/2068875F48D6CCDA85256FA9002C0A82?OpenDocument&sessID=E04C06D9248547C>
31
Appendices
AustralianGDP
1998 1999 2000 2001 2002 Real GDP Growth Rate % (percent) 5.300 4.500 2.800 2.700 3.700
Population Growth Rate (percent) 1.100 1.060 1.040 1.010 0.9800
Real Gross Domestic Product Per Capita Growth Rate (percent) 4.160 3.400 1.750 1.680 2.700
(Source from countrywatch.com)
Graph1:
0
5000
10000
15000
20000
25000
30000
$millions
1990 1993 1996 1999 2002 2003
Year
Australia Major Exports Trend
Fuels and miningproductsAgricultural products
Manufactures
Food
Table 1:
Exports 1990 1993 1996 1999 2002 2003 Fuels and mining products 16750 15814 20539 19606 25298 26922 Agricultural products 11628 12260 17737 15292 17060 16337
Manufactures 6902 10102 16101 14935 15502 17214 Food 8531 8988 13314 11862 13309 12812
32
Graph 2:
010000200003000040000500006000070000
$millions
1990 1993 1996 1999 2002 2003
Year
Australia Major Imports Trend
Manufactures
Manchinery and transportequipmentoffice and telecomequipment
Table 2:
Imports 1990 1993 1996 1999 2002 2003
Manufactures 31609 35518 52214 55237 57270 69144 Machinery and transport equipment 17210 18685 28828 30774 31759 38484 office and telecom equipment 4262 5284 8391 9220 8635 10259
Graph 3:
0
50000
100000
150000
200000
250000
$millions
1990 1993 1996 1999 2002 2003
Year
Hong Kong Major Exports Trend
Manufactures
Machinery and transportequipmentOffice and telecomequipment
33
Table 3:
Exports 1990 1993 1996 1999 2002 2003 Manufactures 75642 125999 166884 164704 191554 215487
Machinery and transport equipment 21176 41386 58238 60761 87290 105311 Office and telecom equipment 12886 21346 34593 38418 59298 72323
Graph 4:
0
50000
100000
150000
200000
250000
$millions
1990 1993 1996 1999 2002 2003
Year
Hong Kong Major Imports Trend
Manufactures
Machinery and transportequipmentOffice and telecomequipment
Table 4:
Imports 1990 1993 1996 1999 2002 2003
Manufactures 70530 123339 174812 161030 188251 212172 Machinery and transport equipment 23031 48798 73550 69691 95347 112337 Office and telecom equipment 12326 23993 41588 43554 64703 77406
34
Graph 5:
(Source from Roy Morgan, Wine Industry Outlook)


![[PPT]Consumer Behavior and Marketing Strategy - Lars … to CB.ppt · Web viewIntro to Consumer Behavior Consumer behavior--what is it? Applications Consumer Behavior and Strategy](https://img.pdfslide.us/doc/110x75/5af357b67f8b9a74448b60fb/pptconsumer-behavior-and-marketing-strategy-lars-to-cbpptweb-viewintro.jpg)