Embed Size (px)
DESCRIPTION
Understanding Business Drivers – Taking the mystery out of Accounting ... And much more to come …. Presented by J ohn Petty , FCPA, FCA Client Director, Pitcher Partners 0417 367 951 [email protected]. And Yvette Pietsch, FCA - PowerPoint PPT Presentation
Citation preview

Understanding Business Drivers – Taking the mystery out of Accounting ...
And much more to come ….
Presented byJohn Petty, FCPA, FCA Client Director, Pitcher Partners0417 367 [email protected]
AndYvette Pietsch, FCAPartner, Taxation & Business AdvisoryPitcher Partners(02) 9221 [email protected]

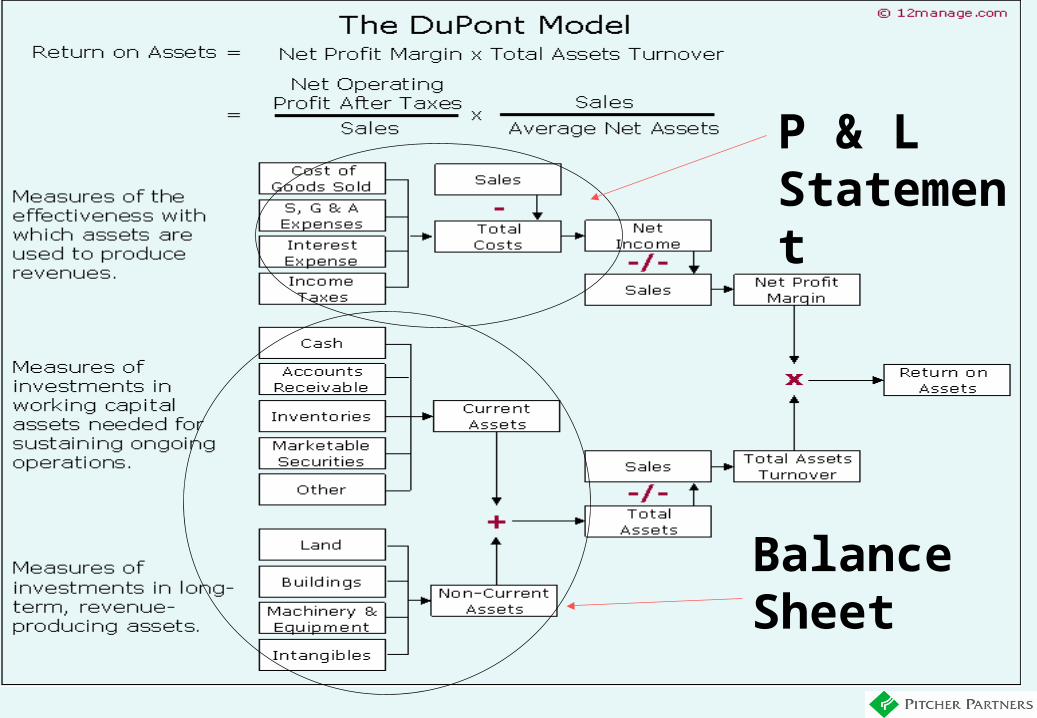
P & L Statement
Balance Sheet

Session outcomes
• List the three key financial reports
• Detail what the key financial reports do and do
not tell you, limitations and when to use
• Latest Information reporting trends

The Key Financial Reports
•The Profit and Loss Statement (P & L)
[Statement of Financial Performance]
•The Balance Sheet (BS)
[Statement of Financial Position]
•The Cash Flow Statement (CFS)
[Statement of Cash Flow]

Profit and Loss Statement (P & L)‘Statement of Financial Performance’
Displays:
• Profit or Loss for period (one or other)
Does not display:
• Cash flow for period
• Cash position
• Funds available for distribution
Monthly does not record reality or performance
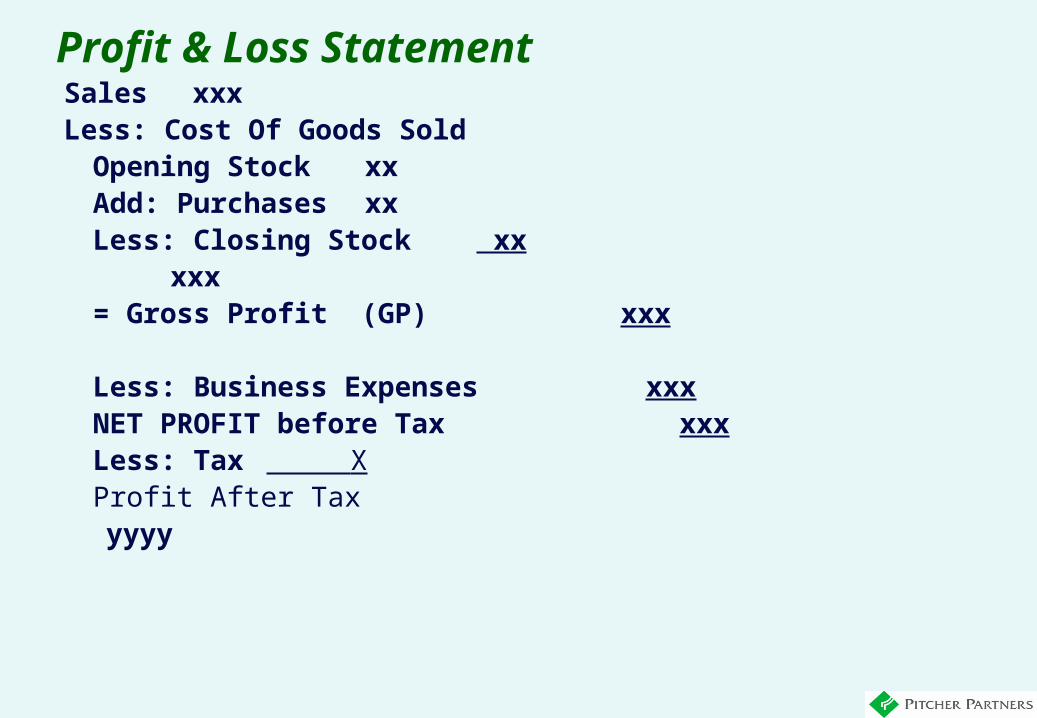
Profit & Loss StatementSales xxxLess: Cost Of Goods Sold
Opening Stock xxAdd: Purchases xx Less: Closing Stock xx
xxx= Gross Profit (GP) xxx
Less: Business Expenses xxx NET PROFIT before Tax xxxLess: Tax XProfit After Tax yyyy
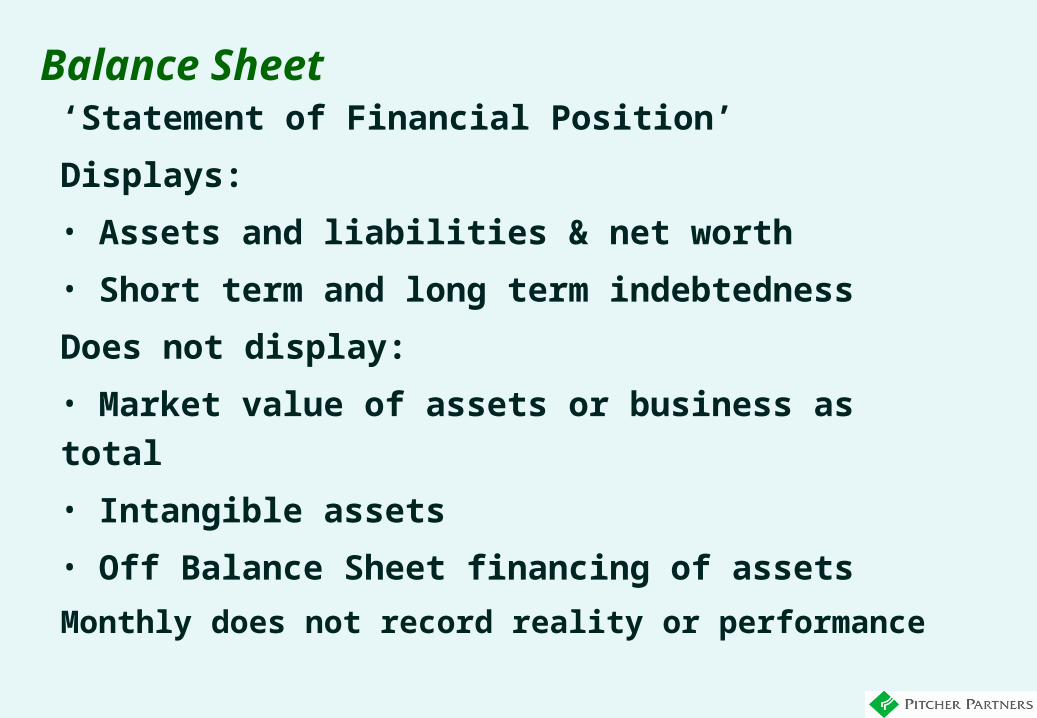
Balance Sheet‘Statement of Financial Position’
Displays:
• Assets and liabilities & net worth
• Short term and long term indebtedness
Does not display:
• Market value of assets or business as total
• Intangible assets
• Off Balance Sheet financing of assets
Monthly does not record reality or performance

AssetsCurrent xxxNon-Current xxxTotal Assets xxx
Less: LiabilitiesCurrent xxxNon-Current xxxTotal Liabilities xxx
Net Assets XXXXRepresented by:
Owners Equity:Share Capital xxxRetained Profits xxx
XXXX
Balance Sheet – Narrative Format

What the Funds have been invested in
Current AssetsCash on HandAccounts ReceivableStockPrepaid Expenses
Non Current AssetsPlant and EquipmentMotor VehicleGoodwill
How the Business is financedCurrent LiabilitiesBank OverdraftAccounts PayableAccrued Expenses
Non Current LiabilitiesLoans
ProprietorshipShare CapitalRetained Profits
Balance Sheet --- ‘T’ Account format

Cash Flow statement
Displays:
• Cash flow from operations generated in period
• Cash flow from borrowings
• Cash flow from sale of assets (selling the farm)
{HISTORICAL}
Does not display:
• Future cash flow position

Cash Flows from Operating ActivitiesReceipts from customers xxxPayments to suppliers xxxIncome taxes paid xxx
xxx
Cash Flows from Investing ActivitiesPayments for Property, Plant & Equipment xxxProceeds from sale of PPE xxx
xxx
Cash Flows from Financing ActivitiesProceeds from borrowings xxxRepayments of borrowings xxx
xxx
Net increase/(decrease) in cash held XXX
Cash at beginning of the period XXXCash at the end of the period XXX
Cash flow statement

RATIO ANALYSIS
Profitability
Liquidity
Efficiency
Financial
Shareholder value
Other non financial

PROFITABILITY RATIOS
Gross Profit Ratio %
Gross Profit
Sales X 100
Net Profit Ratio %
Net Profit
Sales X 100 Operating Expense Ratio %
Expense Item
Sales X 100
Return on Investment
Pre Tax Profit
Owners Equity X 100
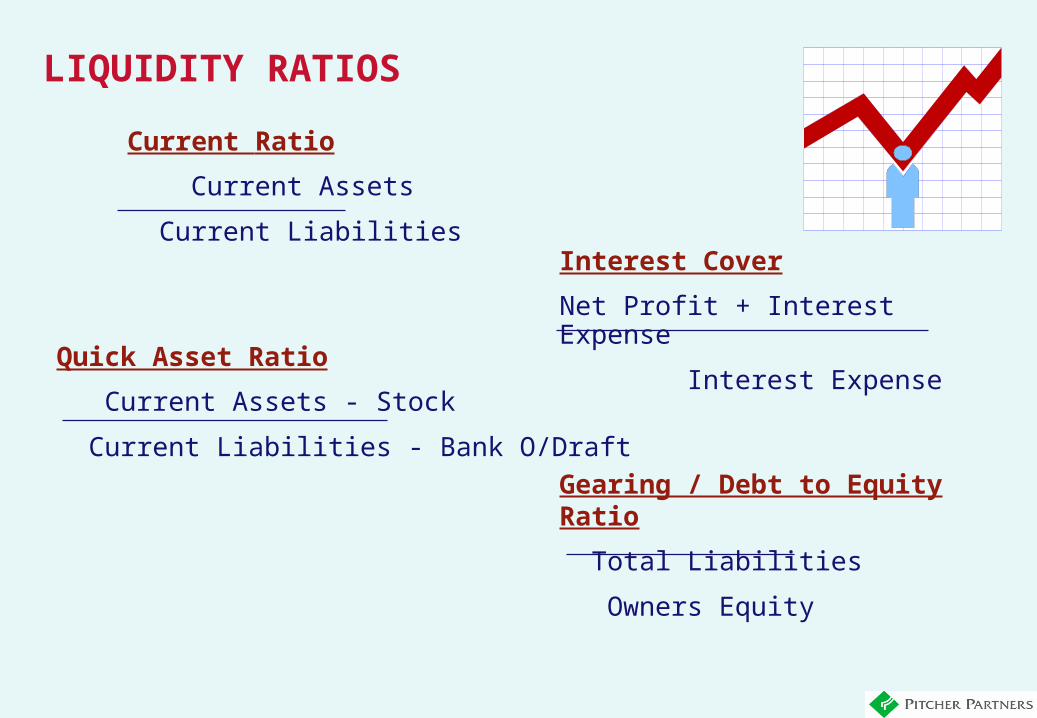
LIQUIDITY RATIOS
Current Ratio
Current Assets
Current Liabilities
Quick Asset Ratio
Current Assets - Stock
Current Liabilities - Bank O/Draft
Gearing / Debt to Equity Ratio
Total Liabilities
Owners Equity
Interest Cover
Net Profit + Interest Expense
Interest Expense
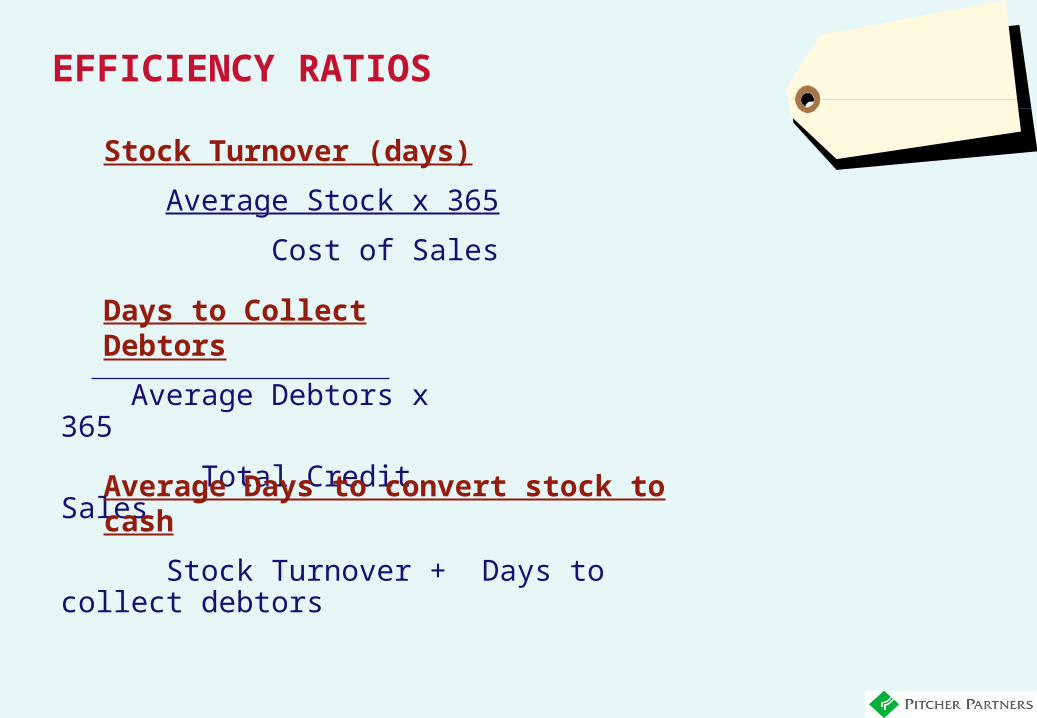
EFFICIENCY RATIOS
Stock Turnover (days)
Average Stock x 365
Cost of Sales
Days to Collect Debtors
Average Debtors x 365
Total Credit Sales
Average Days to convert stock to cash
Stock Turnover + Days to collect debtors

SHAREHOLDER VALUE RATIOS
ROSF Ratio
Net profit
Shareholder funds
PE Ratio
Share selling price
Earnings per Share
EPS
Net profit
Per shareNTA
Net tangible assets
Share
Dividend per share
Dividend earned per share

OTHER NON FINANCIAL RATIOS
Sales per employee
Total Sales
No of employees
Assets per employee
R & D Per $ of sales

WORKING CAPITAL RATIOS
Average stock turnover (days)
COGS
Average stock Days/debtors ratio
Trade debtors
Average Daily salesWorking capital ratio
Current assets
Current liabilities Liquid ratio
Quick assets
Quick liabilities

Value has shifted from Tangible to Intangible Assets
Percentage of market value related to …
Intangible Assets
Tangible Assets
1982 1992 2000
38%
62%
62%
85%
38% 15%

Intangible Assets
Tangible Assets
2000
85%
15%
The Intellectual Capital Model:Human Capital (the skills & knowledge, culture and loyalty of our people)
Structural Capital(patents, processes, databases, networks, recipes, formulas, etc)
Customer Capital(relationships with customers and suppliers)
Value has shifted from Tangible to Intangible Assets
Percentage of market value related to …

SLAM DUNK!
1 STRATEGIC BUDGETING – ROLLING FORECASTS2 BALANCED SCORECARD / CORPORATE METRICS SCORECARD3 TRIPLE BOTTOM LINE REPORTING 4 AT OR Moving TOWARDS ONE DAY REPORTING5 REPORT ON A PAGE (ROAP)6 ENHANCED CAPITAL AND REDUCED OPERATING SPEND FOCUS7 STRATEGIC REVENUE MANAGEMENT & PRICING8 TARGET PRICING & TARGET COSTING: Manufacturing to a Price9 TOTAL LIFE CYCLE COSTING / STEWARDSHIP10 FULL PRODUCT/SERVICE COSTS11 TOTAL WORKING CAPITAL MANAGEMENT12 PROCESS MAPPING / BUSINESS PROCESS REENGINEERING13 BENCHMARKING – Internal and External14 CUSTOMER PROFITABILITY ANALYSIS ) 15 CUBE MANAGEMENT ) 16 CHANNEL MANAGEMENT )17 ACTIVITY BASED COSTING / MANAGEMENT )18 NEW TRANSFER PRICING MODELS egPURCHASER - PROVIDER ROLE19 SERVICE LEVEL AGREEMENTS / EXPENSE REDUCTION ANALYSIS
20 MANAGING & ACCOUNTING FOR QUALITY21 EVA / SVA / MVA / VBM22 KNOWLEDGE MANAGEMENT23 REAL OPTIONS ANALYSIS : STRATEGIC PREDICTIVE ANALYSIS
Strategic Business Management
Score: … / 23

Bye Bye Budgeting… “The annual budget is dead. Long live the rolling forecast.”Annie Gurton, International Management Magazine
1 July 30 June1 Jan
NEW BUDGET FOCUS/APPROACH:‘ROLLING FORECASTS’
6 X Quarterly Rests
6 X Quarterly Rests
6 X Quarterly Rests
2 4
The 90 day Deliverables

ONE DAY REPORTING (ODR)
ODR focuses on condensing the monthly management reporting cycle so that it can be completed within one working day with the appropriate reports disseminated to management [UPSTREAM & DOWNSTREAM]. It challenges existing practices that have taken anywhere between a couple of days and a few weeks to one that effectively completes the reporting process within an eight hour timeframe.
THE 8 Hour REPORT THE 4 PM REPORT
Then days 2 and 3 are used for management action.
DAY 50

THE BALANCED SCORECARD
Customer Perspective
Goals Measures
Financial Perspective
Goals Measures
Internal BusinessPerspective
Goals Measures
Goals Measures
Innovation andLearning Perspective
How docustomerssee us?
How do we lookto our Shareholders?
What mustwe excel at?
Can we continueto improve ourcreate value?
CUSTOMER
FINANCIAL
LEARNING & GROWTH
INTERNALBUSINESSPROCESSES

FinancialObjectives Measures-
LeadMeasures-
LagTargets Initiatives
“To succeedfinancially,how shouldwe appearto our share-holders?”
Internal Business ProcessObjectives Measures-
LeadMeasures-
LagTargets Initiatives“To satisfy
shareholdersand ourcustomers,whatbusinessprocessmust weexcel at”
Vision and Strategy
CustomerObjectives Measures-
LeadMeasures-
LagTargets Initiatives
“To achieveour visionhow shouldwe appearto ourcustomers?”
Learning and GrowthObjectives Measures-
LeadMeasures-
LagTargets Initiatives“To achieve
our vision,how will wesustain ourability tochange andimprove?”
HRM/PeopleObjectives Measures-
LeadMeasures-
LagTargets Initiatives“To satisfy
shareholdersand ourcustomers,what peopleskilss andresourcesmust weexcel at”
SOMETHINGS MISSING: THE MOST VALUABLE ASSET
FINANCIAL
CUSTOMER
LEARNING & GROWTH
INTERNALBUSINESSPROCESSES
HRM/ PEOPLE

Financial Objectives Measures-
Lead Measures-
Lag Targets Initiatives
“To succeed financially, how should we appear to our share-holders?”
ENVIRONMENTALObjectives Measures-
LeadMeasures-
LagTargets Initiatives“To satisfy
shareholdersand ourcustomers,what peopleskilss andresourcesmust weexcel at”
SOCIAL
Objectives Measures-Lead
Measures-Lag
Targets Initiatives
“To achieve our vision how should we appear to our customers?”
TRIPLE BOTTOM LINE REPORTING:Looking for balance
FINANCIAL
SOCIAL / COMMUNITY
ENVIRON-MENTAL

FinancialObjectives Measures-
LeadMeasures-
LagTargets Initiatives
“To succeedfinancially,how shouldwe appearto our share-holders?”
Internal Business ProcessObjectives Measures-
LeadMeasures-
LagTargets Initiatives“To satisfy
shareholdersand ourcustomers,whatbusinessprocessmust weexcel at”
CustomerObjectives Measures-
LeadMeasures-
LagTargets Initiatives
“To achieveour visionhow shouldwe appearto ourcustomers?”
Learning and GrowthObjectives Measures-
LeadMeasures-
LagTargets Initiatives“To achieve
our vision,how will wesustain ourability tochange andimprove?”
H R M /P eo p leO bjec tive s M easu res-
L eadM easu res-
L agT arge ts In itia tive s“T o sa tis fy
sh a reh o ld e rsan d o urcu s to m ers ,w h a t p eo p lesk ilss an dre so u rce sm u st w eex cel a t”
ENVIRONMENTALObjectives Measures-
LeadMeasures-
LagTargets Initiatives“To satisfy
shareholdersand ourcustomers,what peopleskilss andresourcesmust weexcel at”
SOCIALObjectives Measures-
LeadMeasures-
LagTargets Initiatives“To achieve
our visionhow shouldwe appearto ourcustomers?”
HRM/ PEOPLE
SOCIAL / COMMUNITY
LEARNING & GROWTH
CUSTOMER
ENVIRON-MENTAL
INTERNALBUSINESSPROCESSES
FINANCIAL
TOWARDS THE SEVEN SCORES OF SUCCESS: THE FULL PICTURE