Embed Size (px)
Citation preview

Understanding Budget and Financial Audit Analysis
Great Public Schools for Every StudentC4OC E N T E R F O RO R G A N I Z I N G
A Handbook for Higher Education Association Leaders

i
Dennis Van Roekel, President
Lily Eskelsen, Vice President
Becky Pringle, Secretary-Treasurer
John Stocks, Executive Director
Copyright © 1989 by the
National Education Association of the United States
All rights reserved.
2nd printing 1991
3rd printing 1993
Revised Edition 1996
Revised Edition 1998
Revised Edition 2002
Revised Edition 2013

ii
Acknowledgments
Valerie Wilk and Dan Rivera of NEA’s Center for Organizing provided advice and
encouragement throughout the writing of this Handbook. Pat Richey of the Michigan Education
Association provided invaluable help on describing the newest accounting changes and in
identifying sources of budgetary information. Christine Rupnow of the Pennsylvania State
Education Association and Donovan King of NEA’s ESP Quality Department provided
extensive materials concerning privatization. Laura Simonini of the Ohio Education Association
formatted the financial tables. We are grateful to all of them for their contributions.
About the Authors
Leroy W. Dubeck, Ph.D., is a professor of physics at Temple University in Philadelphia,
Pennsylvania. He has been chair of the Faculty Senate Budget Review Committee of Temple
University and a faculty representative to the Business and Finance Committee of the Board of
Trustees of Temple University. Dr. Dubeck was also chair of the Budget Priorities Committee of
the College of Arts and Sciences and the College of Science and Technology of Temple
University. He was national secretary treasurer of the American Association of University
Professors for four years and chaired that organization’s Collective Bargaining Congress for two
years. He was chief negotiator of the Temple University faculty union for nine years and was
president of that organization for four years.
Dr. Dubeck is author of Budget Handbook for Association Leaders in Higher Education
Units (Washington, D.C.: National Education Association, 2002); co-author of College and
University Budgeting: An Introduction for Faculty and Academic Administrators (Washington,
D.C.: National Association of College and University Business Officers, 1984); and co-author of
the Leadership Manual for Association Leaders in Higher Education Units: Technology

iii
Bargaining, Policy and Costs (Washington, D.C.: National Education Association, 2000). He
can be reached at [email protected].
Gregg M. Gascon, Ph.D. is the Director of Advanced Analytics at The Ohio State
University Health Plan, an affiliated corporation of The Ohio State University Wexner Medical
Center. In that position, Dr. Gascon is responsible for performing health care cost and quality
analyses for opportunity assessment; developing outcome metrics to evaluate initiatives and
performing related analyses; building, testing, and validating statistical models; psychometric
analyses, and conducting cost effectiveness studies. In that context, he collaborates with health
care providers at the Medical Center and faculty and staff from the University.
From 1997 through 2011, Dr. Gascon was a Uniserv Education Research Development
Consultant and the higher education liaison of the Ohio Education Association. In that position,
he was responsible for researching, implementing, and evaluating initiatives in employee
benefits, health care, worksite wellness, and higher education finance. In that context, he
collaborated with school staff at the primary, secondary, and college levels, and worked closely
with state retirement systems. While at the OEA, Dr. Gascon was Chair of the Public Schools
Healthcare Advisory Committee, and a member of the State Action on Avoidable Re-
Hospitalizations Advisory Committee, the Buckeye Healthy Schools Alliance, and the Healthy
Ohio Advisory Council, which was established to provide guidance and advice to the Ohio
Department of Health’s Office of Healthy Ohio regarding disease prevention, health care
disparities, and measuring progress and outcomes of programs related to health promotion and
the prevention of chronic disease and injury. Since 2007, Dr. Gascon has lectured on research
methods, needs assessment, educational survey methods, program evaluation, and applied
evaluation design at The Ohio State University. He can be reached at [email protected].

iv
Table of Contents Acknowledgments........................................................................................................................ ii About the Authors ........................................................................................................................ ii Table of Contents ........................................................................................................................ iv List of Figures ...............................................................................................................................v List of Tables .............................................................................................................................. vi Preface...........................................................................................................................................1 Chapter 1: Introduction .................................................................................................................4 Chapter 2: Principles of Accounting ...........................................................................................20 Chapter 3: Financial Statements .................................................................................................35 Chapter 4: Derivative Instruments ..............................................................................................68 Chapter 5: Comparative and Ratio Analyses ..............................................................................79 Chapter 6: Analysis and Projection of Income ...........................................................................94 Chapter 7: Analysis and Projection of Expenditures ................................................................113 Chapter 8: Constraints and Flexibility in the Budget: Fiscal Crises .........................................132 Chapter 9: Privatization in Higher Education ...........................................................................158 Chapter 10: Sources of Financial Information ..........................................................................173 Appendix A: Pronouncements of the Governmental Accounting Standards Board .................180 Appendix B: Pronouncements of the Financial Accounting Standards Board .........................190 Bibliography .............................................................................................................................192 Glossary ....................................................................................................................................197

v
List of Figures
1. GASB Hierarchy of Generally Accepted Accounting Principles ............................................9
2. GASB Characteristics of Effective Financial Communications ............................................12
3. Fund Balance Classifications Before and After GASB Statement No. 54 .............................33
4. The Accounting Process .........................................................................................................36
5. The Financial Auditing Process .............................................................................................40

vi
List of Tables
1. ABC University Statement of Net Assets ...............................................................................42
2. ABC University Statement of Revenues, Expenses and Changes in Net Assets....................46
3. ABC University Statement of Cash Flows under GASB 35 (Direct Method) ..................... 50
4. ABC University Statement of Financial Position ...................................................................62
5. ABC University Statement of Activities.................................................................................64
6. ABC University Statement of Cash Flows (Indirect Method) ............................................... 67
7. Revenues of Title IV Institutions, by Level and Control of Institution, Accounting Standards Utilized, and Source of Funds: United States, FY 2007 ............................................96
8. Expenditures of Title IV Institutions, by Level and Control of Institution, Accounting Standards Utilized, and Source of Funds: United States, FY 2007 ..........................................115

BUDGET AND FINANCIAL AUDIT ANALYSIS FOR HIGHER EDUCATION ASSOCIATION LEADERS
1
PREFACE
In many ways, the economic climate of the past few years has been difficult for our
nation in general, and for education in particular. This Handbook has been written to assist
Association leaders in higher education as NEA-affiliated institutions meet the challenges
imposed upon them by circumstances occurring beyond the walls of the institution.
The worldwide credit crisis and recession which struck in 2008 will have long-lasting
repercussions on governmental revenues and expenditures for some time to come. The expansion
of the federal deficit, the end of federal stimulus aid, the underfunding of Medicare, Medicaid,
Social Security, and state and local pension programs have produced financial strains on the
federal and state budgets not seen for many years. Less money is available for public and private
higher education as state appropriations to public higher education continue to fall and
endowments continue to shrink due to low investment returns and decreasing alumni
contributions.
We think that these factors will be associated with several negative consequences for the
nation and for our nation’s postsecondary education system. With few exceptions, most high-
salary positions both now and in the future will require higher levels of educational attainment in
every state of the nation. With this demand, the price of tuition will continue to outpace inflation
as state appropriations to higher education fail to keep up with the need. While federal financial
aid programs have expanded, this will continue to be targeted towards low-income students,

BUDGET AND FINANCIAL AUDIT ANALYSIS FOR HIGHER EDUCATION ASSOCIATION LEADERS
2
leaving middle income students strapped for aid. Many students will be effectively locked out of
traditional higher education opportunities.
We believe that the economic realities facing higher education today will impact higher
education staff as well. Specifically, we think that the higher education workforce will continue
to move away from full-time and tenured positions towards a part-time and contingency
workforce. Those faculty and staff members who remain will face an increased expectations and
workloads. Faculty and staff will also find that their salary increases will not keep up with
inflation, and public calls for reduced benefits in the public sector will increase as the effects of
allowing our manufacturing base to move overseas and the increasing disappearance of our
middle class standard of living continue to be realized. It almost goes without saying that the
number of tenured faculty positions will continue to decrease.
In the midst of this economic climate, the Governmental Accounting Standards Board
(GASB) has released a number of statements that require greater accountability from higher
education institutions. This edition of the handbook covers the changes through the second
quarter of 2011. We recommend that faculty and staff Association leaders and their management
counterparts work together on budget and/or finance committees to support the institutional
mission and preserve the institution’s long-term solvency without sacrificing the assets that
provide the reputational capital that our higher education institutions currently enjoy. We also
encourage faculty and staff Association leaders and members to learn the basics of accounting,
financial reporting, and financial analysis. In higher education environments, faculty involved in
teaching accounting, auditing, and finance should be asked to lend their assistance to this effort
in a manner harkening back to the ‘mutual aid’ concept of unionism of the nineteenth century;

BUDGET AND FINANCIAL AUDIT ANALYSIS FOR HIGHER EDUCATION ASSOCIATION LEADERS
3
this assists the effort to understand college and university finances and helps associations in their
internal organizing efforts (Bacharach, Bamberger, & Sonnenstuhl, 2001). In the spirit of this
effort, we provide Association leaders with this Handbook in order to teach the basics of these
ideas, identify the right questions to ask, and urge Association leaders to obtain the necessary
documents in order to verify that the strategic plans of the institution are the best ones to
implement to reach the institution’s mission.

BUDGET AND FINANCIAL AUDIT ANALYSIS FOR HIGHER EDUCATION ASSOCIATION LEADERS
4
CHAPTER 1 INTRODUCTION
Objectives
After completing Chapter 1, readers will be able to:
� Differentiate the processes of accounting and auditing.
� Identify the differences between the financial information that is offered in a budget and that which is presented in the context of a financial audit.
� Understand how various accounting and financial reporting boards influence the development and presentation of the financial audits of higher education institutions.
� Articulate the objectives of accounting and financial reporting for public higher education institutions.

BUDGET AND FINANCIAL AUDIT ANALYSIS FOR HIGHER EDUCATION ASSOCIATION LEADERS
5
Introduction
George Lucas, the producer of the Star Wars series of movies, made a telling point about
budgets in THX 1138, his first feature length science fiction film. The setting is an underground
society controlled by computers and patrolled by robot guards. The hero makes a break for the
outside, with the robots in hot pursuit. Then, just as the robots are about to overtake the hero, the
computers order a halt. The cost of the chase has reached its budgetary limit.
As the budget determined the fate of the hero of THX 1138, so do the budgets of present-
day American colleges and universities determine the educational and work experience of
faculty, staff and students. Faculty members are, for example, told that an academic project
cannot be implemented because “ It isn’ t in the budget.” They are very often given budgetary
reasons for their salary increases, benefits, and support services. Yet many higher education
employees are unaware of how to read or analyze a budget, despite the fact that every aspect of
academic life is influenced by an institution’s budget. What do these columns of numbers mean?
What constitutes the entire budget of an institution? What revenue sources does the institution
rely upon? What do the institution’s expenditures say about the priorities of the institution? How
can the financial health of an institution be determined? As educators, we know that ignorance is
rarely bliss. It is certain disaster in budgetary matters.
This Handbook, written primarily to help faculty and staff members with little prior
experience in college or university budgeting and financial audit analysis, provides an
introduction to these subjects in order to demystify institutional finance for faculty and staff
members so that they will be able to focus on pertinent questions, locate the most useful

BUDGET AND FINANCIAL AUDIT ANALYSIS FOR HIGHER EDUCATION ASSOCIATION LEADERS
6
information, and analyze college and university finances that exert control over so many facets
of their academic life. In finance, as in other areas, knowledge is power.
Budgets
Organizational budgets are prepared in part by financial professionals who systematically
record, analyze and report its financial transactions. The people who are in charge of this work
are known as accountants, and they follow a specific set of rules and regulations in order to
present a fair and accurate presentation of the organization’s finances to its shareholders in the
case of a private organization and to the public in the case of a public organization. A private
organization is one that is controlled by an individual, group of individuals or shareholders,
while a public organization is controlled by a government. Auditors are financial professionals
who are specially trained to review the documents, records, reports, systems of internal control,
accounting and other financial procedures of an organization in order to report on the fairness of
the financial information reported by an organization in its financial statements and special
reports. Both private and public organizations hire accountants and internal auditors to manage
their finances; public organizations are also subject to regular audits from external auditors who
work directly for or are contracted by governments to produce audit reports on an annual or
biannual basis. Audit reports are founded in an organization’s financial statements, which stem
in part from the organization’s budget.
Governments use two control mechanisms to ensure that the resources that are provided
through taxation are used as intended: the budget and the governmental fund structure (GASB

BUDGET AND FINANCIAL AUDIT ANALYSIS FOR HIGHER EDUCATION ASSOCIATION LEADERS
7
Concepts Statement 1, Objectives of Financial Reporting, p. 10). The first will be discussed
herein, while fund accounting will be covered Chapter 2.
The budget of an organization serves a variety of purposes. Since resources are always
insufficient to satisfy the needs of all units in an institution, a budget serves as a mechanism for
setting priorities among an institution’s many activities. In addition, a budget summarizes the
agreement between a given budget unit and the rest of the institution. That is, in exchange for a
given level of funding in the budget, a department agrees to conduct a certain number of courses,
advise students, and provide public service. A budget also serves as a mechanism (or norm) for
monitoring and controlling expenses. Thus when a department seeks to exceed the expenditures
assigned to it in the budget, it has to justify the variation. In addition, a budget serves as a
mechanism for communications by informing the academic community of the priorities of the
institution. As such, the budget reflects the outcome of a political process that may have many
levels—from the legislature and the governor’s office down through many levels of
administration to the individual departments. Thus, budgets are an expression of public policy
and financial intent, while they are also a form of legal control for the institution and its chief
financial means for evaluating performance (GASB Concepts Statement No. 1, Objectives of
Financial Reporting, p. 9).
Once implemented, budgets are compared to the actual financial experience of
institutions over the course of time. At the conclusion of each fiscal year, financial professionals
employed by the institution produce data from which the institution’s comprehensive annual
financial repor t (CAFR) is developed from its financial statements and related information and

BUDGET AND FINANCIAL AUDIT ANALYSIS FOR HIGHER EDUCATION ASSOCIATION LEADERS
8
is published for stakeholder review. For public higher education institutions, these stakeholders
include the government and the general public. In developing and implementing the budget,
institutional financial professionals rely upon a set of financial rules and regulations established
for public and private institutions by one or more independent accounting and financial review
boards.
Accounting and Financial Reporting Boards
The financial rules and regulations of public and private institutions are governed by
generally accepted accounting pr inciples that are set by the Financial Accounting
Foundation (FAF), an independent, private sector institution incorporated in 1972. FAF holds
the responsibility for the oversight and administration of the Federal Accounting Standards
Advisory Board (FASAB), which provides accounting and financial reporting standards for the
federal government, for the Financial Accounting Standards Board (FASB) and its advisory
councils, which sets similar standards for profit-seeking businesses and nongovernmental not-
for-profit organizations, and the Governmental Accounting Standards Board (GASB) and its
advisory councils, which develops similar standards for state and local governments and public
not-for-profit institutions. It also provides oversight and administration for the Financial
Accounting Standards Advisory Council (FASAC) and the Governmental Accounting Standards
Advisory Council (GASAC).
The accounting and financial reporting standards set by each Board are published in the
form of statements. Each Board also develops and distributes interpretations in order to expand
on the ideas embedded in the statements, and technical bulletins to assist organizations in the

BUDGET AND FINANCIAL AUDIT ANALYSIS FOR HIGHER EDUCATION ASSOCIATION LEADERS
9
implementation of the statements (Copley, 2011). To help financial professionals determine the
relative priority of all these standards, bulletins, and interpretations, GASB produced a hierarchy
of generally accepted accounting principles for state and local governments in March of 2009 in
GASB Statement No. 55. Figure 1 illustrates the sources of accounting principles that are
generally accepted in descending order of authority.1
Figure 1: GASB Hierarchy of Generally Accepted Accounting Principles
1 Here the role of the GASB Concept Statements relied upon in the field and in this Handbook should be noted. While they are not mentioned in the hierarchy illustrated in Figure 1, they are quite important. Their primary goal is to provide the “underlying philosophy and the boundaries for judgment” that guide the decision made by ever-changing GASB members with respect to accounting and financial reporting issues. In that context, they provide a link between the members of the GASB across the years, a foundation from which to decide issues of import for the field (Attmore, 2009).

BUDGET AND FINANCIAL AUDIT ANALYSIS FOR HIGHER EDUCATION ASSOCIATION LEADERS
10
In order to assist financial professionals in the conduct of their work, the Amer ican
Institute of Cer tified Public Accountants (AICPA) produces guides that are applicable to each
of the Boards. For the purposes of this Handbook, the authors will thus rely upon the GASB
Standards and Interpretations and the Audit and Accounting Guide for State and Local
Governments of March 1, 2010 (American Institute of Certified Public Accountants, Inc., 2010)
to assist Association leaders in conducting periodic reviews of the financial audits of public
higher education institutions. In order to facilitate understanding between those standards that are
applicable to private and public institutions, FASB and GASB worked with AICPA to define a
‘government’ in AICPA’s Audit and Accounting Guide: Not-for-Profit Organizations text as
follows:
“Public corporations and bodies corporate and public are governmental organizations. Other organizations are governmental organizations if they have one or more of the following characteristics:
1. Popular election of officers or appointment (or approval) of a controlling majority of the members of the organization’s governing body by officials of one or more state or local governments;
2. The potential for unilateral dissolution by a government with the net assets reverting to a government; or
3. The power to enact and enforce a tax levy.”
In addition, AICPA points out that institutions are presumed to be public if they have the
ability to issue debt directly that pays interest exempt from federal taxation (Copley, 2011, p. 6).
Hence, if a public higher education institution meets the standard set above, we can proceed with
research and analysis using the AICPA and GASB resources identified in this Handbook.

BUDGET AND FINANCIAL AUDIT ANALYSIS FOR HIGHER EDUCATION ASSOCIATION LEADERS
11
Objectives of Accounting and Financial Reporting
GASB Concepts Statement No. 1, Objectives of Financial Reporting, promulgates the
objectives of financial reporting for state and local governments in a complete and concise
manner. For GASB, the purpose of financial accounting in the public sector is to fulfill
government’s duty to be publicly accountable and to satisfy the needs of users who have limited
authority or access to the information. While financial statements are not the sole source of
information regarding a public institution’s finances, they are the core of financial reporting that
ultimately culminates in its comprehensive annual financial report. For higher education leaders,
financial statements that are reported according to generally accepted accounting principles
represent a standardized set of numbers for both labor and management.
The goal of financial reporting is to provide effective information for users; for the
GASB, this means that such information must be characterized by understandability, relevance,
timeliness, consistency, and comparability. Effective financial communication is of paramount
importance to systematic research and analysis, and relies upon financial statements that are
developed and presented in compliance with generally accepted accounting principles,
comprehensive notes to the financial statements, and, where understanding of the financial
situation of the institution is still lacking, open communications with the financial professionals
of the institution. Figure 2 summarizes the requirements of effective financial communications as
developed in GASB Concepts Statement No. 1.

BUDGET AND FINANCIAL AUDIT ANALYSIS FOR HIGHER EDUCATION ASSOCIATION LEADERS
12
Figure 2: Characteristics of Effective Financial Communications
The term ‘understandability’ describes the extent to which financial communications are
expressed in terms that users of financial data can understand. As stated by the National
Association of College and University Business Officers (NACUBO), “…financial information
must be consistently compiled and reported in a manner that corresponds to users’ needs” (2006,
p. 2). This reflects the thrust of the GASB concept statements, statements and interpretations that
envision users as appointed and elected government officials, those who utilize the services of
public institutions, and citizens in general. This first component of effective financial
communications is the bedrock upon which the others are founded due to the fact that
governments are given the power to compel taxes from its citizens in exchange for services of
Understandability
Reliability
Relevance
TimelinessConsistency
Comparability

BUDGET AND FINANCIAL AUDIT ANALYSIS FOR HIGHER EDUCATION ASSOCIATION LEADERS
13
value. Most governmental services are not exchange transactions, as when a user fee is charged
when a citizen utilizes a service, but a timing transaction where the taxes levied in one fiscal year
bear some relationship to the services that are generally available to all citizens during the same
time period. As such, citizens have the right and responsibility to understand how its government
agencies utilize the resources entrusted to them.
The second component of effective financial communications, reliability, measures the
extent to which the financial information presented is unbiased, accurate, and comprehensive.
Actual data should be separated from estimated numbers; where the latter are given; assumptions
must be revealed and defended.
Effective financial communications must also be relevant. In this context, the information
that is presented to a user must bear a logical relationship to the purpose for which it is needed.
The test put forward by the GASB in this Statement is utility for the user: “ Information is
relevant if it is capable of making a difference in a user’s assessment of a problem, condition, or
event” (pp. 23-24).
The last three standards of effective financial communications are closely related.
Timeliness can be judged by the gap in time between the publication of financial data and the
time required to utilize it in order to make decisions. Thus, governments compel public agencies
to release financial statements within a set number of weeks after a fiscal year is completed in
order to provide data that can be used to detect patterns, anomalies and trends in order to predict
and verify evaluations of organizational performance. This use of financial data presumes that
the financial information released over time by an organization is consistent, that is, that the

BUDGET AND FINANCIAL AUDIT ANALYSIS FOR HIGHER EDUCATION ASSOCIATION LEADERS
14
accounting principles, valuation methods, basis of accounting, and other things, remain the same
over time. This component of effective financial communications has a potential conflict from
the actions and advocacy of the GASB itself, as the Board continuously tries to meet the
challenges of setting accounting and financial reporting standards for local and state
governments and public not-for-profit institutions that operate in a continuously changing
environment. To the extent that the GASB has been successful, the financial information
released by local and state governments and public not-for-profit institutions must be
comparable, so that true differences in organizational resources and actions can be detected over
the ‘noise’ of accounting and financial reporting changes.
General purpose external financial reporting for state and local governments and not-for-
profit institutions includes comprehensive annual financial reports and those that are general in
nature. Such reporting concerns both governmental and business types of actions. Governmental-
type activities are those that are based upon a ‘ timing’ relationship rather than an ‘exchange’
relationship as noted above. Thus, these types of services are those that the citizens delegate to
their elected and appointed leaders in order to carry out those functions which have historically
been carried out by the government such as defense, infrastructure development and
maintenance, education, and social services for the poor, injured and aged. In this respect there is
no single measure of performance that is comparable to those available in the private sector such
as return on investment (ROI) or return on equity (ROE). Rather, a combination of quantitative
and qualitative measures comprises the tools required for a proper program evaluation (see, for
example, Chen, 2005; Weiss, 1998; and Wholey, Hatry and Newcomer, 2004). Such evaluations

BUDGET AND FINANCIAL AUDIT ANALYSIS FOR HIGHER EDUCATION ASSOCIATION LEADERS
15
are necessary due to the constraints imposed upon governments by their citizens such as those
related to the budget, fund accounting controls, and compliance-related laws.
On the other hand, business-type activities are characterized by an exchange relationship
between the government or not-for-profit institution and the consumer wherein fees are charged
for services rendered. Examples of such activities are the provision of water and sewage services,
state park fees, turnpike tolls, and bus fares. Here, the measurement focus of financial reports
closely resembles that of private institutions, with data aligned between inputs and outputs.
Given the context of service delivery, however, the match is not perfect: the use of capital assets
for revenue production, subsidies and revenue-sharing arrangements complicate first
impressions. However, in governmental-type and business-type activities the objectives of
financial reporting are the same under GASB Concepts Statement No. 1: financial reporting
should enable users to assess: (1) the extent to which a government or not-for-profit institution
has been accountable for the resources it has received; (2) the operating results of the institution
during and across years; and (3) the level of services that have been provided by the institution
and its ability to meet its obligations as they become due (pp. 27-28).
Higher Education Institutions
From the perspective of accountants and auditors, public higher education institutions are
viewed as a special purpose governmental entity (American Institute of Certified Public
Accountants, Inc., 2010, §§12.73 – 12.102). Among the statements released by GASB, Statement
No. 35, Basic Financial Statements- and Management’s Discussion and Analysis—for Public
Colleges and Universities—an Amendment of GASB Statement No. 34 is perhaps the most

BUDGET AND FINANCIAL AUDIT ANALYSIS FOR HIGHER EDUCATION ASSOCIATION LEADERS
16
preeminent for guidance in reviewing college and university financial statements in the context
of comprehensive annual financial report development and financial statement analysis. In
general, it applies GASB Statement No. 34, Basic Financial Statements and Management’s
Discussion and Analysis for State and Local Governments, to higher education institutions.
GASB Statement No. 35 was developed to address the unique needs of higher education
institutions because the financial accounts held by an institution must be compatible with its
organizational structure (National Association of College and Business Officers, 2006). While
the utility of the exchange transaction in general is an issue that is beyond the parameters of this
text, it must be seen that these institutions are unique among those impacted by AICPA and the
GASB. This Handbook is dedicated to meeting the needs of those who seek to analyze the
financial audits of these distinctive institutions. This effort is reflected in ten additional chapters,
an appendix, a glossary, and a bibliography.
Handbook Overview
Chapter 2 of this Handbook describes the accounting principles governing college and
university financial affairs. The two sets of accounting principles currently in use (one set for
public institutions and the other set for private institutions) are described and compared. Of
particular note is the fact that faculty and staff frequently confuse the current fund (or general
fund or similarly titled fund) with the entire university budget, which consists of many funds.
This chapter also covers the re-categorization of fund balances and governmental fund types that
were promulgated in GASB Statement No. 54, Fund Balance Reporting and Governmental Fund
Type Definitions.

BUDGET AND FINANCIAL AUDIT ANALYSIS FOR HIGHER EDUCATION ASSOCIATION LEADERS
17
Chapter 3 provides information relative to the major funds that are reported in financial
statements by primary governments and explains the difference between the basis of accounting
and measurement focus for governmental, proprietary, and fiduciary funds. It classifies the
financial statements required under GASB Statements Nos. 34 and 35 and FASB Statement No.
117 (now ASC Topic 958), and explains each financial statement for a fictitious institution, ABC
University.
Chapter 4 introduces the fundamental characteristics of derivative instruments. It
provides background information on the requirements of GASB Statement No. 53 relative to
financial reporting for derivative instruments in colleges and universities, and provides several
examples of the use of these instruments.
Chapter 5 provides an introduction to comparative and ratio analysis, providing a
typology of such analyses. Here it is important to recall that comparisons between colleges and
universities are most helpful when they have similar resources and missions. To the degree that
variability exists, such comparisons offer decreasing utility for research and analysis. In some
states, commonwealths and territories, postsecondary institutions vary little except by geography
in order to emphasize access to higher education; in others, each contributes something unique to
the system of higher education available to its citizens.
Chapter 6 describes the major components of an institution’s income such as federal,
state, and local appropriations (including formula funding), tuition, grants and contracts, gifts,
and sales and services of auxiliary enterprises (including institution-owned hospitals). Also

BUDGET AND FINANCIAL AUDIT ANALYSIS FOR HIGHER EDUCATION ASSOCIATION LEADERS
18
described are factors to consider in projecting future income, such as demographics in relation to
enrollments.
Chapter 7 examines the major components of an institution’s expenditures, including
instruction, research, public service, academic support, student services, institutional support,
operation and maintenance of physical plant, scholarships, depreciation, auxiliary enterprises,
and hospitals. How to find these expenditure categories in the budget and budget controls are
also briefly discussed.
Chapter 8 describes the constraints and explores the flexibility associated with typical
college and university budgets. Personnel and non-personnel costs are examined as well as
gifts/endowments, grants and contracts, research institutes and foundations, and reserve
accumulation. This chapter also describes how constraints and flexibility affect strategies used to
reallocate funds as well as to deal with fiscal crises.
Chapter 9 describes privatization of some of the operations of higher education
institutions. Arguments are provided against privatization as are factors that are often ignored in
making the decision to privatize.
Chapter 10 provides sources for financial information about a given institution. Since
the quality of any budgetary analysis is dependent upon the available data, becoming informed
about sources of appropriate data is important. These sources include annual audits and where to
find them, appropriation bills, reports to state and government agencies (including the IRS) made

BUDGET AND FINANCIAL AUDIT ANALYSIS FOR HIGHER EDUCATION ASSOCIATION LEADERS
19
by an institution, reports from the U.S. Department of Education, information provided by the
NEA and other salary surveys.
At the conclusion of the text, appendices of recent GASB (up to Statement No. 55) and
important FASB pronouncements are offered, as is a bibliography and glossary. Those
pronouncements that are covered in the text are not repeated in the glossaries. Words that are
displayed in boldface type are defined either in the text or in the glossary.
If you haven’ t done so already, we would recommend that you work as an Association to
obtain a voting seat on your higher education institution’s budget and/or finance committee. If
that is not possible at this time, we recommend that you annually obtain a copy of the
institution’s budget, audited financial statements, comprehensive annual financial report (CAFR)
and financial audit before they are presented before the highest decision-making governing body
of the institution. If the Association is situated in a state that allows for collective bargaining, we
recommend that you secure the right to participate in the financial decision-making of the
institution and the right to obtain this information in your contract. Other recommendations that
are tied to the subjects covered in this Handbook are embedded below.

BUDGET AND FINANCIAL AUDIT ANALYSIS FOR HIGHER EDUCATION ASSOCIATION LEADERS
20
CHAPTER 2 PRINCIPLES OF ACCOUNTING
Objectives
After completing this chapter, readers will be able to:
� Identify the major funds that are reported in financial statements by primary governments.
� Understand the basis of accounting and measurement focus for governmental, proprietary, and fiduciary funds.
� Identify the fundamental accounting equation utilized in the context of higher education finance.
� Be able to apply the re-categorization of fund balances and governmental fund types that were promulgated in GASB Statement No. 54, Fund Balance Reporting and Governmental Fund Type Definitions.

BUDGET AND FINANCIAL AUDIT ANALYSIS FOR HIGHER EDUCATION ASSOCIATION LEADERS
21
Principles of Accounting
As you will recall from Chapter 1, budgets and the governmental fund structure are
utilized as control mechanisms by governments to ensure that the resources that are provided
through taxation are used as intended (GASB Concepts Statement 1, Objectives of Financial
Reporting, p. 10). While in Chapter 1 we focused on how the budget, financial statements and
audits are developed and reported, in chapter 2 we address fund accounting. This includes the
accounting principles that govern the financial affairs of a college or university and the
accounting terms used in conjunction with those principles, including those describing the kinds
of funds found in college and university budgets and financial statements. The accounting
system used herein is primarily GASB, although several FASB pronouncements impact the
accounting and financial reporting operations of public colleges and universities. The
presentations of such financial statements are modified from time to time by new regulations
promulgated either by GASB or FASB. Efforts had been made to keep the accounting rules the
same for both organizations, but recently they have begun to diverge significantly. The principles
and terms are then illustrated through a fictitious institution, ABC University.
The importance of understanding accounting principles and terms is demonstrated by
clearing up the most common budgetary misunderstanding among faculty: the assumption that
the current fund (or general fund or the like) represents the entire budget of the institution. Thus,
when the current fund shows a deficit for a given year, faculty may assume that the institution is
in difficult financial straits. That could indeed be the case, but it could also be the case that the

BUDGET AND FINANCIAL AUDIT ANALYSIS FOR HIGHER EDUCATION ASSOCIATION LEADERS
22
institution is in excellent shape financially and that the deficit is the result of transfers of monies
to other funds.
The following analogy makes this point clearer. Suppose that a friend has a checking
account overdrawn by $2,000. In the absence of any other financial information, we might
conclude that our friend is in serious financial difficulties. Suppose, however, that our friend has
accounts in five other banks with an aggregate balance of $52,000. The $2,000 needed in the
overdrawn account can be paid out from one of the other accounts, leaving our friend with a tidy
$50,000 in the banks, rather than with serious financial difficulties.
Each of our friend’s bank accounts is analogous to a different fund in an institution’s
budget. Thus we must examine the condition of all of the separate funds if we are to understand
the true financial status of an institution.
Fund Accounting
In the interest of clarity, we introduce a series of definitions. A fund is a fiscal and
accounting entity with a self-balancing set of accounts that record financial resources and
liabilities which are segregated for the purpose of a specific set of activities or objectives that
follow certain regulations, restrictions or limitations. This means that a fund reports its own
assets, liabilities, and the fund balance, which equals assets minus liabilities. Fund accounting is
the process by which financial resources are classified in accordance with their intended purpose
and in compliance with their legal and contractual requirements (Copley, 2011; National
Association of College and University Officers, 2006; National Council on Governmental

BUDGET AND FINANCIAL AUDIT ANALYSIS FOR HIGHER EDUCATION ASSOCIATION LEADERS
23
Accounting, 1982; Wang, 2006). To understand fund accounting, an analyst must identify the
institution’s basis of accounting and its measurement focus (see definition below). The term
‘basis of accounting’ refers to the period of time when revenues, expenditures, expenses, and
transfers are recognized in financial accounts and reported in the financial statements.
The accrual basis of accounting is used in higher education. Here revenues are
recognized (booked) when they are earned, and expenses are recognized when the goods and
services have been used by an institution. This provides a much more accurate measure of an
institution’s financial status than cash basis accounting, which recognizes income only when
cash is received and similarly recognizes an expense only when cash is paid out by the
institution. Governmental funds utilize the modified accrual basis of accounting, while
proprietary and fiduciary funds use the accrual basis of accounting. In the modified accrual
basis of accounting, revenues are recognized when they become available and measurable, and
expenditures are recognized when a liability is incurred except for principal and interest on long-
term debt, which are recorded when due.
The term ‘measurement focus’ refers to the nature of the resources, the claims against
those resources, and the flows of resources that are measured and reported by a fund in a
financial report. According to GASB Statement No. 34, Basic Financial Statements and
Management’s Discussion and Analysis for State and Local Governments, governments should
report governmental, proprietary, and fiduciary funds to the extent that they utilize such funds
(p. 25). As noted in the first chapter, public higher education institutions are viewed as a special
purpose governmental entity (American Institute of Certified Public Accountants, Inc., 2010,

BUDGET AND FINANCIAL AUDIT ANALYSIS FOR HIGHER EDUCATION ASSOCIATION LEADERS
24
§§12.73 – 12.102). In this context, they can report as entities that are (1) engaged in only
governmental-type activities, (2) engaged in only business-type activities, or (3) engaged in both.
While most public higher education institutions report as being engaged in only business-type
activities, those community colleges who are endowed with the ability to tax by a state
legislature may report as being engaged in both activities (American Institute of Certified Public
Accountants, Inc., 2010, §§12.04 – 12.07; Copley, 2011, p. 274). Once an auditor determines
which types of activities a primary government engages in, they are tasked with the
responsibility of determining whether or not a special-purpose government has presented the
appropriate basic financial and required supplementary statements (American Institute of
Certified Public Accountants, Inc., 2010, §§12.04 – 12.09).
Governmental funds have a budgetary orientation, and include the general fund, special
revenue fund, capital projects fund, debt service fund, and the permanent fund. The general fund
is the primary fund used to account for all assets and liabilities of a local or state government or
not-for-profit institution. The special revenue fund is used to account for specific revenue
sources that are designated for specific expenditures other than debt service or capital projects.
The capital projects fund accounts for financial resources that are classified for capital
expenditures. For the GASB, capital assets include land, improvements to land, easements,
buildings, building improvements, vehicles, machinery, equipment, works of art and historical
treasures, infrastructure, and all other tangible or intangible assets that are used in operations and
that have initial useful lives extending beyond a single reporting period. The debt service fund
is reserved for financial resources that are designated to be expended for principal and interest on

BUDGET AND FINANCIAL AUDIT ANALYSIS FOR HIGHER EDUCATION ASSOCIATION LEADERS
25
debt instruments, other than interest or principal on proprietary or fiduciary activities. The
permanent fund accounts for resources that are restricted to the earnings (not the principal) of
assets. Permanent fund proceeds must only be used for purposes that support the reporting
government’s programs (GASB Statement No. 34, paragraphs 63 – 65; Copley, 2011, p. 14).
Proprietary funds are those that are used for a government’s current operations that most
closely resemble exchange relationships. Proprietary funds include enterprise and internal
service funds. Enterpr ise funds account for resources that are provided primarily through the
use of sales and service charges. Enterprise fund reporting requirements are outlined in GASB
Statement No. 34, Basic Financial Statements and Management’s Discussion and Analysis for
State and Local Governments, at paragraph 67, and GASB Statement No. 37, Basic Financial
Statements and Management’s Discussion and Analysis for State and Local Governments:
Omnibus, at paragraph 14. Internal service funds are used to account for any activity that
provides goods or services to other funds, departments, or agencies of the primary government
and its component units, or to other governments, on a cost-reimbursement basis (GASB
Statement No. 34, paragraphs 63 – 68; Copley, 2011, p. 14). See ‘GASB 39’ and ‘GASB 61’ in
Appendix A for more information on component units.
Fiduciary funds concern net assets and changes in net assets. These funds should only be
used to report assets held in a trustee or agency capacity for others, and not for the primary
government’s own purposes. As such, four types of fiduciary funds are recognized: agency
funds, pension (and other employee benefit) trust funds, investment trust funds, and private-
purpose trust funds. Agency funds are used to report resources held by the reporting government
BUDGET AND FINANCIAL AUDIT ANALYSIS FOR HIGHER EDUCATION ASSOCIATION LEADERS
26
in a purely custodial capacity; they typically involve only the receipt, temporary investment, and
remittance of fiduciary resources to individuals, private organizations, or other governments.
Pension (and other employee benefit) trust funds account for resources that are required to be
held in trust for the members and beneficiaries of defined benefit plans, defined contribution
plans, other employment benefit plans, or other employee benefit plans. Investment trust funds
are used to account for the external portion of investment pools reported by the sponsoring
government. A pr ivate-purpose trust fund is used to report all other trust arrangements under
which principal and income benefit individuals, private organizations, or other governments
(GASB Statement No. 34, paragraphs 63 – 73; Copley, 2011, p. 15).
The term ‘ interfund transfers’ refers to the transfer of funds between accounts; such
transfers occur quite frequently. Suppose, for example, that a physics department has a standing
order with a supplier of liquid helium. A researcher in the department orders liquid helium for
research sponsored by a government grant. The physics department pays the helium supplier out
of departmental funds that are part of the institution’s unrestricted current fund. The grant
(which is treated as a separate fund) then transfers the amount of the purchase to the physics
department’s current fund account. The current fund is now in balance, since the monies that it
expended for the liquid helium have been repaid to it, and the grant fund is also in balance, since
the order of liquid helium has been charged to it, reducing its fund balance. Fund balances are a
special case of the fundamental accounting equation within fund accounting.

BUDGET AND FINANCIAL AUDIT ANALYSIS FOR HIGHER EDUCATION ASSOCIATION LEADERS
27
The Fundamental Accounting Equation
In the fundamental accounting equation, the difference between assets and liabilities
indicates net assets or, as it is called in fund accounting, fund balance. Assets are economic
values owned or under the control of an institution whose cost at the time of acquisition can be
objectively measured. Assets generally are divided into two categories. The first category
consists of cash and those financial assets which can readily be converted into cash such as
investments and accounts receivable. The second category represents costs incurred at an earlier
date that have not yet been attributed to a given fiscal period, such as buildings, depreciable
equipment, prepaid expenses, and deferred charges. Buildings and other long-term assets of
higher education institutions which follow FASB accounting regulations have been subject to
depreciation due to the 1987 adoption of FASB Statement No. 93, Recognition of Depreciation
by Not-for-Profit Organizations.2 For institutions following GASB regulations, many
institutions did not recognize depreciation of capital assets until the 1999 adoption of GASB
Statement No. 35, Basic Financial Statements and Management’s Discussion and Analysis for
Public Colleges and Universities—an Amendment of GASB Statement No. 34.
Liabilities are also divided into two categories. The first category represents amounts
that are owed to organizations or individuals outside the institution itself. Some of these
liabilities must be paid immediately while others can be paid out over a period of many years.
The second category of liabilities represents amounts that have been collected in cash by the
2 Paragraph 7 of FASB 93 was amended by FASB 99, Deferral of the Effective Date of Recognition of Depreciation by Not-for-Profit Organizations—an Amendment of FASB Statement No. 93, paragraph 2 (1999), while footnote 1 of FASB 99 was amended by FASB 135, Rescission of FASB Statement No. 75 and Technical Corrections, paragraph 5(a) (1999).

BUDGET AND FINANCIAL AUDIT ANALYSIS FOR HIGHER EDUCATION ASSOCIATION LEADERS
28
institution (or whose collection is anticipated) but that have not yet been earned by the
institution. Until this cash has been earned by the institution, it is carried as a liability to offset
the fact that the cash itself is carried on the books as an asset. An example of this is tuition
received by an institution in the spring semester for the following fall semester.
To reiterate, the fundamental accounting equation states that the institution’s total assets
minus its total liabilities equals its net assets. In fund accounting, a fund’s assets minus its
liabilities equal its fund balance. Again, please note that in fund accounting, the term ‘ fund’ is
used for a group of accounting entities, each of which has its own self-balancing set of accounts
consisting of assets, liabilities, and net assets.
In fund accounting, real accounts are those that are used to record assets, liabilities, and
net assets. These start with the inception of the organization and continue until the end of the
organization or until the particular type of asset or liability no longer exists. Nominal accounts,
however, are those that expire at the end of a given fiscal period (usually a fiscal year) and are
created anew at the beginning of the next fiscal year. These accounts are called income and
expense accounts and are used to provide detailed information about income and expenses
throughout the year.
Financial reports usually deal exclusively with real or nominal accounts. Note that an
institution’s net assets are changed by increases or decreases in both assets and liabilities, that is,
by both income and expenses. Remember that the fundamental accounting equation means that
the accounting system must always remain in balance. Thus, any addition to an institution’s
assets by additional income must also appear as a combination of an increase in liabilities and/or

BUDGET AND FINANCIAL AUDIT ANALYSIS FOR HIGHER EDUCATION ASSOCIATION LEADERS
29
net assets. The total net assets of an institution must always equal the total of assets minus
liabilities. Similarly, the total fund balance of a fund must always equal the total of its assets
minus its liabilities.
In that context there are several other fund terms that must be understood. Prior to GASB
Statement No. 54, Fund Balance Reporting and Governmental Fund Type Definitions,3
Association leaders spent a great deal of time studying the unrestricted and restricted portions of
an institution’s net assets. Unrestricted funds are resources that the institution may use for any
purpose whatsoever. Restricted funds were resources that have external, legally binding
restrictions placed upon their use. For example, a government grant (minus any indirect cost in
the award, which can be treated as unrestricted revenue) can only be expended for the purpose
for which it was awarded. Similarly, gifts sometimes carry legally binding stipulations
restricting their usage.
Similarly, expendable funds are monies that can be spent by an institution. However,
there may be restrictions on the purposes for which the funds can be spent. Unexpendable funds
are monies that cannot be spent by the institution. For example, endowment funds cannot be
spent. They must be invested and only the income can be spent. In many cases income from
endowments funds is also restricted income since it can only be spent for specified purposes.
Student loan funds cannot be spent but must be loaned to students who will eventually repay
them so that the funds can be loaned to other students.
3 Published in February 2009, GASB Statement No. 54 became effective for financial statements for periods beginning after June 15, 2010, for those colleges or universities that report being engaged in governmental activities or both governmental and business-type activities.

BUDGET AND FINANCIAL AUDIT ANALYSIS FOR HIGHER EDUCATION ASSOCIATION LEADERS
30
A governing board sometimes places surpluses from a given fiscal year (or part or all of
unrestricted gifts) into a fund named the quasi-endowment. This is legally quite different than
the regular endowment because the governing board is free to spend an institution’s quasi-
endowment in any manner it chooses (unless, for example, part or all of it is pledged as collateral
for an institutional bank loan or bond offering). Thus, in accounting terms, an institution’s quasi-
endowment funds are unrestricted assets. The administrators of an institution may state that they
cannot use these funds. This reported inability is only true to the extent that only the governing
board can use the funds, although the board can release all the funds to the administration for use
at any time.
Separate funds are created to account for financial activities related to a particular
restricted donation, to a grant or contract, or to funds designated by the governing board for
special purposes. The separateness of each fund insures that the restrictions placed upon the
resources in each fund will be observed. However, for the purposes of efficient management and
financial reporting, funds with similar restrictions or designations are often grouped together into
what are termed fund groups. Within each fund group we must distinguish between the
unrestricted funds and the restricted funds. Accounting for each restricted fund balance
separately is mandatory.
With the advent of GASB Statement No. 54, Fund Balance Reporting and Governmental
Fund Type Definitions, fund balance reporting has changed beginning on financial statements for
periods beginning after June 15, 2010. Henceforward, five categories will be utilized by higher
education institutions which report governmental funds: nonspendable, restricted, committed,
BUDGET AND FINANCIAL AUDIT ANALYSIS FOR HIGHER EDUCATION ASSOCIATION LEADERS
31
assigned, and unassigned fund balances. Four of the five new fund balance classifications restrict
fund balance levels. While we agree with the GASB that Statement No. 54 was needed to clarify
fund balance categorization in GASB Statements Nos. 34 and 35, we expect that the
implementation of the Statement will make it more difficult for Association leaders to bargain
compensation increases in the future when they work for a college or university that reports
being engaged in governmental activities or both governmental and business-type activities (such
as community colleges which have the power to tax). It has already been the object of significant
professional scrutiny (see, for example, Chase & Montoro, 2009; Brooks & Mead, 2010; and
Chase & Roybark, 2010). To address this new challenge, Association leaders need to understand
the new fund balance classification system.
The nonspendable fund balance classification includes amounts that cannot be spent
because they are either not in spendable form or are under a legal or contractual obligation to
remain intact. This will include items that are not to be converted to cash such as inventories, the
long-term amount of loans and notes receivable, and property not acquired for resale. However,
if the use of the proceeds from the collection of those receivables or properties is restricted,
committed, or assigned, then they will be included in the appropriate fund balance classification
(i.e., restricted, committed, or assigned) rather than the nonspendable fund balance (GASB
Statement 54, paragraphs 6 and 7, p. 3).
The committed fund balance classification includes amounts that can only be used for
specific purposes pursuant to constraints imposed by formal action of the government’s highest
level of decision-making authority. Those committed amounts cannot be used for any other

BUDGET AND FINANCIAL AUDIT ANALYSIS FOR HIGHER EDUCATION ASSOCIATION LEADERS
32
purpose unless that decision-making authority removes or changes the specified use by taking
the same type of action it employed to previously commit these amounts (paragraphs 10-12, pp.
4-5).
The restr icted fund balance classification includes amounts that are restricted when
constraints are placed on the use of resources that are either externally imposed by creditors
(such as through debt covenants), grantors, contributors, or laws or regulations of other
governments; or imposed by law through constitutional provisions or enabling legislation
(paragraphs 8 and 9, p. 4).
The assigned fund balance classification includes amounts that are constrained by the
government’s intent to be used for specific purposes, but are neither restricted nor committed.
Intent should be expressed by the governing body itself or a committee or official to which the
governing body has delegated the authority to assign amounts to be used for specific purposes. In
this classification, the authority for making an assignment is not required to be the government’s
highest level of decision-making authority. Furthermore, the nature of the actions necessary to
remove or modify an assignment is not as prescriptive as it is with regard to the committed fund
balance classification. GASB 54 also allows the assigned fund balance to include the following:
all remaining amounts (except for negative balances) that are reported in governmental funds,
other than the general fund, that are not classified as nonspendable and are neither restricted nor
committed; and amounts in the general fund that are intended to be used for a specific purpose in
accordance with the governing body itself or a committee or official to which the governing

BUDGET AND FINANCIAL AUDIT ANALYSIS FOR HIGHER EDUCATION ASSOCIATION LEADERS
33
body has delegated the authority to assign amounts to be used for specific purposes (paragraphs
13-16, pp. 5-6). This is essentially what is now ‘designated.’
The unassigned fund balance classification represents the residual classification for the
general fund. It includes fund balance that has not been assigned to other funds and that has not
been restricted, committed, or assigned to specific purposes within the general fund (paragraph
17, p. 6). This is essentially what is now ‘unreserved’ and ‘undesignated.’ Figure 3 illustrates the
difference between fund balance classifications before and after GASB 54.
Figure 3: Fund Balance Classifications Before and After GASB Statement No. 54
Under GASB 54, the notes to the financial statements should detail the actions that were
taken to classify amounts under the nonspendable, committed and assigned fund balances. They
should also include the purpose for each major special revenue fund within the governmental
funds category of funds, identifying which revenues and other resources are reported in each of

BUDGET AND FINANCIAL AUDIT ANALYSIS FOR HIGHER EDUCATION ASSOCIATION LEADERS
34
those funds. If an institution uses any type of rainy day fund (e.g., a budget or revenue
stabilization fund, working capital fund, contingency, or emergency fund) the policies,
conditions or circumstances that trigger expenditures should be a recorded formal action by the
governing authority. The money in these funds are considered a specific purpose under GASB
54, and can be reported in the general fund within the restricted or committed fund balance if
they meet their respective requirements, or, if they fail to do so, should be reported in the
unassigned fund balance (pp. 6-13).
This re-classification of fund balance and governmental fund types will impact
accounting and financial reporting in higher education institutions for some time to come. A
sound understanding of these issues is important when analyzing financial statements and the
notes to the financial statements, which is the subject of Chapter 3 of this Handbook.
The requirements of GASB Statement No. 54, Fund Balance Reporting and
Governmental Fund Type Definitions, became effective for financial statements after June 15,
2010. The GASB recommends that the fund balance classifications that are promulgated in this
Statement be applied retroactively by restating fund balance for all prior periods presented
(paragraph 36). At a minimum, Association leaders should contact their institution’s chief
financial officer to ask for a restatement of the financial statements for FY 2010 to accompany
the FY 2011 information.

BUDGET AND FINANCIAL AUDIT ANALYSIS FOR HIGHER EDUCATION ASSOCIATION LEADERS
35
CHAPTER 3 FINANCIAL STATEMENTS
Objectives
After completing this chapter, readers will be able to:
� Identify the major funds that are reported in financial statements by primary governments.
� Differentiate the basis of accounting and measurement focus for governmental, proprietary and fiduciary funds.
� Identify the fundamental accounting equation utilized in the context of higher education finance.
� Classify the financial statements required under GASB Statements Nos. 34 and 35 and FASB Statement No. 117 (now ASC Topic 958).
BUDGET AND FINANCIAL AUDIT ANALYSIS FOR HIGHER EDUCATION ASSOCIATION LEADERS
36
Financial Statements
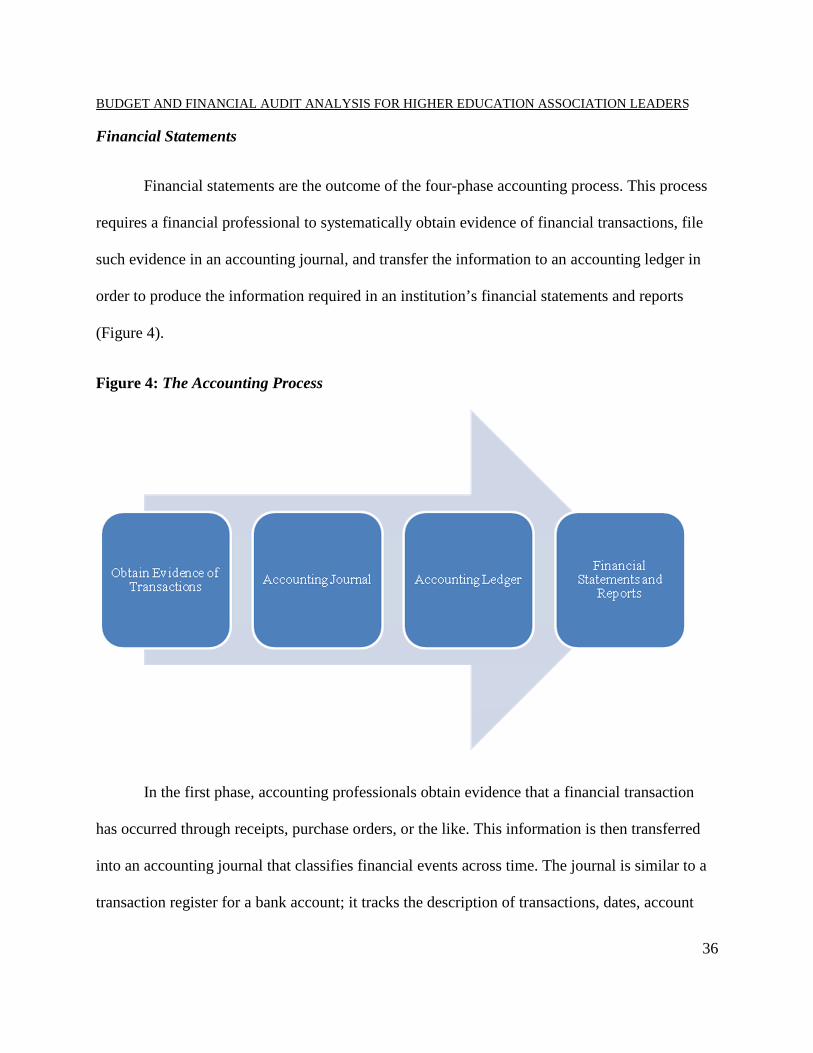
Financial statements are the outcome of the four-phase accounting process. This process
requires a financial professional to systematically obtain evidence of financial transactions, file
such evidence in an accounting journal, and transfer the information to an accounting ledger in
order to produce the information required in an institution’s financial statements and reports
(Figure 4).
Figure 4: The Accounting Process
In the first phase, accounting professionals obtain evidence that a financial transaction
has occurred through receipts, purchase orders, or the like. This information is then transferred
into an accounting journal that classifies financial events across time. The journal is similar to a
transaction register for a bank account; it tracks the description of transactions, dates, account

BUDGET AND FINANCIAL AUDIT ANALYSIS FOR HIGHER EDUCATION ASSOCIATION LEADERS
37
numbers, and amounts. This information is then transferred into an accounting ledger, which
organizes all financial information by the institution’s account numbers and establishes balances
by account. At the conclusion of a financial period, this information is translated into financial
statements in order to present to the institution and its stakeholders a true and accurate depiction
of the financial status of the institution (Wang, 2006). Thus, a financial statement is a formal
record of the financial activities of an organization that provides information about the financial
position, performance and changes in financial position of an institution for the purpose of
financial decision making and accountability. A financial audit is the verification of the
financial statements of a legal entity, with a view to express an audit opinion. The audit opinion
is a reasonable assurance that the financial statements are presented fairly, in all material
respects, or give a true and fair view in accordance with the financial reporting framework.
PUBLIC COLLEGES AND UNIVERSITIES
Public and private higher education institutions produce their financial statements in two
formats. In accordance with FASB Statement No. 17, Financial Statements of Not-for-Profit
Organizations, and certain other FASB Statements, AICPA guides and NACUBO advisory
reports indicate that the basic financial statements of private higher education institutions include
a statement of financial position (balance sheet), a statement of activities, a statement of cash
flows, and the notes to the financial statements. For public institutions, GASB Statement No. 34,
Basic Financial Statements and Management’s Discussion and Analysis for State and Local
Governments and GASB Statement No. 35, Basic Financial Statements and Management’s
Discussion and Analysis for Public Colleges and Universities—an Amendment of GASB

BUDGET AND FINANCIAL AUDIT ANALYSIS FOR HIGHER EDUCATION ASSOCIATION LEADERS
38
Statement No. 34 state that the presentation of financial statements depends upon the activities of
the institution. Those public higher education institutions which report as being engaged only in
business-type activities should present their activities using three enterprise fund financial
statements: a statement of fund net assets of fund equity, a statement of revenues, expenses and
changes in fund net assets or fund equity, and a statement of cash flows. Those public higher
education institutions which report being engaged in governmental activities or both
governmental and business-type activities (such as community colleges which have the power to
tax) should present their activities using both the government-wide financial statements (i.e., a
statement of net assets and a statement of activities) and the applicable fund financial statements
required by GASB Statement No. 34 (American Institute of Certified Public Accountants, Inc.,
2010, §12.76) and GASB Statement No. 35.
In the wake of GASB Statements Nos. 34 and 35, general purpose external financial
statements must include management’s discussion and analysis (MD&A), basic financial
statements, notes to the financial statements, and required supplementary information other than
MD&A. Management’s Discussion and Analysis is an analytic section which precedes an
institution’s financial statement presentation. It should provide an analytical overview of the
institution’s financial activities based upon currently known facts, decisions, or conditions, and
an assessment of the financial position of the institution (GASB Statement No. 34, Basic
Financial Statements and Management’s Discussion and Analysis for State and Local
Governments, paragraphs 8-11, pages 6-8; GASB Statement No. 35, Basic Financial Statements
and Management’s Discussion and Analysis for Public Colleges and Universities—an

BUDGET AND FINANCIAL AUDIT ANALYSIS FOR HIGHER EDUCATION ASSOCIATION LEADERS
39
Amendment of GASB Statement No. 34, paragraph 5, page 2); GASB Statement No. 37, Basic
Financial Statements and Management’s Discussion and Analysis for State and Local
Governments: Omnibus).
The notes to the financial statements should communicate information that is essential for
fair presentation of the financial statements that is not included in those statements. This includes
general disclosures, disclosures about capital assets, disclosures about donor-restricted
endowments, and segment information (GASB Statement No. 34, Basic Financial Statements-
and Management’s Discussion and Analysis- for State and Local Governments, paragraphs 6,
113-123, pages 5 and 39-43; GASB Statement No. 35, Basic Financial Statements and
Management’s Discussion and Analysis for Public Colleges and Universities—an Amendment of
GASB Statement No. 34, paragraph 5, page 2; GASB Statement No. 37, Basic Financial
Statements and Management’s Discussion and Analysis—for State and Local Governments:
Omnibus; GASB Statement No. 38, Certain Financial Statement Note Disclosures, and
American Institute of Certified Public Accountants, Inc., 2011, §2.43 – 2.46) . In all cases, these
financial statements are created by auditors in consultation with the financial professionals of the
higher education institution; this process is illustrated in Figure 5.

BUDGET AND FINANCIAL AUDIT ANALYSIS FOR HIGHER EDUCATION ASSOCIATION LEADERS
40
Figure 5: The Financial Auditing Process
To illustrate how the financial statements are presented in a general purpose external
financial report, we present an analysis of a fictitious public university’s financial statements.
ABC University (our fictitious institution) offers a number of bachelor, master and doctoral
programs. It receives federal research grants and also has a number of auxiliary enterprises such
as student housing, a staff dining facility, parking lots, and an institutional press. It does not
have a hospital, medical school, or physicians’ practice plan. For simplicity, we also assume that
ABC University does not have a life income fund (in which the donor specifies that the annual
income from a gift is to be paid to an outside party for as long as that party shall live). The
institution is engaged only in business-type activities, and receives no local tax revenue. Thus,
our analysis of ABC University’s financial statements will be limited to a statement of net assets,

BUDGET AND FINANCIAL AUDIT ANALYSIS FOR HIGHER EDUCATION ASSOCIATION LEADERS
41
a statement of revenues, expenses and changes in net assets, and a statement of cash flows. ABC
University also does not provide any post-employment benefits other than pensions. Hence, its
financial statements do not reflect as a liability the estimated cost of these benefits. More
information about other post-employment benefits is covered under GASB 45 in the Appendix.
Statement of Net Assets
As a government-wide financial statement, the statement of net assets is prepared in the
modified accrual basis of accounting, where revenues are recognized revenues in the period in
which they become available and measurable, and prepared using the current economic resources
measurement focus, where assets and liabilities reported on the financial statements are limited
to those representing current available resources or requiring expenditure of said resources.
The statement of net assets of ABC University for FY 2009 is presented in Table 1. It
reports all of an institution’s financial and capital resources at a single point in time. It is the only
financial statement that reports general capital assets and general long-term liabilities (American
Institute of Certified Public Accountants, Inc., 2010, § 2.16, page 17). Users read an institution’s
statement of net assets to identify its relative liquidity, its ability to meet institutional obligations,
and its need for external financing (National Association of College and Business Officers, 2006,
p. 87). Its format focuses on institutional assets, liabilities, and net assets, or the difference
between its assets and liabilities at a single moment in time. Within the ‘assets’ category, the
institution reports on current and non-current assets. Within the ‘ liabilities’ category, the
institution presents information on current and non-current liabilities. Net assets are reported as
‘ invested in capital assets, net of related debt, restricted, and unrestricted.’

BUDGET AND FINANCIAL AUDIT ANALYSIS FOR HIGHER EDUCATION ASSOCIATION LEADERS
42
Table 1: ABC University Statement of Net Assets, FY 2009
ASSETS
Cash and cash equivalents $ 2,120,000 Short-term investments 3,430,000 Accounts receivable, net 650,000 Inventories 800,000 Deposits with trustees 1,000,000 Other assets 400,000
Total current assets 8,400,000
Restricted cash and cash equivalents $ 3,700,000 Endowment investments 12,000,000 Loans receivable, net 6,000,000 Other long-term investments - Capital assets, net 96,800,000
Total non-current assets 118,500,000 Total assets $ 126,900,000
LIABILITIES
Accounts payable and aaccrued liabilities $ 1,080,000 Deferred revenue 350,000 Deposits - Current portion of debt oblgations 600,000
Total current liabilities 2,030,000
Long-term debt and other obligations $ 11,200,000 Total non-current liabililties 11,200,000
Total liabilities $ 13,230,000
Total assets less liabilities $ 113,670,000
NET ASSETSInvested in Capital Assets, Net of Related Debt $ 91,200,000 Restricted for:Nonexpendable
Scholarships and fellowships $ 7,250,000 Research 1,500,000
ExpendableScholarships and fellowships 1,000,000 Research 850,000 Instructional departmental use 1,670,000 Loans 1,450,000 Capital projects 1,330,000 Debt service 720,000
Total restricted 15,770,000 Unrestricted 6,700,000 Total net assets $ 113,670,000
Current Assets
Non-Current Assets
Current Liabilities
Non-Current Liabilities

BUDGET AND FINANCIAL AUDIT ANALYSIS FOR HIGHER EDUCATION ASSOCIATION LEADERS
43
An asset is a resource with present service capacity that the government presently
controls. An asset may be tangible, such as a building or a piece of equipment, or intangible such
as the right to use intellectual property. It remains an asset so long as it is still capable of
providing services. Assets are frequently listed at their historical cost minus depreciation. If an
institution chooses to carry investments at market value, their values will change from reporting
date to reporting date. All of the investments must be reported in the same manner, at historical
cost or market value. A current asset is one which is easily convertible to cash in the present
fiscal period. This could include cash, money market funds, or short-term certificates of deposit.
A non-current asset is one which is not easily convertible to cash or not expected to become
cash within the next year. This could include fixed assets, leasehold improvements, and
intangible assets. Usually the assets of groups of funds are pooled. This means that normally no
attempt is made to keep separate cash balances for each restricted fund. Rather, each fund is
assigned a number of shares in the portfolio of the entire fund group.
Liabilities represent present obligations to utilize resources that the institution has little
or no discretion to avoid. The use of the terms ‘current’ and ‘noncurrent’ follow the same logic
as presented above for assets. GASB Statement No. 34, Basic Financial Statements and
Management’s Discussion and Analysis for State and Local Governments, encourages
institutions to report both present assets and liabilities in order of their relative liquidity.
Accordingly, Table 1 reports ABC University’s assets in descending order of liquidity within
current assets from cash and cash equivalents to deposits with trustees, and within non-current
assets from restricted cash and cash equivalents to net capital assets. Similarly, institutional

BUDGET AND FINANCIAL AUDIT ANALYSIS FOR HIGHER EDUCATION ASSOCIATION LEADERS
44
liabilities are categorized as current and non-current. The difference between assets and
liabilities are reported as net assets, and are displayed in three components according to the
recommendations of GASB 34 and 35: invested in capital assets, net of related debt; restricted;
and unrestricted. Each of the items reported in these three general categories are explained
below.
While accounting and financial reporting rules and regulations allow institutions to
present their net assets as assets less liabilities or the traditional balance-sheet format, the
Statement must display net assets in three components: (1) invested in capital assets, net of
related debt, (2) restricted (distinguishing between major categories of restrictions, and (3)
unrestricted (American Institute of Certified Public Accountants, Inc., 2010, §2.17, page 18).
The investment in capital assets reflects the assets and liabilities concerned with the
institution’s long term assets such as land, buildings, equipment, library books, and museum
collections. Most of these assets are depreciated but not appraised to determine their current
values. Thus the actual value of these assets today may be greater than the value for them
reflected in these funds. The fund balance of investment in capital assets is referred to as
‘ invested in capital assets, net of related debt.’ Increases in net investments occur due to
expenditures for capital assets as well as the paying down of related debt. Investment in capital
assets, net of related debt, is not broken down into restricted or unrestricted because the
assumption is that the resource in this category will remain there in perpetuity, that is, classroom
buildings will not be sold to fund other purposes. A deduction in a fund due to a transfer has the

BUDGET AND FINANCIAL AUDIT ANALYSIS FOR HIGHER EDUCATION ASSOCIATION LEADERS
45
same effect as expenditure within the fund; both reduce the net increase in that category for the
year.
Restricted net assets indicate that a constraint has been placed on the funds; this occurs
when creditors, grantors, contributors, or governmental regulation places an external constraint
on the funds or such a constraint is imposed by law through constitutional provisions or enabling
legislation. Restricted net assets are reported in two categories, expendable and nonexpendable;
the latter refers to those that are required to be retained in perpetuity (GASB Statement No. 34,
Basic Financial Statements and Management’s Discussion and Analysis for State and Local
Governments, paragraphs 34-37, page 16).
Statement of Revenues, Expenses, and Changes in Net Assets
As a proprietary fund financial statement, the statement of revenues, expenses and
changes in net assets is prepared in the accrual basis of accounting, wherein revenues and
expenses are recognized when earned or incurred, and prepared using the economic resources
measurement focus, which reports all inflows, outflows, and balances affecting or reflecting an
entity's net assets. The purpose of the Statement is to provide information to stakeholders
regarding the operating performance of the institution and the effects of non-operating
transactions and events that change the amount of net assets of the institution (National
Association of College and University Business Officers, 2006). The format of the Statement
focuses on revenues and expenses; within the former category, operating revenues are detailed,
while in the latter category, operating expenses are separated from non-operating revenues
(expenses). The Statement is presented in Table 2.

BUDGET AND FINANCIAL AUDIT ANALYSIS FOR HIGHER EDUCATION ASSOCIATION LEADERS
46
Table 2: ABC University Statement of Revenues, Expenses and Changes in Net Assets, FY 2009
REVENUES
Tuition and fees (Net of scholarship allowance of $850,000)$ 15,670,000 Federal grants and contracts 2,800,000 State and local grants and contracts 2,190,000 Non-governmental grants and contracts - Sales and services of educational departments 800,000 Auxiliary enterprises (Net of allowance of $250,000) 8,600,000 Other operating revenues 50,000 Total operating revenues $ 30,110,000
EXPENSES
Instruction $ 21,340,000 Research 6,120,000 Public service 4,250,000 Academic support 3,960,000 Student services 2,800,000 Institutional support 5,100,000 Operation and maintenance of plant 5,220,000 Depreciation 2,000,000 Student aid - Auxiliary operations 8,600,000 Other Expenses 140,000
Total operating expenses 59,530,000 Operating income/loss (29,420,000)
Non-operating Revenues (Expenses)State appropriations $ 31,000,000 Gifts 2,180,000 Investment income (Net of investment expense) 1,975,000 Interest on capital asset-related debt (220,000) Other non-operating revenues -
Net non-operating revenues 34,935,000
Capital appropriations $ - Capital gifts and grants 835,000 Additions to permanent endowment 1,800,000
Total other revenues 2,635,000 Net increase in assets $ 8,150,000 Net assetsNet assets beginning of year 111,520,000 Restatement of net assets (6,000,000) Net assets at end of year $ 113,670,000
Operating Revenues
Operating Expenses

BUDGET AND FINANCIAL AUDIT ANALYSIS FOR HIGHER EDUCATION ASSOCIATION LEADERS
47
In the statement of revenues, expenses and changes in net assets, activities are classified
as either operating or non-operating. There will normally be an operating deficit since any state
appropriation and gifts are classified as non-operating revenues. However, total revenues have
not been reduced by their separation into two categories of revenues.
Depreciation is included in this statement as an operating expense. Revenues must be
reported net of discounts and allowances. As a result, certain amounts previously reported as
scholarship expenditures are reported as a reduction of tuition and related revenues. In addition,
direct lending to students is not reported as federal revenue and scholarship expenditures but is
treated as an agency expense.
Table 2 can be constructed from the pre-GASB 35 ABC University Statement of
Activities with a number of restatements due to accounting changes. Here there are two major
financial classifications: revenues, which include all operating revenues; and expenses, which
include operating expenses and non-operating revenues (expenses). The term ‘operating
revenues’ means that these revenue sources represent charges levied by the institution for
services it has provided. Within this category, ‘ tuition and fees’ are reduced by University
reductions in the charges for tuition ($850,000, the amount paid from unrestricted funds). The
revenues from ‘auxiliary enterprises’ are reduced by $250,000, the amount paid for room and
board charges from unrestricted funds. This is important to note because under GASB 35,
revenues are to be reported net of discounts and allowances. Hence amounts previously reported
as scholarship expenditures will now be reported as an allowance against tuition and related

BUDGET AND FINANCIAL AUDIT ANALYSIS FOR HIGHER EDUCATION ASSOCIATION LEADERS
48
revenues such as room and board. Thus the scholarship expenditures in Table 2 are also reduced
by $1,100,000 below the amount recorded in pre-GASB 35 financial statements.
In addition, direct lending by the government is not reported as federal revenue and
scholarship expenditures but will instead be treated as an agency transaction. Hence Table 2 has
a further restatement from pre-GASB 35 reports in that federal scholarship aid is removed from
revenue from ‘ federal grants and contracts’ and from expenditures for scholarships resulting in
‘student aid’ being listed as $0 in Table 2.
A few other observations are necessary to understanding the presentation of information
in Table 2. Note that ‘operating income/loss’ has a loss of $29,420,000 because the ‘state
appropriation, gifts and investment income’ have not yet been accounted for under ‘ revenues.’
The total of $4,815,000 in ‘private gifts’ is located in three places in Table 2: $2,180,000
for ‘gifts under non-operating revenues,’ $835,000 for ‘capital gifts and grants,’ and $1,800,000
as ‘additions to permanent endowment.’ When these are factored in (as well as the expenditure
of $220,000 for interest) one arrives at an increase in net assets of $8,150,000 for the year ended
June 30, 2009. The ‘ restatement of net assets’ entry of ($6,000,000) is due to federal direct
lending discussed above.
Lastly, please note that Table 2 has not changed the ‘ tuition and fees revenues’ line to
reflect the allocation of summer term revenues and expenses between fiscal years instead of
deferring the entire session. We assume that this allocation had already taken place under the

BUDGET AND FINANCIAL AUDIT ANALYSIS FOR HIGHER EDUCATION ASSOCIATION LEADERS
49
earlier accounting systems before the adoption of GASB 35. The earlier ‘net cash provided by
investing activities’ of $1,975,000 is identical to the ‘ investment income’ in Table 2.
Statement of Cash Flows
As a proprietary fund financial statement, the statement of cash flows is prepared in the
accrual basis of accounting, wherein revenues and expenses are recognized when earned or
incurred, and prepared using the economic resources measurement focus, which reports all
inflows, outflows, and balances affecting or reflecting an entity's net assets. The purpose of the
Statement is to provide information to stakeholders regarding the cash receipts and cash
payments of an institution during a specified time period. This can help readers estimate its
ability to meet its obligations as they come due and determine its need for external financing
(National Association of College and University Business Officers, 2006).
The format of the Statement focuses on cash flows from operating activities, non-capital
financing activities, capital financing activities, and investing activities. The statement of cash
flows of ABC University for FY2009 is presented in Table 3. Table 3 uses the direct method of
presenting cash flows. Thus, the Statement starts with money received and then subtracts money
spent to calculate the net cash flow. The amounts for a given revenue or expenditure category
may vary from the corresponding number in Table 2. For example, ‘ tuition and fees’ in Table 3
generated $16,000,000 for the year ending June 30, 2009, which is slightly more than the
$15,670,000 reported in Table 2. This reflects the fact that cash payments for tuition and fees
exceeded the amount earned during 2008-09 due to a change in deferred revenues. For

BUDGET AND FINANCIAL AUDIT ANALYSIS FOR HIGHER EDUCATION ASSOCIATION LEADERS
50
simplicity, Table 3 assumes that loans to students exactly cancel repayments for the given fiscal
year. The ‘state appropriation’ level is unchanged from Table 2.
Table 3: ABC University Statement of Cash Flows, FY 2009
Tuition and fees $ 16,000,000 Research grants and contracts 4,990,000 Payments to suppliers (8,790,000) Payments to employees (42,550,000) Loans to students (500,000) Collection of loans from students 500,000 Auxiliary enterprise charges (8,600,000) Sales and services 9,400,000 Other receipts 50,000
Net cash used by operating activities $ (29,500,000)
State appropriations $ 31,000,000 Federal direct lending receipts 1,000,000 Federal direct lending disbursements (1,000,000) Gifts 2,180,000
Net cash provided by non-capital financing activities 33,180,000
Cash Flows from Capital Financing ActivitiesProceeds from capital debt $ - Capital appropriations - Capital grants and gifts received 835,000 Purchases of capital assets (1,200,000) Principal paid on capital debt (3,000,000) Interest paid on capital debt (220,000)
Net cash used by capital financing activities (3,585,000)
Cash Flows from Investing ActivitiesProceeds from sales of investments $ 1,975,000 Interest on investments 1,000,000 Purchase of investments (1,000,000)
Net cash provided by investing activities 1,975,000 Net increase in cash and cash equivalents $ 2,070,000 Cash - Beginning of year 3,750,000 Cash - End of year $ 5,820,000
Cash Flows from Operating Activities
Cash Flows from Non-Capital Financing Activities

BUDGET AND FINANCIAL AUDIT ANALYSIS FOR HIGHER EDUCATION ASSOCIATION LEADERS
51
The significance of Table 3 is that it demonstrates that ABC University can meet its
maturing debt obligations. It should be noted that many of the audited Statements of Cash Flow
also contain a section which reconciles ‘net operating expenses’ to ‘net cash from operating
activities’ . Table 3 does not contain such a section. A reconciliation of only a portion of the
Statement of Revenues, Expenses and Changes in Net Assets to a change in cash from ‘operating
activities’ alone does not seem helpful, especially in view of the fact that the state appropriation
is not included in ‘operating revenues.’
The adoption of GASB 35 accounting rules by public higher education institutions while
private institutions continue to follow FASB accounting rules will make financial comparisons
between formerly “comparable” institutions more difficult. For example, some institutions will
include internal scholarship money as part of tuition income while those following GASB 35
accounting rules will net the scholarship funds against tuition. Thus the percentage of income
from tuition would appear to be different for institutions whose only difference is the accounting
rules they utilize. In addition, even for a given institution, the fiscal year in which GASB 35
accounting rules are adopted will exhibit a discontinuity in the trend analysis of institutional
revenues and expenses over time. Only when we have accumulated several years of financial
reports audited under GASB 35 accounting rules will it be possible to establish new trend
analyses for revenues and expenditures.
Notes to ABC University Financial Statements
As stated earlier in this chapter, the notes to the financial statements should
communicate information that is essential for fair presentation of the financial statements but is

BUDGET AND FINANCIAL AUDIT ANALYSIS FOR HIGHER EDUCATION ASSOCIATION LEADERS
52
not included in those statements. The principal guidance for note disclosures can be found in
NCGA Interpretation No. 6, Notes to the Financial Statements Disclosure, as amended, as well
as various FASB and GASB pronouncements.4 Most importantly, these disclosures require a
summary of significant accounting policies; a description of the government-wide financial
statements; the measurement focus and basis of accounting used in the government-wide
statements; the policy for applying FASB pronouncements issued after November 30, 1989, to
business-type activities and to enterprise funds of the primary government; and material
violations of finance-related legal and contractual provisions and the actions taken to address
such violations (AICPA Audit & Accounting Guide for State and Local Governments, 2010, §§
2.43 – 2.46). When this information is insufficient, the analyst must write to the chief fiscal
officer of the college or university to get answers that the financial statements raise but the notes
do not answer. Below, the notes to ABC University are given for the purpose of edification.
Note 1: Summary of Significant Financial Policies
Basis of Presentation - The financial statements of ABC University have been prepared in
accordance with generally accepted accounting principles (GAAP) as prescribed by the
Governmental Accounting Standards Board (GASB), including Statement No. 34, Basic
Financial Statements and Management’s Discussion and Analysis for State and Local
Governments, and GASB Statement No. 35, Basic Financial Statements and Management’s
4 The connection between the AICPA, FASB, GASB and the National Council on Governmental Accounting is recorded in Greathouse, F.L. (1985). The history and evolution of the National Council on Governmental Accounting. Public Budgeting and Finance, 5, 23-29; and Chan, J.L. (2000). Reforming American government accounting in the 20th century. In Liou, K.T. (Ed.). Handbook of Public Management Practice and Reform. NY: Marcel Dekker, Inc..
BUDGET AND FINANCIAL AUDIT ANALYSIS FOR HIGHER EDUCATION ASSOCIATION LEADERS
53
Discussion and Analysis for Public Colleges and Universities—an Amendment of GASB
Statement No. 34. The presentation required by these pronouncements provides a comprehensive,
entity-wide perspective of the University’s assets, liabilities, net assets, revenues, expenses, and
changes in net assets and cash flows. It replaces fund groups with net asset groups and requires
the direct method of cash flow presentation. The University follows all GASB pronouncements
as well as Financial Accounting Standards Board (FASB) Statements and Interpretations issued
on or before November 30, 1989, unless those pronouncements conflict with or contradict GASB
pronouncements. ABC University has elected not to apply FASB Statements and Interpretations
issued after November 30, 1989.
Basis of Accounting – ABC University is a special-purpose government engaged only in
business-type activities as defined by GASB Statements No. 34 and No. 35. Accordingly, the
financial statements are presented using an economic resources measurement focus and are
presented on the accrual basis of accounting. Under the accrual basis, revenues are recognized
when earned and expenses are recorded when incurred. All significant interfund transactions
have been eliminated.
Net Assets – The University’s net assets are categorized as described below:
Invested in Capital Assets, Net of Related Debt – This net asset class represents ABC
University’s investment in capital assets net of debt obligations related to those capital assets,
except to the extent of debt proceeds not yet expended.

BUDGET AND FINANCIAL AUDIT ANALYSIS FOR HIGHER EDUCATION ASSOCIATION LEADERS
54
Restricted Net Assets, Nonexpendable – This net asset class represents the donor-
contributed portion of University endowments. It also includes capital appreciation of those
endowments where the donor has not adopted the University’s endowment expenditure policy,
meaning that the capital appreciation of those accounts remains a part of the corpus.
Restricted Net Assets, Expendable – Restricted expendable net assets represent assets that
are restricted by a third party, either legally or contractually.
Unrestricted Net Assets, Unrestricted– Resources derived primarily from student tuition,
fees, state appropriations, and auxiliary enterprises. These net assets are used for general
obligations of ABC University. The may be used at the discretion of the Board of Trustees for
any purpose furthering the University’s mission.
Restricted vs. Unrestricted Resources – When an expense is incurred that can be paid
using either restricted or unrestricted resources, the University’s policy is to apply the expense at
the discretion of University management.
Endowment funds are subject to restrictions of gift instruments requiring that the
principal be invested in perpetuity and only the income be utilized. While amounts have been
established by the Board of Trustees for the same purposes as endowment funds, any portion of
such quasi-endowment may be expended at the Board’s discretion for any legal purpose.
Operating activities as reported on the Statement of Revenues, Expenses and Changes in
Net Assets are those that generally result from exchange transactions such as payments received
for providing goods or services and payments made for goods or services received. All of ABC

BUDGET AND FINANCIAL AUDIT ANALYSIS FOR HIGHER EDUCATION ASSOCIATION LEADERS
55
University’s expenses are from exchange transactions. Certain significant revenue streams relied
on for operations are reported as non-operating revenues as required by GASB Statement No. 35,
including state appropriations, investment income and state capital grants.
Inventories are stated at the lower of cost or market value, cost being determined
principally on the first-in, first-out method or by retail method in the university’s bookstore.
The University’s tangible assets—land, buildings, and equipment—are stated at cost
minus accumulated depreciation. Land, buildings, and equipment owned by the state that were
constructed, purchased, or acquired for use by the university have been recorded in the
university’s records at the state’s cost minus accumulated depreciation.
Note 2: Deposits with Trustees
ABC University has on deposit with trustees the amount of $1,000,000 established for
debt reserve and debt escrow funds for its bonds, which are due in 2010. As of June 30, 2009,
the face value of the outstanding bonds was $5,200,000 at an interest rate of four percent. The
bonds are secured by a pledge of gross revenues from ABC University as well as by the
securities on deposit with trustees.
Note 3: Mortgage
The mortgage on certain university properties was repaid early during fiscal year 2008-
09. The interest rate paid on the mortgage was eight percent.

BUDGET AND FINANCIAL AUDIT ANALYSIS FOR HIGHER EDUCATION ASSOCIATION LEADERS
56
Note 4: Information about Capital Assets
This disclosure presents the beginning and ending balances and increases and decreases
for the year for each major class of capital asset and the related accumulated depreciation.
Note 5: Information about Long-Term Liabilities
This disclosure presents the beginning and ending balances and increases and decreases
for the year for each major type of long-term liability, such as bonds payable.
Note 6: Disclosure of Segment Information
A segment is an identifiable activity that has one or more revenue bonds or other
revenue-backed debt instruments outstanding for which expenses, gains and losses, assets, and
liabilities are identifiable.
Note 7: Retirement Plans
The retirement plans offered by the institution are described as well as whether these
plans are fully funded.
Note 8: Postemployment Benefits Other Than Pension
ABC University offers no other postemployment benefits other than pension.

BUDGET AND FINANCIAL AUDIT ANALYSIS FOR HIGHER EDUCATION ASSOCIATION LEADERS
57
PRIVATE COLLEGES AND UNIVERSITIES
As written earlier, private institutions of higher learning almost always follow FASB
accounting rules. FASB Statement No. 106, Post Retirement Benefits Other Than Pensions, went
into effect for fiscal years beginning after December 15, 1992, for institutions following FASB
accounting regulations. For most such institutions this was their 1993-94 fiscal year. This
requires the institution to reflect in its financial statements as a liability the actuarially
determined cost of its post-retirement benefits other than pensions. Typically these benefits
include health care, life insurance, and education benefits for the children of retired faculty or
staff. Prior to this rule, the costs of these benefits were recorded as they were paid, but no
provisions for the future costs were made in the audited financial statements.
FASB Statements Nos. 116 and 117
Effective for fiscal years beginning after December 15, 1994, i.e. with the 1995-96 fiscal
years of most private not-for-profit institutions, there were two new FASB statements that must
be applied to higher education units. These are FASB Statement No. 116, Accounting for
Contributions, and FASB Statement No. 117, Financial Statements of Not-for-Profit
Organizations. It should be noted that some articles refer to these statements as SFAS 116 and
SFAS 117 (Statement of Financial Accounting Standards 116 and 117) while others have simply
used FASB Statements Nos. 116 and 117.
For many colleges and universities FASB 116 had only a minor impact. However, for
some institutions the changes were significant. Previously, colleges and universities recorded

BUDGET AND FINANCIAL AUDIT ANALYSIS FOR HIGHER EDUCATION ASSOCIATION LEADERS
58
donations when they were received. Under FASB 116, institutions are required to record
contributions, including pledges, when received. Contributions must be unconditional,
voluntary, and nonreciprocal. Contributions are defined as an unconditional transfer of cash or
other assets to an entity or a settlement or cancellation of its liabilities in a voluntary
nonreciprocal transfer by another agency acting as other than an owner.
Previously, the expiration of restrictions on contributions was recognized when the
money was spent. Under FASB 116, “A not-for-profit shall recognize the expiration of donor-
imposed restriction in the period in which the restriction expires, that is, when the stipulated
purpose for which the resource was restricted has been fulfilled, when the stipulated time has
elapsed, or when another stipulated event has occurred.”
The result of the above changes is that the unrestricted assets of the institution increase
compared to the previous system since some of the pledges are for unrestricted funds, and
restrictions on other funds will be removed sooner for some contributions than before. In
addition, due to changes in definitions under FASB 117, contributions are categorized as
restricted, temporarily restricted, or permanently restricted.
A further change due to FASB 116 is that the value of contributed services, which did not
appear on most institutions’ financial statements, must be recorded as contributions if they either
created or enhanced non-financial assets or if they require skills that must be provided by
specialists and which would typically be purchased if not provided as a donation. This also
increases the value recorded for contributions.
BUDGET AND FINANCIAL AUDIT ANALYSIS FOR HIGHER EDUCATION ASSOCIATION LEADERS
59
Finally, under FASB 116, certain contributions of works of art would not have to be
recorded as revenue as long as they meet the following criteria: held for public exhibition,
education, or research in furtherance of public service rather than financial gain; protected, kept
unencumbered, cared for and preserved; and subject to an organizational policy that requires the
proceeds from sales of collection items to be used to acquire other items for the collection.
Obviously, if a college or university has negligible contributions, these requirements have little
effect on its “bottom line.”
FASB 117 had a much greater impact on the budgets of colleges and universities
following FASB accounting principles. First, it changed the categories of assets. The three
categories previously were unrestricted, restricted, and net investment in plant. Under FASB
117, the definition of “unrestricted funds” changed to include “net investment in plant.” This
means that for fiscal years 1995-96 and beyond, colleges that adopt FASB 117 reported a new
category: New Unrestricted Fund Balance = Old Unrestricted Fund Balance + Net Investment in
Plant.
This would generally mean a huge increase in the Unrestricted Fund Balance as of June
30, 1996 compared to June 30, 1995—an increase that is simply the result of an accounting
change. The institution’s notes to the financial statements would no doubt reflect this accounting
change. However, it is the increase in the unrestricted fund balance not due to its inclusion of net
investment in plant or of unrestricted pledges that is of greatest significance. That portion of the
increase in unrestricted funds is in principle available to address collective bargaining issues. In

BUDGET AND FINANCIAL AUDIT ANALYSIS FOR HIGHER EDUCATION ASSOCIATION LEADERS
60
addition to the new unrestricted funds, under FASB 117 there are two categories of restricted
funds.
‘Permanently restricted assets’ are those resulting from donor-imposed restrictions that
these assets be maintained permanently. However, the institution may expend part or all of the
income from these donated assets. The clearest example of permanently restricted assets is the
historical value of true endowment funds. Changes occur in this class of assets from additional
contributions, gains or losses on investment transactions (if those gains must be retained
permanently), income from investments (if this must be added to the permanent endowment), or
a transfer of endowment assets to another entity by judicial or similar authority. Basically, the
permanently restricted assets are the true endowment funds.
The second category of restricted funds is ‘ temporarily restricted assets,’ which also
result from donor-imposed restrictions that permit the institution to expend the donated assets
only as specified. These restrictions may be satisfied either by actions of the institution or the
passage of time. Temporarily restricted assets may be restricted to support only a particular
activity of the institution, may be required to be invested for a specified term (“ term
endowment”), or may only be used after some future date. Assets listed as ‘ restricted’ under the
old accounting rules under FASB 116 and 117 became ‘permanently restricted funds’ if they
were true endowments, while the remainder became either ‘ temporarily restricted’ or
‘unrestricted.’
There were also new financial statements required under FASB 117. First, the Statement
of Financial Position replaced the Balance Sheet (by Funds). FASB 117 requires that this

BUDGET AND FINANCIAL AUDIT ANALYSIS FOR HIGHER EDUCATION ASSOCIATION LEADERS
61
Statement, together with accompanying notes, provide the total amount of assets, liabilities, and
net assets; the total amount of each class of net assets, i.e., unrestricted, temporarily restricted, or
permanently restricted; information about restrictions on net assets; and information about
liquidity. Information about liquidity may be provided in a number of ways. Assets and
liabilities may be sequenced according to their nearness to cash. In this format, the most liquid
assets would be stated first (cash and cash equivalents) followed by those that would convert to
cash in the near future (such as accounts receivable) and finally by those that would not usually
be converted to cash (such as property, equipment, and plant). Liabilities would be listed by
nearness to maturity, starting with accounts payable and accrued expenses and ending with long
term debt. The notes also normally contain other information about liquidity such as the annual
maturity of long-term debt over the next five years.
The institution has the option of preparing the Statement of Financial Position as a single
column “corporate” model; as a set of columns, one for each class of net assets and a totals
column; or as an operating/capital model which divides assets, liabilities, and each class of net
assets between items used in ongoing operations and those retained for capital expenditures. The
drawback of the single column model is that the reader may be misled into thinking that the
institution has more assets (i.e. those net assets listed as unrestricted) available for the operation
of the institution than is actually the case, because most such assets may be ‘net investment in
plant.’ We present here under the FASB accounting principles the same financial data for ABC
University for the same date (June 30, 2009) that was presented in Table 1 under GASB 35.

BUDGET AND FINANCIAL AUDIT ANALYSIS FOR HIGHER EDUCATION ASSOCIATION LEADERS
62
Note that under FASB 117, total net assets are $6,000,000 greater as of June 30, 2009,
than under GASB 35 because $6,000,000 of loans receivable is treated as a liability under GASB
35 and thus reduces the net assets of the institution by that amount. Note also that the
unrestricted total of $97,900,000 under FASB 117 in Table 4 equals $91,200,000 (invested in
capital assets, net of related debt) + $6,700,000 (unrestricted) from Table 1 under GASB 35.
Table 4: ABC University Statement of Financial Position, FY 2008-09
The second financial statement required by FASB 117 is called a Statement of Activities
(Income Statement). FASB 117 identifies three possible formats for this statement. Format A is
AssetsCash $ 5,820,000 $ 3,750,000 Accounts receivable, net 650,000 570,000 Unbilled charges 150,000 120,000 Inventories 800,000 750,000 Prepaid expenses 250,000 200,000 Investments 3,430,000 3,790,000 Loans receivable, net 6,000,000 5,850,000 Deposits with trustees 1,000,000 1,000,000 Land, building and equipment 96,800,000 97,600,000 Long-term investments 12,000,000 8,000,000
Total assets $ 126,900,000 $ 121,630,000
Liabilities and Net ValuesAccounts payable and accrued 1,080,000 1,060,000 Short-term notes payable 600,000 600,000 Deferred income and credits 350,000 250,000 Long-term debt 5,200,000 8,200,000
Total liabilities $ 7,230,000 $ 10,110,000 Net AssetsUnrestricted 97,900,000 92,940,000 Temporarily restricted 13,020,000 12,530,000 Permanently restricted 8,750,000 6,050,000
Total net assets 119,670,000 111,520,000 Total liabilities and net assets $ 126,900,000 $ 121,630,000
2009 2008

BUDGET AND FINANCIAL AUDIT ANALYSIS FOR HIGHER EDUCATION ASSOCIATION LEADERS
63
a single column of revenues, expenditures, and other changes for a given fiscal year. Format B is
a multi-column format of the same information, with a separate column for unrestricted,
temporarily restricted, and permanently restricted funds, as well as a total. Format C is a two-
statement approach. One statement would list unrestricted revenues, expenses, and other
changes in net assets while the second statement would list changes in net assets. ABC
University’s Statement of Activities is presented in Table 5.

BUDGET AND FINANCIAL AUDIT ANALYSIS FOR HIGHER EDUCATION ASSOCIATION LEADERS
64
Table 5: ABC University Statement of Activities, FY 2009
Among the important changes that are displayed in the Statement of Activities are that all
expenditures will be made out of the unrestricted funds; depreciation is an unrestricted expense;
and revenues are recorded by type of restriction. Donor-restricted contributions that are met in
Permanently
Revenue and GainsTuition and fees $ 16,520,000 $ $ $ 16,520,000 State appropriations 31,000,000 31,000,000 Federal grants/contracts 950,000 3,950,000 4,900,000 State grants/contracts 180,000 1,840,000 2,020,000 Local grants/contracts 20,000 160,000 180,000 Private gifts 350,000 2,665,000 1,800,000 4,815,000 Investment income 230,000 460,000 300,000 990,000 Educational sales 800,000 800,000 Auxiliary enterprises 8,850,000 8,850,000 Realized gains in investments 150,000 225,000 600,000 975,000 Other sources 50,000 50,000
Total revenues/gains $ 59,100,000 $ 9,300,000 $ 2,700,000 $ 71,100,000 Net assets released from restrictions 8,810,000 (8,810,000)
Revenues/gains and other $ 67,910,000 $ 490,000 $ 2,700,000 $ 71,100,000
Expenses and LossesInstruction $ 21,340,000 21,340,000 Research 6,120,000 6,120,000 Public service 4,250,000 4,250,000 Academic support 3,960,000 3,960,000 Student services 2,800,000 2,800,000 Institutional support 5,100,000 5,100,000 Operations/maintenance 5,220,000 5,220,000 Scholarships 3,200,000 3,200,000 Auxiliary activities 8,600,000 8,600,000
220,000 220,000 140,000 140,000
Depreciation 2,000,000 2,000,000 Total expenses $ 62,950,000 $ - $ - $ 62,950,000 Change in net assets $ 4,960,000 $ 490,000 $ 2,700,000 $ 8,150,000 Net assets start of year 92,940,000 12,530,000 6,050,000 111,520,000 Net assets end of year $ 97,900,000 $ 13,020,000 $ 8,750,000 $ 119,670,000
Loan cancel/collect
Unrestricted RestrictedTemporarily
Restricted Total
Interest

BUDGET AND FINANCIAL AUDIT ANALYSIS FOR HIGHER EDUCATION ASSOCIATION LEADERS
65
the same reporting period in which contributions are made may be reported as either unrestricted
revenues or temporarily restricted revenues. FASB 117 requires the reporting of expenses by
“ functional classification” (i.e. instruction, research, etc.). Institutions of higher learning are
encouraged, but not required, to also report expenses by “natural classification” (i.e. salaries,
rent, etc.). Table 5 represents a much-simplified version of a Statement of Activities for ABC
University. It does not include a comparison with the comparable totals for fiscal 2008, as would
probably appear in an actual audited financial statement. Note that the changes in each class of
net assets are the same from the Statement of Activities (Table 5) as from the Statement of
Financial Position (Table 4).
The third required statement is a Statement of Cash Flow. The purpose of this statement
is to provide relevant information about the cash receipts and cash flow of the institution for a
given fiscal year. The minimum requirements are that this statement provides total changes in
cash and cash equivalents: total amount of net cash provided by or used for investing activities,
financing activities, and operations; interest paid on debt; significant noncash financing and
investment activities; and a reconciliation of change in total net assets to net cash provided by or
used by operations. There are two methods of presentation of cash flows. The direct method
reports cash inflows and cash outflows by the major classes of specific activities. This approach
would be far easier for a faculty or staff member to understand since the cash received would be
related to activities such as teaching or research. An example of the direct method was presented
in Table 3. The second method, called the indirect method, starts with net change in total assets
for a given fiscal year (the bottom line of the Statement of Activities) and makes numerous

BUDGET AND FINANCIAL AUDIT ANALYSIS FOR HIGHER EDUCATION ASSOCIATION LEADERS
66
adjustments to that number for the fiscal year to indirectly determine the cash flow. This cash
flow number is the difference between the cash on hand as of the beginning and end of the fiscal
year (the first line of the Statement of Financial Position.)
Table 6 presents the cash flow figures for just one year of ABC University using the
indirect method. The indirect method is easier for financial officers to prepare, but much harder
for faculty and staff to understand. Most Statements will include a second column to compare
these with the corresponding numbers for the prior fiscal year.
To understand whether a given adjustment should be negative or positive, one must
consider whether an increase in the given asset or liability will increase or decrease the cash
available. For example, depreciation, while it represents a negative against the overall net assets,
does not use up any cash. Hence the institution should have the cash equal to depreciation. An
increase in accounts payable means that the institution owes more money to vendors, etc., but it
has the cash until these accounts are paid. The purchase of buildings and equipment is a negative
for the amount of cash flow, since the money is spent. An increase in accounts receivable is a
negative entry in Table 6 since those funds have not yet been received. It should be noted that
the net increase in cash of $2,070,000 from Table 6 is exactly the increase in cash given in the
first line of Table 4. This represents an over-simplified version of the indirect method of cash
flows. As was the case in GASB Statements Nos. 34 and 35, FASB Statement No. 117 requires
that financial statements be presented along with the notes to the financial statements similar to
the notes that were presented for Tables 1-3.
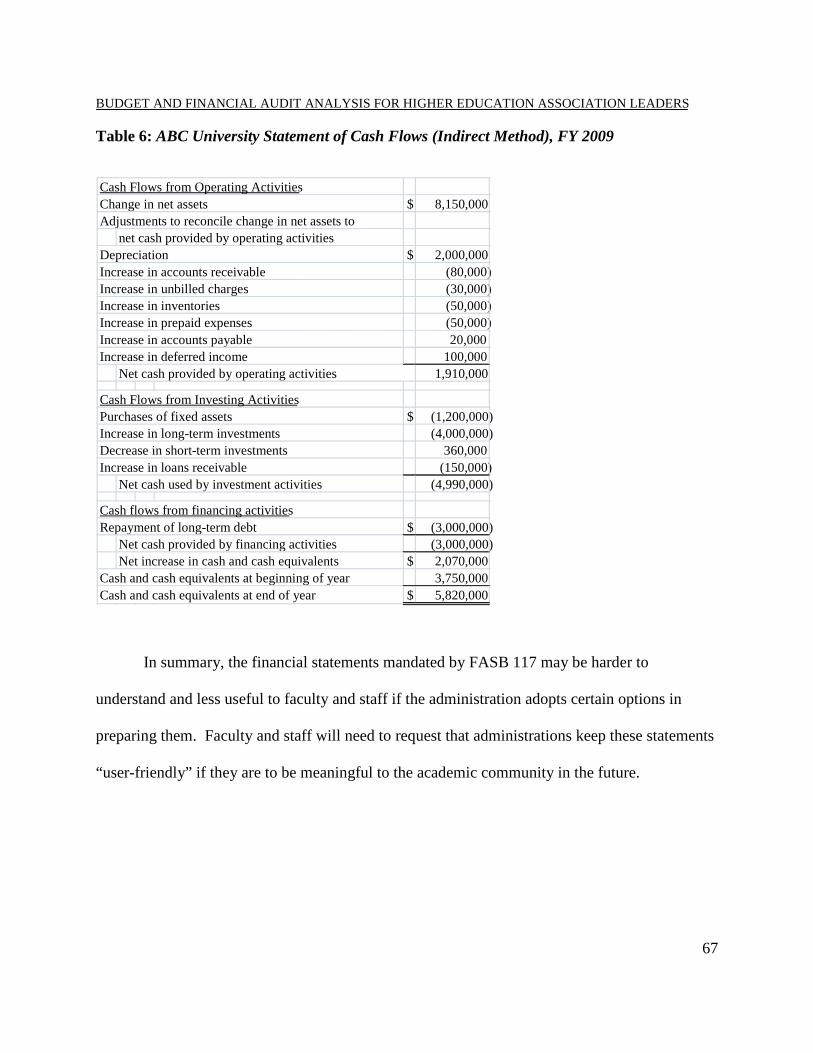
BUDGET AND FINANCIAL AUDIT ANALYSIS FOR HIGHER EDUCATION ASSOCIATION LEADERS
67
Table 6: ABC University Statement of Cash Flows (Indirect Method), FY 2009
In summary, the financial statements mandated by FASB 117 may be harder to
understand and less useful to faculty and staff if the administration adopts certain options in
preparing them. Faculty and staff will need to request that administrations keep these statements
“user-friendly” if they are to be meaningful to the academic community in the future.
Change in net assets $ 8,150,000 Adjustments to reconcile change in net assets to net cash provided by operating activitiesDepreciation $ 2,000,000 Increase in accounts receivable (80,000) Increase in unbilled charges (30,000) Increase in inventories (50,000) Increase in prepaid expenses (50,000) Increase in accounts payable 20,000 Increase in deferred income 100,000
Net cash provided by operating activities 1,910,000
Purchases of fixed assets $ (1,200,000) Increase in long-term investments (4,000,000) Decrease in short-term investments 360,000 Increase in loans receivable (150,000)
Net cash used by investment activities (4,990,000)
Cash flows from financing activitiesRepayment of long-term debt $ (3,000,000) Net cash provided by financing activities (3,000,000) Net increase in cash and cash equivalents $ 2,070,000 Cash and cash equivalents at beginning of year 3,750,000 Cash and cash equivalents at end of year $ 5,820,000
Cash Flows from Operating Activities
Cash Flows from Investing Activities

BUDGET AND FINANCIAL AUDIT ANALYSIS FOR HIGHER EDUCATION ASSOCIATION LEADERS
68
CHAPTER 4 DERIVATIVE INSTRUMENTS Chapter Objectives
After completing this chapter, readers will be able to:
� Identify the fundamental characteristics of a derivative instrument.
� Understand the requirements of GASB Statement No. 53 relative to financial reporting for derivative instruments in colleges and universities.

BUDGET AND FINANCIAL AUDIT ANALYSIS FOR HIGHER EDUCATION ASSOCIATION LEADERS
69
Derivative Instruments
This chapter introduces the reader to GASB Statement No. 53, Accounting and Financial
Reporting for Derivative Instruments. Since the impact of the use of derivative instruments has
been substantial on the balance sheets of higher education institutions, as well as on the economy
of the entire country, a detailed discussion of GASB 53 is necessary. Note that the comparable
accounting rule for private institutions, FASB Statement No. 133, Accounting for Derivative
Instruments and Hedging Activities, was issued in June 1998 for institutions following FASB
rules.5
GASB Statement No. 53, Accounting and Financial Reporting for Derivative
Instruments, requires that institutions disclose the value of their financial arrangements known as
derivatives in the notes to their financial statements and describes the extent to which these
arrangements expose an institution to financial risk. While the use of such derivatives is often
referred to in the audited financial statements of a number public colleges and universities, the
risk associated with their use has not always been clearly identified, nor has a value been
assigned to the derivative instruments in the statements of net assets. Derivative instruments have
been partially responsible for the economic meltdown that occurred in calendar year 2008-09 and
have been called “weapons of mass economic destruction” by more than one investor. The
requirements of GASB 53 are effective for financial statements beginning after June 15, 2009,
i.e. for the 2009-2010 fiscal year for most higher education institutions.
5 Subsequent to that pronouncement, FASB Statement No. 133 was amended by SFAS No. 137, 138, 155, 161 and FSP FAS 133-1 & FIN 45-4.

BUDGET AND FINANCIAL AUDIT ANALYSIS FOR HIGHER EDUCATION ASSOCIATION LEADERS
70
The fair value of derivatives will be reported in the financial statements, as well as the
change in fair value from year to year. The fair value of a derivative instrument is either the
value of its future cash flows in today’s dollars or the price it would bring if it could be sold on
an open market.
Derivatives can be used to hedge against a specific risk. One example would be if a
university sold bonds that had a variable interest rate based on such factors as the rate of inflation
(which would make them more appealing to investors) and the institution entered into a hedge
agreement with another firm to pay only a given rate of interest no matter what the actual rate of
interest paid on its bonds.
The purpose of such an arrangement would be to have the total interest paid for the bonds
be less than if the institution had to offer a higher fixed interest rate directly to bond holders at
the time the bonds were offered. There are a number of risks for an institution which enters into
this agreement, such as credit risk (the firm will not be able to fulfill its obligation), interest rate
risk (the longer a derivative lasts, the greater the risk that changes in interest rates reduce the
value of the transaction), termination risk (the derivative ends earlier than expected), etc.
Another use of derivatives is to hedge against an increase in the price of a commodity, for
example, oil or gas to be used for heating buildings, or the future cost of electricity. We should
caution the reader that this chapter provides only a very brief (and therefore very incomplete)
introduction to the use of derivative financial instruments.

BUDGET AND FINANCIAL AUDIT ANALYSIS FOR HIGHER EDUCATION ASSOCIATION LEADERS
71
What are the fundamental characteristics of a derivative instrument? It has (1) settlement
factors, (2) leverage, and (3) net settlement. Settlement factors include the reference rate,
notional amount, and payment provisions. A reference rate may be the price or rate for an asset
or liability but is not the asset or liability itself. It could be an interest rate, security price,
commodity price, or even a climactic or geological condition such as temperature or earthquake
severity. It must be a variable whose changes can be objectively determined. Common reference
rates are the London Interbank Offered Rate (LIBOR), the Securities Industry and Financial
Markets Association (SIFMA) swap index, or the price of heating oil at the New York City
harbor pricing point.
The notional amount is simply the number of dollars, shares, barrels or other units
specified in the derivative instrument. A payment provision may specify when a payment is to be
made, for example, if a fuel price at a certain pricing point exceeds a certain price.
Leverage occurs if either a small investment or no initial investment allows for the
derivative instrument to have changing cash flows or changing fair value that replicates a
financial instrument that would normally require a much larger investment. For example, an
interest rate swap may require no initial net investment. The swap’s fair value will change as
though the owner of the swap had made an initial investment in a fixed rate instrument with a
principal amount equal to the swap’s notional value. Some derivative instruments require a
mutual exchange of assets at inception, in which case the initial investment is the difference
between the fair values of the assets exchanged.

BUDGET AND FINANCIAL AUDIT ANALYSIS FOR HIGHER EDUCATION ASSOCIATION LEADERS
72
Net settlement requires that the settlement provisions meet one of the following criteria:
1. Neither party is required to deliver an asset that is associated with the reference rate and that has a principal amount equal to the notional amount (plus a premium or minus a discount). For example, most interest rate swaps do not require that either party deliver cash or assets equal to the notional amount of the contract.
2. One of the parties is required to deliver an asset described in (1) above, but there is a
market mechanism that facilitates the net settlement. For example, a futures exchange offers an opportunity to enter into an offsetting contract.
3. One of the parties is required to deliver an asset described in (1) above, but that asset
is readily convertible to cash or is itself a derivative instrument, for example, a forward contract that requires the delivery of a bond.
Among the financial instruments not included in the scope of GASB 53 are normal
purchases and normal sales contracts. According to paragraph 14, “These contracts are
distinguished from other purchases and sales contracts by their net settlement feature. That is, the
government may have a choice to take or make delivery of the commodity or exchange the cash
value of the contract to terminate the government’s rights or obligations. These contracts are not
included in the scope of this Statement, provided that it is probable the government will take or
make delivery of the commodity specified in the derivative instrument.” (One can substitute
“college” or “university” for “government” throughout the wording of GASB 53.)
According to GASB 53, paragraph 22, “Hedge accounting should cease to be applied
upon the occurrence of one of the following termination events:
1. The hedging derivative instrument is no longer effective.
2. The likelihood that a hedged expected transaction will occur is no longer probable.

BUDGET AND FINANCIAL AUDIT ANALYSIS FOR HIGHER EDUCATION ASSOCIATION LEADERS
73
3. The hedged asset or liability, such as a hedged bond, is sold or retired but not reported as a current refunding or advanced refunding resulting in a defeasance of debt.
4. The hedging derivative instrument is terminated.
5. A current refunding or advanced refunding in the defeasance of the hedged debt is
executed.
6. The hedged expected transaction occurs, such as the purchase of an energy commodity or the sale of bonds.”
GASB 53, paragraph 27 states that:
“A hedging derivative instrument is established if both of the following criteria are met:
1. The derivative instrument is associated with a hedgeable item; and 2. The potential hedging derivative instrument is effective in significantly reducing
the identified financial risk.”
Hedgeable items expose an institution to identified financial risks that can be expressed
in terms of exposure to adverse changes in cash flow or fair values. Hedgeable items can be all
or a specific portion of a single asset or liability (for example a bond issue), a group of similar
assets or liabilities, or an expected transaction. Note that assets and liabilities that are measured
at fair value (such as investments in many debt securities) do not qualify as hedgeable items.
GASB 53 goes into great detail to describe methods for evaluating the effectiveness of a
potential hedging instrument. First the instrument is evaluated using the “consistent critical terms
method.” If it does not meet the criteria for effectiveness of that method, at least one
“quantitative method” is to be applied before concluding that the potential derivative instrument
is ineffective. Three quantitative methods are identified to evaluate effectiveness: the synthetic

BUDGET AND FINANCIAL AUDIT ANALYSIS FOR HIGHER EDUCATION ASSOCIATION LEADERS
74
instrument method, the dollar-offset method, and the regression analysis method. A description
of these is beyond the scope of this book. However, if a hedging instrument is reported in the
annual audit, presumably it has been found to satisfy the above evaluation criteria for
effectiveness.
For all hedging derivative instruments, GASB 53 has the following note disclosure
requirements: Institutions should disclose their objectives for entering into these instruments, the
context needed to understand those objectives, the strategies for achieving those objectives, and
the types of derivative instruments entered into. They should also disclose significant terms of
these derivative instruments as well as their exposure to risks that could give rise to financial
loss. These include credit risk, i.e., the credit rating of the counterparty by nationally recognized
credit rating organizations. However, GASB 53 does not require the institution to disclose the
identity of a counterparty to a derivative instrument.
Given the failure of rating agencies to accurately evaluate the risk in some investments
which led to the 2008 economic meltdown, it is odd to find that the name of the counterparty
does not have to be provided in the institution’s annual financial statements. After all, if the
counterparty were to go bankrupt, what would be the financial impact on the institution? One
institution that the lead author recently examined had Lehman Brothers as its counterparty. The
collapse of Lehman Brothers in 2008 cost that institution between $20 million and $200 million
dollars.
Other risks that should be addressed and are to be disclosed include: interest rate risk
(whether the hedging derivative instrument increases the risk that a given change in interest rates

BUDGET AND FINANCIAL AUDIT ANALYSIS FOR HIGHER EDUCATION ASSOCIATION LEADERS
75
will adversely affect the institution financially), basis risk, termination risk, rollover risk, market-
access risk, and foreign currency risk. For investment derivative instruments, institutions are also
required to disclose their exposure to the following risks that could give rise to financial loss:
credit risk, interest rate risk and foreign currency risk.
The requirement that the institution present an analysis of each of these risks is a very
positive aspect of GASB 53, since it will force administrators to recognize that there are risks
associated with these derivative instruments. This may result in a more selective use of these
derivatives by college and university administrations, thereby reducing the likelihood of future
economic calamities striking some institutions who may in the past have not fully understood the
risks they were taking when using these derivatives. Two examples will suffice to explain the
potential impact of GASB 53 on financial reporting in public colleges and universities.
Example 1: Interest Rate Swap
ABC University issues $10 million dollars’ worth of 20-year bonds. It wants to issue
fixed rate bonds, but the market rate for 20-year fixed rate bonds is five percent interest since
potential buyers are concerned that interest rates may rise substantially in the future. ABC
University therefore issues variable rate bonds with an interest rate equal to the SIFMA
(Securities Industry and Financial Market Association) swap index plus 0.2 percent. In order to
protect itself against increases in the SIFMA index in the future, ABC University also enters into
a swap with a counterparty. ABC University pays the counterparty 4.0 percent interest on $10
million and in exchange receives the SIFMA swap index on $10 million from the counterparty.
If interest rates rise in the future, the increased payments that ABC University must make to its

BUDGET AND FINANCIAL AUDIT ANALYSIS FOR HIGHER EDUCATION ASSOCIATION LEADERS
76
bond holders is substantially offset by the increased payments it receives from the counterparty.
In essence, ABC University is paying a total interest rate of 4 percent + 0.2 percent = 4.2
percent, substantially less than it would have paid (five percent) if it had issued fixed rate bonds.
Because the terms of the bonds and the interest rate swap are consistent, ABC University
uses the consistent critical terms method to evaluate the effectiveness as of the end of each
reporting period, i.e., its fiscal year. Because the critical terms are consistent, the changes in cash
flows from the swap will substantially offset the changes in cash flow of the variable rate bonds
attributable to changes in the SIFMA swap index. Hence the swap is a hedging derivative
instrument, and hedge accounting is applied.
In the audited report at the end of each fiscal year, an interest expense of $420,000 will
appear (4.2 percent of $10,000,000) in the Statement of Revenues, Expenses and Changes in Net
Assets. In the Statement of Net Assets, the $10,000,000 in bond debt will appear each year until
the debt is repaid in 20 years. There will also be an entry for deferred outflow of resources and a
derivative instrument liability, both of which will differ from year to year depending upon the
value of the SIFMA swap index.
Clearly, the example given above is advantageous to ABC University. But the advantage
is dependent upon ABC finding a counterparty that would be willing to enter into the SIFMA
swap index arrangement for a fixed payment of only 4.2 percent from the University while
bondholders would have demanded five percent for a fixed rate bond. The question to ask is,
why would a third party agree to this? And, if one could be found, would that third party still be
in existence over a 20-year period? If the third party entered into too many such rate swaps that

BUDGET AND FINANCIAL AUDIT ANALYSIS FOR HIGHER EDUCATION ASSOCIATION LEADERS
77
were advantageous to the institutions making them, it could well be bankrupt before the end of
the 20-year period, leaving ABC University with the obligation to pay the bondholders a much
higher rate than the five percent fixed rate that was in effect at the time the bonds were sold.
Example 2: Cash Flow Hedge – Commodity Forward Contract
ABC University enters into a supply contract for the purchase of natural gas at the Henry
Hub pricing point in Louisiana for gas received in December 2011. ABC University plans to buy
100,000 million British Thermal Units (MMBTUs) of natural gas. To hedge its market risk, ABC
University enters into a commodity forward contract on April 1, 2011. ABC University agrees to
pay a fixed price of $8.00 per MMBTU on a notional quantity of 100,000 MMBTUs and agrees
to receive a variable payment based on the price of natural gas at the Henry Hub for the month of
December 2011. Because the forward price for December 2011 for natural gas is $8.00 per
MMBTU at the time the forward contract is executed, the forward contract is entered into at no
cost. It thus has an initial zero fair value.
Based on the consistency of the terms of the forward contract and the expected purchase,
ABC University determines that the forward contract is a hedging derivative instrument using
the critical terms method. The increase in fair value of this forward contract is reported as a
deferred inflow of resources in the statement of net assets as of June 30, 2011. Because the
critical terms are consistent, the changes in the cash flows of the forward contract will
substantially offset the changes in cash flow of the expected purchase. Hence the commodity
forward contract is a hedging derivative instrument, and hedge accounting is applied.

BUDGET AND FINANCIAL AUDIT ANALYSIS FOR HIGHER EDUCATION ASSOCIATION LEADERS
78
If at December 2011 the cost of natural gas is $8.50 per MMBTU, then the forward
contract will have a value of $.50 x 100,000 = $50,000, the amount saved on the purchase of
100,000 MMBTU’s.
In summary, GASB 53 will require that annual audited financial statements of higher
education institutions present and discuss all derivative financial instruments in their annual
financial reports. Hopefully this will give the reader a more complete picture of the financial
status of the institution, as well as save some money when either debt is issued or future
purchases are made.

BUDGET AND FINANCIAL AUDIT ANALYSIS FOR HIGHER EDUCATION ASSOCIATION LEADERS
79
CHAPTER 5 COMPARATIVE AND RATIO ANALYSES Objectives: After completing this chapter, Association leaders will be able to:
� Define financial analysis and define its basic principles.
� Outline and formulate comparative analysis and ratio analysis techniques.
� Isolate the appropriate questions for an institutional ratio analysis request.
� Review the core ratio analyses to calculate for an institution.

BUDGET AND FINANCIAL AUDIT ANALYSIS FOR HIGHER EDUCATION ASSOCIATION LEADERS
80
Comparative and Ratio Analyses
In the present context, financial analysis refers to an assessment of the viability, stability
and profitability of a business or the viability, stability and public accountability of a local or
government. Financial analyses are conducted by accounting, finance, and auditing professionals
who utilize financial information from institutional budgets, financial statements, and reports.
This information assists management and Association leaders in making decisions relative to
institutional plans, mission, revenues, investments, expenditures, operations and program
evaluation. Finally, it points to alternatives, options and opportunities for institutional growth,
and the accomplishment of institutional objectives and mission.
The basic principles of financial analysis are presented concisely in NACUBO’s latest
text on strategic financial analysis for higher education institutions (Tahey, Salluzo, Prager,
Mezzina, & Cowen, 2010): (1) “Financial metrics and ratios should be used to measure success
factors in order to improve the institution financially to achieve its mission; (2) The information
being compared must be prepared on a fairly consistent basis; and (3) Peer comparisons are only
a weak relative indicator and do not measure attainment of an institution’s unique mission.
Therefore, common sense, qualitative interpretation and internal interpretation are required”
(p. 100).
Thus, this Handbook advocates for a joint labor-management approach to conducting
financial analyses that begins with the development of Association finance committees that
systematically and regularly analyze the budgets, financial statements, and audits of its
institution. When that information is missing or unclear, we urge such committees to request
such data through normal business operations or, when relations between labor and management

BUDGET AND FINANCIAL AUDIT ANALYSIS FOR HIGHER EDUCATION ASSOCIATION LEADERS
81
are not healthy, through Freedom of Information Act (FOIA) requests prior to bargaining. Third,
we recommend that such committees communicate regularly with management to review the
aforementioned financial information, discuss its consequences for the institution, and
understand the accounting and financial reporting changes occurring in the wider society that
will influence institutional accounting and financial reporting in the future. This presupposes that
labor and management are aware of, and in agreement on, the institution’s strategic plan and
mission.
An institution’s strategic plan is a statement of its strategies (i.e., set of plans of action to
achieve certain goals) and a description of how it will make its decisions to allocate scarce
resources to pursue these strategies to accomplish the institutional mission, or purpose. These
scarce resources include both tangible and intangible assets. Examples of the former include
personnel and capital; examples of the latter include intellectual capital and the institution’s
reputational capital. These two ideas should be embedded in institutional documents. While one
would hope that the Association helped to develop the strategic plan and institution’s mission,
the Association should at the very least possess a copy of these documents. Information is the
foundation of power.
Comparative Analysis
Once the Association has obtained the information that we recommended they receive in
Chapter 2, it is ready to begin with fundamental comparative analysis. The purpose of a
comparative analysis is to develop statements about the relative size or order of two variables or
to state whether they are the same or not. Statements that follow from comparative analyses often

BUDGET AND FINANCIAL AUDIT ANALYSIS FOR HIGHER EDUCATION ASSOCIATION LEADERS
82
include proportions, trends, patterns, and anomalies.
A propor tion is the quotient obtained when the magnitude of a part is divided by the
magnitude of the whole. Proportions are useful to calculate when considering the components of
a category, e.g., the proportion of total current assets that are represented in total current assets in
Table 1 (25.2 percent). A trend represents a general direction or orientation. Thus, if we were to
consider comparing four consecutive statements of net assets of an institution and find that each
year the total net assets of the institution declined from its previous level, we could say that the
institution was demonstrating a declining trend in net assets over that period of time. If the
unrestricted funds of an institution’s component unit were to suddenly decrease each time the
institution’s faculty collective bargaining agreement was due to expire, then revert to a high level
in the years following the negotiation of each new collective bargaining agreement, we have
observed a pattern. Thus, a trend goes in one direction during a particular time period, whereas
a pattern follows a defined, systematic path through a particular time period.
In contrast, an anomaly represents a deviation from the normal course of events, a trend,
or pattern. These events spark the interest of research analysts, as their existence calls for an
explanation. When an anomaly occurs in a budget, Association leaders must ask for an
explanation in writing. When it occurs in a financial statement, the notes to the financial
statement must include an explanation. If no explanation is provided, the Association leader must
write to the chief financial officer asking for an explanation.6 Guidance from the Government
Finance Officers Association (GFOA) advises financial analysts to utilize a public institution’s 6 According to GASB Concepts Statement No. 1, in order for financial communications to be effective, information in financial reports must be understandable, reliable, relevant, timely, consistent and comparable (GASB, 2010, B-22 through B-24). If the report does not possess these characteristics, the fault lies with the organization which generated the information.

BUDGET AND FINANCIAL AUDIT ANALYSIS FOR HIGHER EDUCATION ASSOCIATION LEADERS
83
own past performance as the context for analyzing its own current financial position and
performance and to express an institution’s financial position and performance emphasizing key
indicators such as revenues, expenditures and fund balances. Moreover, the GFOA considers it a
best practice to examine the percentage relationship among data elements over time to enhance
the utility of trend data, and to use (at a minimum) five years of data to provide an effective trend
analysis (GFOA, 2003). This advice should be placed in the context of GASB Concepts
Statement No. 1 which implores analysts to use consistent and comparable data (GASB, 2010,
B-22 – B-24).
Comparative analyses rely on analysts calculating proportions and detecting trends,
patterns, and anomalies in budget and financial statement analyses. Such comparative analyses
can be differentiated by time and focus. Here, time is a continuous variable that can be
represented by a single or multiple fiscal years. Similarly, the focus of the analysis can be on the
budget(s) or financial statement(s) of a single or number of institutions. This latter type of focus
is the subject of peer comparisons in Chapter 6. If we differentiate among the types of
comparative analyses that can be constructed on behalf of a higher education institution on the
basis of time and focus, four basic types can be observed:
1. An analysis that compares components of a category or one or more categories within a
budget or financial statement of a single institution using one or more proportions;
2. An analysis that compares components of a category or one or more categories between two or more budgets or financial statements of a single institution using proportions and trend/pattern/anomaly detection;
3. An analysis that compares components of a category or one or more categories across two or more budgets or financial statements of one institution’s proportions and intra-institutional trend/pattern/anomaly detection; and

BUDGET AND FINANCIAL AUDIT ANALYSIS FOR HIGHER EDUCATION ASSOCIATION LEADERS
84
4. An analysis that compares components of a category or one or more categories across
two or more budgets or financial statements of one institution’s proportions and inter-institutional trend/pattern/anomaly detection.
The use of each type of comparative analysis is predicated on the information to be
gleaned from the budget or financial statement. Comparative analysis is an exploratory data
analytic tool in the sense that the analyst runs the numbers to identify what is to be learned from
the financial figures. In contrast, ratio analysis is an evaluative tool when its purpose is to inform
decision-making. Statements that follow from ratio analyses involve ratios in addition to trends,
patterns, and anomalies within an institution at one point in time or across fiscal years. A ratio
represents the relative magnitudes of two quantities and is usually expressed as a quotient. Peer
comparisons are difficult to conduct appropriately because the ratios evaluate the extent to which
an institution can meet its mission, and the mission of each institution is (in all likelihood)
unique. As discussed in this Handbook, financial ratio analysis is to be used in financial
statement analyses only.
Since 1982, KPMG has written a series of strategic financial analysis texts for higher
education that have been recognized as the standard in the field. Each edition is unique and
offers a particular perspective on the tasks required of a financial analyst. The current edition is
the seventh (Tahey, Salluzo, Prager, Mezzina, & Cowen, 2010). It is available online at
http://www.prager.com/FinancialAdvisory/StrategicFinancialAnalysis; chapters 11-14 cover
ratio analyses. Another approach to ratio analysis for local and state governments is found in the
‘ financial condition analysis’ chapter of XiaoHu Wang’s Financial Management in the Public
Sector: Tools, Applications, and Cases (2006). Finally, the Ohio Board of Regents uses a

BUDGET AND FINANCIAL AUDIT ANALYSIS FOR HIGHER EDUCATION ASSOCIATION LEADERS
85
financial ratio analysis framework from which to analyze and assist Ohio public colleges and
universities in assessing their financial health
(http://regents.ohio.gov/financial/campus_accountability/index.php). This system has proven to
be quite successful in establishing a stable benchmark from which to judge higher education
institutional accountability. While we cannot guarantee that any particular higher education
institution outside Ohio includes ratio analysis in their planning and management processes, the
practice has been popular among many higher education institutions. We want you to be able to
ask for the appropriate documentation to identify whether or not they have adopted ratio analysis
techniques, and ask the right questions to ensure that you understand the results of these
analyses.
Financial ratio analysis has traditionally been defined as the evaluation and interpretation
of an institution’s financial data using standard financial ratios or accounting ratios to determine
an institution’s financial state or condition. Financial ratios are constructed from two values
taken from an institution’s financial statements. In applying this concept to higher education
institutions, analysts focus on key financial data to answer questions raised by an institution’s
stakeholders. In that sense, they are unique to an institution and its strategic plan and mission.
These ratios focus on trends, patterns and anomalies within the institution, and should include
several years’ worth of data to make assertions about the financial state or condition of the
institution. In higher education, this means that financial ratios focus on the institution’s relative
ability to repay current and future debt (p. 106; Wang, 2006, p. 150) and whether the institution
is using its financial resources effectively to meet its mission (Tahey, Salluzo, Prager, Mezzina,
& Cowen, 2010, p. 109). There are numerous ways in which financial ratios can be calculated, so

BUDGET AND FINANCIAL AUDIT ANALYSIS FOR HIGHER EDUCATION ASSOCIATION LEADERS
86
Association leaders need to obtain the particular ratios utilized by the institutions, its calculations
and assumptions prior to reviewing the administration’s analyses.
Following the current guidance in the field, we review the two-step process to define,
measure, and report the financial health of an institution. In this model, the first step requires the
presentation of one question which, if answered affirmatively, leads to the presentation of four
additional questions in a second step.
Liquidity Ratio
The first ratio seeks to determine if the institution has sufficient liquidity. A number of
calculations of liquidity are possible depending on the term (short-term or immediate term
measure) and the types of assets held by an institution. While there is no established standard,
sources of liquidity ratio sources include cash and operating funds, operating funds held in an
investment pool, endowment cash and other assets (net of securities lending requirements), net
capital redemptions (calls), operating lines of credit, commercial papers, bond anticipation notes
(B.A.N.), dedicated lines of credit, philanthropy, accounts receivable and payable, and external
funds. The liquidity ratio is new to the KPMG series, and its exposition is short on prescriptions.
Whichever sources are used, the authors of the text indicate that the liquidity ratio should be ≥
1.0. If higher, the institution has some cushion; if below, it needs to raise cash and/or cash
equivalents. Once the institution has established that it has the ability to convert its assets to cash
without significant loss in the short-term, it can proceed with the second step in the process of
understanding its financial condition (pp. 19-30, 110-111).
Here, the Wang text has more utility for the field than the KPMG text. For Wang, the
financial condition of an institution is rooted in its ability to meet its financial obligations. An

BUDGET AND FINANCIAL AUDIT ANALYSIS FOR HIGHER EDUCATION ASSOCIATION LEADERS
87
institution is solvent if it can pay its obligations without resorting to raising additional revenues.
Wang provides four types of solvency and eight ratios with which to measure them; we have
chosen four to present herein for their clarity and usefulness.
The first type of solvency discussed by Wang is cash solvency, which refers to an
institution’s ability to generate sufficient cash from its current assets to pay for its current
liabilities. Cash solvency can be estimated via the Quick Ratio:
Quick Ratio = Cash & Cash Equivalents + Marketable Securities + Receivables Current Liabilities
A higher quick ratio value indicates greater cash solvency (Wang, 2006, 150-151).
The second type of solvency addressed by Wang is budgetary solvency, which estimates
an institution’s ability to generate sufficient revenues to pay its expenses; it is estimated through
the Operating Ratio:
Operating Ratio = _______Total Revenues______ Current Expenditures (Expenses)
Similar to the quick ratio, a higher operating ratio value indicates greater budgetary solvency
(ibid).
The third type of institutional solvency defined by Wang is long-run solvency, which
estimates an institution’s ability to pay for the long-term obligations it has incurred. This is
measured through the Net Asset Ratio:

BUDGET AND FINANCIAL AUDIT ANALYSIS FOR HIGHER EDUCATION ASSOCIATION LEADERS
88
Net Asset Ratio = Total Net Assets Total Assets
A higher net asset ratio value can be interpreted as higher long-run solvency, which in turn is
connected to an institution’s ability to last through tough fiscal times (ibid).
Lastly, service solvency can be defined as the extent to which an institution retains the
ability to pay for the existing level and quality of services it is obligated to pay now and in the
future. This is measured via the Long-Term Debt per Capita Ratio, which uses population in
the denominator. In higher education, one can use headcount or full-time equivalent (FTE)
students as the denominator.
Long-Term Debt per Capita Ratio = Total Long-Term Debt Population
Here, lower long-term debt per capita ratio values are associated with higher service solvency
(Wang, 2006, 150-152). Similar to the KPMG series of ratio analysis texts, Wang recommends
trend analyses using several years’ worth of data to issue financial condition pronouncements.
The question of institutional liquidity or solvency identifies whether or not institutional resources
need to be increased in order to address its objectives. Once this question is answered, the analyst
proceeds to the second step in the financial ratio analysis process. In this step, four questions are
addressed:
1. Are resources sufficient and flexible enough to support the mission? The answer to this
question is answered through the calculation of the Primary Reserve Ratio.
2. Are debt resources managed strategically to advance the mission? Here, analysts

BUDGET AND FINANCIAL AUDIT ANALYSIS FOR HIGHER EDUCATION ASSOCIATION LEADERS
89
calculate a Viability Ratio to provide an answer to this question.
3. Do asset performance and management support the strategic direction of the institution? Here, the Return on Net Assets Ratio is calculated.
4. Do operating results indicate the institution is living within available resources? This question can be answered through the calculation of the Net Operating Revenues Ratio (Tahey, Salluzo, Prager, Mezzina, & Cowen, 2010, p. 109).
Primary Reserve Ratio
The primary reserve ratio answers the question ‘Are resources sufficient and flexible
enough to support the mission?’ Here, the financial strength of an institution is assessed by
comparing its net assets to its total expenses. For private higher education institutions, it is
calculated by dividing the expendable net assets of the institution by its total expenses. For
public higher education institutions, the institution’s expendable net assets plus the FASB
component unit expendable net assets are divided by the institution’s total expenses plus its
FASB component unit’s total expenses.
Over time, the primary reserve ratio of an institution will identify its financial condition;
if it rises, its strength is risings; if it falls, it is weakening. Here, the threshold level is a quotient
of ≥ 0.4, indicating that the institution has the flexibility that it needs to support its mission. This
result indicates that the institution has the ability to cover five months of expenses (40 percent of
12 months) (112-114).
Viability Ratio
The viability ratio answers the question ‘Do asset performance and management support
the strategic direction of the institution?’ This ratio measures the availability of expendable net

BUDGET AND FINANCIAL AUDIT ANALYSIS FOR HIGHER EDUCATION ASSOCIATION LEADERS
90
assets to cover debt should the institution need to settle its obligations as of the date indicated in
the balance sheet or statement of net assets.
For private higher education institutions, it is calculated by dividing the expendable net
assets of the institution by its plant-related debt. For public higher education institutions, the
institution’s unrestricted net assets and the expendable restricted net assets are added to the sum
of the FASB component unit’s unrestricted net assets plus the temporarily restricted net assets
expendable net assets minus the net investment in plant are divided by the institution’s total
plant-related debt plus its FASB component unit’s plant-related debt. While the quotient of the
ratio is not associated with an absolute standard, institutions with a viability ratio of ≤ 1.0 are
associated with significantly lower flexibility than those institutions that score higher (115-116).
Return on Net Assets Ratio
Calculating the return on net assets ratio helps to identify the extent to which asset
performance and management support the strategic direction of the institution. Here, the total
economic return of the institution can be tracked over time to determine its relative financial
health. For private higher education institutions, it is calculated by dividing the institution’s
change in net assets by its total net assets; for public higher education institutions, the numerator
is the institution’s change in net assets plus FASB component unit’s change in net assets, while
the denominator is the institution’s total net assets plus FASB component unit’s total net assets.
Again, while there are no absolute standards, a result of ≈ 3.5 percent may be appropriate (pp.
122-123).

BUDGET AND FINANCIAL AUDIT ANALYSIS FOR HIGHER EDUCATION ASSOCIATION LEADERS
91
Net Operating Revenues Ratio
The purpose of the net operating revenue ratio is to determine the extent to which
operating results indicate that the institution is using its resources prudently. This ratio is highly
correlated with the second, third and fourth ratios as it calculates how the surplus from operating
activities impacts institutional net assets. The larger the ratio, the greater the institution’s
operating surplus is for the year.
To calculate it for a private higher education institution, divide the excess of unrestricted
operating revenues over unrestricted operating expenses by the institution’s total unrestricted
operating revenue. For public higher education institutions, the numerator is the institution’s
operating income (loss) plus net non-operating revenues plus its FASB component unit’s change
in unrestricted net assets, while the denominator is the institution’s operating revenues plus non-
operating revenues plus its FASB component unit’s total unrestricted revenue. Threshold values
are dependent upon whether or not the institution uses a spending rate, so it is best to identify the
institution’s net operating revenue ratio target to identify its relative operating surplus. To
understand the institution’s financial situation, it will also help to identify the reasons for any
surplus or deficit, and to look at this ratio over time (pp. 127-128).
In summary, financial ratio analysis poses one or more institutional liquidity question,
then poses four more:
1. Are resources sufficient and flexible enough to support the mission? Answer this through the calculation of the Primary Reserve Ratio.
2. Are debt resources managed strategically to advance the mission? Here, analysts calculate a Viability Ratio to provide an answer to this question.

BUDGET AND FINANCIAL AUDIT ANALYSIS FOR HIGHER EDUCATION ASSOCIATION LEADERS
92
3. Do asset performance and management support the strategic direction of the institution? Here, the Return on Net Assets Ratio is calculated.
4. Do operating results indicate the institution is living within available resources? This question can be answered through the calculation of the Net Operating Revenues Ratio (Tahey, Salluzo, Prager, Mezzina, & Cowen, 2010, p. 109).
The primary reserve ratio, viability ratio, the return on net assets ratio, and the net
operating revenues ratio answer these questions. These answers should be calculated within the
institution over time to increase their utility for the analyst. While each state’s approach to
financial ratio analysis in higher education institutions may differ, the approach outlined above
will fit the needs of most analysts.
In Ohio, the state’s higher education coordinating board uses the viability, primary
reserve and net income ratios individually and collectively to form a composite score for each
public higher education institution. Based on the calculation of each ratio, scores are assigned to
a five-point scale to interpret their relative financial health. Each scale is weighted to achieve a
composite score, which is then reported annually by institution for the purpose of public
accountability (http://regents.ohio.gov/financial/campus_accountability/index.php). Regardless
of the way in which an institution or state estimates the financial health of an institution, it is
important to understand the system by which they will use comparative or ratio analysis to define
the financial condition of their institution or their state’s higher education system. The important
point for Association leaders to understand is that many higher education institutions use
comparative and ratio analysis in their strategic planning and management process. If the
institution in question does not do so, we would encourage its use in order to provide a
systematic measurement process that utilizes standardized formulas to gauge the financial health

BUDGET AND FINANCIAL AUDIT ANALYSIS FOR HIGHER EDUCATION ASSOCIATION LEADERS
93
of the institution. Where institutions practice comparative and ratio analysis, Association leaders
and members of the institution’s budget or finance committee should familiarize themselves with
the metrics utilized, the raw data, the assumptions used in their calculation, and ‘ the story’
behind the numbers.

BUDGET AND FINANCIAL AUDIT ANALYSIS FOR HIGHER EDUCATION ASSOCIATION LEADERS
94
CHAPTER 6 ANALYSIS AND PROJECTION OF INCOME Objectives After completing Chapter 6, readers will be able to:
� Identify the major sources of income for higher education institutions and differentiate their importance for public and private higher education institutions.
� Isolate the appropriate questions for an information request prior to a budget analysis.
� Construct an analysis template of revenue sources within an institution, between departments, or relative to one of four comparison groups: competitor, peer, aspirational, and jurisdictional. These groups are defined in Chapter 7.

BUDGET AND FINANCIAL AUDIT ANALYSIS FOR HIGHER EDUCATION ASSOCIATION LEADERS
95
Analysis and Projection of Income
The major sources of income for higher education institutions include tuition and fees,
appropriations (federal, state, and local), grants and contracts, gifts, endowment, and sales and
services (of such auxiliary enterprises as dormitories, bookstores and hospitals). The percentage
of total revenue by sources varies between public and private colleges and universities. These
sources are quantified for public higher education institutions in Table 7 (Knapp, Kelly-Reid, &
Ginder, 2009). Public institutions using FASB accounting principles account for a small amount
of the total revenues of all public institutions and hence are omitted from Table 7. Similarly,
Table 7 does not include private not-for-profit institutions, which also follow FASB accounting
principles. Included in the discussion are factors faculty and staff need to consider in projecting
income components into the future.
State Appropriations and Grants
State appropriations are the largest income source for most public institutions,
representing 22.7 percent of total income for four-year institutions and 30.0% of total income for
two-year institutions, but are of negligible importance to most private institutions (see Table 7).
State appropriations to public institutions of higher education are determined in many states
through a formula. Some of these states use formulas to appropriate funds, others only to review
the adequacy of funding. In states using formulas to appropriate funds, the components of the
formulas need to be examined to determine the relative impact on revenue of a variety of factors.

BUDGET AND FINANCIAL AUDIT ANALYSIS FOR HIGHER EDUCATION ASSOCIATION LEADERS
96
Table 7: Revenues of Title IV Institutions, by Level and Control of Institution, Accounting Standards Utilized, and Source of Funds: United States, FY 2007
RevenuesSource of funds Percent (in thousands) Percent
Public institutions using GASB standards
Total revenues and other sources $ 213,133,579 100.0 $ 47,747,294 100.0
Operating revenues 125,077,577 58.7 17,876,282 37.4
35,126,676 16.5 7,637,171 16.0Grants and contracts 37,908,321 17.8 7,626,341 16.0
Federal (excludes FDSL loans) 24,992,863 11.7 4,780,975 10.0State 5,335,342 2.5 2,209,723 4.6Local 7,580,116 3.6 635,642 1.3
17,967,295 8.4 1,892,608 4.0Sales and services of hospitals 20,758,904 9.7 - 0.0Independent operations 663,373 0.3 - 0.0Other operating revenues 12,653,008 5.9 720,163 1.5
Non-operating revenues 74,532,913 35.0 26,914,625 56.4
Federal appropriations 1,764,493 0.8 131,709 0.3State appropriations 48,395,487 22.7 14,302,710 30.0Local appropriations 446,923 0.2 8,653,541 18.1Nonoperating grants 2,403,244 1.1 1,977,044 4.1
Federal 1,625,932 0.8 1,280,066 2.7State 705,405 0.3 638,179 1.3Local 71,908 0.0 58,799 0.1
Gifts 4,745,220 2.2 256,212 0.5Investment income 13,412,528 6.3 984,209 2.1Other non-operating revenues 3,365,017 1.6 609,199 1.3
Total other revenues and additions 13,523,089 6.3 2,956,388 6.2
Capital appropriations 5,064,705 2.4 2,291,293 4.8Capital grants and gifts 3,161,015 1.5 350,189 0.7Additions to permanent endowments 1,016,329 0.5 23,096 0.0Other revenues and additions 4,281,040 2.0 291,809 0.6
Tuition and fees (net of allowances and discounts)
Sales and services of auxiliary enterprises after deducting discounts and allowances
4-year 2-year
Revenues(in thousands)

BUDGET AND FINANCIAL AUDIT ANALYSIS FOR HIGHER EDUCATION ASSOCIATION LEADERS
97
However, even in those states where a formula determines the overall appropriation for
an institution, the components of the formula usually do not determine how an institution spends
its appropriation. For example, if an institution receives $1,000,000 by formula for maintenance,
that exact amount need not necessarily be spent on maintenance.
The rather complex appropriations formula adopted by the Tennessee legislature some
years back for its higher education funding provides a useful example of formula funding. The
formula contained the following components:
1. Instruction and Academic Support: The formula recommends funds based upon faculty salaries and student/faculty ratios at comparable institutions. These comparable institutions are a group of ten peer institutions selected for each of four Tennessee institutional groups based upon size, program mix, and other factors. a. Average faculty salaries are computed for the peer institutions using national salary
data. The funding calculation then divides the projected student credit hour estimation by the student/faculty ratios to determine the number of instructional personnel required. This number is multiplied by the average salary factor of the predetermined peer institutions. Adjustments are then made for graduate teaching assistants, equipment, and clerical support, and to recognize enrollment fluctuations among terms.
b. A funding factor for library needs is then calculated per full-time equivalent (FTE) student. This factor varies with the type of institution.
c. Expenditures for other instructional support is then built into the formula as a percentage of the instructional expense by type of institution.
2. Maintenance and Operation of Physical Plant: The formula recognizes that the maintenance and operation of the physical plant cost 12 percent of the total institutional expenses. This charge is distributed over each square foot of education and general space, plus an additional amount per square foot constructed prior to 1960 and not renovated since then.
3. Institutional Support: The formula assumes that institutional support accounts for 12 percent of total expenditures.

BUDGET AND FINANCIAL AUDIT ANALYSIS FOR HIGHER EDUCATION ASSOCIATION LEADERS
98
4. Student Services: Expenditures for student services, including admissions and records, financial aid, student health, and athletics are assumed to be ten percent of total expenditures. The formula rate is $X per headcount student plus $Y for FTE student,
where 15 undergraduate credit hours or 12 graduate credit hours per semester constitutes one FTE student.
5. Research: The research function comprises one percent of total expenditures. Funds are
allocated based upon the institution’s historical expenditures for research and its ability to attract sponsored research funds.
6. Public Service: Each institution receives a flat amount plus one percent of instructional costs for the administration of public services.
7. College Preparatory Programs: College preparatory programs are recognized in the formula by a specific credit hour rate multiplied by the number of hours taught at each eligible institution over the past calendar year.
8. Staff Benefits: Staff benefits are analyzed in relation to previous annual expenditures. Fluctuations in benefit costs are considered in making recommendations for the subsequent year.
9. Student Aid: Requests for student aid funds are analyzed in relation to previous annual expenditures.
10. Special Allocation: Institutions may request funds for specific projects that cannot be adequately addressed through regular allocations.
11. Desegregation: Institutions may request funds for desegregation purposes that cannot be adequately addressed through other formula components.
12. Performance Funding: The formula provides a sum up to five percent of appropriations to recognize and reward efforts to evaluate and improve instruction.
13. Equipment Replacement Supplement: The formula includes an amount equal to five percent of equipment investment, to supplement equipment budgets.
14. Longevity: The formula includes an amount for longevity pay to reward state employees for each year of service beyond three years.
15. Inflation: The formula includes inflation factors for utilities, non-salary expenditures, and library acquisitions.

BUDGET AND FINANCIAL AUDIT ANALYSIS FOR HIGHER EDUCATION ASSOCIATION LEADERS
99
Note that several factors in this formula depend directly or indirectly on projections of
student enrollments. Because an anticipated decrease in student enrollment could lead to a
decrease in the funds appropriated under this formula, Tennessee “cushioned” institutions against
such a decrease in appropriations by regulations that supplemented the formula. Note also that
this formula uses the salaries paid at a predetermined set of comparable institutions to determine
the salary per faculty member (in Instruction and Academic Support, factor 1a). This approach
builds in cost-of-living increases for faculty since faculty salaries at comparable institutions
increase with inflation. Other funding formulas, however, relate this instruction and academic
support cost factor only to the salaries paid at the institution to which the formula is being
applied. Because of such wide variation in formula details from state to state, one must study
each specific formula in use in order to project the impact of enrollment and other changes on the
state appropriation for a given institution.
In many states, capital appropriations are legislatively separated from ongoing operations
appropriations. Normally, an institution’s administration submits an ordered list of requests for
such capital projects as new buildings, major renovations, and teaching or research equipment.
Then, depending upon available funds, some or none of the highest priority items may be funded
in a given year.
Calculating the precise impact of enrollment changes on an institution’s appropriation
based on overall increases or decreases in enrollments may be difficult. For example, an increase
in 80 students at the master’s level in physical sciences might justify an increased funding of ten
faculty members in the physical sciences while an increase of 80 physical science students in

BUDGET AND FINANCIAL AUDIT ANALYSIS FOR HIGHER EDUCATION ASSOCIATION LEADERS
100
freshman courses might justify an increased appropriation for only four faculty. In fact, for a
formula as sophisticated as Tennessee’s, without access to enrollment projections by
instructional level and discipline, it is probably impossible for a faculty or staff member to
calculate precisely the impact on an institution’s state appropriation of an overall increase or
decrease in FTE students.
For many states, however, appropriations are not determined by formula. In order to
project the probable state appropriation for a given institution in those states—and even in the
formula funding states—we need to have extensive knowledge of the state’s economy and its
political processes. One guideline to use in estimating the future is looking at the immediate past.
For example, if an institution has received a five percent increase in its state appropriation in
each of the past four years, it is likely to receive a five percent increase next year. But
extrapolating from past data provides no certain guide, especially at a time when the national
economy is experiencing a long-term downturn, such as started in 2008, and unemployment
remains high. State revenues will then be reduced. Unless the state enacts tax increases to
compensate, a decrease in revenues will mandate a decrease in overall state appropriations since
states are required to run balanced budgets. But the state’s economy is only half the story.
Future funding priorities of the legislature and the governor are equally important. Nationwide,
state support for higher education has fallen over the past decades. Overall state appropriations to
higher education have fallen more than 40 percent from over $10.50 per $1,000 of personal
income in the 1970s to about $6.30 per $1,000 of personal income in 2011 (Zumeta, 2012). The
decrease in this key ratio occurred in all 50 states.

BUDGET AND FINANCIAL AUDIT ANALYSIS FOR HIGHER EDUCATION ASSOCIATION LEADERS
101
Consequently, state appropriations for higher education as a share of public university
revenue have also declined. In 1977, state appropriations represented 46.5 percent of public four-
year university revenue. In 2007, Table 7 indicates that this had decreased to only 22.7 percent of
public four-year university revenue. This decline has continued: in total, higher education in the
49 reporting states saw a three-percent decrease in funding between FY 2007 and FY 2012,
which included a seven-percent decrease from FY2011 and FY2012 (Zumeta, 2012).
Furthermore, the federal government provides financial incentives to the states to
increase their funding for the Medicaid program, but not for higher education. A dollar in
Medicaid services for its residents costs the state much less than a dollar of state funds for higher
education. Hence if a state reduces spending on Medicaid it loses federal funds. By contrast,
when a state reduces its funding for higher education (resulting in higher tuition charges for
students), state residents may receive additional federal funds in the form of greater eligibility for
federal student loans and increased tax credits.
College and university administrations normally have full- or part-time lobbyists whose
duties include providing the institution’s president and governing board with up-to-date
information on future funding increase possibilities and, of course, trying to influence these
probabilities in favor of the given institution. An institution’s president often spends a significant
amount of time talking with legislators and state officials when appropriations are working their
way through the legislative process. Faculty or staff members or faculty or staff committees
normally do not have access to this information. This means that faculty and staff must either
rely on the estimates given them by their administration on state funding levels in the future, or

BUDGET AND FINANCIAL AUDIT ANALYSIS FOR HIGHER EDUCATION ASSOCIATION LEADERS
102
they must belong to a higher education organization that has its own lobbyists in the state capital.
NEA state affiliates have these resources and can assist higher education Associations with such
support. There is no substitute for inside political intelligence in projecting future state funding.
Federal Appropriations and Grants
The federal government makes certain appropriations to public and private higher
education institutions such as land grant aid, educational equity programs, and categorical
support for college libraries as well as provides substantial grant support. As Table 7 shows, the
aggregate of these appropriations for four-year public institutions amounts to 11.7 percent for
federal grants and contracts and 0.8 percent for federal appropriations of the total revenue for FY
2007 and 10.3 percent combined total for public two-year institutions.
Federal, state, and local governments award grants and contracts to colleges and
universities, usually on a competitive basis. These funds may be crucially important to
institutions with a major commitment to research and other sponsored projects. There are two
cost components to most grants and contracts: direct costs and indirect costs. Funds to cover
direct costs can only be expended for the purpose stated in the grant application. But funds to
cover indirect costs can be added to the general revenue of an institution and expended in any
manner, providing financial flexibility to the institution.
The classification of particular costs as direct or indirect depends in some cases upon how
an institution is structured to conduct research and other sponsored activities. Direct costs are
those that may be readily identified as belonging to a given project, such as salaries and benefits

BUDGET AND FINANCIAL AUDIT ANALYSIS FOR HIGHER EDUCATION ASSOCIATION LEADERS
103
of those working on the project, supplies and equipment for the project, and travel to carry out
the project. Secretarial costs and computer charges can appear as direct costs if these are charged
to the grant account for services rendered, but usually they are treated as centrally administered
services without charge-backs and thus are part of indirect costs. Typically, administrative and
purchasing support, office and laboratory space, libraries, office supplies, maintenance, and
janitorial services are treated as indirect costs.
Colleges and universities determine their indirect cost rates using guidelines prepared by
the federal government. These guidelines also provide the methodology to calculate the fringe
benefit rates to be applied to the salaries of employees working on sponsored research. The rates
are reviewed by federal auditors to determine that they are in agreement with the guidelines
prepared by the Office of Management and Budget (OMB Circular A-110, Revised 11/19/1993,
Further Amended 09/30/1999). For more information on the federal government’s methodology,
please go to http://www.whitehouse.gov/omb/circulars_a110.
Institutions normally apply the same indirect cost rates to state, local and private grants as
to federal awards. However, some private foundations have policies that do not permit any
payments for indirect costs. In these cases the indirect costs become, in essence, an institutional
contribution to the research similar to the institution’s contribution of faculty release time.
Private colleges and universities generally budget indirect cost reimbursements as
unrestricted income. Public higher education institutions in some states have to turn all such
funds over to the state. In other states these institutions may retain some or all overhead cost
reimbursement as unrestricted income.

BUDGET AND FINANCIAL AUDIT ANALYSIS FOR HIGHER EDUCATION ASSOCIATION LEADERS
104
The projection of direct and indirect cost revenues from grants and contracts involves
knowledge of who is responsible for obtaining an institution’s current grants. If several key
research-oriented faculty leave an institution, their grants will probably leave with them. Usually
the largest grants are received by medical school researchers from such sources as the National
Institutes of Health and the National Science Foundation. Grant income is sensitive to the funds
appropriated to major funding sources. For example, the National Institute of Health’s budget
can substantially affect the level of grant funding at many research-oriented higher education
institutions.
Local Appropriations
In some cases, particularly for community colleges, local governments provide direct
appropriations to an institution. As Table 7 indicates, in FY 2007 local appropriations
represented 0.2 percent of the revenues of four-year institutions and 18.1 percent of the revenues
of two-year colleges. This appropriation may be tied to the state appropriation. For example, one
state requires the county government to provide one third of the total revenue for a community
college located within its boundaries while the state provides an equal appropriation for each
such community college. Another state permits a portion of local property taxes to be levied
expressly for the benefit of its community colleges. In any case, local appropriations have
historically proven to be more variable from one year to the next than either state or federal
appropriations.

BUDGET AND FINANCIAL AUDIT ANALYSIS FOR HIGHER EDUCATION ASSOCIATION LEADERS
105
Tuition and Fees
As Table 7 indicates, tuition and fees are the second largest source of funds for public
institutions after state appropriations. In contrast, they represent the largest source of funds for
private higher education institutions. Unlike most prices, tuition represents only a portion of the
cost incurred in providing instructional services to students. Many factors are considered in
setting tuition rates, including the tuition at peer institutions, student financial aid needs, the
general state of the economy, the philosophy of the institution or the state system and, last but
not least, state legislative imperatives borne of the need to balance the state budget.
The setting of tuition rates can be critically important to the enrollment level and to the
types of students faculty find in their classrooms. Higher tuition rates generally mean that fewer
students seek admission. Furthermore, higher tuition rates dramatically reduce the availability of
higher education to students in certain economic strata. Such institutions as the Ivy League
universities may not need to be concerned when they reduce demand by substantially raising
tuition rates because they have a surplus of well-qualified applicants. But colleges and
universities with a more regional service area are much more restricted in setting tuition levels if
they wish to maintain or increase enrollment levels. In the public sector, enrollment levels may
affect an institution’s level of state appropriations, harming institutions in the short- and long-
term. Furthermore, in the public sector, an agency of the state may have to approve tuition
increases or increases may be tied to the state’s formula for higher education appropriations.
In recent years the percentage increases in tuition has been far greater than the inflation
rate. In the area of student aid, tuition level has a significant impact on expenditures. Institutions

BUDGET AND FINANCIAL AUDIT ANALYSIS FOR HIGHER EDUCATION ASSOCIATION LEADERS
106
with a strong commitment to student aid must plan to increase their own aid expenditures to
parallel the increase in tuition so as not to price themselves out of reach of a substantial number
of their traditional students. Also, an institution’s own student aid becomes more important if the
federal government is threatening to reduce its aid.
The federal government funds a number of student grant and loan programs. These
programs fund part or all of the tuition of several million students annually. Some of these
programs provide funds to the institutions, which distribute them to student applicants, and other
programs provide funds directly to the students. Some states also provide student tuition grants
or loans. A major concern in estimating future revenues is taking account of the demographics of
the region from which a given institution draws the great majority of its students.
Student Financial Aid
In 1994-95, while states provided $42.8 billion directly to higher education institutions,
student aid from all sources was about $51.8 billion. That year marked a turning point where
direct student aid exceeded direct government appropriations to higher education institutions.
Over time, student aid has continued to increase with more than half of it in the form of loans. In
fact, according to the U.S. Department of Education’s National Postsecondary Student Aid
Studies, the percent of all public and private higher education students not receiving any type of
aid has decreased from 24.5 percent in the 2003-04 school year to 20.5 percent in the 2007-08
school year (http://nces.ed.gov/surveys/npsas/) ). Adding the tax credits associated with college
enrollment increases the purchasing power of students even more. Given the political popularity
of direct student aid, this trend will likely continue.

BUDGET AND FINANCIAL AUDIT ANALYSIS FOR HIGHER EDUCATION ASSOCIATION LEADERS
107
This shift of funding directly to students means that a student attending any accredited
institution of post-secondary education is eligible for student aid. This availability of student aid
dollars in turn has attracted new post-secondary education organizations that do not operate or
educate students in the same manner as traditional colleges.
The University of Phoenix is an example of this new type of for-profit educational
organization. It uses technology (such as the Internet) to support classes taught by inexpensive
adjunct faculty. It designs and controls the curriculum centrally, most of its students are working
adults, and it does not provide the range of student services and activities of a traditional college.
Thus it is able to deliver a college-level program tailored to a specific student population at a
lower cost to the for-profit college than the cost incurred by many traditional colleges. Tuition,
however, is not lower for these for-profit colleges, which is how they earn a profit. Competition
for student tuition dollars from institutions like the University of Phoenix is bound to increase in
the future. Because education over the Internet is not limited by state boundaries, it may be
difficult to project the impact of these competitors on the future tuition revenues of traditional
public and private institutions of higher education. In addition, these competitors are most likely
to skim off the most profitable enrollments in such areas as business and education courses for
adults. This issue has been addressed by the federal government: The U.S. Senate’s Committee
on Health, Education, Labor and Pensions has conducted substantive research and held multiple
hearings on for-profit higher education and released a report in July 2012 entitled For-Profit
Higher Education: The Failure to Safeguard the Federal Investment and Ensure Student
Success.

BUDGET AND FINANCIAL AUDIT ANALYSIS FOR HIGHER EDUCATION ASSOCIATION LEADERS
108
Private Gifts, Grants, and Contracts
As already noted, private grants and contracts are usually treated like federal grants and
contracts with respect to indirect cost reimbursement. Gifts are recorded as unrestricted or
restricted. Unrestricted gifts may be spent for any purpose by an institution and hence are another
source of financial flexibility. Restricted gifts are limited by the donors to be used only for
specified purposes. However, if these purposes are high on the priority list of institutional
activities, these restricted funds may be substituted for general institutional funds, thereby
freeing the latter funds for other uses.
Increases in fundraising efforts generally take both time and money. Increased staffing
for a development office means increased investment, and that investment may take one to three
years to produce substantial increases in gift income. Since the most difficult funds to raise are
unrestricted gifts, institutions often establish a development plan that presents high-priority
institutional projects to possible contributors, thereby enhancing restricted gifts that can be used
to replace unrestricted institutional funds.
Endowment Income
The endowment income is substantial for only a small number of institutions. The
endowment income is dependent upon the types of investments made with endowment funds and
the returns on these investments. Many endowments have suffered in the stock market decline of
2008 and 2009. Hence endowment income has been negatively impacted.

BUDGET AND FINANCIAL AUDIT ANALYSIS FOR HIGHER EDUCATION ASSOCIATION LEADERS
109
Sales and Services of Educational and Auxiliary Activities
Sales and services of educational activities include non-credit workshops, testing
services, a physicians’ practice plan, and a college theater. Auxiliary activities include residence
and dining halls, intercollegiate athletics, a bookstore, a university press, a university-owned
faculty club, and university-owned parking facilities. Normally these auxiliary enterprises are
supposed to break even or show a profit. Some of them, such as intercollegiate athletics and
university presses, often run a deficit.
Hospitals
Although the overall income from hospitals tends to be concentrated within four-year
doctoral higher education institutions, those institutions that do own a hospital find that it
probably accounts for a quarter or more of total revenue. If the institution in addition has a
medical school and thus a physicians’ practice plan, these three related operations—hospital,
medical school, and physicians’ practice plan—may together account for more than 50 percent of
the entire income of the institution. In these cases the entire institution either prospers or suffers
financially depending upon the fortunes of these major operations.
Hospitals have been faced with concerted efforts by federal and state governments to
contain the rising costs of medical services. The federal government developed a set of
diagnostic related groups (DRGs) to which a given illness or treatment could be assigned. The
government then assigned a given dollar payment for each patient treated for each such DRG.
This has resulted in hospitals not being fully reimbursed for their costs in providing some health

BUDGET AND FINANCIAL AUDIT ANALYSIS FOR HIGHER EDUCATION ASSOCIATION LEADERS
110
services. The patient “mix” between Medicare, Medicaid, Blue Cross & Blue Shield, and other
private health insurance carriers is crucial to the financial viability of a hospital. Occupancy rates
and discharge rates are also critically important. A hospital typically seeks to have all of its beds
filled but at the same time wants the patient stays (for those on Medicare and Medicaid for whom
the payment will be a fixed dollar amount no matter how long they stay) to be as short as is
warranted medically. University hospitals that provide free or only partially reimbursed care for
the indigent sometimes are subsidized by the city in which the hospital is located.
In 2010, Congress passed legislation to address health insurance reform through two
pieces of legislation. The first, the Patient Protection and Affordable Care Act (PPACA)
(P.L. 111-148), was signed into law by President Obama on March 23, 2010, expanding
Medicaid eligibility, providing incentives for employers to provide health insurance, providing
certain employees and employers with support for health insurance premium payments,
prohibiting the denial of coverage for children on the basis of pre-existing conditions,
establishing health insurance exchanges and providing additional support for medical research,
among other things. A week later, President Obama signed the Health Care and Education
Affordability Reconciliation Act (HCEAR) (P.L. 111-152) into law, which made several
technical changes to PPACA, also included a rider on financial aid for college students. This
important legislation will impact the incomes of hospitals and medical schools over the next
several years, both positively and negatively. While the positive aspects of the bill for higher
education are concentrated in workforce issues, the negative aspects will vary according to
hospital productivity and quality.

BUDGET AND FINANCIAL AUDIT ANALYSIS FOR HIGHER EDUCATION ASSOCIATION LEADERS
111
Within the workforce portion of the reform effort, the federal government will increase
the number of Graduate Medical Education (GME) training positions by redistributing currently
unused slots and promoting training in outpatient settings by July 1, 2010.
Within the hospital portion of the reform effort, the federal health reform legislation will
allow the federal government to reduce annual market basket updates for inpatient and outpatient
hospital services, long-term care hospitals, inpatient rehabilitation facilities, and psychiatric
hospitals and begin adjusting payments for productivity in FY 2010. Beginning FY 2011, the
federal health reform legislation intends to cease federal payments to states for Medicaid services
related to certain hospital-acquired infections. Similarly, beginning October 1, 2012, the federal
government will reduce Medicare payments that would otherwise be made to hospitals to
account for preventable hospital readmissions. Beginning October 1, 2014, the federal
government will begin to reduce Medicare Disproportionate Share Hospital (DSH) payments
initially by 75 percent and subsequently increases payments based on the percent of the
population uninsured and the amount of uncompensated care provided. Medicaid DSH
payments to hospitals providing uncompensated care will also decrease, on the assumption that
more of the uninsured will now have health insurance. Lastly, the federal government intends to
reduce Medicare payments to certain hospitals for hospital-acquired conditions by 1 percent
beginning in FY 2015. This summary was taken from the Henry J. Kaiser Foundation’s Health
Reform Source online at http://healthreform.kff.org/, which offers readers a variety of resources
in regards to federal health reform. No matter how regulation and implementation efforts

BUDGET AND FINANCIAL AUDIT ANALYSIS FOR HIGHER EDUCATION ASSOCIATION LEADERS
112
proceed, federal health reform will have a major impact on university hospitals and medical
centers now and for some time to come.

BUDGET AND FINANCIAL AUDIT ANALYSIS FOR HIGHER EDUCATION ASSOCIATION LEADERS
113
CHAPTER 7 ANALYSIS AND PROJECTION OF EXPENDITURES
Objectives
After completing this chapter, readers will be able to:
� Identify the major sources of expenditures for higher education institutions and differentiate their importance for public and private higher institutions.
� Isolate the appropriate questions for an information request prior to a budget analysis.
� Construct an analysis template of expenditure sources within an institution, between departments, or relative to one of four comparison groups: competitor, peer, aspirational, and jurisdictional.

BUDGET AND FINANCIAL AUDIT ANALYSIS FOR HIGHER EDUCATION ASSOCIATION LEADERS
114
Analysis and Projection of Expenditures
This chapter presents and examines the major components of an institution’s
expenditures, including instruction, research, public service, academic support, student services,
institutional support, physical plant operation and maintenance, depreciation, scholarships,
auxiliary enterprises, and hospitals. Also described are the factors that Association leaders need
to consider in projecting expenditure components into the future.
Table 8 (Knapp, Kelly-Reid, & Ginder, 2009) provides an overview of the expenditures
for public higher education institutions. It can be observed that there are substantial differences
between the expenditures of public four-year and two-year institutions. The greatest difference is
that instructional costs are larger in two-year institutions, while expenditures for research and
hospital services are notably higher in four-year institutions. It may be helpful for a given
institution to record the percentage for each expenditure component over a number of years to
identify trends in expenditures.
Expenditure Components
Before considering each expenditure line in detail, we need to define a cost in terms of
the accounting basis of the financial statement being examined. As you’ ll recall, information
about cost is accumulated in accounting records and summarized periodically in the financial
reports of the institution. To understand these financial reports, we need to be aware of certain
accounting concepts that were covered in Chapter 1 and that will be expanded in this chapter.

BUDGET AND FINANCIAL AUDIT ANALYSIS FOR HIGHER EDUCATION ASSOCIATION LEADERS
115
The most important of these is determining when to recognize that a financial event has
transpired and thereby should be reported in the financial statement.
Table 8: Expenditures of Title IV Institutions, by Level and Control of Institution, Accounting Standards Utilized, and Source of Funds: United States, FY 2007
In cash basis accounting, financial events involving either the receipt or the expenditure of cash
are the only events recognized in the accounts. Under this system, expenditure accounts report
only those entries for which cash has been disbursed. Such cash-basis accounting has a major
ExpensesType of expense Percent (in thousands) Percent
Public institutions using GASB standards
Total expenses $ 188,903,134 100.0 $ 43,661,404 100.0
Operating expenses 181,465,178 96.1 42,661,404 97.7Instruction 49,011,204 25.9 16,937,833 38.8
22,643,224 12.0 18,166 0.0Public service 9,257,235 4.9 696,911 1.6
12,613,550 6.7 3,243,335 7.47,145,804 3.8 4,013,131 9.2
13,560,449 7.2 6,048,742 13.911,624,749 6.2 3,869,146 8.9
Depreciation 9,140,557 4.8 1,642,527 3.8
6,016,596 3.2 2,943,457 6.7Auxiliary enterprises 15,809,103 8.4 2,203,330 5.0Hospital services 20,335,825 10.8 - 0.0Independent operations 763,621 0.4 - 0.0Other operating expenses and deductions 3,543,224 1.9 1,044,874 2.4
Non-operating expenses 7,437,956 3.9 1,017,110 2.3Interest 3,129,141 1.7 697,384 1.6
4,308,815 2.3 319,727 0.7
4-year 2-year
Expenses(in thousands)
Other non-operating expenses and deductions
Research
Operation and maintenance of plant
Scholarships and fellowships (excluding discounts and allowances)
Academic supportStudent servicesInstitutional support

BUDGET AND FINANCIAL AUDIT ANALYSIS FOR HIGHER EDUCATION ASSOCIATION LEADERS
116
shortcoming since the institution may owe a great deal of money but simply not have paid its
bills.
Accrual-basis accounting overcomes this difficulty by recognizing financial events when
an obligation to a second party is incurred or when a claim against the second party is legally
established. At these times the financial event is recorded in the appropriate account. Many
weeks or even months may pass before the event produces a change in cash to or from the
institution. Virtually all institutions of higher education operate on accrual-basis accounting, and
expenditures are reflected when obligations to outside parties are incurred rather than when cash
is paid to these parties.
Instruction
The accurate determination of instructional costs has been a major goal of financial
analysis in higher education institutions for some time. These instructional costs can then be used
to compare different departments within a college or different colleges within a university for
cost effectiveness. In theory, different institutions can also be compared by this procedure.
There are a number of ways to perform cost analyses. The three-tiered approach involving a
five-step procedure described here was recommended by the National Association of College
and University Business Officers (NACUBO) in Cost Accounting Handbook for Colleges and
Universities (Hyatt, 1983). The approach assumes the existence of an institutional cost
accounting system that can provide a database over a period of years. Comprehensive cost
analysis assigns costs to cost centers for later attribution to cost objectives. In the instructional

BUDGET AND FINANCIAL AUDIT ANALYSIS FOR HIGHER EDUCATION ASSOCIATION LEADERS
117
area, cost centers can be defined as departments, schools, or colleges; although in principle the
term could be applied to individual faculty or even individual courses. The most frequently used
cost objectives are those listed in the “Operating Expenses” column in Table 8.
In the three-tiered approach, first tier costs are all those that are readily identifiable with a
given cost center. For the instruction portion of the budget, this includes salaries and fringe
benefits, supplies and services, travel, contractual services, and non-capital equipment. In some
institutions they also include the costs of computing support for instruction programs.
The second tier costs consist of all first tier costs plus indirect costs that are attributable to
a given cost center. Indirect costs consist of the costs of services that support instruction and may
include such costs as those for plant maintenance, computing facilities, accounting services,
libraries, and general administration. Because several competing allocation schemes are
available, administrators are more likely to be in agreement on the distribution of direct costs
than on a methodology for distributing indirect costs.
Third tier costs include all second tier charges plus a depreciation charge on facilities and
capital equipment (depreciation charges are discussed in a later section of this chapter). The
procedure for cost accounting is to (1) designate specific cost centers, (2) choose appropriate cost
categories, (3) assign all first tier costs to the selected cost centers and categories, (4) assign all
second tier and third tier costs to these selected cost centers and categories, and (5) calculate unit
costs.

BUDGET AND FINANCIAL AUDIT ANALYSIS FOR HIGHER EDUCATION ASSOCIATION LEADERS
118
The unit costs selected for instruction are usually semester credit hour (SCH) or full-time
equivalent student (FTE). These costs vary with the level of instruction provided. The cost per
SCH is lowest for lower division undergraduate courses, more for upper division undergraduate
instruction, and highest for graduate, professional, and doctoral level instruction. These costs
also vary by instructional program. Thus, in order to project future instructional costs, we need to
know the details of future student enrollments. From the estimated distributions of students by
categories, we can determine the needed number of full-time faculty by using historical
student-faculty ratios for each level of SCH. Then we multiply the number of needed faculty by
the appropriate average faculty salary to determine the overall faculty salary budget.
There are pitfalls in determining future instructional costs by this approach. One is that
we must know the future salaries of the faculty who will teach these courses, and these may
depend upon collective bargaining agreements not yet concluded or upon appropriations not yet
made by the state. Another is that we must predict the costs of fringe benefits. The cost growth in
health insurance plans (i.e., medical, pharmaceutical) has outstripped inflation for many years.
Although it is difficult to project cost increases for medical coverage years into the future, we
can predict that, as the average age of college faculty increases, the costs of medical, dental, and
life insurance benefits are going to rise substantially based upon an institution’s experience in the
use of each benefit. Thus, an analyst must gather the annual renewal development statements for
each of the university’s health insurance plans in order to estimate future costs. Some fringe
benefit costs are more easily projected. For example, Social Security payments are made at a
preset rate up to a preset maximum salary. This means that, if we know future staff salaries, we

BUDGET AND FINANCIAL AUDIT ANALYSIS FOR HIGHER EDUCATION ASSOCIATION LEADERS
119
can calculate future Social Security costs, because the existing statute gives these rates and the
maximum payments for years to come.
In analyzing instructional costs it is important for us to distinguish between average cost
and marginal cost per student. If we divide the total instructional costs by the number of FTE
students, the result is an average cost per FTE, which normally is substantially larger than the
marginal cost per FTE, that is, the cost of providing instruction to an additional student.
Most of the second tier costs are relatively fixed and do not vary with the number of
students. Even first tier costs may not vary with a small increase or decrease in students. A given
lecture course may need one instructor whether there are 25, 30, or 35 students enrolled. For
such a course an increase or decrease of five students may have no impact on the cost of
instruction. Thus the marginal cost of five more students in that one course would be zero, rather
than the average cost per FTE.
When student enrollments are increasing annually, as they do in times of economic stress,
a state appropriation formula based on average costs per student will probably provide
incremental funding that exceeds incremental costs. The institution may use these “extra” dollars
anywhere in its budget. Conversely, should enrollments fall, thereby decreasing the state
appropriation by formula, the decrease in funding is likely to exceed the decrease in incremental
costs. This may require the institution to undertake additional cost-cutting interventions. Some
states are trying to cushion public institutions against budgetary cutbacks due to small variations
in enrollments, while others are not; much depends upon the state in which the analysis occurs.

BUDGET AND FINANCIAL AUDIT ANALYSIS FOR HIGHER EDUCATION ASSOCIATION LEADERS
120
Comparisons are often made between “peer” institutions by state agencies or others on a
number of variables, including the cost per SCH or FTE student. An institution whose cost per
SCH or FTE is low may be praised by state officials for efficiency and even rewarded by
additional appropriations. Thus, knowing the factors that were used in determining the cost per
SCH is important. Were the costs only first-tier costs or were they second-tier costs? Does each
institution being compared treat the costs the same? We must determine if some institutions
treated the second-tier costs, and even the first-tier costs, differently.
An even more fundamental question is involved in comparing educational statistics
between institutions: which institutions are truly comparable? The method for determining
comparison groups is sometimes influenced by the issue(s) to be considered. Among these issues
are mission, faculty salaries and benefits, tuition rates charged, room and board charges,
student-faculty ratios, administrator-faculty ratios, class sizes, degrees awarded by field and
level, and cost per SCH. Some researchers have defined four types of comparison groups:
competitor, peer, aspirational, and jurisdictional.
A competitor group consists of institutions competing with one another for students,
faculty, and/or research. For example, suppose that an institution identifies a comparison group
solely on the basis of competition for faculty. If these institutions are compared only with respect
to faculty salaries and benefits, the comparison group may withstand scrutiny even if some of the
comparison institutions are quite different on other grounds and the comparison group
inappropriate for other purposes.

BUDGET AND FINANCIAL AUDIT ANALYSIS FOR HIGHER EDUCATION ASSOCIATION LEADERS
121
A peer group consists of institutions with similar missions and scope. We never find
exact matches, however, and it is a matter of judgment as to what constitutes a sufficient match.
An aspirational group consists of institutions that are different from the home institution
but are worthy of emulation by it. When a comparison group contains many institutions that are
clearly superior to the home institution, it is probably an aspirational comparison. Problems arise
when peer groups are confused with aspirational groups, particularly if the confusion is noted by
individuals in the political arena outside of the institution since it raises serious credibility
questions concerning any comparisons that are made.
A jurisdictional group consists of institutions belonging to the same political or legal
jurisdiction, normally a state. The reason for this grouping is obvious: state officials want to
compare the institutions (particularly in the public domain) that are being supported with public
funds. Whether or not the comparisons are valid depends upon the issue(s) being compared.
Institutional classifications established to facilitate national reporting represent another
basis for comparing colleges and universities. Among the classifications that are used are those
of the National Center for Education Statistics, the National Education Association Almanac
(reporting faculty compensation), the National Center for Higher Education Management
Systems, and the Carnegie Commission on Higher Education.
The importance of selecting the proper comparison group for a given issue cannot be
overemphasized because the institutions selected may well predetermine the outcome of the
comparison. For example, in the collective bargaining arena the faculty representative may

BUDGET AND FINANCIAL AUDIT ANALYSIS FOR HIGHER EDUCATION ASSOCIATION LEADERS
122
demonstrate, based on the faculty-selected comparison group, that the faculty are underpaid,
while the administration’s negotiating team may show that, from the comparison group it has
selected, the faculty are overpaid. In some cases, arbitrators or even the courts have had to select
comparable institutions for faculty compensation issues.
A major issue in the comparison of instructional costs between institutions is the use of
part-time faculty. They are generally paid less per course than full-time faculty and enjoy fewer
fringe benefits. Consequently, two institutions with markedly different fractions of teaching
conducted by part-timers are likely to have markedly different unit instruction costs. Chapter 8
examines the use of part-time faculty in more detail.
Research
Research includes all activities organized specifically to produce a research outcome.
Comparing the amount of indirect costs assigned as revenue to the unrestricted fund with the
amount of expenditures from that fund for research may be informative. Some expenditure of
restricted research funds can substitute for unrestricted fund expenditures. For example, a grant
may pay part or all of the academic year salary of a faculty or staff member.
Public Service
Public service includes all activities conducted primarily to provide non-instructional
services for individuals and groups external to the institution. These activities include workshops

BUDGET AND FINANCIAL AUDIT ANALYSIS FOR HIGHER EDUCATION ASSOCIATION LEADERS
123
and seminars, free legal service from a law school, community recreation services, and
broadcasting services.
Academic Support
Academic support includes all institutional operations that provide support services to the
basic missions of teaching, research, and public service. In most institutions the library system is
part of this component instead of being treated separately. Among expenditures in this area are
those for academic administration, academic computer operations, audiovisual services, course
and curriculum development, and personnel development.
Student Services
Student services include all institutional operations that enhance students’ intellectual,
cultural, emotional, and physical well-being outside the classroom. Among these are academic
advising, career counseling, student admissions, student records, financial aid, student health
services, and some student activities. Other student activities, such as intercollegiate athletics, are
normally treated as auxiliary enterprises and are discussed under that section.
Institutional Support
Institutional support includes all institutional operations that provide support for
day-to-day operations, excluding physical plant operations and maintenance. Encompassed are
the fiscal departments of the institution (such as the comptroller’s office and accounts payable),
the purchasing department, the executive officers of the institution and their office staffs, public

BUDGET AND FINANCIAL AUDIT ANALYSIS FOR HIGHER EDUCATION ASSOCIATION LEADERS
124
relations, the development office, and institutional charges such as liability insurance. At many
schools the administrative staffs have grown relative to the size of the faculty. One reason for
this growth in nonteaching professionals is the growth in counseling, financial aid, and other
student support programs. Examining the size of the administration at a given institution over a
number of years can prove informative, although this is often difficult to accomplish because
college administrative staffs may have their compensation reported, at least in part, under the
instructional, research, or public service categories. This examination may show how staff work
has migrated or changed over time as well as how much teaching the “non-instructional” staff
are actually doing.
Plant Operation and Maintenance
Plant operation and maintenance include all institutional operations involving the
physical plant, except for those expenses allocated to auxiliary enterprises or to a
university-owned hospital. Among these are custodial service, repairs and maintenance, property
insurance, rents paid, utilities, and debt service. This expenditure is most likely to involve many
other funds (generally referred to as physical plant funds) in addition to costs listed under the
current fund. There are usually interfund transfers for physical plant expenditures, including debt
service.
Expenditures for utilities are sometimes difficult to predict exactly since the weather (a
very cold winter or very hot summer) can substantially alter them from an average value for prior
years. The opening of any new building always increases overall institutional utility costs (unless

BUDGET AND FINANCIAL AUDIT ANALYSIS FOR HIGHER EDUCATION ASSOCIATION LEADERS
125
an older, less energy efficient building is closed). In addition, the market price and availability of
oil and other sources of energy can dramatically affect utility costs.
Scholarships and Fellowships
Scholarships and fellowships normally include only the institutional funds that are
expended for scholarship aid and for trainee stipends at both the undergraduate and graduate
levels. Under GASB 35, the reported income from tuition and fees is reduced for scholarship
allowances rather than reporting these as scholarship expenditures. Federal or state scholarship
funds that are distributed by an institution are usually placed in a restricted fund and disbursed
directly from that fund to the students (or to the institution’s current fund in the form of tuition
income).
Auxiliary Enterprises
Auxiliary enterprises are entities that furnish services directly to faculty, staff, and
students, and that receive fees for these services. Such services may include parking, dining
facilities, dormitories, student stores, a university press, and intercollegiate athletics. Physical
plant charges are normally assigned to each auxiliary enterprise. The goal is generally to have
each auxiliary activity at least break even financially, but this does not always happen. Funds
assigned to auxiliary enterprises sometime act as discretionary funds for the administration.
Perhaps the auxiliary enterprise that has attracted more faculty attention than any other is
intercollegiate athletics. Football and basketball coaches are often paid more than an institution’s

BUDGET AND FINANCIAL AUDIT ANALYSIS FOR HIGHER EDUCATION ASSOCIATION LEADERS
126
president. Millions are sometimes spent on sports stadiums that are used only a small fraction of
the year, and star coaches and athletes often get far more of the publicity generated about an
institution than do its best faculty. Among justifications offered for large athletic expenditures
are that (1) athletics make money for the institution, (2) athletics generate a great deal of
publicity about an institution which in turn attracts students, and (3) athletics attract donors to the
institution. Let us examine each of these points in turn.
Research published by the National College Athletic Association found that only one
percent of the reporting institutions listed the financial goal of their athletic program as earning
money to support the rest of the institution (Raiborn, 1986). Thus few institutions receive net
income from athletics. Also, when an institution does make money on a sports program, the
tendency is to expend the profits on more sports. The rest of the university, on the other hand,
underwrites losses.
The claim that the fame of a successful sports program attracts more students, from a
wider geographic area, is probably true but difficult to quantify. A student may select an
institution for many reasons, only one of which is its having a successful sports program. Even
student surveys are not likely to provide conclusive proof for the claim or to provide any
quantitative data to compare with the subsidy that the athletic program may require. The
assertion that a successful sports program attracts more donors is also probably true, but these
donors, interested in sports, will probably earmark their contributions solely for the sports
programs.

BUDGET AND FINANCIAL AUDIT ANALYSIS FOR HIGHER EDUCATION ASSOCIATION LEADERS
127
In conclusion, it is important to note that many institutions charge students an “activity
fee” or “athletic fee,” which is then assigned as income mainly to intercollegiate athletics. In
essence, this “ income” reduces what would otherwise be a larger deficit for the athletic
operations. Put another way, if there were no separate athletic fees even more athletic programs
would need a subsidy from tuition or other institutional funds.
Hospitals
As indicated in Chapter 5, university hospitals are hard pressed to break even. There are
often conflicts in assigning costs between a hospital and a related medical school and one or
more physicians’ practice plans. Note that an examination of the costs of a hospital discloses the
existence of a cost, depreciation, which is able to be passed on to third-party payers as a part of
the daily room charge. Consequently, a hospital may record many millions of dollars per year of
depreciation on its physical plant and equipment but be reimbursed for all of this cost. This is a
different cost from others in that dollars for depreciation, unlike dollars budgeted for salaries, are
not necessarily spent by the institution in the budget year in which they are received. Rather, they
can be set aside to replace equipment and buildings, or even be used for other purposes (although
there may be constraints placed on the use of these funds by, for example, the federal or state
government).
Finding These Components in the Budget
In examining the current fund budget of your institution, you may not find some of the
components or categories listed in this Handbook. Normally there will be a summary budget

BUDGET AND FINANCIAL AUDIT ANALYSIS FOR HIGHER EDUCATION ASSOCIATION LEADERS
128
page with expenses listed by categories nearly identical to those in Table 8. The pages of
budgetary detail following the summary page may be arranged, for example, by institutional
officer. A provost or vice president for academic affairs might supervise units that contribute to
teaching, research, public service, and academic support. A college or university’s budget may
simply state an overall budget and not break it down by the expense categories in Table 8. If you
are serving on a budget committee, you may wish to ask for the individual budget components
that contributed to the overall expenditure categories in Table 8. Requesting that each college’s
or even each department’s budget be broken down into its individual cost components will allow
you to identify the fraction of a college budget that is allocated to teaching or research, for
example, and then to compare this to the fraction at other “comparable” colleges, either internal
or external to the university. This comparison can provide objective data to assess the
commitment to teaching or research of your institution.
Depreciation
Not-for-profit organizations must recognize the cost of using up the future economic
benefits or service potentials of their long lived tangible assets (depreciation) and must disclose
the following:
1. Depreciation expense for the period.
2. Balances of major classes of depreciable assets, by nature or function, at the balance sheet date.
3. Accumulated depreciation, either by major classes of depreciable assets or in total, at
the balance sheet date.

BUDGET AND FINANCIAL AUDIT ANALYSIS FOR HIGHER EDUCATION ASSOCIATION LEADERS
129
4. A general description of the method or methods used in computing depreciation for major classes of depreciable assets.
Under FASB 117 and GASB 35, depreciation is treated as a current expense. What
impact does this have on an institution operating under these standards? Consider, for example,
the present dilemma facing many institutions of not having the funds to replace antiquated
buildings and equipment. How did this situation come about? For years administrators did not set
aside adequate funds for renovations and replacements. Legislatures did not approve funds for
these purposes because they were not embedded in the budget. Put another way, if a legislator or
trustee saw that a given institution was operating with a balanced budget, what was there to
worry about? Few of them realized that the balanced budget was misleading because it did not
take depreciation into account. In that sense, the budget system itself may have contributed to the
outcome of antiquated physical plants with inadequate reserves to replace them.
The impact of depreciation may therefore be to demonstrate to all that institutions do not
have balanced budgets unless they have set aside funds for depreciation. This in turn may either
be a financial blessing or a disaster. If, for example, a legislature appropriates additional funds to
an institution to cover the cost of depreciation, many institutions, for the first time, will have
adequate funds to modernize their facilities. But if the state orders administrators to set aside part
of their current appropriations for this purpose without augmenting these funds, institutions may
be left with no way of balancing their budgets except by resorting to measures usually associated
with a fiscal crisis.

BUDGET AND FINANCIAL AUDIT ANALYSIS FOR HIGHER EDUCATION ASSOCIATION LEADERS
130
Budget Controls
The institution’s budget sets allocations for each budget unit or cost center. Adequate
controls are needed to ensure that expenditures do not exceed allocations. Usually one or more
institutional budget offices are given the responsibility to monitor the expenditures of each unit
and to bring overspending of budgets to the attention of the appropriate institutional officials. In
addition, it is the primary responsibility of each budget unit head to monitor that unit’s budget.
“Position control” is sometimes a part of budget controls. In some institutions,
departments are able to use the funds budgeted for unfilled positions for other purposes. In other
institutions, any vacant position has its funds withdrawn immediately from the department. At
state-supported institutions, the savings from vacant positions may revert to the state.
Institutions normally use budget reports as a way of implementing budgetary controls.
These budget reports are normally made at least monthly and compare budgeted amounts to
those actually spent by each budget unit during the preceding month and cumulatively from the
beginning of the current budget year. Comparisons to the prior year are also sometimes included.
Modern computerized budget systems allow budget heads to see the status of their budgets on
the computer screen as of a given moment in time. They instantly reflect the cost of any purchase
order. If these systems are tied into payroll, a budget unit head may no longer be able to hire
someone without the prior approval of superiors because the financial system will not permit the
printing of a payroll check for the individual. In short, these computerized systems provide
stronger central control over all budgets.

BUDGET AND FINANCIAL AUDIT ANALYSIS FOR HIGHER EDUCATION ASSOCIATION LEADERS
131
Budget revisions often occur during a budget cycle. The changes are caused either by
changes in income from the amounts budgeted or changes in expenditures. Small changes can
usually be accommodated without revising the budget. Many institutions have a contingency
expenditure line included in the budget, and unforeseen expenses can be paid from this line
without requiring the modification of other budget lines. Similarly, if the shortfall in revenue is
small, this line can be used to make up for the revenue shortfall by simply not spending part or
all of the funds assigned to “contingency.” Sometimes the unforeseen expenditures and/or
revenue shortfall are too large to be paid for by this line, and in that case many parts of the
institution’s budget may have to be modified. Budget reductions made in the middle of an
academic year may be particularly painful since much of the institution’s costs may be set for the
year. This matter is discussed further in the next chapter on constraints in the budget.

BUDGET AND FINANCIAL AUDIT ANALYSIS FOR HIGHER EDUCATION ASSOCIATION LEADERS
132
CHAPTER 8 CONSTRAINTS AND FLEXIBILITY IN THE BUDGET: FISCAL CRISES Objectives After completing this chapter, readers will be able to:
� Define sources of constraint and flexibility in higher education institutional finances.
� Predict the behavioral responses of management to short- and long-term institutional changes which require reallocation of resources.
� Determine Association planning requirements to meet institutional changes in the short-and long-term.
� Implement an Association budget committee capable of reviewing and predicting institutional revenue and enrollment levels.

BUDGET AND FINANCIAL AUDIT ANALYSIS FOR HIGHER EDUCATION ASSOCIATION LEADERS
133
Constraints and Flexibility in the Budget: Fiscal Crises
This chapter examines the constraints and flexibility that exist in typical college and
university budgets. This tension between constraint and flexibility is important in several
situations. Under normal operations, shifting the allocation of funds from one budget unit to
another within an institution is often necessary. For example, enrollments may increase in
engineering, requiring the addition of further funds for engineering faculty and laboratories in
order to satisfy student demands. Or the establishment of a many-times-delayed new computer
laboratory finally becomes unavoidable. In such cases the institution must seek a source of funds
to meet these new needs. If external funding sources, such as the state legislature, could be
depended upon to fund each of these increased needs with additional revenue, the entire issue of
budgetary flexibility would be of little importance. Since this is not likely to be the case, an
analysis of sources of funds for new initiatives becomes imperative.
For institutions with unionized faculty, collective bargaining negotiations involve the
search for funds that may be used for faculty salaries and benefits. Constraints that prevent the
shifting of funds for these uses clearly have a negative impact on the outcome of negotiations
from the point of view of the faculty.
Midyear budget corrections, as indicated in the preceding chapter, may be needed
because of unforeseen decreases in revenue (caused, for example, by an unexpected drop in
enrollment) or to make unforeseen expenditures (caused, for example, by an unanticipated
increase in utility rates or storm damage to buildings). Whatever the cause, administrators are
BUDGET AND FINANCIAL AUDIT ANALYSIS FOR HIGHER EDUCATION ASSOCIATION LEADERS
134
sometimes faced with the need to identify funds that can be moved into the needed category.
Even more drastic needs for budgetary flexibility occur in fiscal crises.
Personnel Costs
Personnel costs for all employees at a college or university (including fringe benefits)
typically constitute 60 to 80 percent of the institution’s budget. When a fiscal crisis occurs, major
personnel cuts may thus become unavoidable unless other funds can be shifted to meet crisis
needs.
Collective Bargaining, Personnel Policies, State Regulations
Personnel costs are constrained by many factors, including collective bargaining
agreements, internal personnel policies, market factors, and state regulations. Salaries and
benefits are specified for covered employees by most collective bargaining agreements for the
duration of the contract. Salary increases are usually specified by a percentage of the prior year’s
salary or by a dollar amount, although future salary increases are sometimes dependent on such
factors as inflation, student enrollment, and/or state appropriations. Thus an institution that is
unionized can precisely project salary costs into the future, provided that it can project the
number and type of employees needed each year. Similarly, reasonable budget makers know that
it is highly unlikely that labor representatives will negotiate away benefits that are currently
enjoyed. Thus the present level of benefits and their future costs provides a constraint in future
budget projections.

BUDGET AND FINANCIAL AUDIT ANALYSIS FOR HIGHER EDUCATION ASSOCIATION LEADERS
135
Most faculty collective bargaining agreements also specify workload and overload. These
clauses prevent an administration from increasing the workload, and decreasing the number of
faculty (and hence the overall cost of salaries and benefits), to meet a fiscal crisis. In fact, some
agreements specify a maximum ratio of FTE students to full-time faculty. In those cases, the
administration must hire additional faculty to meet increased enrollments.
Finally, most collective bargaining agreements contain termination clauses that specify
the ‘due notice’ and/or severance pay required in order to terminate employees. The last
employees to be terminated, and those that receive the longest ‘due notice’ or the largest
severance settlements, are usually tenured faculty. Unfortunately, some institutions have
attempted to limit the number or percentage of tenured faculty on their staffs in order to maintain
a degree of personnel flexibility. Some have established tenure quotas by department or by
college, so that for a department at its tenure quota limit, no new faculty member is granted
tenure until a presently tenured faculty member leaves that department through retirement or
resignation.
For tenured faculty, due notice requirements for retrenchment are often specified in
internal personnel policies as well as in collective bargaining agreements. Similarly for non-
tenured, full-time faculty, termination notice provisions are normally included either in a
collective bargaining agreement or in the institution’s own personnel regulations. Since most
full-time non-tenured faculty are appointed for one to three year periods, an alternative to

BUDGET AND FINANCIAL AUDIT ANALYSIS FOR HIGHER EDUCATION ASSOCIATION LEADERS
136
terminating such faculty during the course of their contracts is not to reappoint them at the
completion of their contracts.
State regulations constitute yet another level of constraints in personnel matters in those
states that have adopted “position control” of faculty and staff lines. This means that a vacant
employee position results in the funding for the position reverting to the state rather than being
available for use elsewhere in the institution. An administration may also be constrained from
hiring additional regular full-time staff even when enrollments increase, and in such cases the
institution may have no alternative but to hire part-time or temporary faculty or to increase class
size to meet increased enrollments.
Some states have introduced a budgetary device called “salary savings,” based on the fact
that an institution never has all its budgeted positions filled all the time. When an employee
leaves his or her position, some time may elapse before it is filled. Historically, the savings have
amounted to about two to four percent of the salary and benefits budget of an institution. In the
past, most states have collected whatever salary monies were unspent at the end of each fiscal
year. Under salary savings methodology, each institution is assigned a target for these savings at
the beginning of the fiscal year. These targets are thus constraints on the expenditure of salary
and benefit dollars.
But even though the salary savings budgetary device contains constraints, it also points to
an area of flexibility and gives a clear indication that the best way to achieve any necessary
reductions in personnel costs is by not filling vacancies. The termination cost of eliminating a

BUDGET AND FINANCIAL AUDIT ANALYSIS FOR HIGHER EDUCATION ASSOCIATION LEADERS
137
vacant position is zero. The cost of arbitration or litigation over the elimination of a vacant
position is also zero. Moreover, no personnel need be terminated. Thus, from both fiscal and
humanitarian perspectives, the use of unfilled positions to meet budgetary problems is to be
preferred. However, as described later in this chapter, not filling vacant positions may be
sufficient to meet a fiscal crisis only when the institution has a relatively long time period in
which to decrease its personnel budget by natural attrition.
Part-time and Temporary Faculty
Administrators often put forward the following four arguments to justify the use of
contingent, i.e., part-time and temporary, faculty in colleges and universities. The first argument
is that contingent faculty members provide flexibility for the institution. Since most contingent
faculty are appointed to teach a given course for a given term or two, they can simply not be
reappointed if enrollments fall. Severance pay is usually nonexistent for them. The second
argument is that part-time faculty members represent a source of expertise that may not be
present among the full-time faculty and may not be needed frequently enough to justify hiring a
full-time faculty member with such expertise. Third, part-time or temporary faculty may allow
an institution to experiment with a new course or curriculum offering, at little financial risk to
the institution. The fourth argument is that contingent faculty members are less expensive than
full-time faculty. In other words, if six courses per year constitute the load of a full-time faculty
member at an institution, these six courses could be taught less expensively by six part-time
faculty members, each hired to teach one course, than by one full-time faculty member.

BUDGET AND FINANCIAL AUDIT ANALYSIS FOR HIGHER EDUCATION ASSOCIATION LEADERS
138
Furthermore, the fringe benefits given to part-time faculty are usually substantially less than
those of full-time instructors.
Nevertheless, there are many arguments against the excessive use of part-time faculty.
They often teach at more than one institution and therefore may not be able to have the kind of
institutional commitment of full-time faculty. They may be less available for advising students.
They may not have the time for course and curriculum development. However, despite these and
other arguments against using an excessive number of part-time faculty, their presence is strong.
According to the Digest of Education Statistics, 2011, in the fall of 2009 the percent of full-time
faculty in public four-year institutions was 68 percent; in public two-year institutions, it was 32
percent7 (U.S. Department of Education, 2011). As Benjamin (2002) points out, however,
significant variation at both types of institutions exists in the percent of part-time faculty by
discipline.
To counter this trend, the percentage of full-time faculty at an institution or the number of
credit hours taught by full-time faculty should be tracked at each higher education institution in a
state. This metric is recommended as a ‘ top 10’ strategic indicator for improving performance in
higher education systems (Taylor, 1993). In fact, the tacit assumption is that the vast majority of
faculty at any higher education institution provides the foundation for the components of the
third criterion (i.e., ‘student learning and effective teaching’ ) of the Higher Learning
Commission’s Handbook of Accreditation (Higher Learning Commission, 2003).
7At the same time, full-time nonprofessional staff in public four-year institutions was 86 percent; in public two-year institutions it was 66 percent (U.S. Department of Education, 2011).

BUDGET AND FINANCIAL AUDIT ANALYSIS FOR HIGHER EDUCATION ASSOCIATION LEADERS
139
Several studies have examined the extent to which a significant reliance on contingent
faculty adversely impacts a variety of student learning and institutional quality measures (see, for
example, Jacoby, 2006; Benjamin, 2003; Ehrenberg & Zhang, 2004; Harrington & Schibik,
2001; and Umbach, 2007). The overall picture that emerges is that greater use of part-time
faculty by higher education institutions is associated with less effective interactions with
students, lower curricular cohesion, lower instructional quality, lower student learning, and
lowers rates of student persistence.
Rank Reduction
Another area of flexibility—and a variation on eliminating positions completely in order
to meet budgetary goals—is replacing faculty who are leaving the institution with lower ranked
faculty. For example, if a professor making $100,000 a year retires, the replacement could be an
assistant professor making $45,000 a year. Similarly, an experienced administrative assistant
who leaves a department could be replaced with an entry level assistant at a lower rate of pay.
Note, however, that although it may be perfectly reasonable to make both of these decisions in
some cases, applying this policy systematically can lead to a serious distortion of departmental
faculty experience and expertise and of academic support services.
Non-personnel Costs
Many constraints are placed on the expenditure of non-personnel dollars. For example, if
an institution has a three-year service contract with a security firm to provide 50 guards per year,
it has to take those 50 guards per year even if administrators want to cut the security force to 40

BUDGET AND FINANCIAL AUDIT ANALYSIS FOR HIGHER EDUCATION ASSOCIATION LEADERS
140
guards so that reductions will not have to be made elsewhere. Long-term rental leases also have to
be honored, even if the institution no longer needs the space (although an institution should
clearly include a clause in any such agreement permitting it to sublet the property). In addition,
payments must be made on outstanding institutional bonds or mortgages. Remember that issuing
bonds in order to build facilities means that an institution must budget not only to maintain the
facilities but also to repay the bonds.
Rate increases produce constraints and spur searches for flexibility. If the telephone
company raises its local and long distance rates, for example, telephone charges could rise
significantly, as could the cost of Internet access. Institutions need to explore whether having
their own internal telephone system rather than using one provided by a telephone company
would make cost savings available. The cost of copiers could increase dramatically, due to
increased usage or to increased rates paid for rental machines. The only way to contain these costs
may be to restrict the use of the copiers. Most importantly, an institution is also subject to the
effect of increases in the rates charged it by public utilities. If the rate charged for electricity
increases by ten percent in a given year, the institution may have no choice except to pay the
higher bill.
There have been dramatic increases in the prices for books and periodicals over the past
decade, constraining library purchases. Further steep increases have to be anticipated. The only
response possible for some institutions will be to reduce purchases of these materials and seek
less costly online access to them.

BUDGET AND FINANCIAL AUDIT ANALYSIS FOR HIGHER EDUCATION ASSOCIATION LEADERS
141
Inventories of academic and laboratory supplies may be increased or decreased,
depending upon circumstances. An institution may wish to increase its supplies of stationery
items if it knows that a large price increase for them is imminent. Conversely, it may wish to
decrease certain categories of laboratory supplies in order to invest the funds tied up in inventory
in revenue producing securities.
Purchasing, however, is often constrained by state agencies for public institutions. State
regulations may mandate advertising bids for any purchase or service contract over a specified
amount. This may present no difficulty in some cases, but in others it may prevent cost savings
that could be achieved by simultaneously negotiating a number of service contracts with a given
vendor.
Travel represents one cost that is normally easy for an institution to control. As travel
costs escalate dramatically due to the price of airline fuel skyrocketing, less travel is supported
by an institution; and certainly in a fiscal crisis, travel expenditures will be drastically reduced.
Gifts/Endowments
Gifts may be restricted or unrestricted. Unrestricted gifts provide maximum fiscal
flexibility and can be expended for any institutional purpose. Restricted gifts can be expended
for only specified purposes in a given fiscal year or can enhance the institution’s endowment, the
income of which can only be expended for the purposes of the endowment.
BUDGET AND FINANCIAL AUDIT ANALYSIS FOR HIGHER EDUCATION ASSOCIATION LEADERS
142
However, in some cases even restricted funds or endowment income can substitute for
unrestricted current funds. For example, if an endowment funds a faculty chair, the salary and
benefits for that faculty member are paid out of earnings from the endowment, thereby relieving
the current fund budget of that expense. Whether or not these funds can be used elsewhere in the
public sector normally depends on the level of flexibility permitted the institution by the state.
Grants and Contracts
External grants and contracts have two revenue components. One pays the direct costs
associated with the projects for which the grants or contracts were received. As in the case of
gifts, restricted grant funds can in some cases replace unrestricted current funds. The unrestricted
revenue component comes from the indirect costs that are paid by outside agencies on many
grants and contracts and that may be used by an institution for any purpose. Once again, the only
constraints on the use of these funds are state regulations, which might require that they be
turned over to the state treasury.
Research Institutes and Foundations
In order to avoid many of the constraints on the use of grants, contracts, and gifts, some
institutions that receive substantial amounts of such types of external funding have established
legally separate research institutes or foundations. The research institute receives the grant or gift
and performs the research. It can always retain the indirect cost part of the grant, and its finances
are normally not under the supervision of the state. Purchases of research equipment may be
made from the indirect costs received by the research institute rather than from university funds.

BUDGET AND FINANCIAL AUDIT ANALYSIS FOR HIGHER EDUCATION ASSOCIATION LEADERS
143
Salaries and benefits for university personnel working on the research projects are partially or
fully paid by the research institute. These private sector entities do not have the same reporting
and disclosure requirement as public entities. Therefore, accessing budgets and financial
documents can be difficult if not impossible. Conversion of such entities from part of a public
college or university to a private spin-off can mean that employees lose their public sector
employer and coverage under the collective bargaining agreement.
Accumulated Reserves
If an institution has reserves that can be expended for any purpose, budgeting becomes
easier. Many institutions budget a contingency line and use it to meet unforeseen financial
difficulties or to take advantage of unexpected opportunities. The amount budgeted for
contingency is usually small, on the order of one percent or so of an institution’s budget. By the
end of the year these funds have either been transferred to operating budgets or into institutional
reserves.
The term quasi-endowment is often used to describe accumulated past surpluses of an
institution, that is, unrestricted revenues that exceeded unrestricted expenditures. Unlike a true
endowment, quasi-endowment funds may be expended for any purpose by the governing board.
An institution with a substantial quasi-endowment has little difficulty in meeting an unexpected
fiscal problem since it can always transfer funds from its quasi-endowment into its operating
budget to meet the problem. However, in the public sector many states take back unexpended
funds from an institution, making it impossible for the institution to establish a

BUDGET AND FINANCIAL AUDIT ANALYSIS FOR HIGHER EDUCATION ASSOCIATION LEADERS
144
quasi-endowment. As can be expected, such institutions often spend budgeted funds heavily near
the end of a fiscal year. There is little incentive for them to return funds to the state.
Block Appropriations
It is clearly in the interest of institutions to receive their entire state appropriation as a
block award, which can be expended for any purpose. Just as clearly, this is not likely to happen
for all institutions in the foreseeable future. However, continuing efforts should be made to
obtain at least some portion of the state appropriation as a block grant. In addition, efforts should
be made to allow institutions to retain some portion of unspent current revenues. For public
institutions, these two budgetary changes might go a long way in reducing fiscal crises, to be
discussed next.
Fiscal Crises
Probably nothing short of loss of accreditation is as traumatic for the educational
community as a serious financial crisis. Such crises tend to result in adversarial stances between
faculty and/or staff and administrators (with students often caught between the two sides) and
even among faculty or staff themselves. Employees may find themselves threatened in three
ways. First, their salary increases may not keep pace with inflation. Second, their workloads may
be increased. Finally, they may find themselves or their colleagues replaced by part-time faculty
or temporary staff. Consequently, recognizing the difference between a normal reallocation of
resources and a true fiscal crisis is imperative. It is also helpful to be able to measure the severity

BUDGET AND FINANCIAL AUDIT ANALYSIS FOR HIGHER EDUCATION ASSOCIATION LEADERS
145
of a fiscal crisis and to suggest alternative courses of action for dealing with it than the reactions
illustrated above.
Reallocation of Resources
The first factor to consider if an institution declares a fiscal crisis is whether the situation
is a real crisis or merely the consequences of short-term scarcity. Frequently budgetary crises are
confused with ongoing needs to reallocate scant resources. For example, student enrollment
patterns may change so that one department or college has too few students for the size of its
faculty while another department or college has too many students for its faculty to service. The
need to add new faculty to the over enrolled department or college is obvious. But where will the
funds come from to pay for these new faculty?
Distinguishing a normal reallocation problem from a fiscal crisis is relatively easy. Note
first, however, that normal reallocation problems that are ignored can eventually lead to a true
fiscal crisis. Thus, recognizing and solving reallocation problems before they become severe is
important. In a normal reallocation case, the overall institutional income is not predicted to
decrease in subsequent years. Instead, overall institutional resources will probably be projected
to increase at a rate about equal to that of inflation. Similarly, overall enrollments will be level or
perhaps even projected to increase slightly. The institution may assert that inflation (including
salary and benefit increases) will use up all of its projected increase in income and, thus, it will
not be in a position to support any overall increase in staff. It may assert that, for additional

BUDGET AND FINANCIAL AUDIT ANALYSIS FOR HIGHER EDUCATION ASSOCIATION LEADERS
146
faculty to be hired in one area, the number of faculty need to be reduced in another area. Let us
consider these assertions further.
As stated earlier, personnel account for 60 to 80 percent of the expenditures of a higher
education institution, but there is substantial flexibility in personnel costs if there is sufficient
time in which to implement changes. Remember that normal reallocations rarely require sudden
massive shifts in resources. Since most such reallocations will be driven by changing enrollment
patterns, and these patterns change gradually with time, institutions will have several years to
cope with the problem, providing that action is initiated early enough. In order for this to occur,
however, the institution needs to have in place a regular schedule of program review. But in
order for a review to be effective, an institution must have adopted an orderly planning process
involving several components.
First, the institution needs to have a detailed mission statement against which to judge its
programs. Second, an institution must have detailed personnel procedures that cover such matters
as termination of service, length of appointments, and early retirement plans. In institutions
covered by collective bargaining, the contract probably includes these items. Third, the
institution needs to have a set of planning principles, which should include the collection of
appropriate data on which to make revenue and enrollment projections. Finally, the institution
needs to have a list of principles and procedures for reviewing programs.
These program reviews could lead to a decision to reduce or even eliminate a program.
However, there are many personnel actions that can greatly mitigate the adverse effect of these

BUDGET AND FINANCIAL AUDIT ANALYSIS FOR HIGHER EDUCATION ASSOCIATION LEADERS
147
decisions on faculty and staff. The magnitude of the impact of these actions depends upon the
time period over which the staffing changes must be accomplished and on provisions in the
relevant collective bargaining agreements. Possible actions to consider include the following:
� Not replacing any faculty or staff members who leave the departments that are experiencing serious declines in enrollment. This seems obvious, but its application could present some problems for departments that an administration wishes to reduce in size but not eliminate completely. The best faculty members in a department tend to be the most mobile and hence the most likely to obtain a position at another institution. If, for example, all of the senior faculty in the department were to leave, continuing an effective program without hiring any replacements might be difficult. Also, a faculty member with a sub-specialty that is crucial to the program may need to be replaced. Likewise, leaving key administrative positions empty could compromise important departmental or program functioning, e.g., the timely submission of grant applications and funding reports.
� Limiting contracts for part-time or temporary contract faculty. These contracts are generally where the institution has the most flexibility. However, the dollar reduction per faculty line reduction will be less for part-time faculty and staff as their salary and benefits are less than tenured or permanent faculty and staff.
� Transferring personnel to other appropriate departments or programs, such as tenured faculty to suitable teaching positions in other programs. Institutions should be willing to retrain faculty for duties in alternative programs, including subsidizing formal graduate study by them. Some institutions have interdisciplinary programs that are staffed by faculty from many departments. These programs may be able to utilize faculty or research and administrative or other staff from overstaffed departments with little retraining.
� Establishing early retirement incentive plans. Under such programs, faculty and staff who satisfy specified age and service requirements are able to retire early. The forms of these plans vary considerably. Some institutions offer to contribute additional funds to private or state retirement plans so that the retiree will not lose out on contributions made. A plan reviewed by the lead author involved paying one-third of a faculty member’s academic year salary and most fringe benefits for up to seven years or until the retiree reached age 67, whichever came first. The advantage of such a plan, which paid one third of a salary for a given period of time, is that the institution experiences an immediate reduction in its payroll on the day the faculty member retires- namely two-thirds of the member’s salary that will not be spent. However, accrual accounting rules require the

BUDGET AND FINANCIAL AUDIT ANALYSIS FOR HIGHER EDUCATION ASSOCIATION LEADERS
148
institution to “book” the early retirement incentive plan costs in the fiscal year in which the faculty member retires since it represents a current and future obligation of the institution. Thus, the accounts of the institution will reflect the entire retirement cost in budget year one, even though the payments will not be completed for years. Later year budgets will then reflect no cost (and perhaps even reflect credits) as the payments are made to the retirees. These early retirement incentive plans will help solve the reallocation problem only if the individuals using such plans are from departments whose enrollments are decreasing. Thus, many early retirement incentive plans are restricted to faculty from departments with falling enrollments. The faculty members taking early retirement are not replaced, resulting in a net financial saving that can be used elsewhere in the institution. The effectiveness of early retirement incentive plans to reduce the faculty of given departments will depend on at least two factors: the terms of the retirement plan and the average age of the faculty. Clearly, a more generous plan would interest more faculty than a less generous one. Also, early retirement plans will intrinsically be more appealing to faculty members in their late fifties or early sixties than to younger faculty members. Generally, when a new early retirement plan is introduced, the retirement rate increases substantially. It then decreases to a rate somewhat higher than that before the plan was introduced.
� “Buying out” a faculty member’s contract or tenure. Here, unlike the early retirement plans, there are no age requirements for eligibility. Buyouts are usually offered to all members of a given department or college. The amount of the buyout varies, with one or two years of salary common for a buyout of a tenured faculty member. The faculty accepting these buyouts are often the most mobile faculty, who can quickly find a position elsewhere. Those who are less mobile and too young to retire are less likely to take a buyout. A modification of this is a partial buyout in which a faculty member is guaranteed a part-time appointment for any number of years up to a maximum. The benefits package might be continued in part or in whole, and each year as a part-timer might count as a full-time year for purposes of retirement pay.
The longer the period of time an institution has to achieve a specified level of reduction
in faculty or staff in a department, the more likely that these five strategies will bring about the
desired level of reduction while minimizing or preventing involuntary terminations. However,

BUDGET AND FINANCIAL AUDIT ANALYSIS FOR HIGHER EDUCATION ASSOCIATION LEADERS
149
the time period available to achieve given personnel reductions depends in part upon how early
the enrollment problem was identified.
In a given department or program, we might expect to have at least three years to
accomplish a significant reduction. Students already in the program will need two or three years
to complete their courses. If the department is expected to continue at a reduced size, the course
offerings will probably be reduced and the curriculum for a major modified.
Moreover—and this is critically important to recognize—a department should not assume
that a decrease in enrollment in the future is inevitable. A department’s faculty may be able to
stem the decrease by offering new services or elective courses, by offering mini-courses on a
weekend, by expanding evening offerings, or by asking that admissions policies be changed to
increase admissions in areas in which enrollments have decreased. Many predictions of
disastrous enrollment declines have turned out to be incorrect. Academia was warned that major
enrollment decreases were likely to happen in the early 1980s because of predicted changes in
demographic factors. The demographics were, of course, correct, but the conclusions drawn from
the statistics were wrong. The percentage of high school graduates who immediately went on to
college increased as did the percentage of women over 25 who enrolled in colleges. These two
factors more than offset the demographic downturn in 18- to 24-year olds, and overall college
enrollments in the nation increased. Similarly, aggressive marketing of a department, coupled
perhaps with some changes in an institution’s required courses, may eliminate or drastically
reduce enrollment problems.

BUDGET AND FINANCIAL AUDIT ANALYSIS FOR HIGHER EDUCATION ASSOCIATION LEADERS
150
Real Financial Crises
We next consider the types of fiscal problems that are closer to real crises than the
“normal” reallocation problems discussed above. Often, administrations have not used the term
“ financial exigency” to describe a fiscal crisis but used instead such terms as “state of urgency”
or “ financial stringency.” Whatever the term used, the accompanying comments by
administrators should clearly indicate that they view the situation as either a potential or real
fiscal crisis.
How can one estimate the severity of a fiscal crisis? Two pieces of information are
crucial in making such an assessment. The first is knowledge of the precise cause of the crisis so
that one can determine if it is a one-time or recurring problem that will last into the foreseeable
future. For example, a continuing decline in enrollment for an institution as a whole, and the
corresponding decrease in tuition revenue and/or state appropriation (which may be determined
by an enrollment-driven formula), might be ongoing or might improve dramatically in the near
future, depending upon demographic projections for the geographic regions from which the
institution draws most of its students.
Another possible cause for a fiscal crisis may be a substantial decrease in the state’s
appropriation for an institution. State support for higher education has been decreasing as a
percentage of state expenditures for many years. In one state reviewed by the lead author,
elementary and secondary education accounted for 35 percent of state general fund spending,
Medicaid 16.5 percent and higher education 11.5 percent in FY 2011. In the 1980s, higher

BUDGET AND FINANCIAL AUDIT ANALYSIS FOR HIGHER EDUCATION ASSOCIATION LEADERS
151
education expenditures had been a larger percentage of the budget than Medicaid in that state. In
any case, an Association budget committee should identify the state expenditure levels in the
state in which their institution resides. Preferably, the committee will identify the expenditure
levels of these programs for the past 15 fiscal years and participate in state committees or
workshops to determine probable expenditure levels in the future. If the decreased appropriation
is due to a decrease in state revenues because of a recession, a relevant issue is the length of time
that the recession is expected to last.
In addition, Association leaders must identify whether or not its state legislature is likely
to raise taxes or otherwise increase revenues (adding new or increased user fees or closing tax
loopholes, e.g.) the following year to make up for the shortfall. If, on the other hand, the cause
of the shortfall is a reduction in the taxes enacted or in revenues collected due to an economic
downturn, it may be that the entire state government will have to operate at reduced funding
levels for a number of years. In that case, the institution’s fiscal problems are going to continue
for years to come unless other funding sources can make up for the loss of state funds. Another
factor to consider in projecting state revenues for the institution is whether or not the state’s
priorities for higher education funding are likely to be significantly affected by future legislative
and/or gubernatorial elections. For institutions that receive local tax revenues similar issues arise.
Will a county be willing to raise property taxes to avoid drastic cuts in support to area
community or technical colleges? Can the voting public be persuaded to support such tax
increases?

BUDGET AND FINANCIAL AUDIT ANALYSIS FOR HIGHER EDUCATION ASSOCIATION LEADERS
152
The second crucial piece of information is an accurate estimate of the severity of the
fiscal crisis. Here there are two parameters to consider: (1) What is the dollar amount of the
crisis? That is, what dollar amount annually must be achieved through increased revenues and
decreased costs? Note that a fiscal crisis can be resolved by finding new revenue sources or
expanding existing ones. The problem does not have to be solved through budget cuts alone; (2)
What is the length of time available to resolve the difficulty? The timeframe is generally shorter
than in the typical resource reallocation described earlier in this chapter. The problem may have
to be solved in a given budget year, which has already started. The shorter the period of time
available to achieve a given level of budget cuts and/or increased revenues, the harder it will be
to achieve the budgetary goals without drastic actions.
Association leaders faced with a fiscal crisis should request access to the institution’s
financial records if they do not already have such access. In public institutions, state regulations
usually require that these records be made available to the public. An issue that an Association
budget committee must address in examining the financial records is whether or not its members
have sufficient budgetary experience to adequately analyze the situation. A fiscal crisis is often
the worst situation in which to learn about budgets because of the speed with which decisions
have to be made. Ideally, each institution should have in place a faculty/staff budget committee
whose members have gained some degree of budgetary expertise before the fiscal crisis occurs.
The financial records should indicate the total unrestricted fund balances in all of the
institution’s funds as well as the unrestricted funds in any related foundation(s). Remember, as

BUDGET AND FINANCIAL AUDIT ANALYSIS FOR HIGHER EDUCATION ASSOCIATION LEADERS
153
described in Chapter 2, the budget of an institution is reflected in more than simply its current
fund (or general fund or similarly named fund). Instead, the budget is reflected in all of the
institution’s funds. If the total of all the unrestricted fund balances (other than net investment in
plant) at the end of the year is $5,000,000, then the institution might be able to use this amount to
meet the crisis if it wishes to do so. Be careful not to assume that all unrestricted fund balances
are available to meet the crisis. A balance in the unrestricted retirement of indebtedness fund at
the end of the previous year might be needed for debt retirement in the current crisis year. For
private institutions under FASB regulations, investment in plant is currently treated as
unrestricted funds. However for public institutions operating under GASB Statement No. 35
regulations, investment in capital assets, net of related debt, is separate from unrestricted funds,
as explained in Chapter 2.
Administrators sometimes state that they are “ restricted” from using some unrestricted
funds. However, these “ restrictions” may only be resolutions of a governing board of the
institution. Often governing boards designate some of these unrestricted funds for specified
purposes. In that case, it is true that the officers of the institution cannot spend the funds for other
purposes, but the governing board can re-designate these funds at its next meeting to meet the
fiscal crisis if it chooses to do so. By contrast, funds that are legally restricted (according to
accounting standards) cannot be used for purposes other than those stated for them by external
agencies or individuals. Truly restricted funds cannot be used for other purposes by either the
institution’s administrators or its governing board. GASB Statement No. 54 changed the
parameters of this discussion for some colleges and universities beginning in FY 2011.

BUDGET AND FINANCIAL AUDIT ANALYSIS FOR HIGHER EDUCATION ASSOCIATION LEADERS
154
The total of these unrestricted fund balances (less the net investment in plant, if
applicable) can provide a measure of the severity of the crisis. If these unrestricted funds exceed
the size of the fiscal crisis, part or most of the problem can be met by using these funds.
However, governing boards will generally be reluctant to use all of these unrestricted funds
because they represent a major component of the flexible resources available to an institution.
These funds may have been accumulated over many years.
In considering the use of an institution’s reserves to cover a fiscal crisis, a three to five-
year projection of revenues and expenses should be prepared. If fiscal stability cannot be
achieved in that timeframe without taking actions in addition to the use of reserves, then
additional actions will probably have to be taken. If the crisis involves a decrease in income that
is likely to continue for a number of years, it may indeed be imprudent to use up an institution’s
reserves in meeting the crisis for only the first year. As already noted, knowing the detailed cause
of the fiscal crisis and whether or not it will continue for a number of years is important. If it is
only a short-term question of scarcity, a governing board may be more likely to approve the use
of institutional reserves to meet it. Needless to say, if there is a contingency line in the
institution’s budget, it should be used to meet the crisis. However, if the budgeted contingency
funds were sufficient to solve the problem, it is unlikely that a fiscal crisis would ever have been
announced.
If the degree of the crisis exceeds the unrestricted fund balances of the institution, the
crisis is probably going to be severe, unless it is a nonrecurring crisis, such as a large liability

BUDGET AND FINANCIAL AUDIT ANALYSIS FOR HIGHER EDUCATION ASSOCIATION LEADERS
155
judgment against the institution not covered by insurance. A solution to this kind of crisis might
be to borrow some of the needed money, which would then be repaid over a number of years. In
that case, the institution must find the funds to make the annual payment to the banks. However,
the bank loan may reduce the amount of other expenditures that would have to be cut by a factor
of four or five if the payments (including interest charges) are spread over four or five years.
Suggestions for Increasing Revenues
Naturally, solving a fiscal crisis by increasing revenues is less painful than by reducing
expenses. What follows are some useful revenue enhancement suggestions to consider, although
not all are appropriate for all institutions or fiscal crises and some may not be popular. Keep in
mind that one is seeking to ensure the long-term survival of the institution.
� Increase enrollments. Offer additional courses and workshops to attract students, conduct mini-courses over weekends, or offer courses on the premises of area businesses. Compare the enrollment trends at nearby institutions. If enrollment decreases have occurred at your institution, were comparable decreases experienced at other area institutions? If the answer is “no,” examine the recruitment program of your institution. Unless someone has a convincing explanation as to why only your institution is suffering an enrollment decline, this examination may reveal ways of substantially improving recruitment. Here it is imperative to work with the administration of the institution to investigate ways in which faculty can provide programmatic ideas for course and program expansion.
� Improve student retention. One way to offset fewer students arriving on your campus is to reduce the number of students who leave without completing their program. For example, it is not unusual for public urban universities to have a 40 to 50 percent attrition rate at the baccalaureate degree level. Thus, 40 to 50 percent of the entering freshmen do not receive a bachelor’s degree from the institution, depriving the institution of students in their sophomore, junior, and senior years. Obviously faculty and staff could play a decisive role in improving retention rates by working with the administration to determine the cause of attrition, involving themselves in student advising, registration, and other support; offering tutorial sessions to students; and decreasing the

BUDGET AND FINANCIAL AUDIT ANALYSIS FOR HIGHER EDUCATION ASSOCIATION LEADERS
156
depersonalization of higher education.
� Raise tuition, fees and room and board charges. Consider adopting different tuition rates where high cost or high demand programs charge higher tuition. Also consider imposing higher tuition for juniors and seniors, who are very unlikely to leave the institution because of a somewhat higher tuition rate (justified by higher instructional costs). Public institutions could also consider increasing the number of nonresident students (who are usually charged higher tuition rates).
� Increase research geared to the needs of business, industry, and government—thereby increasing both direct grant income and indirect cost income. This strategy allows the institution to charge academic year salaries to grants and contracts, thereby reducing salary and benefit charges to the unrestricted current fund.
� Change the investment portfolio in order to sacrifice growth to some extent to maximize current income. An institution’s reliance on derivative instruments, long-term investments and hard to sell investments diminishes its ability to do so.
� Use a “ total funds approach” to budgeting, thereby reducing current fund expenditures by replacing them with other funds available to budget units. For example, reduce funds being set aside in a physical plant fund for future building construction and modernizations. In the midst of a fiscal crisis plans for physical plant expansions have to be placed on hold. Also funds set aside by the governing board as “quasi-endowment” funds may need to be transferred by the board to the current fund.
� Increase unrestricted gifts by emphasizing them in fund raising. Pursue fund raising strategies more aggressively.
� Form private practice plans similar to a physicians’ practice plan in which medical fees are paid directly to the institution. In this scenario, the physicians share the revenues generated with the institution. The plans could generate more income for both faculty and the administration. Possible areas in which to consider such plans are business, architecture, engineering, and some of the basic sciences.
� Try to increase the state appropriation. This is an obvious action for any public institution, but it may also yield positive results for a private institution in financial distress. For example, work with your Association and community allies to support tax policy reforms that enhance state or local revenues, e.g., closing tax loopholes.
� Try to increase local appropriations. Seek allies to help lobby county and local officials who can increase aid to your institution. Also, support tax policy reforms such as reassessing property values which may have been unchanged for decades.
BUDGET AND FINANCIAL AUDIT ANALYSIS FOR HIGHER EDUCATION ASSOCIATION LEADERS
157
� Investigate the potential to commercialize and share the revenue of start-up businesses
based upon faculty intellectual property that could result in marketable products and services.
All of these suggestions for increasing revenues should be examined by the administration
and the Association even in the absence of a financial crisis. Additional revenues will always be
helpful, and prudent planning can often mean the difference between short- and long-term
revenue downturns. To read more about the effects of the current economic conditions on higher
education, please review Zumeta, 2010 and 2012; and Rhoades, Smith, & Dougherty, 2010.

BUDGET AND FINANCIAL AUDIT ANALYSIS FOR HIGHER EDUCATION ASSOCIATION LEADERS
158
CHAPTER 9 PRIVATIZATION IN HIGHER EDUCATION Objectives After completing this chapter, readers will be able to:
� Identify arguments to use against administrative support for privatization efforts.
� Articulate strategies to employ against privatization efforts.
� Construct cost analyses of in-house and external services.
� Understand the information to obtain in order to successfully defend the institution against private contractors.

BUDGET AND FINANCIAL AUDIT ANALYSIS FOR HIGHER EDUCATION ASSOCIATION LEADERS
159
Privatization in Higher Education
An issue growing rapidly in importance is the privatization of an increasing array of
operations in institutions of higher education. This is one component of a trend towards
privatizing higher education generally. The fundamental cause of this trend has been the steady
reduction in state support for higher education. Public colleges and universities drew nearly half
of their operating support from state taxpayers in the 1980s. As indicated in Chapter 6, this
support is now below 30 percent. For some of the most prominent public universities it is less
than ten percent. This has forced institutions to seek funds elsewhere to make up for the
shortfalls in state and local funding and to streamline costs and adopt new technology to become
more “efficient.” One result has been to dramatically change the hiring practices for faculty.
According to a September 2007 NEA Higher Education Research Center Update, all types of
higher education institutions increased their share of part-time faculty since 1987, with 22
percent in public doctoral universities to 67 percent in public two-year colleges. This trend
continues. Contingent faculty members are less likely to be included in institutional decision-
making. All of this has eroded collegiality as more institutions adopt corporate models typical of
the private sector.
This chapter deals with one aspect of the overall issue of privatization, namely the
outsourcing of certain functions in higher education institutions. According to the National
Center for the Study of Privatization in Higher Education, in 2002 the following percentages of
colleges and universities outsourced these particular functions: 76 percent for vending, 63
percent for food services, 52 percent for laundry services, 41 percent for bookstore operations,

BUDGET AND FINANCIAL AUDIT ANALYSIS FOR HIGHER EDUCATION ASSOCIATION LEADERS
160
39 percent for concessions, 39 percent for travel services, 23 percent for printing services, 14
percent for entertainment, 14 percent for daycare, and 12 percent for health services. Other
outsourced services were done by less than 10 percent of colleges and universities. A later
survey reported that 67 percent of colleges and universities had further increased privatization
during the past five years. Colleges reported that the primary reasons for turning to outside
contractors were to save dollars, followed by the quest to improve institutional operations.
Outsourcing is also being used in relation to the curriculum itself. Colleges and
universities are offering more courses online while some for-profit and public institutions have
expanded distance education by offering complete degrees online. Student support services, such
as enrollment, information technology, and career services, are also being outsourced.
Overview of Privatization
There are usually early warning signs before formal steps to privatize an operation are
commenced. These signs include rumors that if costs of a given operation are not reduced, the
administration will consider subcontracting. Also, a budget crisis may have been announced.
This is sometimes the justification given for considering subcontracting. Other questions to
answer include finding out if there have been major changes in the higher level administrators
(i.e. a new Vice President for Finance), and if outside consultants have been retained to review
various institutional operations to make them “more efficient.”
The first formal step may be the issuance of a Request for Proposal (RFP). The RFP is
usually a large document containing the complete bid specifications for the product or service

BUDGET AND FINANCIAL AUDIT ANALYSIS FOR HIGHER EDUCATION ASSOCIATION LEADERS
161
being purchased. It details the service needs of the institution, any unique circumstances it needs
to have accommodated and the types of flexibility the institution will want to retain. It should
contain enough specific information to allow contractors to make realistic proposals without
being so specific as to effectively eliminate all but one predetermined bidder.
There may be a pre-bid conference at which Association representatives can ask
questions of both the administration and potential bidders. Certainly Association representatives
should attend the conference and ask appropriate questions. This will be followed by a due date
for all bids. Finally, if the institution goes forward with privatization, there will be an award date
set at which the administration announces which bidder is awarded the contract.
Strategies for Opposing Privatization
There are at least four approaches that can be used by local associations to prevent the
contracting out of bargaining unit members’ work.
1. The legal arena: challenges to the legality of privatizing using binding arbitration (for violation of contract provisions and good faith bargaining) and also using the courts.
2. Bargaining strategies: conducting negotiations in order to prevent privatization.
3. Local public relations and community action to bring local pressure on the administration and the governing board against contracting out of jobs.
4. Budgetary analysis of the RFP and the bids submitted to demonstrate that privatization will not achieve the goals proclaimed by the administration of yielding both better service and lower cost.
This Handbook will concentrate on discussing the fourth point. While the analysis of the
fourth point is important, it is imperative that the other three points also be aggressively pursued.

BUDGET AND FINANCIAL AUDIT ANALYSIS FOR HIGHER EDUCATION ASSOCIATION LEADERS
162
For more information about the other points, two excellent sources of information are Beat
Privatization: A Step by Step Crisis Organizing Manual (National Education Association, 2011)
and the Privatization/Subcontracting Manual published in 1997 by the Pennsylvania State
Education Association. Many of the suggestions in this chapter are modifications of strategies
given in these two publications (both of which were written for K-12 privatization).
You will need to gather information in order to meet the challenge of privatization.
Among the needed information are budgetary documents about the institution so that the true
financial status of the institution can be determined. The most accurate such documents are the
annual audited financial reports about the institution. Chapter 3 describes the kind of information
to be found in these audited financial reports. In addition, the RFP needs to be carefully
analyzed. Separate budgetary data about the operation(s) considered for privatization will also
need to be requested from the administration so that the bargaining representative can calculate
the present costs associated with providing the service in house. The Association representative
should also seek information about the bidders and their past performance at other institutions.
The following is a list of issues, many of which are included in the NEA 2011
privatization manual (modified for application to higher education institutions). These issues
should be addressed with the administration as early in the process as possible. The answers to
these questions may dissuade the administration from pursuing privatization.
1. What expertise does the private sector offer that is not now found in the institution?
2. What impact will privatization have on the academic experience and outcomes of students?

BUDGET AND FINANCIAL AUDIT ANALYSIS FOR HIGHER EDUCATION ASSOCIATION LEADERS
163
3. How much specific day-to-day control of the privatized operation will the institution
relinquish to the private sector?
4. What specific problem(s) will be solved by the private sector? Further, what specific challenges will be created by privatization?
5. Has the administration tried to solve these specific problems internally?
6. What results came from these attempted solutions?
7. What other institutions of higher education have used this contractor and now no longer do?
8. What are the reasons for this?
9. What institutional goals have already been set that the private sector will help achieve?
10. What precisely do you want the private sector to do?
11. How will you know that you have achieved your goals?
12. What guarantee will the private sector give that their lower costs will result in high or higher levels of service? How will these costs be tracked or measured?
13. Will the administration visit other higher educational institutions where the private contractors are doing business and ask tough questions?
14. What well-defined private sector contractual agreements have been developed and are on hand in the institution that will guarantee the service you are looking for?
15. What institutional plans exist to monitor private sector services? What additional staff will be required in order to do so in a prudent manner?
16. What institutional plans exist to evaluate private sector services? Who will do these evaluations?
17. Will the private sector contract have provisions to ensure accountability or penalties for failure to perform?
18. What is the private sector’s employee turnover rate in similar institutions?

BUDGET AND FINANCIAL AUDIT ANALYSIS FOR HIGHER EDUCATION ASSOCIATION LEADERS
164
19. If service improvement is the goal, what has the administration done to date to implement programs that manage, train and equip current institutional employees to function more effectively and efficiently?
20. Most important: What is the cost analysis done by the administration that demonstrates that the privatization will be done less expensively that keeping the function in-house?
Cost Analysis Associated with Privatization
Administrators often claim that privatizing this or that operation of a college or university
will improve performance and save money. This is contrary to everyday experience. In many
aspects of life one expects that if you pay more for a given product or service you will get a
better product or service or at least more of the product or service than if you pay less. In
addition, the private company expects to make a profit for providing the service. Common sense
should dictate that it is impossible to skim off profit dollars for providing a service and still
provide better (and/or) more service at a lower cost than was provided in-house. Yet this is
exactly what administrators often claim. Let us examine how they reach these conclusions and
where they go wrong in their reasoning. Keep in mind, however, that subcontracting rarely is
really about money alone; it is sometimes about control over the workforce.
Cost Analysis of the In-house Operation
The administration will often begin its privatization campaign by comparing its estimate
of the fully allocated in-house cost of providing the operation to be privatized with the
contractor’s bid to “save money.” The first thing to do is to try to reach agreement with the

BUDGET AND FINANCIAL AUDIT ANALYSIS FOR HIGHER EDUCATION ASSOCIATION LEADERS
165
administration on the various cost components of the calculation. For the calculation of the
in-house cost of the operation, the cost should be separated as follows:
Fully Allocated In-house Cost = “ Avoidable” Direct Costs + “ Avoidable” Indirect Costs + “ Retained Costs”
In this equation, the full cost of keeping the work in-house, also called the fully loaded or fully
allocated cost, will be the sum of two kinds of “avoidable” costs (direct and indirect) plus any
remaining costs, i.e., costs which the institution will still incur if the operation is contracted out.
The administration often subtracts the cost of the bid from the fully allocated costs and claims
that the difference is a “savings.” This is incorrect. Fully allocated costs include items such as
administrative overhead, which the institution will assume even if the work is subcontracted out.
Put another way, the calculation of savings due to contracting out should reflect only those costs
which would be eliminated, or “avoided” if the operation is contracted out. The costs which “go
away” are called “avoidable costs.” Any costs which will still be paid by the administration after
the work is contracted out should not be included in the estimate. In Chapter 6, second tier costs
were described and assigned to each cost center. These included a portion of the cost of general
administration. They will be included in the “ fully allocated” cost of each operation, yet they will
not be reduced by subcontracting the operation. The institution will still have a President (and the
staff of a President’s office), a Vice President for Finance, etc., with or without privatizing a
given operation. No money from these “second tier” costs will be saved by privatization. Yet

BUDGET AND FINANCIAL AUDIT ANALYSIS FOR HIGHER EDUCATION ASSOCIATION LEADERS
166
often the cost of an external bid is compared to the sum of the direct costs plus all indirect costs,
including those that will remain even after the operation is privatized!
Other examples of “Retained Costs” are maintenance, custodial and security services that
continue to be provided by the institution for a cafeteria if the food service is contracted out. The
direct costs of an operation include, but are not limited to, the following: wages of employees
doing the work; benefits of employees doing the work, materials and supplies used in the
operation; and equipment used in the operation. The indirect costs of an operation include, but
are not limited to, the following: utilities, rent, and facility management; administrative
overhead, and debt service. The depreciation of equipment used will probably be included under
direct costs; check to see if this has been overstated in order to increase the apparent cost of
doing the operation in-house. For example, if a computer has been depreciated over a five-year
useful life, no depreciation should be charged for a computer that is six years old.
Cost Analysis of the Request for Proposal
The request for proposal (RFP) should be analyzed in terms of the services to be rendered
by the contractor and a host of other issues. The RFP may contain provisions which differ from
current conditions in the operation but which, if implemented, could result in improved
efficiency or cost-saving without subcontracting. If this is the case, evaluate whether these
changes could be made without a detrimental effect on bargaining unit members. If so, the union
can ask the administration to implement them without privatizing. The RFP, if well written,
should contain the following items:

BUDGET AND FINANCIAL AUDIT ANALYSIS FOR HIGHER EDUCATION ASSOCIATION LEADERS
167
Background Information: Bidders should be required to submit financial information about
their company as well as provide a list of other (similar) institutions at which they currently
provide the same service.
Bid Bond: The RFP should require all bidders to include a bid bond equal to a specified
percentage of the total bid. Posting the bid bond protects the institution against contractors
withdrawing or changing their bids.
Pre-Bid Meeting: This is where the Association can discover the identity of the prospective
bidders.
Termination Agreement: Can the administration terminate the contract at any time? How long
will it take to get rid of a contractor whose performance is unsatisfactory? What costs will be
incurred in terminating the outside contractor?
Employees: Is the contractor required to supply a specified number of employees, guaranteeing
that a minimum level of service will be provided? If contractors are able to submit bids based on
a smaller workforce than that currently performing the work in-house, the contractor’s
employees may not be able to adequately fulfill the job duties. If a contractor’s bid is based on a
smaller workforce, the contractor will have an automatic price advantage.
Other items of interest in the RFP concern the proposed personnel under contract. Do
displaced college employees have first rights to the contractor’s jobs? Does the college dictate
the compensation levels of the contractor’s employees? Any dollar savings the college may

BUDGET AND FINANCIAL AUDIT ANALYSIS FOR HIGHER EDUCATION ASSOCIATION LEADERS
168
realize by outsourcing may be offset by a loss of quality from less qualified employees. What
control does the institution have over the identity of the contractor’s employees? Can the
administration demand that employees be retrained, suspended or fired if their performance is
unsatisfactory?
Supplies and Equipment: Where and from whom will supplies be purchased? If the contractor is
a national company, it may be cheaper to buy supplies in bulk from one supplier. In that case the
Association may gain support from local merchants whose business will suffer from privatizing.
Will the contractor provide all the equipment that is now provided by the institution for the
operation? If so, who will pay for the equipment if the contract is terminated? Will the
equipment remain with the institution or leave with the contractor? This could be of enormous
importance if computer operations are being considered for privatization, for example. If the
institution initially provides the equipment, can the contractor replace it at will, perhaps with
older or cheaper equipment, allowing the contractor to convert the institution’s equipment to its
own use?
Statement of Work: The RFP should clearly state the institution’s expectations about required
tasks and the frequency and manner in which they are to be performed. Expected outcomes and
quality or performance standards should be included. If all the duties performed by institutional
employees are not included, they either won’ t be done or the institution will be charged extra for
them.

BUDGET AND FINANCIAL AUDIT ANALYSIS FOR HIGHER EDUCATION ASSOCIATION LEADERS
169
Protections for the Institution: How much flexibility does the institution have? What if the
institution wants to change the academic year or workday? What will happen during weather or
emergency cancellation of classes? What types of insurance are required and who pays for it?
Must contractors post a performance bond to protect the institution against contract default, poor
performance or temporary interruption of service? The amount required is usually at least ten
percent of the value of the contract. Must the contractor submit all costs as fixed costs, or can the
contractor bill the institution for some of the costs of goods and services it uses in fulfilling the
contract? If the latter is the case the contractor can pass on the costs of production inefficiencies
and may also be tempted to pad those costs when submitting bills to the institution.
Quality Assurance: Can the terms of the contract’s deliverables be tied to some objective
measurement?
Other Considerations: What is the duration of the contract? If it is a multi-year contract, can
either party renegotiate the price of products or services during the life of the contract? Will all
bids be final and binding or will the administration open the bids and then let contractors revise
them—essentially forcing them to re-bid against one another in a downward spiral? This may
be a useful point to raise at any pre-bid meeting since it may well discourage contractors from
bidding at all.
Analyzing the Contractor’s Total Costs
The contractor’s total cost will usually exceed the “bid” price because of several factors.
The equation used to determine the total contract cost is as follows:
BUDGET AND FINANCIAL AUDIT ANALYSIS FOR HIGHER EDUCATION ASSOCIATION LEADERS
170
Total Contract Cost = Bid Price + Retained Cost
where the bid price equals the total price the contractor says it will charge the institution
for performing the service; and the retained costs represent the costs that continue to be
borne by the institution after the operation is contracted out.
Several other costs are important to keep in mind, including all of the following:
Administrative Costs: These include costs such as contract negotiations and award, processing
invoices, and the monitoring and evaluation of contractor performance. These costs have been
estimated to be in the range of 10 percent to 20 percent of the base bid with the smaller
percentage applying to larger contracts.
Conversion Costs: These are one-time costs such as unemployment compensation and/or
severance pay for displaced employees.
Other Costs: If the contractor will charge an additional amount for adding or deleting services,
the best estimate of such changes should be made. Although this item is often omitted from cost
comparison publications, it may be substantial. It may be one of the reasons that the federal
government suggests as a guideline that a privatization contract should save at least ten percent
of the current costs of providing the service. Otherwise it should not be done.
New Revenues: Any additional revenues the institution will receive as a result of contracting,
such as the sale of unused equipment or facilities, should be included herein.

BUDGET AND FINANCIAL AUDIT ANALYSIS FOR HIGHER EDUCATION ASSOCIATION LEADERS
171
Why do a private contractor’s prices appear to be so low?
There are four common ways in which private contractors appear to save money:
1. They pay lower wages and benefits to employees.
2. They provide fewer services with fewer or less experienced employees.
3. All costs associated with contracting out are not included in the cost comparison.
4. Contractors “ low-ball” their first bid to lock in the service and later raise prices significantly. In addition, the contractor may profit from the transfer of institutional assets.
Comparing In-house and Contracted Costs
If one were to combine the two prior equations, one arrives at the savings (if any) of
contracting:
Savings Due to Contracting = (Avoidable In-house Costs + Retained In-house Costs) - Total Contractor Costs
All of this financial analysis overlooks other important issues. Perhaps the most
important of these is the loss of dedicated employees who have worked their entire lives in the
collegial atmosphere of putting students first. Providing excellent services to these students as
the paramount concern is replaced in privatization with concern for the bottom line. Again, many
public agencies, including the federal government, suggest a service not be contracted out unless
the contractor’s price is at least ten percent below in-house cost. Even then, students may pay the
hidden price of concern solely with the “bottom line.”

BUDGET AND FINANCIAL AUDIT ANALYSIS FOR HIGHER EDUCATION ASSOCIATION LEADERS
172
One example of privatization in higher education occurred many years ago at a major
East Coast university which privatized its computer operations. After a couple of years, the
administration began to realize that the institution had lost control of this crucial operation.
Eventually all aspects of the computer operation were brought back under the institution’s
control. Employees loyal to the institution, not to an outside vendor, did an exemplary job of
solving the “Year 2000 Problem.” It is doubtful that an outside vendor could have been as
effective in solving this critical problem since it would have had other client institutions to
service simultaneously.
In summary, privatization forces Associations to ‘own the mission’ of the higher
education institution more than the administration by researching the short- and long-term costs
to the institution of privatizing campus operations. The pressure to create an ever-more efficient
organization is expected to build in the near-term, and Association representatives need to stand
ready to prove their value to the institution’s stakeholders both by examining the costs, aims and
strategies of privatization while articulating the additional value that dedicated employees bring
to the table.

BUDGET AND FINANCIAL AUDIT ANALYSIS FOR HIGHER EDUCATION ASSOCIATION LEADERS
173
CHAPTER 10 SOURCES OF FINANCIAL INFORMATION Objectives After completing this chapter, readers will be able to:
� Identify, access and utilize financial information to reach Association objectives.

BUDGET AND FINANCIAL AUDIT ANALYSIS FOR HIGHER EDUCATION ASSOCIATION LEADERS
174
Sources of Financial Information
Budgetary analysis is dependent upon available budgetary data. This chapter reviews the
data that may be obtained about a given institution and, in some cases, about comparable
institutions. Ideally, all higher education administrators should share budgetary data with an
appropriate employee group, such as a Faculty Senate budget committee, and/or the employee
Association. When this is the case, the sources of budgetary data described in this chapter will
probably be utilized only to the extent that comparison with other institutions may be helpful in
assessing performance.
Audited Financial Statements
As Chapter 3 indicated, the most reliable information about the status of an institution’s
finances comes from its annual audited financial statements. For public colleges and universities
these should be publicly available, or available through a Freedom of Information Act (FOIA)
request. If the administration is not required to provide them to the appropriate Association
representative directly, they can usually be found on the institution’s website. Then one will have
to search for the location of the audited financial statements. A couple of examples are presented
below.
For Michigan State University, go to http://www.msu.edu, which is the official website
for that institution. If you just enter the name of an institution into a search engine it may come
up with quite a few non-official websites that are very unlikely to host the financial data you
seek. Once at the MSU website, go to the box labeled SEARCH and type in “Audited Financial

BUDGET AND FINANCIAL AUDIT ANALYSIS FOR HIGHER EDUCATION ASSOCIATION LEADERS
175
Statements” . They will appear and you can log onto, for example, the 2009-10 Financial Report
and then download it.
For Southern State Community College in Ohio, you have to search for its audits through
the Auditor of State’s website (http://www.auditor.state.oh.us/). To conduct an audit search, you
click on the appropriate box, enter in the institution name, and download the appropriate file.
For Temple University, go to http://www.temple.edu and first try administration and
officers. Go to the Budget Office and Budget Information. Unfortunately this leads you to the
current budget, not to the audits. What to do next? Well, one needs to know that the annual
audits of Temple University are referred to as “Treasurer’s Reports.” Using that information, one
can use the “Search Temple” button and type in “Treasurer’s Reports,” and then the audited
Financial Statements appear and can be downloaded.
These three examples demonstrate that one may need to try a variety of approaches to get
the all-important audited financial statements, but they should be obtainable with a little effort
and patience.
Public institutions are mandated by state law to provide a variety of financial information
that is open to the public. Appropriation bills for each institution are a matter of public record. In
some states the appropriation is determined by a formula (as described in Chapter 5). If the
formula includes a group of comparable institutions where faculty averages are used to calculate
one of the terms in the formula, it is useful to compare the average salaries of faculty at your
institution to those of its comparable institutions. Copies of the funding formula and such details

BUDGET AND FINANCIAL AUDIT ANALYSIS FOR HIGHER EDUCATION ASSOCIATION LEADERS
176
as to which institutions are comparable should be available from the state bureaucracy that
supervises the formula. A current listing of such agencies is available through the State Higher
Education Executive Officers (SHEEO) organization at http://www.sheeo.org/our-members.
States usually publish reports that evaluate the effectiveness of state-supported higher
education institutions. These reports may be issued by a Department of Education, another
executive branch operation, or perhaps by an agency reporting to the legislature. They may
contain enrollment statistics, faculty salary data, workload averages, and the calculations of the
cost of instructional output, such as the cost per student credit hour produced, which may be
differentiated by level as well as by discipline. In some states, faculty and staff salaries are a
matter of public record. In unionized higher education institutions, those representatives usually
have a legal right to the listing of salaries and benefits of the members of the bargaining unit,
plus other data needed to negotiate a contract.
Association leaders may also wish to examine the budget submission of the institution to
the state government. Some states mandate separate budget requests for capital appropriations,
and the capital requests may state the needs of the institution, in priority order, for several years
into the future. When this is the case, administration priorities may become evident from the
capital budget request.
Some of this data may also be available from the appropriate state agencies for private
institutions. In addition, financial information is submitted annually to the federal government by
higher education institutions. The data are compiled by the U.S. Department of Education and

BUDGET AND FINANCIAL AUDIT ANALYSIS FOR HIGHER EDUCATION ASSOCIATION LEADERS
177
the National Center for Education Statistics in Washington, D.C. (http://nces.ed.gov/). The data
from this organization are used by a number of organizations to analyze the state of higher
education.
Additionally, each public higher education institution (except for-profit institutions) has
to file an annual report with the Internal Revenue Service (IRS) as an organization exempt from
income tax. The report, filed on Form 990, contains a statement of revenue, expenses, and
changes in fund balances. It also contains a beginning and end of fiscal year balance sheet,
including a listing of the value of land, buildings, and equipment owned by the institution as well
as a listing of mortgages, bonds, and other notes payable. Finally, it lists the salaries and fringe
benefits of the chief administrators of the institution. Many faculty associations and unions
obtain a copy of their institutions’ IRS report each year. Note, however, that the report received
will probably be at least a year old. For example, in response to a request in the fall of 2010, you
may receive your institution’s IRS report for the fiscal year July 1, 2008-June 30, 2009.
The American Association of University Professors (AAUP) annually obtains and
analyzes faculty compensation data directly from about 1,900 institutions covering about
350,000 full-time faculty members. For each of these institutions, the AAUP reports the average
salary by rank and sex and the number of full-time men and women in each rank in the
institution. It also presents fringe benefits as a percentage of salary and the percentage of salary
increase that each rank at the institution received that year for continuing faculty. The AAUP
survey assigns a rating to the average compensation in a given rank. The data also include the
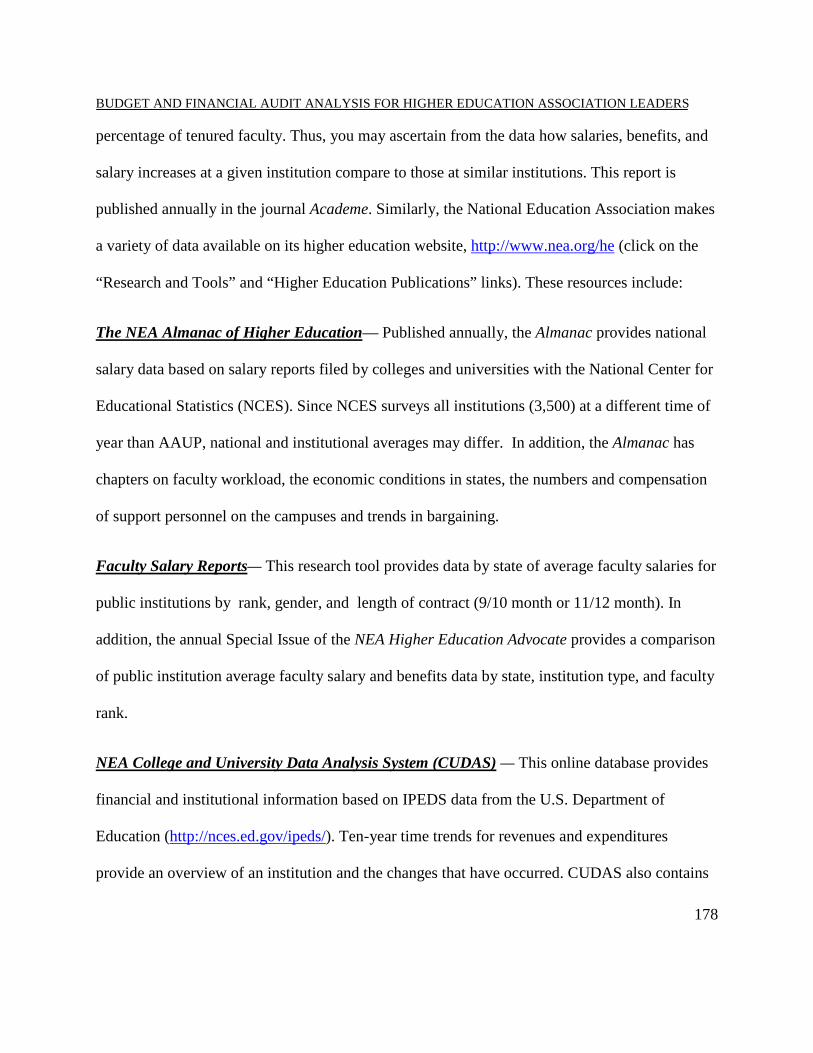
BUDGET AND FINANCIAL AUDIT ANALYSIS FOR HIGHER EDUCATION ASSOCIATION LEADERS
178
percentage of tenured faculty. Thus, you may ascertain from the data how salaries, benefits, and
salary increases at a given institution compare to those at similar institutions. This report is
published annually in the journal Academe. Similarly, the National Education Association makes
a variety of data available on its higher education website, http://www.nea.org/he (click on the
“Research and Tools” and “Higher Education Publications” links). These resources include:
The NEA Almanac of Higher Education— Published annually, the Almanac provides national
salary data based on salary reports filed by colleges and universities with the National Center for
Educational Statistics (NCES). Since NCES surveys all institutions (3,500) at a different time of
year than AAUP, national and institutional averages may differ. In addition, the Almanac has
chapters on faculty workload, the economic conditions in states, the numbers and compensation
of support personnel on the campuses and trends in bargaining.
Faculty Salary Reports— This research tool provides data by state of average faculty salaries for
public institutions by rank, gender, and length of contract (9/10 month or 11/12 month). In
addition, the annual Special Issue of the NEA Higher Education Advocate provides a comparison
of public institution average faculty salary and benefits data by state, institution type, and faculty
rank.
NEA College and University Data Analysis System (CUDAS) — This online database provides
financial and institutional information based on IPEDS data from the U.S. Department of
Education (http://nces.ed.gov/ipeds/). Ten-year time trends for revenues and expenditures
provide an overview of an institution and the changes that have occurred. CUDAS also contains

BUDGET AND FINANCIAL AUDIT ANALYSIS FOR HIGHER EDUCATION ASSOCIATION LEADERS
179
salary data by contract length, rank, race/ethnicity, and gender as well as student enrollment and
program/degree, and collective bargaining agent information. The application allows
automatically generated as well as user-defined peer institution comparisons across these various
measures.
Higher Education Contract Analysis System (HECAS) — The NEA Higher Education
Research Center has over 1,600 higher education contracts in this online database. These include
contracts for faculty (full- and part-time), support staff, graduate assistants, and academic
professional staff represented NEA as well as by any other national or independent unions. The
system searches these contracts for specific language and is updated as new contracts become
available. This database is available through the NEA higher education website and is password-
protected. Higher education Association leaders can access HECAS through state Association
higher education staff.
Budget and Financial Audit Analysis— NEA trains state Association staff and leaders in higher
education budget and financial audit analysis. Higher education locals needing more in-depth
analysis by an outside expert can request that assistance as well through their state Association
staff.

BUDGET AND FINANCIAL AUDIT ANALYSIS FOR HIGHER EDUCATION ASSOCIATION LEADERS
180
Appendix A Applicable Statements of the Governmental Accounting Standards Board GASB 34
In June 1999 the Governmental Accounting Standards Board issued GASB Statement
No. 34, Basic Financial Statements and Management’s Discussion and Analysis for State and
Local Governments. GASB 34 articulated a new model for financial reporting based on the
notion of tying governmental services to their costs. Aligning state and local government
financial reports to this model will require a report that includes a section of management
discussion and analysis (MD & A) that reviews the financial performance of the governmental
entity, basic financial statements that are government-wide and fund-based, and detailed notes to
the financial statements. GASB 34 intensified the long-term perspective of institutions,
expanded the public accountability of districts, and increased scrutiny of district priorities and
finances. It also created more relevant and comprehensible information for citizens, legislative
bodies, and investors and creditors (See GASB Concepts Statement No. 1, Objectives of
Financial Reporting, at paragraph 30).
The new reporting requirements articulated under GASB 34 added a level of insight,
detail and purpose to the annual statements required by law. The statements are comprised of
management’s discussion and analysis of the district’s financial activities, a statement of net
assets and a statement of activities, fund-based statements about the major and minor
governmental and enterprise funds, notes to financial statements, and required supplementary
information that includes a budgetary comparison of the district’s original, final and actual
BUDGET AND FINANCIAL AUDIT ANALYSIS FOR HIGHER EDUCATION ASSOCIATION LEADERS
181
information regarding its general fund and major special revenue funds. For state and local
government employees and the public at large, the net result of these changes was a clearer
understanding of the financial inputs and service outputs of districts separated by function, with a
new emphasis on the value of infrastructure and other long-term assets.
GASB Statement No. 34 echoes the impact of FASB Statement No. 106, Employers'
Accounting for Postretirement Benefits Other Than Pensions, in its elevation of the importance
of operating debts such as post-employment employee costs such as pension and health care, and
aligns the perspective of public administrators with the reality of multi-year budgeting under the
new Statement. GASB 34 required all state and local governments to report their financial
statements using the accrual rather than the cash basis of accounting, and collect data relative to
infrastructure costs. Implementation occurred in different time periods according to a state or
local government’s revenues: Institutions with total annual revenues of $100 million or more
should have applied GASB 34 in the first fiscal year ending after June 15, 1999; those
institutions with total annual revenues of between $10 and $100 million should have
implemented the changes for the first fiscal year ending after June 15, 2000; and institutions
with total annual revenues of less than $10 million should have applied the changes for the first
fiscal year ending after June 15, 2001.
Two additional Statements were offered by the GASB to assist government
implementation of GASB 34: Statements No. 37, Basic Financial Statements and Management’s
Discussion and Analysis for State and Local Governments: Omnibus, an amendment of GASB

BUDGET AND FINANCIAL AUDIT ANALYSIS FOR HIGHER EDUCATION ASSOCIATION LEADERS
182
Statements No. 21 and No. 34; and 38, Certain Financial Statement Note Disclosures, which
were both published in June 2001.
GASB 35
In November 1999, the Governmental Accounting Standards Board issued GASB
Statement No. 35, Basic Financial Statements- and Management’s Discussion and Analysis for
Public Colleges and Universities, an Amendment of GASB Statement No. 34. GASB Statement
No. 35 extends the requirements of GASB 34 to public colleges and universities. The effective
date of GASB 35 varies by institutional revenue: Institutions with total annual revenues of $100
million or more should have applied GASB 35 changes in financial statements for periods
beginning after June 15, 2001; those institutions with total annual revenues of between $10 and
$100 million should have implemented the changes for periods beginning after June 15, 2002,
while institutions with total annual revenues of less than $10 million should have applied the
requirements of GASB 35 for periods after June 15, 2003.
GASB 39
In May 2002, the GASB published Statement No. 39 that addressed the determination of
whether certain organizations are component units. GASB Statement No. 39 is an amendment of
GASB Statement No. 14, The Financial Reporting Entity, issued in June 1991. GASB 39 applies
to financial reporting by primary governments and other stand-alone governments, organizations
for which the primary government is financially accountable and other organizations for which
the nature and significance of their relationship with the primary government are such that

BUDGET AND FINANCIAL AUDIT ANALYSIS FOR HIGHER EDUCATION ASSOCIATION LEADERS
183
exclusion would cause the reporting entity's financial statements to be misleading or incomplete.
It became effective for financial statements for periods beginning after June 15, 2003.
GASB 39 requires the governments and organizations identified above to discretely
present financial information of component units in each of the financial statements addressed
most recently in GASB 35 and, in so doing, allows for greater governmental financial
transparency. It was also designed to create more relevant and comprehensible information for
citizens, legislative bodies, and investors and creditors (See GASB Concepts Statement No. 1,
Objectives of Financial Reporting, paragraph 30.). GASB Statement 39 indicates that a legally
separate, tax-exempt organization should be reported as a component unit of a reporting entity if
all of the following criteria are met:
1. The economic resources received or held by the separate organization are entirely or almost entirely for the direct benefit of the primary government, its component units, or its constituents.
2. The primary government is entitled to, or has the ability to otherwise access a majority of the economic resources received or held by the separate organization.
3. The economic resources received or held by an individual organization that the specific primary government, or its component units, is entitled to, or has the ability to otherwise access, are significant to that primary government.
Component units that meet the criteria listed above should be discretely presented.
Financial statements of the reporting entity should provide an overview of the entity that is
sufficient to allow readers to distinguish between the primary government and its component
unit(s). In some cases, component unit financial reporting will be presented in the financial

BUDGET AND FINANCIAL AUDIT ANALYSIS FOR HIGHER EDUCATION ASSOCIATION LEADERS
184
statements of the primary government; in other cases, component unit financial reporting will be
presented in the financial statements of a separate financial audit.
GASB 45
GASB Statement No. 45, Accounting and Financial Reporting by Employers for
Postemployment Benefits Other Than Pensions, became effective as of the financial period
starting after December 15, 2006 (i.e. the 2007-2008 fiscal year) for most public higher
education institutions following GASB accounting rules. The comparable accounting rule for
private institutions, FASB 106, Employers' Accounting for Postretirement Benefits Other Than
Pensions, went into effect in fiscal 1993-94 for institutions following the FASB rules.
GASB 45 requires institutions to calculate the present value liability of these future
benefits. Prior to the adoption of GASB 45, public institutions merely reported current
expenditures for these benefits. GASB 45 uses the abbreviation OPEB for other postemployment
benefits and ARC for annual required contribution to fund the benefits. The goal of GASB 45 is
to recognize the cost of benefits in periods when the related services are received by the
institution rather than when the benefits are provided many years later, and to provide accurate
information about the actuarial accrued liabilities for these past services and to what extent those
benefits have been funded. The ARC is calculated to include the normal cost for the given year
of providing these benefits plus an amount to amortize the unfunded liabilities of the plan over a
period up to 30 years.

BUDGET AND FINANCIAL AUDIT ANALYSIS FOR HIGHER EDUCATION ASSOCIATION LEADERS
185
Institutions had to calculate an initial OPEB obligation when GASB 45 was first included
in their annual financial reports. When a net OPEB obligation has a liability balance (i.e., it is not
fully funded), the annual OPEB cost for an employer is equal to the ARC plus one year’s interest
on the beginning balance of the net OPEB obligation, less an adjustment to the ARC to offset the
amount included in the ARC for amortization of the past contribution deficiencies.
The impact on the institution’s net assets can be substantial. One large Midwestern
institution estimated that the liability created by the application of GASB 45 was more than $800
million dollars. However, there are major uncertainties in calculating the OPEB obligation. They
include: the cost of providing health care for up to 30 years in the future; the age at which
covered employees will choose to retire (the later they retire the fewer retirement years will need
to be covered by the post-retirement benefits); the life span of retirees after they retire; and the
investment return assumption (discount rate) used to estimate the long-term investment yields on
the investments to be used to finance the benefits (the higher the yield the smaller the current
liability). None of these factors can be accurately estimated decades into the future. Thus, the
calculated OPEB obligation will have a substantial uncertainty in its stated amount.
However, the size of this liability has led some institutions which made similar
calculations under FASB 106 to eliminate or reduce post-employment benefits or to require co-
payments by employees. It is important that collective bargaining representatives whose
members presently enjoy postemployment benefits to familiarize themselves with GASB 45.

BUDGET AND FINANCIAL AUDIT ANALYSIS FOR HIGHER EDUCATION ASSOCIATION LEADERS
186
GASB 46
GASB Statement No. 46, Net Assets Restricted by Enabling Legislation, clarifies the
meaning of the phrase “ legally enforceable” as it applies to restrictions imposed on net asset use
by enabling legislation. This statement was effective with the 2005-06 fiscal year.
GASB 47
GASB Statement No. 47, Accounting for Termination Benefits, provides accounting and
reporting guidance for both voluntary and involuntary termination benefits. This statement was
effective with the 2005-06 fiscal year. It may have a small effect on calculations of the costs
under GASB 45 for post-employment benefits other than pensions.
GASB 48
GASB Statement No. 48, Sales and Pledges of Receivables and Future Revenues and
Intra-Entity Transfers of Assets and Future Revenues, provides accounting and reporting
guidance on the exchange of an interest in future cash flows or specific future revenues for
immediate cash payments. This will have a greater significance for some state governments than
for colleges or universities. This statement was effective with the 2007-2008 fiscal year.
GASB 49
GASB Statement No. 49, Accounting and Financial Reporting for Pollution Remediation
Obligations, provides accounting and reporting standards for pollution remediation obligations.

BUDGET AND FINANCIAL AUDIT ANALYSIS FOR HIGHER EDUCATION ASSOCIATION LEADERS
187
As with GASB Statement No. 48, this will have a greater impact on state and local governments
than on colleges and universities. This statement was effective for the 2008-2009 fiscal year.
GASB 50
GASB Statement No. 50, Pension Disclosures—an amendment of GASB Statements No.
25 and No.27, more closely aligns the financial reporting requirements for pensions with those of
other postemployment benefits (OPEB) such as those mandated in GASB Statement No. 45, and
in doing so enhances the information disclosed in the notes to the financial statements or
presented as required supplementary information by pension plans and by employers who
provide pension plans. This statement was effective as of the 2007-2008 fiscal year.
GASB 51
GASB Statement No. 51, Accounting and Financial Reporting for Intangible Assets,
deals with whether or when intangible assets should be treated as capital assets. This has
significance for state and local governments which have assets such as water rights, timber
rights, easements, etc. It may also have some relevance for colleges and universities which may
own patents, copyrights, etc. This statement became effective as of the 2009-2010 fiscal year.
GASB 52
GASB Statement No. 52, Land and Other Real Estate Held as Investments by
Endowments, will require that endowments report real estate held as investments at their current
value rather than at their historical cost.

BUDGET AND FINANCIAL AUDIT ANALYSIS FOR HIGHER EDUCATION ASSOCIATION LEADERS
188
GASB 55
In March 2009, GASB released Statement No. 55 to clarify the hierarchy of generally
accepted accounting principles and prioritize pronouncements for all state and local
governments. The sources of accounting principles were prioritized as follows: GASB
Statements and Interpretations; GASB Technical Bulletins, AICPA Practice Bulletins, and
GASB Implementation Guides.
GASB 56
GASB Statement No. 56, Codification of Accounting and Financial Reporting Guidance
Contained in the AICPA Statements on Auditing Standards, was issued in March 2009 in order to
incorporate three accounting principles—related party transactions, going concern
considerations, and subsequent events— into the GASB authoritative literature. As such, it does
not establish new accounting standards, but incorporates AICPA standards into the GASB
standards.
GASB 61
GASB Statement No. 61, the Financial Reporting Entity: Omnibus, an amendment of
GASB Statements No. 14 and No. 34, was issued in November 2010 in order to clarify the
requirements for inclusion of component units in a financial reporting entity, for amending the
criteria for reporting component units as if they were part of the primary government, and

BUDGET AND FINANCIAL AUDIT ANALYSIS FOR HIGHER EDUCATION ASSOCIATION LEADERS
189
clarifying the reporting of equity interests in legally separate organizations. State and local
governments must implement GASB 61 for the fiscal year ended June 30, 2013.

BUDGET AND FINANCIAL AUDIT ANALYSIS FOR HIGHER EDUCATION ASSOCIATION LEADERS
190
Appendix B Applicable Pronouncements of the Financial Accounting Standards Board FASB 124
Effective for fiscal years beginning after December 15, 1995, i.e., with the 1996-97 fiscal
years of most not-for-profit institutions, those institutions were to adopt FASB Statement No.
124, Accounting for Certain Investments Held by Not-for-Profit Organizations, concerning the
valuation to be listed for certain investments. It requires these institutions to list at fair market
value equity securities with easily determinable fair values and all investments in debt securities.
Gains and losses from these investments were to be reported in the Statement of Activities. In a
bull market the result of applying FASB 124 to an institution’s investments is to increase the
value of most stock and bond holdings relative to carrying them at their original purchase price.
Should the stock and bond markets experience a major “correction,” however, FASB 124 results
in a substantial decrease in the value of these investments relative to carrying them at their
original purchase price.
FASB 158
FASB Statement No. 158, Employers’ Accounting for Defined Benefit Pension and Other
Postretirement Plans—an Amendment of FASB Statements No. 87,88, 106 and 132 (R), requires
employers to recognize the overfunded or underfunded status of a defined postretirement plan as
an asset or liability in its statement of financial position. Although FASB 106 required an
institution to recognize the potential cost of postretirement benefits other than pensions, it did not

BUDGET AND FINANCIAL AUDIT ANALYSIS FOR HIGHER EDUCATION ASSOCIATION LEADERS
191
require the underfunded or overfunded status to appear on an institution’s Statement of Financial
Position. As previously mentioned under the discussion of GASB 45 for public institutions, the
application of this resulted in a huge decrease in the net assets of some private institutions, which
led to pressure for the governing board to reduce or eliminate some postretirement benefits.
FASB Statement No.158 became effective in the 2006-07 fiscal year.
FASB 161
This pronouncement is effective for fiscal years beginning after November 15, 2008. This
was an amendment to FASB 133 and was entitled “Disclosures about Derivative Instruments and
Hedging Activities.” Institutions must disclose their objectives for holding or issuing derivative
instruments, the context needed to understand those objectives, and their strategies for achieving
those objectives. A distinction must be made between instruments used for risk management and
those used for other purposes. The fair value amount of each derivative must be listed in the
statement of financial position, and the amounts of gains and losses must also be listed.
FASB 168
Effective for fiscal years ending after September 15, 2009, FASB Accounting Standards
Codification (ASC) became the source of authoritative U.S. accounting and reporting standards
for nongovernmental entities, in addition to guidance issued by the Securities and Exchange
Commission. This provides the generally accepted accounting principles in a topically organized
structure. FASB Statement No. 168 was the final standard issued by FASB in that form. In the
future, FASB will issue Accounting Standards Updates.

BUDGET AND FINANCIAL AUDIT ANALYSIS FOR HIGHER EDUCATION ASSOCIATION LEADERS
192
Bibliography
American Institute of Certified Public Accountants, Inc. (2010). Audit and accounting guide for state and local governments. New York, NY: Author.
American Institute of Certified Public Accountants, Inc. (2010). Audit and accounting guide for not-for-profit entities. New York, NY: Author.
Attmore, R.H. (2009). What is the significance of GASB’s conceptual framework? Journal of Government Financial Management, 58, 8-10.
Bacharach, S.B., Bamberger, P.A., & Sonnenstuhl, W.J. (2001). Mutual aid and union renewal: Cycles of logic of action. Ithaca, NY: Cornell ILR Press.
Benjamin, E. (2002). Variations in the characteristics of part-time faculty by general fields of instruction and research, 104, 45–59.
Benjamin, E. (2003). Reappraisal and implications for policy and research. New Directions for Higher Education, 123, 79-113.
Brooks, R.C. & Mead, D.M. (2010). Statement 54: Implementation problems and solutions. Government Accountants Journal, 59, 24-31.
Chase, B.W. & Montoro, J.B. (2009). Balancing government budgets under GASB 54. Journal of Accountancy, 5, 42-47.
Chase, B.W. & Roybark, H.M. (2010). GASB statement 54: Do governments need to adopt new policies? Government Accountants Journal, 59, 32-37.
Chen, H.T. (2005). Practical program evaluation: Assessing and improving planning, implementation, and effectiveness. Thousand Oaks, CA: Sage Publications, Inc.
Copley, P.A. (2011). Essentials of accounting for governmental and not-for-profit organizations (10th Ed.). New York, NY: McGraw-Hill/Irwin.
Ehrenberg, R.G., & Zhang, L. (2004). Do tenured and tenure track faculty matter? NBER Working Paper No. W10695. Cambridge, MA: National Bureau of Economic Research.
Financial Accounting Standards Board (1987). Statement number 93: Recognition of
depreciation by not-for-profit organizations. Norwalk, CT: Author.

BUDGET AND FINANCIAL AUDIT ANALYSIS FOR HIGHER EDUCATION ASSOCIATION LEADERS
193
Governmental Accounting Standards Board (1987). Concepts statement number 1: Objectives of financial reporting. Norwalk, CT: Author.
Governmental Accounting Standards Board (1997). Accounting and financial reporting for certain investments and for external investment pools. Norwalk, CT: Author.
Governmental Accounting Standards Board (1999). Statement number 34: Basic financial statements—and management's discussion and analysis—for state and local governments. Norwalk, CT: Author.
Governmental Accounting Standards Board (1999). Statement number 35: Basic financial statements—and management's discussion and analysis— for public colleges and universities—an amendment of GASB statement number 34. Norwalk, CT: Author.
Governmental Accounting Standards Board (2001). Statement number 37: Basic financial statements—and management's discussion and analysis— state and local governments: omnibus—an amendment of GASB statements number 21 and number 34. Norwalk, CT: Author.
Governmental Accounting Standards Board (2002). GASB statement number 39: Determining whether certain organizations are component units—an amendment of GASB statement number 14. Norwalk, CT: Author.
Governmental Accounting Standards Board (2004). GASB statement number 43: Financial reporting for postemployment benefit plans other than pension plans. Norwalk, CT: Author.
Governmental Accounting Standards Board (2004). GASB statement number 45: Accounting and financial reporting by employers for postemployment benefits other than pensions. Norwalk, CT: Author.
Governmental Accounting Standards Board (2007). Concepts statement number 4: Elements of financial statements. Norwalk, CT: Author.
Governmental Accounting Standards Board (2008). GASB statement number 53: Accounting and financial reporting for derivative instruments. Norwalk, CT: Author.
Governmental Accounting Standards Board (2009). GASB statement number 54: Fund balance reporting and governmental fund type definitions. Norwalk, CT: Author.

BUDGET AND FINANCIAL AUDIT ANALYSIS FOR HIGHER EDUCATION ASSOCIATION LEADERS
194
Governmental Accounting Standards Board (2009). GASB statement number 55: The hierarchy of generally accepted accounting principles for state and local governments. Norwalk, CT: Author.
Governmental Accounting Standards Board (2010). Codification of Governmental Accounting and Financial Reporting Standards as of June 30, 2010. Norwalk, CT: Author.
Government Finance Officers Association (2003). Best Practice: The use of trend data and comparative data for financial analysis. Downloaded from http://www.gfoa.org/downloads/caafr-trend-comparative-data.pdf.
Harrington, C., & Schibik, T. (2001). Caveat emptor: Is there a relationship between part-time
faculty utilization and student learning retention? AIR Professional File, 91, 1-10. Higher Learning Commission (2003). Higher Learning Commission’s Handbook of
Accreditation (3rd Ed.). Chicago, IL: The Higher Learning Commission: A Commission of the North Central Association.
Hyatt, J.A. (1983). Cost Accounting Handbook for Colleges and Universities. Washington, D.C.:
National Association of College and University Business Officers. Jacoby, D. (2006). Effects of part-time faculty employment on community college graduation
rates. The Journal of Higher Education, 77, 1081-1103. Knapp, L.G., Kelly-Reid, J.E., and Ginder, S.A. (2009). Enrollment in Postsecondary
Institutions, Fall 2007; Graduation Rates, 2001 & 2004 Cohorts; and Financial Statistics, Fiscal Year 2007 (NCES 2009-155). National Center for Education Statistics, Institute of Education Sciences, U.S. Department of Education. Washington, DC.: U.S. Department of Education.
Meisinger, R.J. & Dubeck, L.W. (1984). College and University Budgeting: an Introduction for
Faculty and Academic Administrators. Washington, D.C.: National Association of College and University Business Officers.
National Association of College and University Business Officers (2006). Essentials of college
and university accounting: A reference companion to NACUBO’s online self-study course. Washington, D.C.: Author.
National Council on Governmental Accounting (1982). Statement number 1: Government accounting and financial reporting principles. Norwalk, CT: Author.

BUDGET AND FINANCIAL AUDIT ANALYSIS FOR HIGHER EDUCATION ASSOCIATION LEADERS
195
National Education Association (2011). Beat Privatization: A Step by Step Crisis Organizing Manual. Washington, D.C.: Author.
National Education Association (2007). Part-Time Faculty: A Look at Data and Issues. NEA
Higher Education Research Center Update Vol. 11, No. 3, September 2007, at http://www.nea.org/assets/docs/HE/vol11no3.pdf.
Office of Management and Budget (1999). OMB Circular A-110, Revised 11/19/1993, Further
Amended 09/30/1999. Downloaded on October 22, 2010 from http://www.whitehouse.gov/omb/circulars_a110.
Raiborn, M. H. (1986). Revenues and expenses of intercollegiate athletic programs: Analysis of financial trends and relationships. Overland Park, KS: National Collegiate Athletic Association, 1986.
Rhoades, G., Smith, M., & Dougherty, K. (2010). Negotiating our position in hard times. In The 2010 NEA Almanac of Higher Education. Washington, D.C.: National Education Association, pp.73-82.
State Higher Education Executive Officers (2010). Public FTE enrollment, educational appropriations, and total educational revenue per FTE, United States – Fiscal 1986-2011. Downloaded on April 12, 2013 from http://www.sheeo.org/sites/default/files/project-files/All%20States%20Wavechart%202011.pdf.
Tahey, P., Salluzo, R., Prager, F., Mezzina, L., & Cowen, C. (2010). Strategic financial analysis for higher education: Identifying, measuring and reporting financial risks (7th Ed.). Washington, D.C.: NACUBO.
Taylor, B.E. (1993). Strategic indicators in higher education: Improving performance. Princeton, NJ: Peterson’s Guides.
Umbach, P.D. (2007). How effective are they? Exploring the impact of contingent faculty on
undergraduate education. The Review of Higher Education, 30, 91-123. U.S. Department of Education (2009b). Table 245. Employees in degree-granting institutions, by
employment status, sex, control and type of institution, and primary occupation: Fall 2007. In the Digest of Education Statistics, 2009. Downloaded October 27, 2010 from http://nces.ed.gov/programs/digest/d09/tables/dt09_245.asp?referrer=report.

BUDGET AND FINANCIAL AUDIT ANALYSIS FOR HIGHER EDUCATION ASSOCIATION LEADERS
196
U.S. Department of Education (2011). Table 259: Employees in degree-granting institutions, by employment status, sex, control and level of institution, and primary occupation: Fall 2009.
U.S. Department of Education (2009). Graduation Rates, 2001 & 2004 Cohorts; and Financial
Statistics, Fiscal Year 2007 (NCES 2009-155). Washington, DC: National Center for Education Statistics, Institute of Education Sciences, U.S. Department of Education.
U.S. Senate, Committee on Health, Education, Labor and Pensions (2012). For-Profit Higher
Education: The Failure to Safeguard the Federal Investment and Ensure Student Success. Washington, D.C. Downloaded on August 15, 2012 from http://www.help.senate.gov/hearings/hearing/?id=cdd6e130-5056-9502-5dd2-e4d005721cb2.
Wang, X. (2006). Financial management in the public sector: Tools, applications and cases.
Armonk, NY: M.E. Sharpe, Inc. Weiss, C.H. (1998). Evaluation (2nd Ed.). Upper Saddle River, NJ: Prentice Hall. Wholey, J., Hatry, H. and Newcomer, K. (Eds.) (2004). Handbook of Practical Program
Evaluation, (2nd Ed.). San Francisco, CA: John Wiley and Sons, Inc. Zumeta, W. (2010). The Great Recession: Implications for Higher Education. In The 2010 NEA
Almanac of Higher Education. Washington, D.C.: National Education Association, pp.29-42.
Zumeta, W. and Kinne, A. (2011). The Recession is Not Over for Higher Education. In The 2011 NEA Almanac of Higher Education. Washington, D.C.: National Education Association, pp. 29-42.
Zumeta, W. (2012). States and Higher Education: On Their Own in a Stagnant Economy. In The 2012 NEA Almanac of Higher Education. Washington, D.C.: National Education Association, pp. 27-37.

BUDGET AND FINANCIAL AUDIT ANALYSIS FOR HIGHER EDUCATION ASSOCIATION LEADERS
197
Glossary
Accountant A financial professional who is skilled in the practice of accounting or who is in charge of public or private accounts. An accountant is responsible for reporting financial results, whether for a company or for an individual, in accordance with government and regulatory authority rules.
Accounts Receivable Refers to a debt owed by an organization that arises in the normal course of dealings and is not supported by a negotiable instrument. In this sense, the charge accounts of a business are accounts receivable, but income from investments usually is not. Accounts receivable generally arise from sales or service transactions. They are not necessarily due or past due. Insurance may be purchased to protect against the risk of being unable to collect on accounts receivable if records are damaged or lost.
Accrual Basis of Accounting A basis of accounting under which revenues are recorded when earned and expenditures/expenses are recorded as soon as they result in liabilities for benefits received, notwithstanding that the receipt of cash or the payment of cash may take place, in whole or in part, in another accounting period.
Agency Fund A type of fund that is used to report resources held by the reporting government in a purely custodial capacity; they typically involve only the receipt, temporary investment, and remittance of fiduciary resources to individuals, private organizations, or other governments.
Amer ican Institute of Cer tified Public Accountants (AICPA) Organization of certified public accountants that provides auditing guidance when approved by FASB and/or GASB.
Asset A resource with present service capacity that the government currently controls. An asset may be tangible, such as a building, a piece of equipment, or intangible such as the right to use intellectual property. It remains an asset so long as it is still capable of providing services.
Assigned Fund Balance A fund balance classification which includes amounts that are constrained by the government’s intent to be used for specific purposes, but that are neither restricted nor committed. Intent should be expressed by the governing body itself or a committee or official to which the governing body has delegated the authority to assign amounts to be used for specific purposes.
Auditor An individual qualified to conduct audits. An auditor may be an internal auditor (an individual whose primary job function is to audit his or her own company) or an external auditor
BUDGET AND FINANCIAL AUDIT ANALYSIS FOR HIGHER EDUCATION ASSOCIATION LEADERS
198
(an individual from outside the company, who typically is employed by an auditing firm who handles many different clients).
Budget A plan of financial operation embodying an estimate of proposed expenditures for a given period and the proposed means of financing. As stated in GASB Concepts Statement No. 1, Objectives of Financial Reporting, most governments have annual operating budgets that are legally adopted. Although often not required by law, some governments also prepare long-term operating budgets and capital budgets.
Capital Assets Includes land, improvements to land, easements, buildings, building improvements, vehicles, machinery, equipment, works of art and historical treasures, infrastructure, and all other tangible or intangible assets that are used in operations and that have initial useful lives extending beyond a single reporting period.
Capital Projects Fund A type of governmental fund that accounts for financial resources that are classified for capital expenditures.
Cash Equivalents Short-term, highly liquid investments that are both readily convertible into known amounts of cash and are so near their maturity that they present insignificant risk of changes in value due to changes in interest rates. Examples of cash equivalents instruments include money market funds and three-month certificates of deposit. The GASB has offered numerous pronouncements that require various disclosures about cash and cash equivalents; AICPA lists 18 required disclosures (American Institute of Certified Public Accountants, Inc., 2011, §5.44, pages 128-129) that reflect the GASB’s concerns with accountability and full disclosure.
Chart of Accounts An organizing system that classifies each financial transaction according to the appropriate accounting principles and the reporting needs of the institution, both internal and external. Each account usually has both a descriptive name and a numerical or alphanumeric designation to facilitate encoding.
Committed Fund Balance A fund balance classification that includes amounts that can only be used for specific purposes pursuant to constraints imposed by formal action of the government’s highest level of decision-making authority. Those committed amounts cannot be used for any other purpose unless that decision-making authority removes or changes the specified use by taking the same type of action it employed to previously commit those amounts.
Comprehensive Annual Financial Report (CAFR) As a governmental unit’s official annual report prepared and published as a matter of public record, a CAFR should contain introductory

BUDGET AND FINANCIAL AUDIT ANALYSIS FOR HIGHER EDUCATION ASSOCIATION LEADERS
199
material, basic financial statements, required supplementary information, schedules to demonstrate compliance, and statistical tables.
Current Asset An asset which is easily convertible to cash in the present fiscal period. This could include cash, money market funds or short-term certificates of deposit.
Debt Service Fund A type of governmental fund that is reserved for financial resources that are designated to be expended for principal and interest on debt instruments, other than interest or principal on proprietary or fiduciary activities.
Direct Method A way of presenting cash flow information that focuses on major classes of operating cash receipts and payments. Using this method of preparing a cash statement starts with money received and then subtracts money spent, to calculate net cash flow. Depreciation is excluded altogether because, although it is an expense that affects net profits, it is not money spent or received.
Enabling Legislation Legislation that authorizes the government to assess, levy, charge, or otherwise mandate payment of resources and includes a legally enforceable requirement that those resources be used only for the specific purposes stipulated in the legislation. See GASB Statement No. 46, Net Assets Restricted by Enabling Legislation, for more information.
Enterpr ise Fund A type of proprietary fund that accounts for the acquisition, operation, and maintenance of governmental facilities and services that are entirely or predominantly self-supporting by user charges.
Fair Value The amount of money at which an investment could be exchanged in a current transaction, other than a forced or liquidation sale, between willing parties.
Federal Accounting Standards Advisory Board (FASAB) Standards-setting body that promulgates federal government accounting and financial reporting standards.
Financial Accounting Foundation (FAF) By setting the general policy direction, raising funds and selecting Board members, the FAF provides oversight to the Financial Accounting Standards Board (FASB) and the Governmental Accounting Standards Board (GASB).
Financial Accounting Standards Board (FASB) Independent seven-member body designated to set accounting and financial reporting standards for commercial entities and nongovernmental not-for-profit institutions.

BUDGET AND FINANCIAL AUDIT ANALYSIS FOR HIGHER EDUCATION ASSOCIATION LEADERS
200
Financial Audit The verification of the financial statements of a legal entity, with a view to express an audit opinion. The audit opinion is a reasonable assurance that the financial statements are presented fairly, in all material respects, or give a true and fair view in accordance with the financial reporting framework.
Financial Statement A formal record of the financial activities of an organization that provides information about the financial position, performance, and changes in financial position of an institution for the purpose of financial decision-making and accountability.
Fund A fiscal and accounting entity with a self-balancing set of accounts that record financial resources and liabilities which are segregated for the purpose of a specific set of activities or objectives that follow certain regulations, restrictions or limitations.
Fund Accounting The process by which financial resources are classified in accordance with their intended purpose and in compliance with their legal and contractual requirements.
Fundamental Accounting Equation (Also known as the balance sheet formula). Here, Assets – Liabilities = Net Assets.
General Fund A type of governmental fund that is the primary fund used to account for all assets and liabilities of an institution except those particularly assigned for other purposes in another more specialized fund.
Generally Accepted Accounting Pr inciples (GAAP) Body of accounting and financial reporting standards as defined by Rule 203 of the American Institute of Certified Public Accountants (AICPA).
Governmental Accounting Standards Board (GASB) Independent agency designated to set accounting and financial reporting standards for state and local governments and for governmentally related not-for-profit institutions. Seven Board members are appointed by the Trustees of the FAF for a five-year term and may serve up to ten years.
Indirect Method This method of presenting cash flow information begins with the net income figure taken from the income statement (profit and loss account) and then makes several adjustments which fall under three main headings: (1) Expenses not involving cash outflows such as depreciation, deferred taxes, increased accounts payable, which are added back; (2) Cash outflows not recorded as expenses such as increases in inventory, which are subtracted; and (3) Revenues not involving cash inflows such as increased accounts receivable and profit on sale of property, which are subtracted. These adjustments convert the net income into net cash flow

BUDGET AND FINANCIAL AUDIT ANALYSIS FOR HIGHER EDUCATION ASSOCIATION LEADERS
201
from operating activities. To this amount cash inflows from investing activities and financing activities are added and related cash outflows are deducted. The resulting figure gives the cash balance at the end of the period for which the statement was prepared. The indirect method shows the relationship between the two other critical financial statements, balance sheet and income statement. Also, it avoids the duplication of effort where a supplementary schedule to reconcile net income with cash flows from operating activities is needed. However, it does not disclose operating cash receipts and payments.
Inflow of Resources An acquisition of net assets by the government that is applicable to the reporting period.
Inventory Unexpired costs representing economic values that will have utility in the following year(s). It includes consumable supplies and supplies for resale, such as textbooks. Costs of these items must be determined on a consistent basis for all inventories using any of several accounting techniques (such as average cost).
Internal Service Fund A type of proprietary fund that accounts for financing services and commodities furnished by a designated department to other departments within a single governmental unit or to other governmental units. Resources used by the fund are restored either from operating earnings or by transfers from other funds so that the original fund capital is kept intact.
Investment Trust Fund A type of fiduciary fund that is used to account for the external portion of investment pools reported by the sponsoring government.
Liabilities Present obligations to utilize resources that the government has little or no discretion to avoid.
Liquidity A measure of the ability of an institution to convert assets to cash without significant loss at a particular point in time.
Management’s Discussion and Analysis An unaudited component of a financial report that provides a narrative explanation and analysis of an institution’s financial activities.
Measurement Focus A way of presenting an institution's financial performance and position by considering which resources are measured (financial or economic) and when the effects of transactions or events involving those resources are recognized (the basis of accounting). The measurement focus of government-wide financial statements, proprietary fund financial

BUDGET AND FINANCIAL AUDIT ANALYSIS FOR HIGHER EDUCATION ASSOCIATION LEADERS
202
statements, and fiduciary fund financial statements is economic resources. The measurement focus of governmental fund financial statements is current financial resources.
Modified Accrual Basis of Accounting A basis of accounting wherein revenues are recognized when they become available and measurable, and expenditures are recognized when a liability is incurred except for principal and interest on long-term debt, which are recorded when due.
Net position The residual of all other elements presented in a statement of financial position. It is measured by the difference between assets and deferred outflows of resources and liabilities and deferred inflows of resources.
Non-Current Asset An asset that is not easily convertible to cash or not expected to become cash within the next year. This could include fixed assets, leasehold improvements, and intangible assets.
Nonspendable Fund Balance Fund balance classification which includes amounts that cannot be spent because they are either not in spendable form or under a legal or contractual obligation to be maintained intact.
Obligation A social, legal or moral requirement, such as a duty, contract, or promise that compels an institution to follow or avoid a particular course of action.
Outflow of Resources A consumption of net assets by the government that is applicable to the reporting period.
Pension (and Other Employee Benefit) Trust Fund A type of fiduciary fund that accounts for resources required to be held in trust for the members and beneficiaries of defined benefit plan, defined contribution plans, other employment benefit plans, or other employee benefit plans.
Permanent Fund Accounts for resources that are restricted to the earnings (not the principal) of assets.
Present Service Capacity Existing capability to enable the government to provide services, which in turn enables the government to fulfill its mission.
Private-Purpose Trust Fund A type of fiduciary fund that is used to report all other trust arrangements under which principal and income benefit individuals, private organizations, or other governments.

BUDGET AND FINANCIAL AUDIT ANALYSIS FOR HIGHER EDUCATION ASSOCIATION LEADERS
203
Resource A supply or other means that can be drawn on when needed. In the governmental context, a resource is an item that can be drawn on to provide services to the citizenry.
Restr icted Fund Balance Fund balance classification which includes amounts that are restricted when constraints are placed on the use of resources that are either externally imposed by creditors (such as through debt covenants), grantors, contributors, or laws or regulations of other governments; or imposed by law through constitutional provisions or enabling legislation.
Segment An identifiable activity reported as or within an enterprise fund or other stand-alone entity for which one or more revenue bond or other revenue-backed debt instruments are outstanding. A segment has a specific identifiable revenue stream pledged in support of revenue bonds or other revenue-backed debt and has related expenses, gains and losses, assets, and liabilities that can be identified.
Short-Term Investments Investment vehicles purchased by an organization that are expected to be held for less than 12 month. These investments include securities that are bought in anticipation that their sale will generate income on short-term price differences. Examples of short-term investments include stocks and bonds.
Special Revenue Fund A type of governmental fund that is used to account for specific revenue sources that are designated for specific expenditures other than debt service or capital projects.
Unassigned Fund Balance A fund balance classification which represents the residual classification for the general fund. It includes fund balance that has not been assigned to other funds and that has not been restricted, committed, or assigned to specific purposes within the general fund.