Embed Size (px)
Citation preview
UNDERSTANDING B2B E-MARKET ALLIANCE STRATEGIES
Qizhi Dai
Doctoral Candidate Information and Decision Sciences
Carlson School of Management University of Minnesota Minneapolis, MN 55455 Phone: (612) 626-3668 Fax: (612) 626-1316 [email protected]
Robert J. Kauffman
Professor and Chair Co-Director, MIS Research Center Information and Decision Sciences
Carlson School of Management University of Minnesota Minneapolis, MN 55455 Phone: (612) 624-8562 Fax: (612) 626-1316
ABSTRACT
In the recent rapidly changing environment of the Digital Economy, business-to-business (B2B) electronic markets are adopting cooperative strategies in lieu of competitive strategies in order to obtain resources so that they can succeed in the market. This paper aims to develop formal theory-based understanding of a range of observed cooperative strategies by conducting an empirical study of B2B e-market strategic alliances. We draw upon research on strategic alliances, intermediation and market structure to explore the factors that motivate firms to enter into interorganizational alliances, and make choices about how to structure and provide governance mechanisms for them. We employ data from various secondary sources, and address questions about the motivation, structure and impact of alliances. We investigate the frequency of alliances that B2B e-markets form by testing a Poisson count model. We explain how B2B firms choose alliance structures and whether the cooperative strategy affects the success of B2B e-markets by using two different binomial logistic regression models. Our results show that leading B2B e-markets tend to set up cooperative relations more frequently. They also show that strategic alliances are more likely to involve high levels of interdependence in governance (e.g., joint equity ownership), if partners are buyers or suppliers in the online marketplace. However, our results indicate that the survival of B2B e-markets is not significantly related to the number of alliances they form. KEYWORDS. Alliances, e-commerce, electronic markets, e-procurement, B2B e-commerce, count data analysis.
INTRODUCTION
Business-to-business (B2B) electronic markets are an innovative form of interorganizational information
systems (IOS), utilizing the Internet and Web technologies to provide shared infrastructure and a means for
commercial exchange. We define a B2B e-market as a firm or a subsidiary of a firm that hosts and operates
Internet and Web-based information systems by which other firms can purchase and/or sell products. They
typically offer electronic product catalogs, price discovering mechanisms, and other market-making
functions. A recent study published in the McKinsey Quarterly reported that as B2B e-markets experience
growth and market change, they have come to find it essential to leverage strategic alliances to gain effective
access to products, customers and new business opportunities (Ernst, Halevy, Monier and Sarrazin, 2001).
This is consistent with literature on strategic alliances which argues that firms in rapidly expanding industries
are more likely to form alliances (Mody, 1993; Teece, 1992). Chan, Kensinger and Keown (1997) also find
that a large portion of strategic alliances that are observed in American industry are formed by information
technology (IT) firms.
For startups, a primary determinant for success is the ability to rapidly develop and market products and
services to secure positive cash flow and expand market share. By forging cooperative relations with other
firms, new firms are able to develop technological and social resources fast. This sets them up in a position
where it is possible, if other aspects of their business are in order, to outperform their competitors. Baum,
Calabrese and Silverman (2000) found that new biotechnology firms that formed more alliances and were
involved in efficient relationships out-performed other firms in the market for initial public offerings (IPOs)
of stock.
Such first-mover advantages are especially critical for firms that seek to compete in environments with
strong network effects, which are characterized by “winner takes all” outcomes (Shapiro and Varian, 1999).
B2B e-markets, the focus of the present study, are new digital intermediaries that build upon existing
networks of buyers and suppliers. To achieve success, these firms must be early to develop effective new
service offerings, and bringing them to market in good is crucial. But how can they accomplish this task
effectively, given the significant resources that must be required? What kind of “functionality” and services
will it take to win over buyers and suppliers in a new marketplace? And what will it take to be successful in
the longer-term, in spite of the down-market in e-commerce services? The answer, we believe, lies in the
formation of strategic alliances by B2B e-markets with other organizations. We define alliances as formal
cooperative relationships in which firms pool or exchange resources to engage in a joint endeavor, sharing
costs and returns.
Although we have observed the wide adoption of cooperative strategies among B2B e-markets, further
investigation is needed to provide additional insights and managerial knowledge about how firms can make
more effective B2B e-market alliances. In this paper, we will address the following related research
questions:
What are the contents and intended purposes of strategic alliances that are formed by B2B e-
markets?
Under what circumstances will B2B e-markets actually be observed to form alliances? What drives
them?
How will the firms that are involved choose the governance structures of the alliances that they
form? How much interdependence will be observed among firms?
And, finally, how will the alliances affect the success of B2B e-markets?
To answer these questions, we will draw upon research on strategic alliances, intermediation and market
structure to explore the factors that motivate firms to enter into interorganizational alliances, and make
choices about how to structure and provide governance mechanisms for them. We collect data from
secondary sources, and identify four main types of B2B e-market alliances: marketing alliances, participation
alliances, functionality alliances and connection alliances, involving aligned efforts for the enhancement of
market service functionality, buyers and suppliers, product and service distribution, and connections with
potential customers, respectively. We investigate the frequency of the observation of alliances by testing a
Poisson count model, and the alliance structure using a binomial logistic regression model. We also test a
separate logit model for the effect of alliances on the survival of B2B e-markets.
The paper is organized as follows. Section 2 discusses the background literature and briefly reviews
some of the issues that we face that will be handled by the empirical modeling choices that we make in this
work. Section 3 provides definitions for the kinds of B2B e-market alliance types that we have observed
during the last five years, and presents the research hypotheses that we will test. Section 4 discusses pre-
empirical data collection and measurement issues that permit us to translate the theoretical model into an
empirical model. Section 5 presents the details of the empirical models that are tested, and provides
background on the variety of modeling considerations that we made to support effective testing of our
study’s hypotheses. Section 6 presents the analysis results. We report on a baseline estimation using a
Poisson regression count data model of observed frequency of occurrence of B2B e-market alliances
explained by our theory. We also present results from a binary logistic regression model that identifies what
affect management’s decisions on developing partnerships that exhibit high levels of interorganizational
interdependence.
LITERATURE AND THEORETICAL BACKGROUND
An alliance is a formal cooperative relationship between firms that pool or exchange their resources and
share returns from the pooled investment (Teece, 1992). Along with showcasing the efficacy of cooperative

strategies among firms that search for partners to improve their competitiveness, the academic literature has
offered a variety of perspectives that address the issues in alliances (Faulkner and De Rond, 2000; Lorange
and Roos, 1992). Firms are motivated to enter into cooperative relationships by the need for obtaining
complementary resources in a speedy, cost-efficient and flexible fashion (Teece, 1992). Moreover, firms can
strengthen their market position and deter entry through partnerships (Tirole, 1997; Bamberger, Carlton and
Neumann, 2001). The value of alliances to firms is reflected by excess stock returns that have been observed
upon the announcement of the formation of strategic alliances, and the subsequent better financial
performance that results in comparison with other firms (Chan, Kensinger and Keown, 1997). An alliance is
also viewed as a hybrid organizational form, and in this sense, alliances are set up to minimize transaction
costs and to allocate returns according to property rights (Pisano, 1989; Hennart, 1991).
Competitive Advantage from Strategic Alliances
A strategy of cooperation may enable alliance partners to achieve a stronger market position together
than they would in isolation. For example, through an arrangement called “code sharing,” airlines cooperate
with each other on connecting flight routes, and thus increase their traffic on the shared routes by gaining
market share from other airlines (Bamberger, Carlton and Neumann, 2001). Competing airlines also share
airport facilities. The result is that the smaller partner is prevented from entering the incumbent’s market on
a large-scale basis, which secures the latter’s market position (Chen and Ross, 2000). In addition to
achieving a strong market position, another potential advantage of a strategic alliance is to permit a firm to
obtain access to new market revenue opportunities or new skills through their partners. This is common in
the biotechnology industry, for example, where small biotechnology firms partner with established
pharmaceutical firms so that the former obtains access to market while the latter obtains knowledge in
developing the new drugs (Lerner and Merges, 1997). It is also worthwhile to point out that the
organizational form of strategic alliances gives firms the flexibility of forming and disbanding linkages with
partners swiftly in response to changes in demand or other aspects of their business environment (Mody,
1993; Chan, Kensinger and Keown, 1997). Mody (1993) pointed out that such flexibility enables firms to
explore new technologies and skills without risking financial over-commitment and the potential for financial
distress, and is the most valuable for rapidly growing firms or firms that compete in environments
characterized by rapid changes in product and process technologies.
The advantages of alliances that we cite are realized by firms through the access they obtain to
complementary resources at a lower cost than if they were to develop the capabilities internally (Teece,
1992). The alliance literature recognizes three kinds of critical resources in this context: technical,
commercial and social resources (Ahuja, 2000). Technical resources are the skills and capabilities for
developing and offering new products. Commercial resources include firm marketing and distribution skills
that can bring products to customers. Social resources reflect the linkages that firms have already formed
and can be leveraged to obtain other resources. Ahuja (2000) showed that firms with more resources are
attractive potential partners but are less inclined to partner with other organizations with few resources.
Strategic alliances represent an even more important strategy for new firms that bring a new form of
business to their customers in the market. It is typical that their capabilities (in product development,
support and extension, for example) are doubted. They require assistance to gain legitimacy in the
marketplace in addition to their eager demand for resources. For example, new biotechnology firms signal
their research capabilities by partnering with incumbent pharmaceutical firms (Nicholson, Danzon and
McCollough, 2002). In addition, Baum, Calabrese and Silverman (2000) showed that startup firms that
formed more alliances outperformed their competitors on IPOs. They also provided evidence to suggest that
it is important to achieve relationship efficiencies in strategic alliances. Overall, the research that we cite
indicates that the formation of strategic alliances represents a success factor for startups that promote access
to necessary resources and signaling of their capabilities through the leverage that their partners’ resources
create.
Transaction Costs and Property Rights in Strategic Alliances
If we view strategic alliances as a hybrid organizational form, transaction cost theory gives us the ability
to obtain insights into the governance forms that alliances adopt related to the circumstances under which
they are formed (Williamson, 1989 and 2000). When partnering firms pool their resources or share resources
with each other, they make mutual commitments to relationships which typically are characterized by a
higher level of bilateral dependency than is the case when they use other alternatives in the broader market.
However, in contrast to hierarchies, in which one set of owners and managers typically can exercise
unilateral authority, partners share rights to control and monitor activities. They also have the opportunity to
determine how to share returns on the investment. Hence, in such relationships, there are potential
opportunistic behaviors that may diminish the gains from the cooperation (Williamson and Masten, 1995).
To overcome this problem, firms can resort to strategies that hold one another “mutually hostage,” for
example, by investing in technology assets that are specific to the interorganizational collaboration, or
obtaining legally enforcable contractual assurances of mutual commitment and non-competition. When they
have a large stake in the relationships or a high degree of uncertainty is involved in the cooperative activities,
firms are more likely to use mechanisms such as equity-based joint ventures as a means to foil opportunism
(Hennart, 1991; Oxley, 1997). Moreover, Allen and Phillips (2000) also showed in an empirical study that
firms obtain maximal benefits when they form alliances while making equity investments.
Partnering firms most often share costs and returns according to the terms specified in formal contracts
they set up at the beginning of their cooperation. However, due to uncertainties in the business environment,
firms typically are not able to include solutions to all possible contingencies that may arise relative to their
contracts, and so they leave numerous issues open for renegotiation, including the sharing or division of
returns. The theory of incomplete contracts (Grossman and Hart, 1986; Hart, 1988) points out that the
bargaining power of a firm in an economic exchange is determined by the assets it owns in the relationship.
From this point of view, ex ante property rights ought to determine the ex post allocation of returns when
unexpected situations occur. Therefore, in a strategic alliance between firms, the firms ought to be willing to
make a considerable investment in the shared assets if they expect high returns to flow from the cooperative
relationship.
Such practices are noted in an empirical study on biotechnology firms that made equity investments
while initiating joint research and development projects (Pisano, 1989). This gives them significant rights
over the new technologies and products coming out of the joint research and development efforts. Although
equity position is a frequently used mechanism in controlling opportunistic behavior, previous firm
experience with alliance will mitigate the need for partial ownership (Robinson and Stuart, 2000). Another
argument based on the theory of incomplete contracts is that in an interfirm coalition, the parties that are
indispensable to the relationship should own the assets that are important to them so that they have the
incentive to make investments in the coalition to maximize the total value of the coalition (Hart and Moore,
1990). In the context of electronic networks, Bakos and Nault (1997) have shown that optimal investment
levels can be achieved when firms that are indispensable to the network participate in the ownership of the
network asset.
In addition to partial ownership, exclusive contracts also turn out to be an effective means for protecting
relation-specific investment considering the incompleteness of interfirm contracts (Segal and Whinston,
2000). These arguments all shed some light on the structure of B2B e-market alliances.
B2B Electronic Markets and Digital Intermediation
The basic task of B2B e-markets is to enable firms to find desired products, suppliers and customers, or
to create markets on the Web (Dai and Kauffman, 2002). They either move the conventional markets to the
Web or open new marketplaces online which do not have offline counterparts. They also act as market-
making electronic intermediaries whose value lies in reducing search costs, increasing market liquidity,
offering transaction facilitation mechanisms and procurement expertise (Bailey and Bakos, 1997; Bakos,
1997; Chircu and Kauffman, 2001). In addition to market-making, B2B e-markets also perform another two
roles. The first role is to offer services and products for buyers and suppliers to manage interorganizational
processes and relationships, and the second one is to offer technology adaptation functionalities that
promote interoperability, systems integration and cost-effective connectivity between trading networks (Dai
and Kauffman, 2002). To fulfill these roles, B2B e-markets are building up resources and capabilities
through both organic growth and partnerships with other organizations.
B2B e-markets that operate on the Internet are relatively new organizational forms in business, and are
often perceived as startups. The implication of this perception is that their business models and capabilities
still need to be recognized and accepted in the marketplace. This is especially true in the recent post-
DotCom boom environment; today most businesses that are based on the Internet are perceived to be very
risky and the marketplace still is going through a shakeout. One way for B2B e-markets to win recognition
of their capabilities and value propositions as digital intermediaries is to build their reputation and signal
their quality through partnering with firms that have a strong reputation in the marketplace.
The emergence of B2B e-markets also has brought about new opportunities and challenges for the
industry groups that they are serving. For example, they provide new procurement and distribution channels
for the firms that manufacture or consume the products that are transacted over their online marketplaces.
And, they represent as a potential threat to traditional distributors serving the same industry groups, since
they enable firms to bypass the traditional intermediaries to transact directly online. In other words, they
bring new competition to the market contexts in which traditional intermediaries have competed.
B2B E-MARKET STRATEGIC ALLIANCE FORMATION, STRUCTURE AND OUTCOME
As new organizational forms in the rapidly changing environment of Internet commerce, B2B e-markets
need to accumulate resources and build their reputations so that they can “perfect“ their value-added services
and gain recognition in the marketplace. In addition to internal growth, cooperation with other organizations
offers an alternative way to achieve these capabilities. To understand how B2B e-markets employ alliance
strategies, we develop a conceptual model by applying the perspectives about alliances in general to B2B e-
markets, and propose related research hypotheses.
B2B E-Market Alliance Types
In the strategy literature (e.g., Pisano, 1989; Chan, Kensinger and Keown, 1997), strategic alliances are
often categorized according to the tasks that they accomplish. Some of these categories include: marketing
and distribution alliances, alliances for joint development of technology, technology transfer alliances, and
manufacturing alliances. Following this rationale, we propose four different kinds of B2B e-market alliance
types.
Marketing alliances permit B2B e-market firms to promote and distribute their services.
Participation alliances support the creation of cooperative relationships by B2B e-market firms with
other firms that buy and sell on their exchanges. We refer to them as such because the goal is to
ensure the participation of buyers and suppliers in the marketplace.
Functionality alliance allow B2B e-markets to cooperate with other firms to enhance the set of
functionalities that they offer to facilitate online transactions (Dai and Kauffman, 2002).
Connection alliances are those in which a B2B firm sets up linkages with partners so that partners’
clients can have integrated or preferred access to the electronic marketplaces that the B2B firm is
operating.
Table 1 provides an illustration of each of these, through announcements in the press. (See Table 1.)
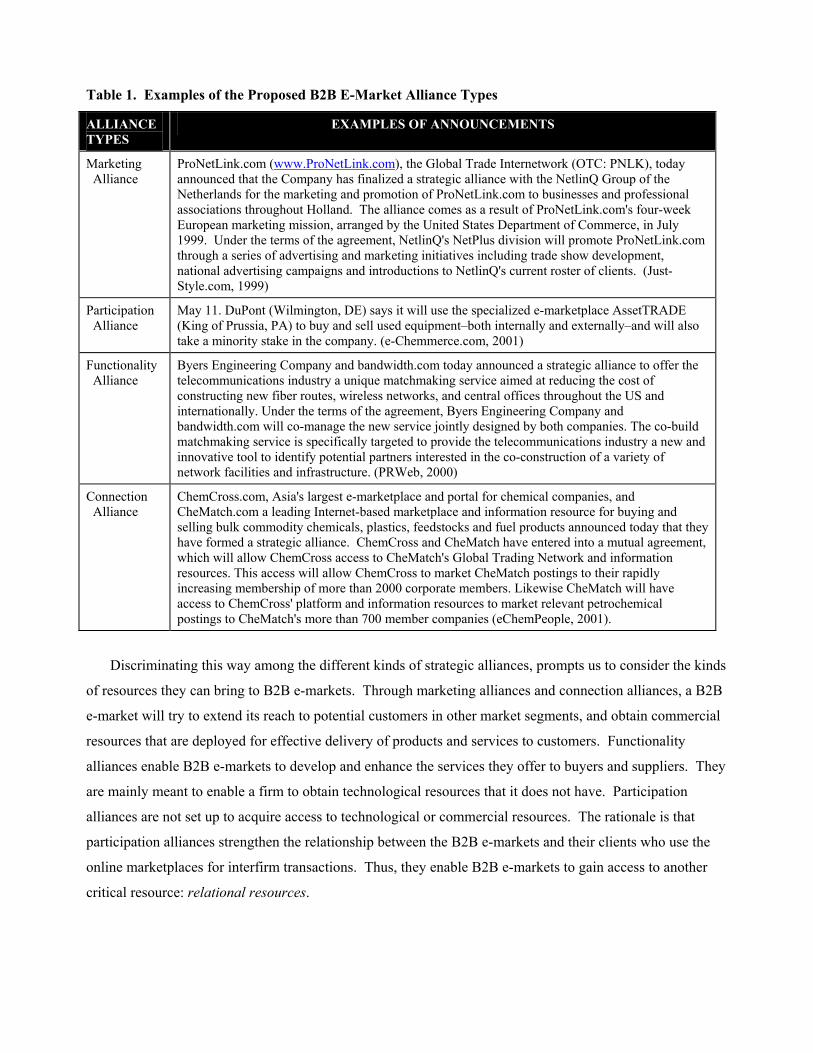
Table 1. Examples of the Proposed B2B E-Market Alliance Types
ALLIANCE TYPES
EXAMPLES OF ANNOUNCEMENTS
Marketing Alliance
ProNetLink.com (www.ProNetLink.com), the Global Trade Internetwork (OTC: PNLK), today announced that the Company has finalized a strategic alliance with the NetlinQ Group of the Netherlands for the marketing and promotion of ProNetLink.com to businesses and professional associations throughout Holland. The alliance comes as a result of ProNetLink.com's four-week European marketing mission, arranged by the United States Department of Commerce, in July 1999. Under the terms of the agreement, NetlinQ's NetPlus division will promote ProNetLink.com through a series of advertising and marketing initiatives including trade show development, national advertising campaigns and introductions to NetlinQ's current roster of clients. (Just-Style.com, 1999)
Participation Alliance
May 11. DuPont (Wilmington, DE) says it will use the specialized e-marketplace AssetTRADE (King of Prussia, PA) to buy and sell used equipment–both internally and externally–and will also take a minority stake in the company. (e-Chemmerce.com, 2001)
Functionality Alliance
Byers Engineering Company and bandwidth.com today announced a strategic alliance to offer the telecommunications industry a unique matchmaking service aimed at reducing the cost of constructing new fiber routes, wireless networks, and central offices throughout the US and internationally. Under the terms of the agreement, Byers Engineering Company and bandwidth.com will co-manage the new service jointly designed by both companies. The co-build matchmaking service is specifically targeted to provide the telecommunications industry a new and innovative tool to identify potential partners interested in the co-construction of a variety of network facilities and infrastructure. (PRWeb, 2000)
Connection Alliance
ChemCross.com, Asia's largest e-marketplace and portal for chemical companies, and CheMatch.com a leading Internet-based marketplace and information resource for buying and selling bulk commodity chemicals, plastics, feedstocks and fuel products announced today that they have formed a strategic alliance. ChemCross and CheMatch have entered into a mutual agreement, which will allow ChemCross access to CheMatch's Global Trading Network and information resources. This access will allow ChemCross to market CheMatch postings to their rapidly increasing membership of more than 2000 corporate members. Likewise CheMatch will have access to ChemCross' platform and information resources to market relevant petrochemical postings to CheMatch's more than 700 member companies (eChemPeople, 2001).
Discriminating this way among the different kinds of strategic alliances, prompts us to consider the kinds
of resources they can bring to B2B e-markets. Through marketing alliances and connection alliances, a B2B
e-market will try to extend its reach to potential customers in other market segments, and obtain commercial
resources that are deployed for effective delivery of products and services to customers. Functionality
alliances enable B2B e-markets to develop and enhance the services they offer to buyers and suppliers. They
are mainly meant to enable a firm to obtain technological resources that it does not have. Participation
alliances are not set up to acquire access to technological or commercial resources. The rationale is that
participation alliances strengthen the relationship between the B2B e-markets and their clients who use the
online marketplaces for interfirm transactions. Thus, they enable B2B e-markets to gain access to another
critical resource: relational resources.
Research Hypotheses
As our first effort to develop a formal understanding about the B2B e-market alliance strategies, we
look into alliance formation, alliance structure, and alliance outcomes, formulate research hypotheses.
Alliance Formation. In general, firms adopt cooperative strategies to achieve advantageous market
positions by obtaining complementary resources. Two sets of factors encourage a firm to develop external
linkages for growth. On the one hand, a firm will have the incentive to cooperate with another organization
when it can gain significant value from this joint effort; on the other hand, it is only able to find desirable
partners when it has shown that it too possesses the necessary resources that will attract partners (Ahuja,
2000). This general rule also may explain the differences among B2B e-markets in terms of how often they
are observed to form alliances.
In addition, we expect that B2B e-markets are more likely to try to leverage cooperation with other
organizations when such cooperation is perceived to be more beneficial than going it alone. As such, the
perceived value of strategic alliances should be a key driver of their formation. As new organizational forms,
B2B e-markets face the critical task of gaining acceptance of their business models and recognition for their
core competencies and capabilities. Since partnering with established firms is an effective means to enhance
reputation and signal product quality to potential customers (Rao and Ruekert, 1994), the need for market
recognition or legitimacy is likely to motivate B2B e-markets to enter into cooperative relationships. This is
especially true for B2B e-markets that were founded at the very early days of B2B e-commerce. Why?
Because they faced the challenges of opening up new markets for their innovative approaches to doing
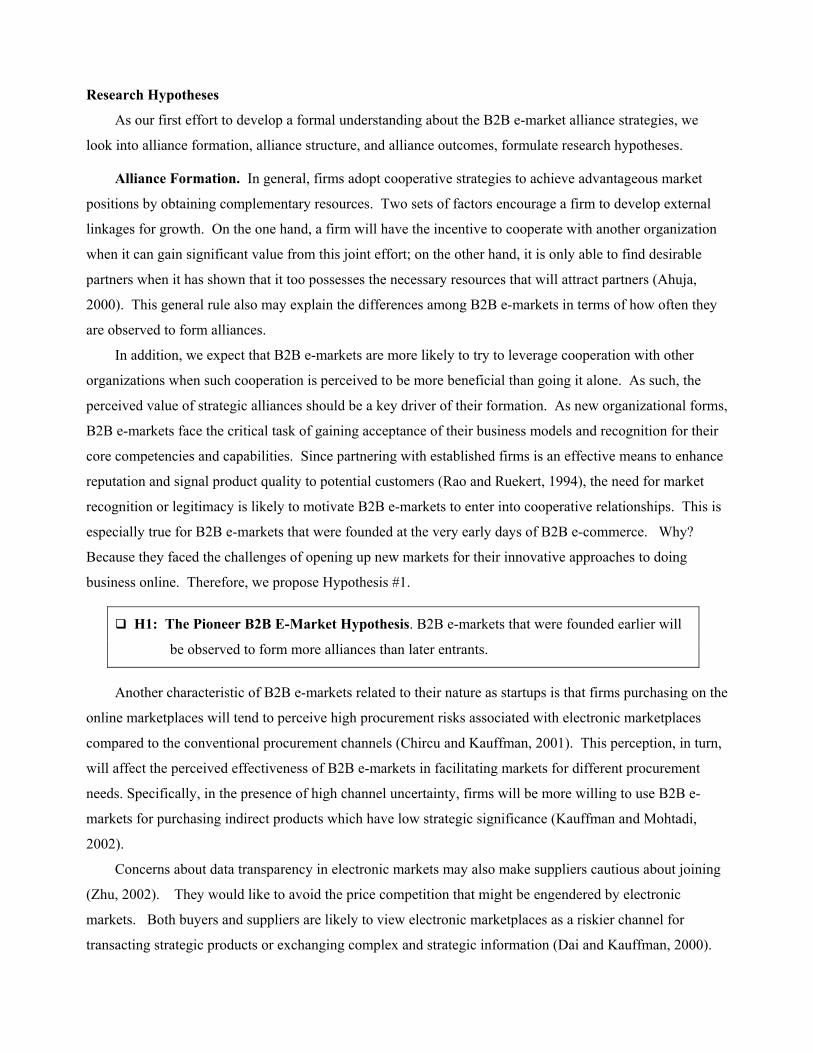
business online. Therefore, we propose Hypothesis #1.
H1: The Pioneer B2B E-Market Hypothesis. B2B e-markets that were founded earlier will
be observed to form more alliances than later entrants.
Another characteristic of B2B e-markets related to their nature as startups is that firms purchasing on the
online marketplaces will tend to perceive high procurement risks associated with electronic marketplaces
compared to the conventional procurement channels (Chircu and Kauffman, 2001). This perception, in turn,
will affect the perceived effectiveness of B2B e-markets in facilitating markets for different procurement
needs. Specifically, in the presence of high channel uncertainty, firms will be more willing to use B2B e-
markets for purchasing indirect products which have low strategic significance (Kauffman and Mohtadi,
2002).
Concerns about data transparency in electronic markets may also make suppliers cautious about joining
(Zhu, 2002). They would like to avoid the price competition that might be engendered by electronic
markets. Both buyers and suppliers are likely to view electronic marketplaces as a riskier channel for
transacting strategic products or exchanging complex and strategic information (Dai and Kauffman, 2000).
Thus, we believe that B2B e-markets will face more challenges and uncertainties in gaining recognition and
achieving critical mass adoption when they are serving buyers and suppliers who are involved in large-scale
or strategic transactions or products. When this is the case, we argue, e-market firms will have greater
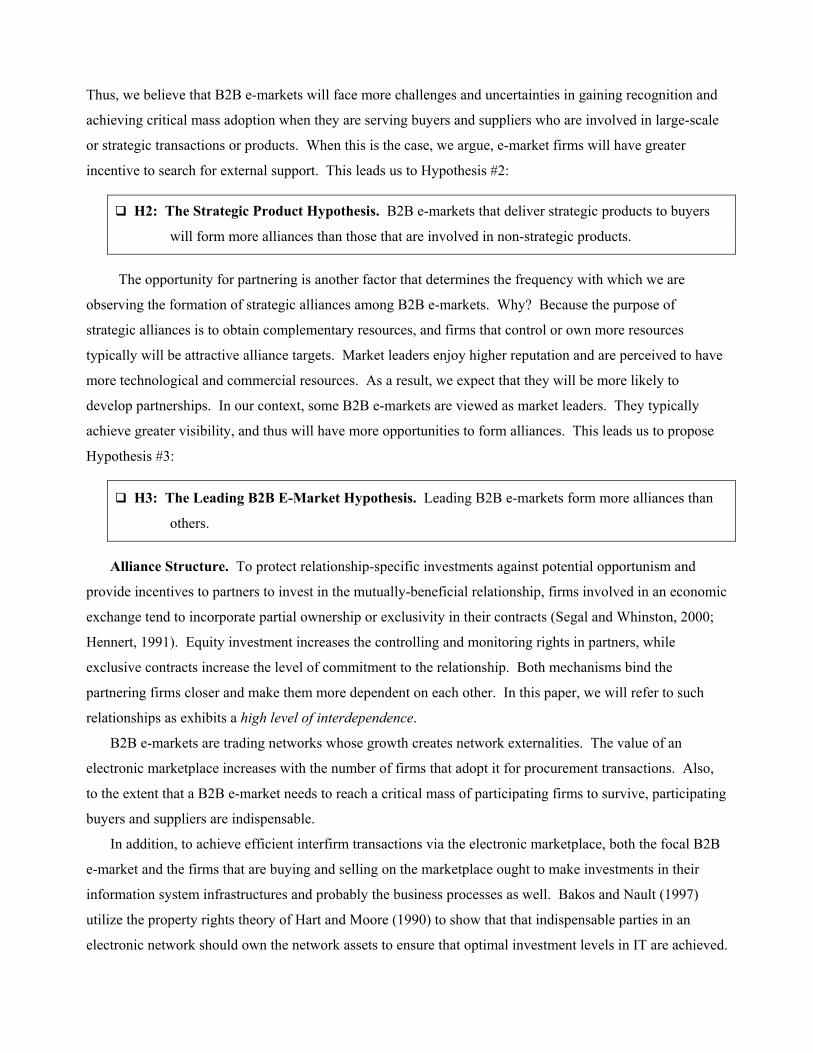
incentive to search for external support. This leads us to Hypothesis #2:
H2: The Strategic Product Hypothesis. B2B e-markets that deliver strategic products to buyers
will form more alliances than those that are involved in non-strategic products.
The opportunity for partnering is another factor that determines the frequency with which we are
observing the formation of strategic alliances among B2B e-markets. Why? Because the purpose of
strategic alliances is to obtain complementary resources, and firms that control or own more resources
typically will be attractive alliance targets. Market leaders enjoy higher reputation and are perceived to have
more technological and commercial resources. As a result, we expect that they will be more likely to
develop partnerships. In our context, some B2B e-markets are viewed as market leaders. They typically
achieve greater visibility, and thus will have more opportunities to form alliances. This leads us to propose
Hypothesis #3:
H3: The Leading B2B E-Market Hypothesis. Leading B2B e-markets form more alliances than
others.
Alliance Structure. To protect relationship-specific investments against potential opportunism and
provide incentives to partners to invest in the mutually-beneficial relationship, firms involved in an economic
exchange tend to incorporate partial ownership or exclusivity in their contracts (Segal and Whinston, 2000;
Hennert, 1991). Equity investment increases the controlling and monitoring rights in partners, while
exclusive contracts increase the level of commitment to the relationship. Both mechanisms bind the
partnering firms closer and make them more dependent on each other. In this paper, we will refer to such
relationships as exhibits a high level of interdependence.
B2B e-markets are trading networks whose growth creates network externalities. The value of an
electronic marketplace increases with the number of firms that adopt it for procurement transactions. Also,
to the extent that a B2B e-market needs to reach a critical mass of participating firms to survive, participating
buyers and suppliers are indispensable.
In addition, to achieve efficient interfirm transactions via the electronic marketplace, both the focal B2B
e-market and the firms that are buying and selling on the marketplace ought to make investments in their
information system infrastructures and probably the business processes as well. Bakos and Nault (1997)
utilize the property rights theory of Hart and Moore (1990) to show that that indispensable parties in an
electronic network should own the network assets to ensure that optimal investment levels in IT are achieved.
The electronic linkage between a firm and a B2B e-market for integrating their systems and streamlining
business processes is often customized for a particular relationship and cannot be switched for other
applications easily. As a result, the related IT investments are relationship-specific. As a result, we expect
that the relationship between a B2B e-market and a participating firm will exhibit a relatively high level of
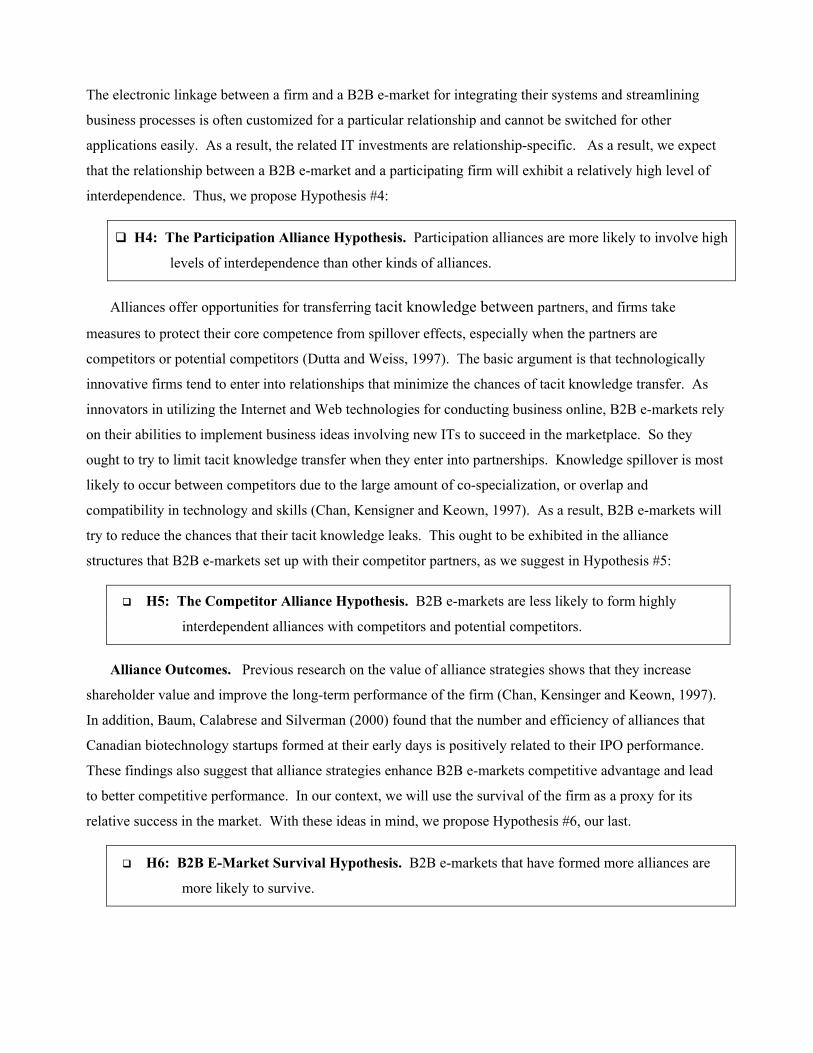
interdependence. Thus, we propose Hypothesis #4:
H4: The Participation Alliance Hypothesis. Participation alliances are more likely to involve high
levels of interdependence than other kinds of alliances.
Alliances offer opportunities for transferring tacit knowledge between partners, and firms take
measures to protect their core competence from spillover effects, especially when the partners are
competitors or potential competitors (Dutta and Weiss, 1997). The basic argument is that technologically
innovative firms tend to enter into relationships that minimize the chances of tacit knowledge transfer. As
innovators in utilizing the Internet and Web technologies for conducting business online, B2B e-markets rely
on their abilities to implement business ideas involving new ITs to succeed in the marketplace. So they
ought to try to limit tacit knowledge transfer when they enter into partnerships. Knowledge spillover is most
likely to occur between competitors due to the large amount of co-specialization, or overlap and
compatibility in technology and skills (Chan, Kensigner and Keown, 1997). As a result, B2B e-markets will
try to reduce the chances that their tacit knowledge leaks. This ought to be exhibited in the alliance
structures that B2B e-markets set up with their competitor partners, as we suggest in Hypothesis #5:
H5: The Competitor Alliance Hypothesis. B2B e-markets are less likely to form highly
interdependent alliances with competitors and potential competitors.
Alliance Outcomes. Previous research on the value of alliance strategies shows that they increase
shareholder value and improve the long-term performance of the firm (Chan, Kensinger and Keown, 1997).
In addition, Baum, Calabrese and Silverman (2000) found that the number and efficiency of alliances that
Canadian biotechnology startups formed at their early days is positively related to their IPO performance.
These findings also suggest that alliance strategies enhance B2B e-markets competitive advantage and lead
to better competitive performance. In our context, we will use the survival of the firm as a proxy for its
relative success in the market. With these ideas in mind, we propose Hypothesis #6, our last.
H6: B2B E-Market Survival Hypothesis. B2B e-markets that have formed more alliances are
more likely to survive.

DATA COLLECTION AND VARIABLES
We next present an overview of data collection, measurement issues and descriptive statistics for the
variables in the study that we will use to test the theory discussed earlier.
Data Collection
To study the research issues, we collected data from Thomson Financial’s (www.tfn.com) Joint
Venture/Strategic Alliances database. This database provides a “one-stop” information source for publicly-
available announcements, including SEC filings, trade publications and international counterparts, and news
wire sources. This database is populated by announcements that Thomson financial collected using such
keywords as “alliance”, “manufacturing agreements”, “marketing agreements,” “licensing agreements,” and
other related terms.
Data Set and Unit of Observation. We retrieved data entries from January 1995 to February 2002
which at least one participant had an e-commerce business line, or alliance activities were reported in the e-
commerce area. This generated 6,241 entries. We filtered these in two steps, retaining alliance
announcements with at least one participating firm that was operating a B2B e-market. Our selection
criteria involved assessments of the database’s business description for alliance participants and company
Web sites’ business descriptions. After we completed filtering the data, 426 entries remained. We then
supplemented the Thomson Financial data with Lexis-Nexis (www.lexisnexis.com) information on the same
alliance announcements, and retained those data with entries in both databases. We also checked the
business descriptions for the firms to assess whether each could be reasonably claimed to be a B2B e-market.
This process resulted in 332 alliance entries, involving 200 different B2B e-markets.
The unit of observation in our sample is a strategic alliance event that is initiated by a business
establishment and is accompanied by an identifiable announcement or news item that describes the contents
of the alliance. A business establishment can be a company, a branch or subsidiary of a firm. For example,
Getthere LP (www.getthere.com), a specialist in the area of travel procurement software solutions, operates a
B2B e-market and is wholly owned by Sabre Holdings (www.sabre.com). We treat Getthere LP as a
business establishment, and include its announcements in our data set, in spite of its wholly-owned
subsidiary status. In contrast, SciQuest (www.sciquest.com), which offers Internet-based procurement
solutions to pharmaceutical, biotechnology and other research-based organizations in the life sciences
industry, runs its own online marketplace. So it is also included in our data set.
Identification of Market Characteristics. To identify and evaluate relevant characteristics of B2B e-
markets and their partnering firms, we compiled data from various sources. For public traded firms, we
collected data from the Mergent FIS online database (www.fisonline.com). For private firms, we used
company Web sites, the Lexis-Nexis database, and the United States Patent and Trademark Office’s
(USPTO) “TESS” Trademark Electronic Search System (tess.uspto.gov). Using these data, we coded the
characteristics of B2B e-markets and partnering firms (e.g., year B2B e-market was founded, and product
types transacted). The details about variable definition and measurement are described in the following
subsection.
Coding of Variables.
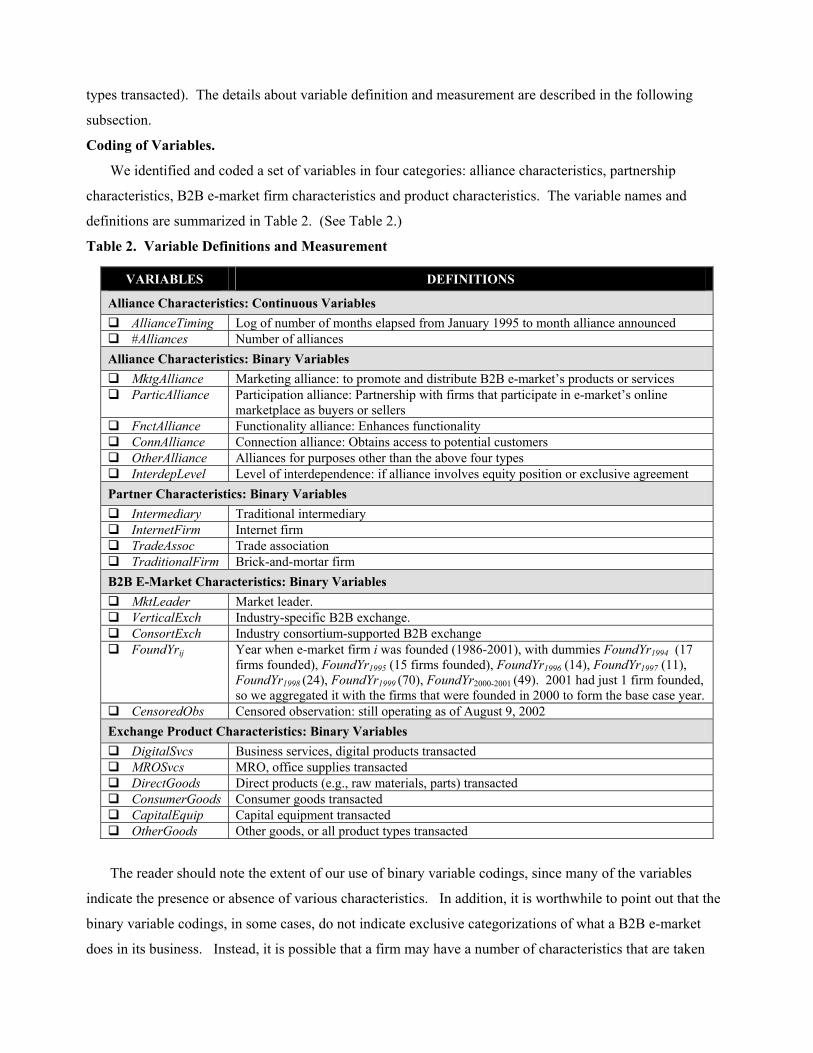
We identified and coded a set of variables in four categories: alliance characteristics, partnership
characteristics, B2B e-market firm characteristics and product characteristics. The variable names and
definitions are summarized in Table 2. (See Table 2.)
Table 2. Variable Definitions and Measurement
VARIABLES DEFINITIONS
Alliance Characteristics: Continuous Variables AllianceTiming Log of number of months elapsed from January 1995 to month alliance announced #Alliances Number of alliances
Alliance Characteristics: Binary Variables MktgAlliance Marketing alliance: to promote and distribute B2B e-market’s products or services ParticAlliance Participation alliance: Partnership with firms that participate in e-market’s online
marketplace as buyers or sellers FnctAlliance Functionality alliance: Enhances functionality ConnAlliance Connection alliance: Obtains access to potential customers OtherAlliance Alliances for purposes other than the above four types InterdepLevel Level of interdependence: if alliance involves equity position or exclusive agreement
Partner Characteristics: Binary Variables Intermediary Traditional intermediary InternetFirm Internet firm TradeAssoc Trade association TraditionalFirm Brick-and-mortar firm
B2B E-Market Characteristics: Binary Variables MktLeader Market leader. VerticalExch Industry-specific B2B exchange. ConsortExch Industry consortium-supported B2B exchange FoundYrij Year when e-market firm i was founded (1986-2001), with dummies FoundYr1994 (17
firms founded), FoundYr1995 (15 firms founded), FoundYr1996 (14), FoundYr1997 (11), FoundYr1998 (24), FoundYr1999 (70), FoundYr2000-2001 (49). 2001 had just 1 firm founded, so we aggregated it with the firms that were founded in 2000 to form the base case year.
CensoredObs Censored observation: still operating as of August 9, 2002 Exchange Product Characteristics: Binary Variables DigitalSvcs Business services, digital products transacted MROSvcs MRO, office supplies transacted DirectGoods Direct products (e.g., raw materials, parts) transacted ConsumerGoods Consumer goods transacted CapitalEquip Capital equipment transacted OtherGoods Other goods, or all product types transacted
The reader should note the extent of our use of binary variable codings, since many of the variables
indicate the presence or absence of various characteristics. In addition, it is worthwhile to point out that the
binary variable codings, in some cases, do not indicate exclusive categorizations of what a B2B e-market
does in its business. Instead, it is possible that a firm may have a number of characteristics that are taken
from among a group of variables. This permits us to include binary variables without specifying a “base
case,” as is typical when there are a number of different coding categories.
The Alliance Characteristics data are both continuous and binary measures. The continuous variable,
AllianceTiming, represents when the alliance was announced publicly, and its value is the log of the number
of months elapsed from January 1995 to the month when the alliance was announced. The starting month of
January 1995 was determined based on the overall coverage of our data set. InterdepLevel is the level of
interdependence between the partnering firms, and is one of the key variables that we will use to test our
theory. We coded it with a “1” if the alliance involves equity investment or exclusive agreement, and “0”
otherwise. When equity investment or exclusive agreements are present, they indicate a high level of
interdependence. With this approach, the partnering firms are able to assert more control and demonstrate
greater commitment to their mutual relationships. #Alliances is the total of alliances that a B2B e-market
forms during the time period of our study, from January 1995 up to February 2002.
Our codings for the alliance types discussed earlier in this paper are all binary. MktgAlliance codes for
whether the alliance aims to promote and distribute the B2B e-market’s products and services. The key
phrases that we used for identifying marketing alliances were “marketing agreement,” “joint marketing and
sales,” and “jointly market and distribute,” among others. With the search tools that we used, it is also
possible to do the typical searches that search engines support, such as “+joint +marketing +alliance,” to
require each of the three words to be present in the output to a query. ParticAlliance codes for whether the
B2B e-market obtains a participant in its online marketplace through this alliance. The key phrases that we
used for coding this variable are roughly as follows: “(Firm A) will use (firm B’s) marketplace to buy (sell),”
“(Firm A) chooses (Firm B) as its online provider,” and so on. Precise queries were not easy, but practice
with the tools permitted us to develop a reasonable level of assurance that we were capturing most of the
necessary strategic alliance announcements of this type.
FnctAlliance was coded with a “1” for instances in which the B2B e-market announced the enhancement
of service capabilities and functionality in facilitating the market, supporting relationship and process
management between buyers and suppliers, and/or improving its technology infrastructures, and “0”
otherwise. The key phrases for the announcement search queries included “jointly develop (service),”
“create new function,” “create new service,” “add new offering,” and other combinations of these general
query terms. Finally, ConnAlliance codes for B2B e-markets that tried to extend their reach to potential
users through increased connectivity. Key phrases for search included language similar to the following:
“(alliance) gives the customers direct access to (firm B),” “integrate (firm A system) with (firm B system),”
“improve access to customers,” and so on. Although these four types cover most of the alliance tasks, there
are other purposes for alliances, and we use OtherAlliance to represent them.
There are four Partner Characteristics variables, all of which are coded 0/1. Intermediary indicates if
the partner of the B2B e-market is a conventional intermediary. InternetFirm codes for whether the partner

conducts its major value-added activities on the Internet and Web. This includes Internet commerce firms
that conduct business over the Internet and also Internet service firms that make the Internet itself and the
business conducted through it possible (e.g., Dow Jones Internet Index, www.djindexes.com/jsp/iiFaq.jsp).
TradeAssoc is an indicator to show if the partner is a not-for-profit trade association. TraditionalFirm
indicates if the partner is a brick-and-mortar company. It has a value of “1” if the partner conducts its major
value-added activities offline; otherwise it is “0”. According to this coding, a partner firm must fall into one
and only one type among the following three: InternetFirm, TradeAssoc, and TraditionalFirm. However, a
traditional firm can also be an intermediary.
The next group of binary variables, B2B E-Market Variables, is intended to capture information about
the B2B e-markets, but unrelated to their strategic alliances. MktLeader indicates if the B2B e-market is a
market leader as so designated by Forbes magazine’s “Best-of-the-Web” B2B directories for 2000 and 2001
(available at www.forbes.com/bow/). This is a directory of firms that industry experts perceived as most
promising or active, based on their strategy, execution, and financial status. To qualify for this designation in
our data set, the firm had to be listed in either of the two years. We use the next subset of variables to
characterize the exchange activities of the B2B e-market firm. VerticalExch indicates whether the B2B e-
market serves a specific industry or a specific business function, which defines it as a vertical exchange.
ConsortExch codes for whether the B2B e-market was initiated and backed up by an industry consortium.
We also distinguished among the B2B e-market firms in terms of when they were established or founded
through the variable, FoundYr. The fact is that many B2B e-market firms failed during the time period that
our data covered, however, some did not and continue to operate even today. To capture this information,
we included another 0/1 variable, CensoredObs, to indicate if the B2B e-market was still operating as August
9, 2002, when we last checked its operational status.
The final set of variables that we consider represent the kind of e-procurement activities that a B2B e-
market firm is handling, that is, its Exchange Product Characteristics. DigitalSvcs is coded with a “1” if the
product transacted on the electronic marketplace is business services or information products, and with a “0”
otherwise. MROSvcs indicates that a B2B e-market serves a marketplace for purchasing maintenance, repair
and operation (MRO) services and products, or office products. DirectGoods codes for whether there are
buyers on the e-marketplace who purchase their raw materials, parts, and/or components that go into their
own manufacturing and production processes. ConsumerGoods indicates that the B2B e-market has buyers
who purchase goods that they resell to consumers. CapitalEquip denotes that firms on the e-marketplace
purchase and/or sell equipment to balance their inventory. Finally, OtherGoods indicates B2B e-markets that
do not specify the types of goods that can be transacted on their marketplace, or that allow firms to transact
any types of goods.
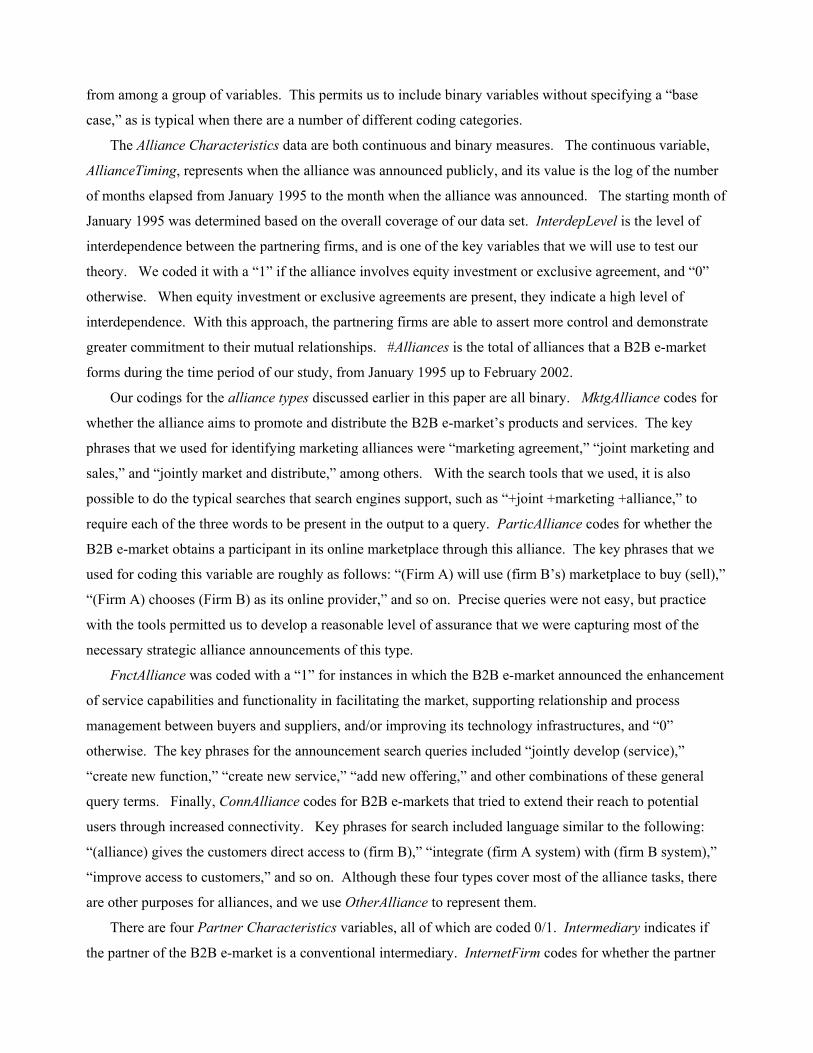
Description of the Data Set
In our data set, there are 200 B2B e-markets, among which 71 or 36% are market leaders that are listed
in Forbes’ “Best of Web” directories. The majority, 68%, of the B2B e-markets are vertical exchanges. The
distribution of the founding years of the B2B e-markets is shown in Table 3.
Table 3. Distribution of B2B E-markets by Year Founded
Year Founded Number of B2B E-markets Before 1995 17
1995 15 1996 14 1997 11 1998 24 1999 70 2000 48 2001 1 Total 200
Many B2B e-markets serve more than one product type. Table 3 shows the breakdown of B2B e-
markets by the product types that are transacted. (See Table 4.)
Table 4. Distribution of B2B E-Markets by Product Type
Product Type Number of B2B E-markets Business services, digital products (DigitalSvcs) 74 Direct products (DirectGoods) 84 Consumer goods (ConsumerGoods) 21 MRO and office supplies (MROSvcs) 38 Capital equipment (CapitalEquip) 14
In total, we identified 353 strategic alliance events in our data set. Among these, 31 alliances had three
partners listed in their announcements. To maintain some explanatory consistency in our modeling, we
chose to eliminate those alliances with three partners; only bilateral alliances are included. This yielded 332
usable strategic alliances in our data set. The distribution of the alliances over the years of the study is
summarized in Table 5. (See Table 5.)
Table 5. Distribution of Alliances by Year
Year Number of Alliance Events 1998 4 1999 30 2000 218 2001 75 2002 5 Total 332
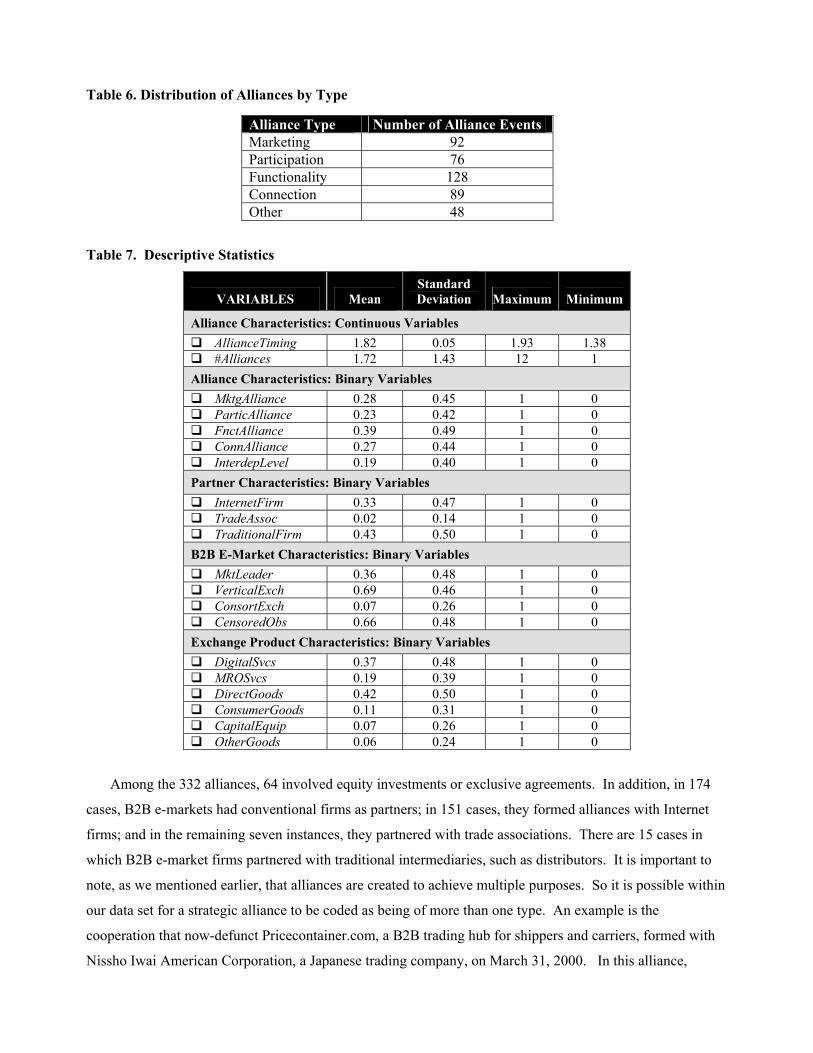
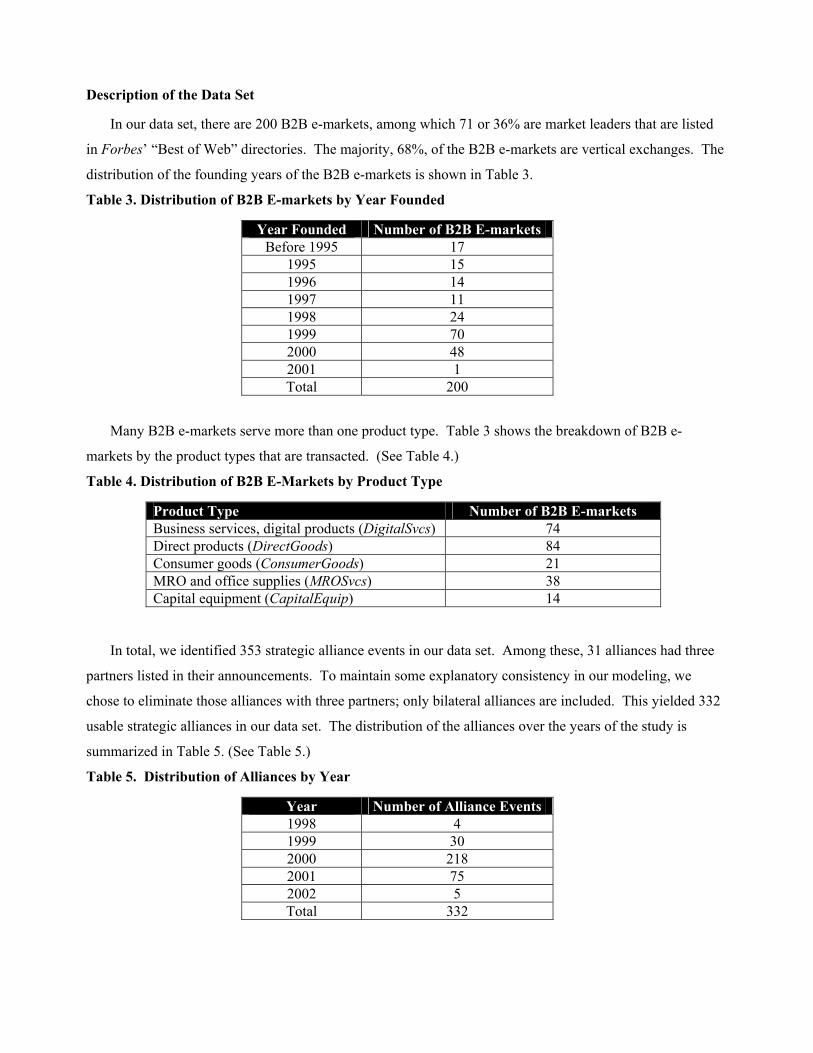
Table 6. Distribution of Alliances by Type
Alliance Type Number of Alliance Events Marketing 92 Participation 76 Functionality 128 Connection 89 Other 48
Table 7. Descriptive Statistics
VARIABLES Mean Standard Deviation Maximum Minimum
Alliance Characteristics: Continuous Variables AllianceTiming 1.82 0.05 1.93 1.38 #Alliances 1.72 1.43 12 1
Alliance Characteristics: Binary Variables MktgAlliance 0.28 0.45 1 0 ParticAlliance 0.23 0.42 1 0 FnctAlliance 0.39 0.49 1 0 ConnAlliance 0.27 0.44 1 0 InterdepLevel 0.19 0.40 1 0
Partner Characteristics: Binary Variables InternetFirm 0.33 0.47 1 0 TradeAssoc 0.02 0.14 1 0 TraditionalFirm 0.43 0.50 1 0
B2B E-Market Characteristics: Binary Variables MktLeader 0.36 0.48 1 0 VerticalExch 0.69 0.46 1 0 ConsortExch 0.07 0.26 1 0 CensoredObs 0.66 0.48 1 0
Exchange Product Characteristics: Binary Variables DigitalSvcs 0.37 0.48 1 0 MROSvcs 0.19 0.39 1 0 DirectGoods 0.42 0.50 1 0 ConsumerGoods 0.11 0.31 1 0 CapitalEquip 0.07 0.26 1 0 OtherGoods 0.06 0.24 1 0
Among the 332 alliances, 64 involved equity investments or exclusive agreements. In addition, in 174
cases, B2B e-markets had conventional firms as partners; in 151 cases, they formed alliances with Internet
firms; and in the remaining seven instances, they partnered with trade associations. There are 15 cases in
which B2B e-market firms partnered with traditional intermediaries, such as distributors. It is important to
note, as we mentioned earlier, that alliances are created to achieve multiple purposes. So it is possible within
our data set for a strategic alliance to be coded as being of more than one type. An example is the
cooperation that now-defunct Pricecontainer.com, a B2B trading hub for shippers and carriers, formed with
Nissho Iwai American Corporation, a Japanese trading company, on March 31, 2000. In this alliance,
Nissho Iwai American Corporation indicated that it would use Pricecontainer.com for its transaction
logistics, as well as to promote the online marketplace to its own clients. According to our coding scheme,
this partnership is both a participation alliance and a marketing one. Table 6 shows the number of strategic
alliances for each type. (See Table 6.) In accordance with our theory of “value proposition perfection” of
B2B e-market intermediation services presented here and in Dai and Kauffman (2002), we note that the
largest number of strategic alliances emphasize the expansion of market service functionality, followed by
marketing and connection alliances. Finally, we summarize the descriptive statistics for the data set in Table
7.
EMPIRICAL ANALYSIS APPROACH AND METHODOLOGY
We employ a three-step econometric analysis process to test our hypotheses on strategic alliance
formation, alliance structure and alliance outcomes in this research.
Step 1: A Poisson Regression Model for Count Data Analysis of Alliance Formation
To analyze strategic alliance formation related to Hypotheses #1, #2 and #3, we examine B2B e-markets’
motivation and opportunities to enter into such cooperative relationships. Our unit of analysis is at the B2B
e-market firm level. We code #Alliances as the dependent variable. In our B2B e-market context, alliance
announcements are events that occur discretely and infrequently, leading to a limited-dependent variable.
There are numerous models that deal with limited-dependent variables (Maddala, 1993). Among them, the
Poisson model is appropriate in situations where the dependent variable is a count or frequency of
occurrence, and large counts are rare (Cameron and Trivedi, 1986; Winkelmann and Zimmermann, 1995).
Since the total number of alliances that a firm forms indicates the combined effects of its motivation and
opportunities to employ partnering strategies, we analyze our data using a Poisson regression model
(Gourieroux and Magnac, 1997; Greene, 2000; Trivedi, 1977, Winkelmann, 1997). Because they also can be
safely assumed to occur independently as well, the Poisson count data regression model is an appropriate test
methodology (Cameron and Trivedi, 1998). Based on this choice, we then will assume that the occurrence of
discrete alliance announcement events follow a Poisson distribution:
!)Pr(
i
yi
i ye
yYii λλ−
== , (1)
where yi is the number of alliances (#Alliances) that B2B e-market firm i formed during the sample period.
In the above expression, λi generally is a log-linear link function of explanatory variables with
log λi = β’ Xi . In this model, Xi is the vector of explanatory variables for firm i’s alliance choices and the β
’s are the parameters to be estimated in the model. In our context, we have selected explanatory variables in
the vector Xi that will proxy for pioneering B2B e-markets, strategic products, and market leaders. The year
that a B2B e-market was founded (coded as FoundYr) indicates if the firm is an early-to-enter B2B e-market.
Our reasoning behind this is that the Internet was already becoming commercialized as long ago as 1995.
The vanguard DotCom firms, including Amazon.com, eBay, and Chemdex, emerged around then, and have
been widely perceived as the archetypal pioneers in e-commerce. As a result, B2B e-markets that were
founded in the year 1995 or earlier are considered to be pioneers.
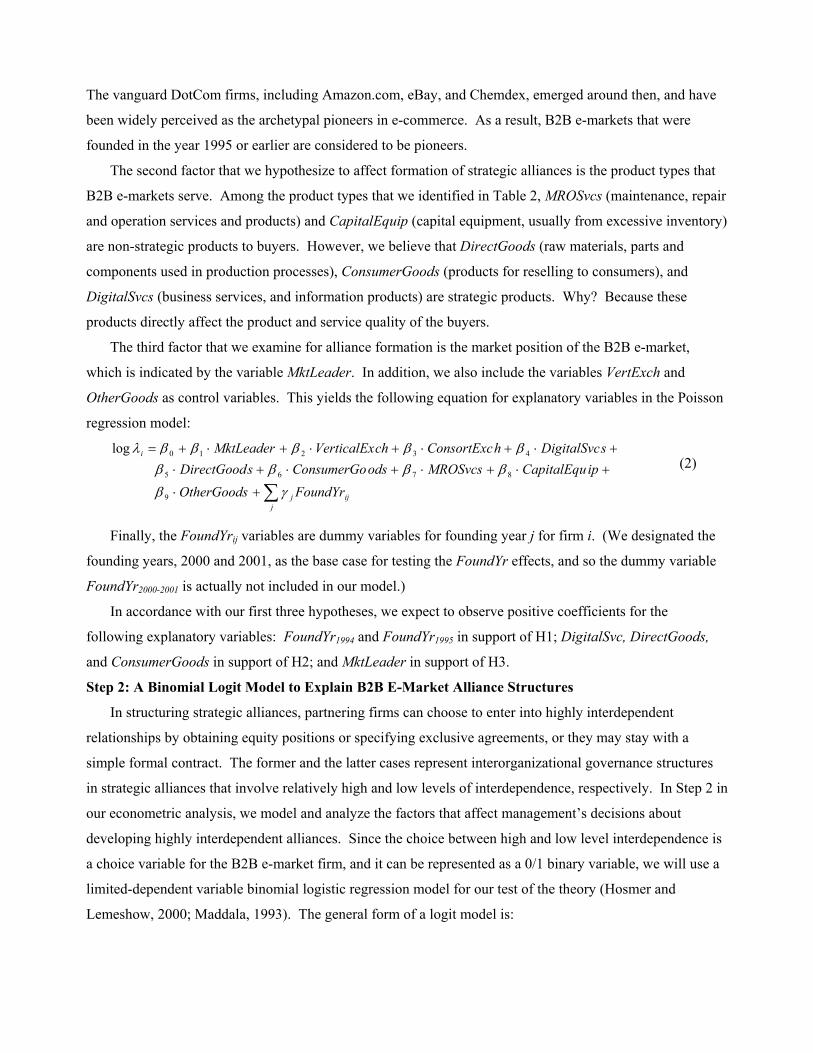
The second factor that we hypothesize to affect formation of strategic alliances is the product types that
B2B e-markets serve. Among the product types that we identified in Table 2, MROSvcs (maintenance, repair
and operation services and products) and CapitalEquip (capital equipment, usually from excessive inventory)
are non-strategic products to buyers. However, we believe that DirectGoods (raw materials, parts and
components used in production processes), ConsumerGoods (products for reselling to consumers), and
DigitalSvcs (business services, and information products) are strategic products. Why? Because these
products directly affect the product and service quality of the buyers.
The third factor that we examine for alliance formation is the market position of the B2B e-market,
which is indicated by the variable MktLeader. In addition, we also include the variables VertExch and
OtherGoods as control variables. This yields the following equation for explanatory variables in the Poisson
regression model:
∑+⋅
+⋅+⋅+⋅+⋅+⋅+⋅+⋅+⋅+=
jijj
i
FoundYrOtherGoodsipCapitalEquMROSvcsodsConsumerGosDirectGood
sDigitalSvchConsortExcchVerticalExMktLeader
γβ
βββββββββλ
9
8765
43210
log (2)
Finally, the FoundYrij variables are dummy variables for founding year j for firm i. (We designated the
founding years, 2000 and 2001, as the base case for testing the FoundYr effects, and so the dummy variable
FoundYr2000-2001 is actually not included in our model.)
In accordance with our first three hypotheses, we expect to observe positive coefficients for the
following explanatory variables: FoundYr1994 and FoundYr1995 in support of H1; DigitalSvc, DirectGoods,
and ConsumerGoods in support of H2; and MktLeader in support of H3.
Step 2: A Binomial Logit Model to Explain B2B E-Market Alliance Structures
In structuring strategic alliances, partnering firms can choose to enter into highly interdependent
relationships by obtaining equity positions or specifying exclusive agreements, or they may stay with a
simple formal contract. The former and the latter cases represent interorganizational governance structures
in strategic alliances that involve relatively high and low levels of interdependence, respectively. In Step 2 in
our econometric analysis, we model and analyze the factors that affect management’s decisions about
developing highly interdependent alliances. Since the choice between high and low level interdependence is
a choice variable for the B2B e-market firm, and it can be represented as a 0/1 binary variable, we will use a
limited-dependent variable binomial logistic regression model for our test of the theory (Hosmer and
Lemeshow, 2000; Maddala, 1993). The general form of a logit model is:
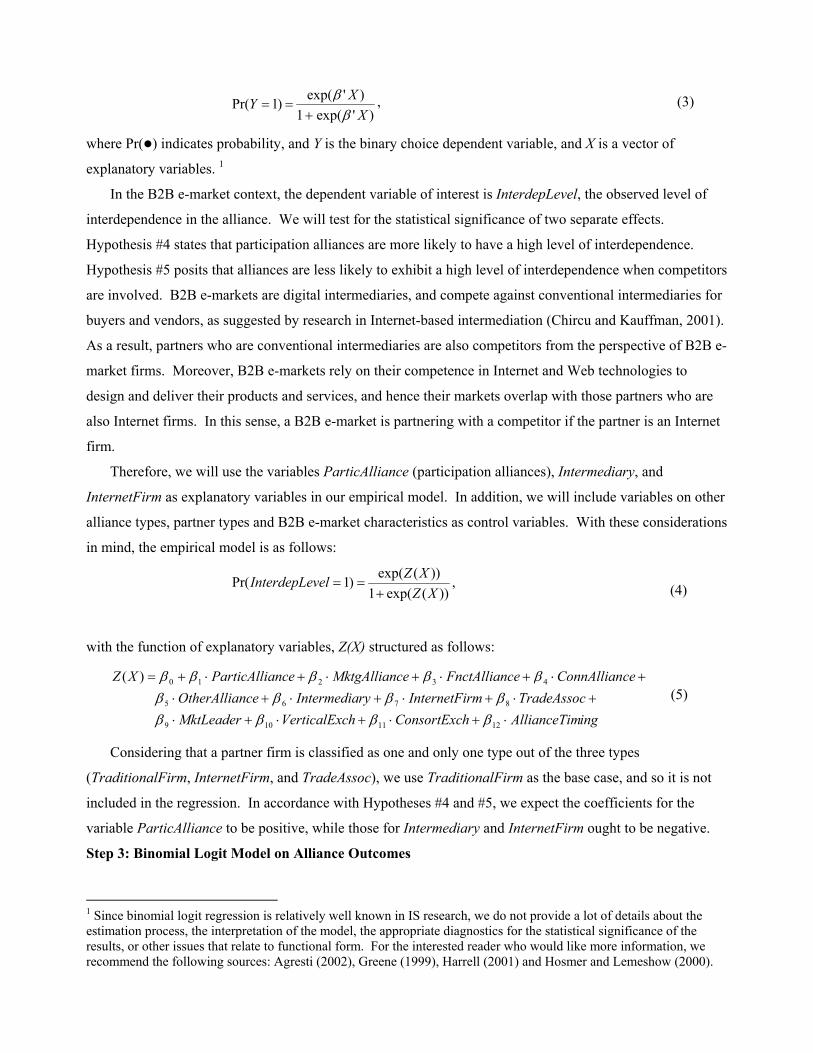
)'exp(1)'exp()1Pr(X
XYβ
β+
== , (3)
where Pr( ) indicates probability, and Y is the binary choice dependent variable, and X is a vector of
explanatory variables. 1
In the B2B e-market context, the dependent variable of interest is InterdepLevel, the observed level of
interdependence in the alliance. We will test for the statistical significance of two separate effects.
Hypothesis #4 states that participation alliances are more likely to have a high level of interdependence.
Hypothesis #5 posits that alliances are less likely to exhibit a high level of interdependence when competitors
are involved. B2B e-markets are digital intermediaries, and compete against conventional intermediaries for
buyers and vendors, as suggested by research in Internet-based intermediation (Chircu and Kauffman, 2001).
As a result, partners who are conventional intermediaries are also competitors from the perspective of B2B e-
market firms. Moreover, B2B e-markets rely on their competence in Internet and Web technologies to
design and deliver their products and services, and hence their markets overlap with those partners who are
also Internet firms. In this sense, a B2B e-market is partnering with a competitor if the partner is an Internet
firm.
Therefore, we will use the variables ParticAlliance (participation alliances), Intermediary, and
InternetFirm as explanatory variables in our empirical model. In addition, we will include variables on other
alliance types, partner types and B2B e-market characteristics as control variables. With these considerations
in mind, the empirical model is as follows:
,))(exp(1
))(exp()1Pr(XZ
XZvelInterdepLe+
== (4)
with the function of explanatory variables, Z(X) structured as follows:
ingmAllianceTihConsortExcchVerticalExMktLeaderTradeAssocrmInternetFiryIntermedianceOtherAllia
ceConnAllianceFnctAllianceMktgAlliananceParticAlliXZ
⋅+⋅+⋅+⋅+⋅+⋅+⋅+⋅
+⋅+⋅+⋅+⋅+=
1211109
8765
43210
)(
ββββββββ
βββββ (5)
Considering that a partner firm is classified as one and only one type out of the three types
(TraditionalFirm, InternetFirm, and TradeAssoc), we use TraditionalFirm as the base case, and so it is not
included in the regression. In accordance with Hypotheses #4 and #5, we expect the coefficients for the
variable ParticAlliance to be positive, while those for Intermediary and InternetFirm ought to be negative.
Step 3: Binomial Logit Model on Alliance Outcomes
1 Since binomial logit regression is relatively well known in IS research, we do not provide a lot of details about the estimation process, the interpretation of the model, the appropriate diagnostics for the statistical significance of the results, or other issues that relate to functional form. For the interested reader who would like more information, we recommend the following sources: Agresti (2002), Greene (1999), Harrell (2001) and Hosmer and Lemeshow (2000).
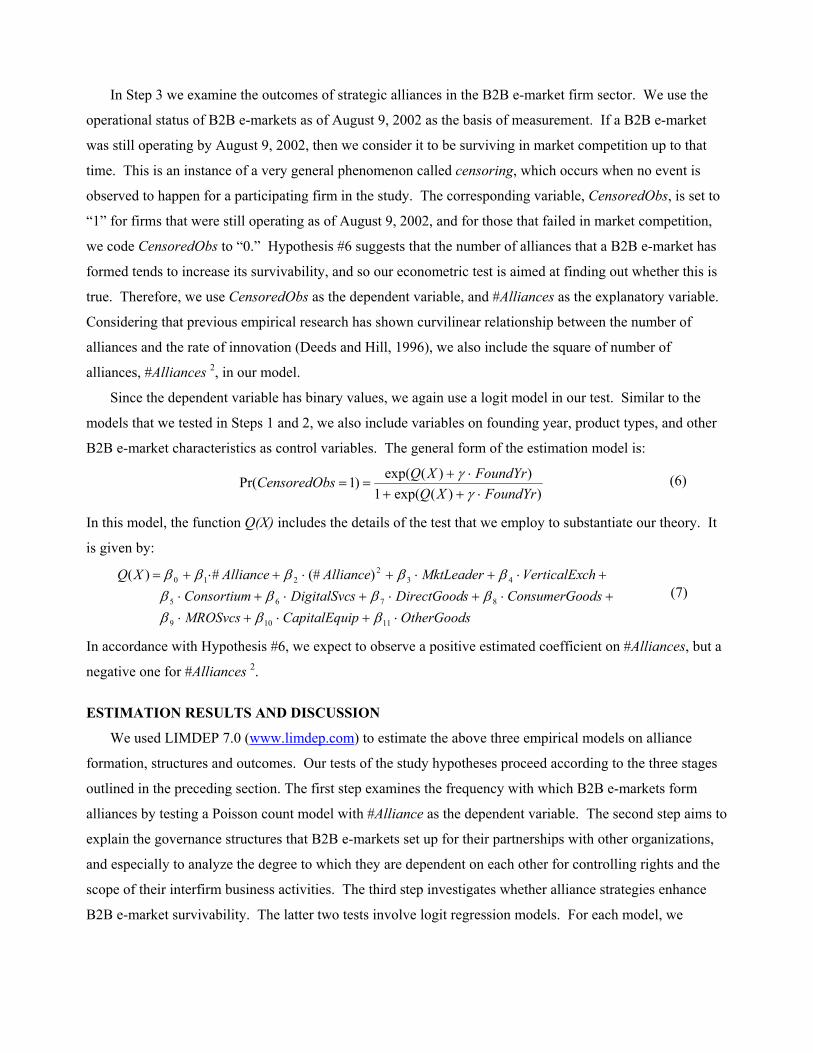
In Step 3 we examine the outcomes of strategic alliances in the B2B e-market firm sector. We use the
operational status of B2B e-markets as of August 9, 2002 as the basis of measurement. If a B2B e-market
was still operating by August 9, 2002, then we consider it to be surviving in market competition up to that
time. This is an instance of a very general phenomenon called censoring, which occurs when no event is
observed to happen for a participating firm in the study. The corresponding variable, CensoredObs, is set to
“1” for firms that were still operating as of August 9, 2002, and for those that failed in market competition,
we code CensoredObs to “0.” Hypothesis #6 suggests that the number of alliances that a B2B e-market has
formed tends to increase its survivability, and so our econometric test is aimed at finding out whether this is
true. Therefore, we use CensoredObs as the dependent variable, and #Alliances as the explanatory variable.
Considering that previous empirical research has shown curvilinear relationship between the number of
alliances and the rate of innovation (Deeds and Hill, 1996), we also include the square of number of
alliances, #Alliances 2, in our model.
Since the dependent variable has binary values, we again use a logit model in our test. Similar to the
models that we tested in Steps 1 and 2, we also include variables on founding year, product types, and other
B2B e-market characteristics as control variables. The general form of the estimation model is:
))(exp(1
))(exp()1FoundYrXQ
FoundYrXQsCensoredOb⋅++
Pr( ⋅+==
γγ (6)
In this model, the function Q(X) includes the details of the test that we employ to substantiate our theory. It
is given by:
(7)
OtherGoodsipCapitalEquConsumerGosDirectGoodsDigitalSvc
MktLeaderAllianceAlliance
⋅+⋅+⋅+⋅+⋅+
⋅+⋅+⋅+
1110
876
432
2 )(#
βββββ
βββ
MROSvcsodsConsortiumchVerticalExXQ
⋅+⋅
+⋅+=
9
5
10
#)(
ββ
ββ
In accordance with Hypothesis #6, we expect to observe a positive estimated coefficient on #Alliances, but a
negative one for #Alliances 2.
ESTIMATION RESULTS AND DISCUSSION
We used LIMDEP 7.0 (www.limdep.com) to estimate the above three empirical models on alliance
formation, structures and outcomes. Our tests of the study hypotheses proceed according to the three stages
outlined in the preceding section. The first step examines the frequency with which B2B e-markets form
alliances by testing a Poisson count model with #Alliance as the dependent variable. The second step aims to
explain the governance structures that B2B e-markets set up for their partnerships with other organizations,
and especially to analyze the degree to which they are dependent on each other for controlling rights and the
scope of their interfirm business activities. The third step investigates whether alliance strategies enhance
B2B e-market survivability. The latter two tests involve logit regression models. For each model, we
perform diagnostics on pairwise correlation, multicollinearity and other model specification issues. We also
report on and interpret the estimation results.
Step 1: Poisson Regression for Count Data on Alliance Formation
To begin our analysis, we first checked for problems with pairwise correlations between all the
explanatory variables and control variables. The correlation matrix is shown in the Appendices. See Table
A1 at the end of the paper. The highest pairwise correlation is 0.337, which is well below the frequently-
used threshold of 0.6 suggested by Kennedy (1998). In order to detect multicollinearity among the
explanatory variables, we calculated variance inflation factors (VIFs) (Neter, Kutner, Nachstheim and
Wasserman, 1996). Our calculations show that the highest VIF is 1.852—values in excess of 10 would be a
cause for concern—and so we have no evidence for multicollinearity among the explanatory variables.
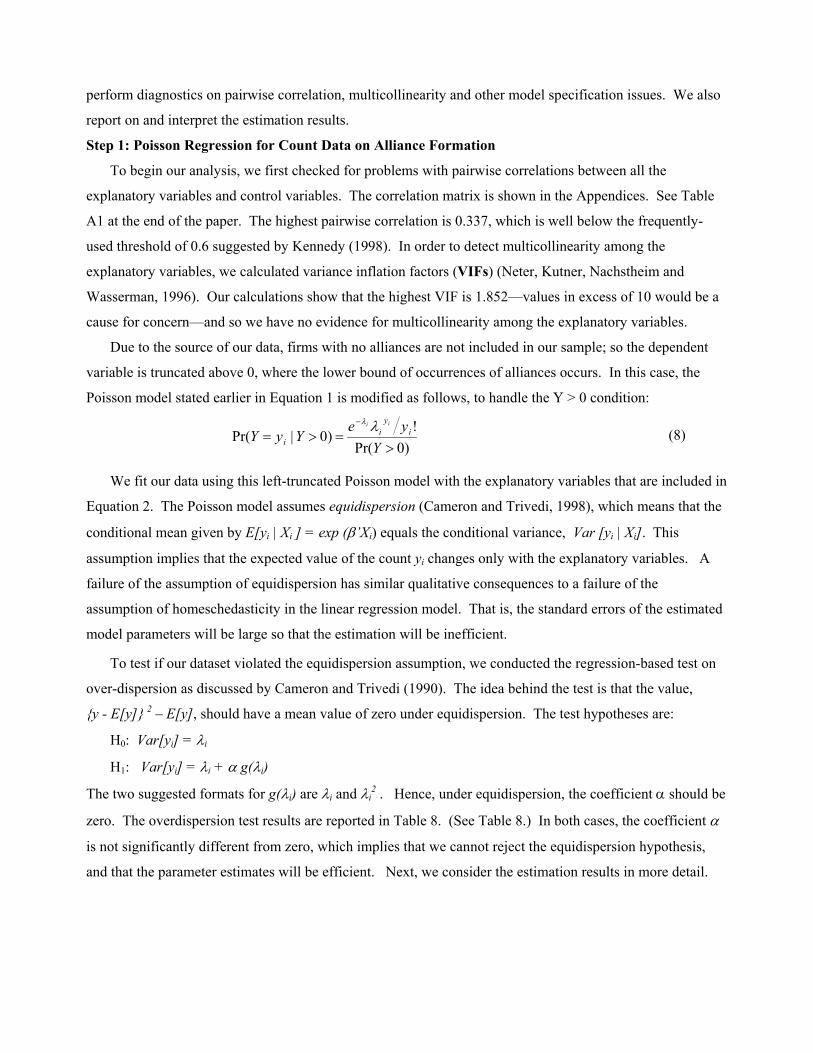
Due to the source of our data, firms with no alliances are not included in our sample; so the dependent
variable is truncated above 0, where the lower bound of occurrences of alliances occurs. In this case, the
Poisson model stated earlier in Equation 1 is modified as follows, to handle the Y > 0 condition:
)0Pr(!
)0|Pr(>
=>=−
Yye
YyY iy
ii
ii λλ
(8)
We fit our data using this left-truncated Poisson model with the explanatory variables that are included in
Equation 2. The Poisson model assumes equidispersion (Cameron and Trivedi, 1998), which means that the
conditional mean given by E[yi | Xi ] = exp (β’Xi) equals the conditional variance, Var [yi | Xi]. This
assumption implies that the expected value of the count yi changes only with the explanatory variables. A
failure of the assumption of equidispersion has similar qualitative consequences to a failure of the
assumption of homeschedasticity in the linear regression model. That is, the standard errors of the estimated
model parameters will be large so that the estimation will be inefficient.
To test if our dataset violated the equidispersion assumption, we conducted the regression-based test on
over-dispersion as discussed by Cameron and Trivedi (1990). The idea behind the test is that the value,
{y - E[y]} 2 – E[y], should have a mean value of zero under equidispersion. The test hypotheses are:
H0: Var[yi] = λi
H1: Var[yi] = λi + α g(λi)
The two suggested formats for g(λi) are λi and λi2 . Hence, under equidispersion, the coefficient α should be
zero. The overdispersion test results are reported in Table 8. (See Table 8.) In both cases, the coefficient α
is not significantly different from zero, which implies that we cannot reject the equidispersion hypothesis,
and that the parameter estimates will be efficient. Next, we consider the estimation results in more detail.
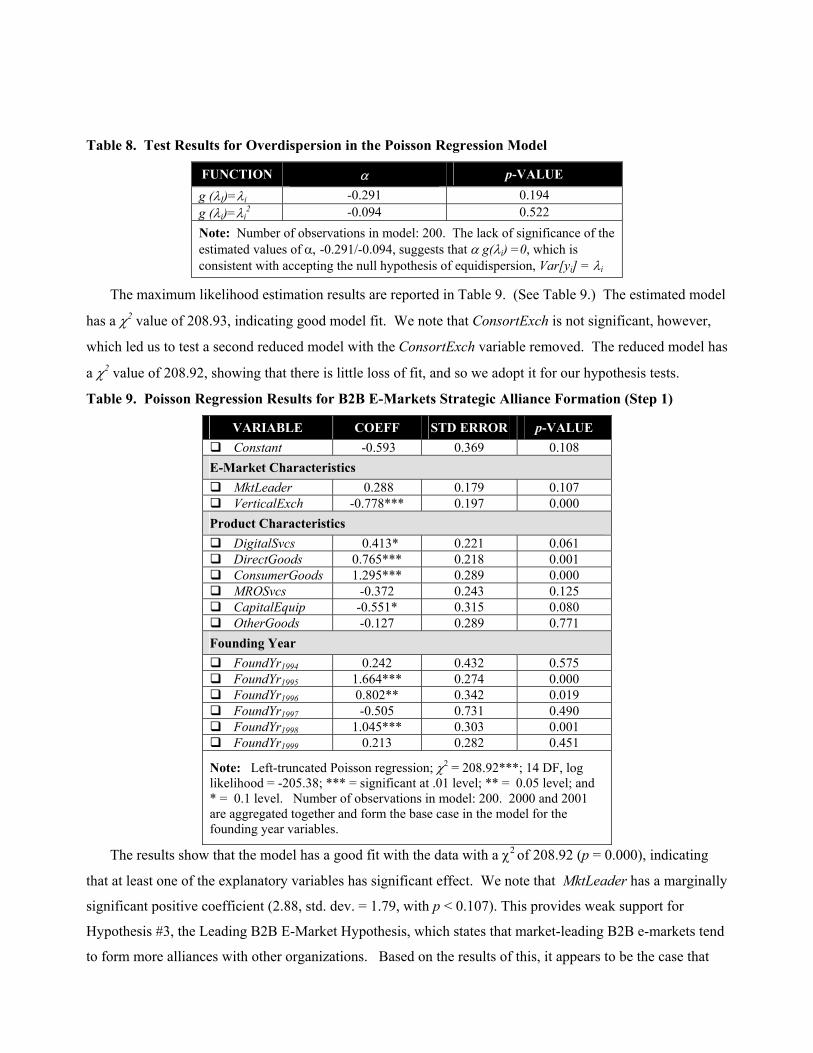
Table 8. Test Results for Overdispersion in the Poisson Regression Model
FUNCTION α p-VALUE g (λI)=λi -0.291 0.194 g (λi)=λi
2 -0.094 0.522 Note: Number of observations in model: 200. The lack of significance of the estimated values of α, -0.291/-0.094, suggests that α g(λi) =0, which is consistent with accepting the null hypothesis of equidispersion, Var[yi] = λi
The maximum likelihood estimation results are reported in Table 9. (See Table 9.) The estimated model
has a χ2 value of 208.93, indicating good model fit. We note that ConsortExch is not significant, however,
which led us to test a second reduced model with the ConsortExch variable removed. The reduced model has
a χ2 value of 208.92, showing that there is little loss of fit, and so we adopt it for our hypothesis tests.
Table 9. Poisson Regression Results for B2B E-Markets Strategic Alliance Formation (Step 1)
VARIABLE COEFF STD ERROR p-VALUE Constant -0.593 0.369 0.108
E-Market Characteristics MktLeader 0.288 0.179 0.107 VerticalExch -0.778*** 0.197 0.000
Product Characteristics DigitalSvcs 0.413* 0.221 0.061 DirectGoods 0.765*** 0.218 0.001 ConsumerGoods 1.295*** 0.289 0.000 MROSvcs -0.372 0.243 0.125 CapitalEquip -0.551* 0.315 0.080 OtherGoods -0.127 0.289 0.771
Founding Year FoundYr1994 0.242 0.432 0.575 FoundYr1995 1.664*** 0.274 0.000 FoundYr1996 0.802** 0.342 0.019 FoundYr1997 -0.505 0.731 0.490 FoundYr1998 1.045*** 0.303 0.001 FoundYr1999 0.213 0.282 0.451
Note: Left-truncated Poisson regression; χ2 = 208.92***; 14 DF, log likelihood = -205.38; *** = significant at .01 level; ** = 0.05 level; and * = 0.1 level. Number of observations in model: 200. 2000 and 2001 are aggregated together and form the base case in the model for the founding year variables.
The results show that the model has a good fit with the data with a χ2 of 208.92 (p = 0.000), indicating
that at least one of the explanatory variables has significant effect. We note that MktLeader has a marginally
significant positive coefficient (2.88, std. dev. = 1.79, with p < 0.107). This provides weak support for
Hypothesis #3, the Leading B2B E-Market Hypothesis, which states that market-leading B2B e-markets tend
to form more alliances with other organizations. Based on the results of this, it appears to be the case that
although some B2B e-markets may be perceived to perform better in the marketplace, such perceptions do
not seem to confer any extraordinary advantages on the firm over others in obtaining external resources.
We can test Hypothesis #1, the Pioneer B2B E-Market Hypothesis, using FoundYr2000-2001 as the base
case. The effect will be present if founding year predicts the frequency of alliance formation. This captures
the idea that first movers in this marketplace may have more motivation to seek partnerships or greater
capabilities to attract other firms to form strategic alliances. Our results show that FoundYr1995, FoundYr1996,
and FoundYr1998 have significant positive effects on the number of alliances; FoundYr1994 did not have a
significant effect. Therefore, Hypothesis #1 is only partially supported, to the extent that B2B e-markets
founded in the early years of e-commerce (1995 and 1996) formed more alliances than others that entered
into this market later.
B2B firms that were set up before 1995 often were conducting business in related offline markets and
had developed certain sources when they began Internet markets. As a result, they would not need external
resources as much as firms that started B2B e-markets right at the beginning of Web-based e-commerce. For
example, Buyerzone.com Inc. (www.buyerzone.com) was founded in 1992 as a middleman serving small
and medium-sized businesses, and by the time it launched its online marketplace in 1997, it had already
obtained experience with buyers and suppliers. This observation may explain why firms that were set up
before 1995 did not form more alliances than other firms.
The coefficients on DigitalSvcs (0.413. p = 0.061), DirectGoods (0.765, p = 0.001), and ConsumerGoods
(1.295, p = 0.000) are all positive and significant, as suggested by our Hypothesis #2, the Strategic Product
Hypothesis. The results indicate that B2B e-markets that operate online marketplaces for these strategic
products are more likely to employ alliances. In contrast, we note that MROSvcs and CapitalEquip have
negative effects on the number of alliances that B2B e-markets enter into, which supports the hypothesis
from the opposite side of the issue.
In addition to the explanatory variables, we also note that vertical e-markets tend to have fewer alliances,
indicated by the negative coefficient of VerticalExch (-0.778, p = 0.000). Our tentative explanation is that
vertical e-markets are focused on specific industries, and thus, they have restricted scope for developing
cooperation. Another reason may be that vertical exchanges perform in a more predicable environment than
horizontal exchanges, because they are playing in their market niches. To the extent that industry-specific
exchanges accumulate their knowledge about this industry, they reduce market uncertainty and thus diminish
the need for external resources.
Step 2: Binomial Logit Model to Explain B2B E-Market Alliance Structures
In the second step of our empirical tests, we examine the alliance structures using the model which is laid
out in Equation 4 and 5. We again checked the pairwise correlations and calculated the VIFs for all the
explanatory variables. The correlation matrix is shown in the Appendices. See Table A2. The tests show no
evidence of pairwise correlation, or multicollinearity; the largest multicollinearity VIF is 1.76, which is well

within the acceptable range. We fitted a binomial logit model with our data set and obtained the maximum
likelihood estimates. The estimated model shows a good fit with the data (χ2 = 64.52, p = 0.000)2. Another
means to measure the goodness-of-fit of a binomial logit model is concordant and discordant pairs analysis.
This assesses the accuracy of the model in predicting the dependent variable (Agresti, 2002). A concordant
pair occurs when the fitted value is consistent with the observed value; otherwise it is a discordant pair. The
percentage of concordant pairs in the total observations can be used as an indicator of the model’s predictive
validity. The percentage of concordant pairs for our data is 83.4%. The results and concordant pairs
analysis are shown in Tables 10 and 11. (See Tables 10 and 11.)
Table 10. Binomial Logit Model Results for B2B E-Market Alliance Structures (Step 2)
VARIABLE COEFF STD ERROR p-VALUE ODDS RATIO Constant 17.338*** 6.162 0.005 AllianceTiming -4.679*** 1.462 0.001 0.01
Alliance Types MktgAlliance 0.540 0.363 0.137 1.72 ParticAlliance 1.391*** 0.447 0.002 4.02 FnctAlliance 0.081 0.415 0.845 1.08 ConnAlliance -0.936* 0.566 0.098 0.39 OtherAlliance 0.405 0.526 0.441 1.50
Partner Characteristics Intermediary -1.583* 0.885 0.074 0.21 InternetFirm -0.642* 0.373 0.085 0.53 TradeAssoc -0.232 1.186 0.845 0.79
E-Market Characteristics MktLeader 0.476 0.324 0.142 1.61 VerticalExch 0.688* 0.352 0.051 1.99 ConsortExch -2.298** 1.159 0.047 0.10
Model: Binomial logit; χ2 = 64.52***, 12 DF, log likelihood = -130.49; significant at 0.01 levels ***, 0.05 **, 0.1 *. No founding year dummies are significant, so no FoundYr coefficient estimates are not included in the testing model. Number of observations:332.
The results in Table 10 show the coefficients of the variables, and their effects on the observed level of
interdependence which are captured by the odds ratios. The odds ratio is defined as an approximate
measurement for the relative probability of an outcome under different levels of an explanatory variable
2 Binary logit models have error terms whose distribution under the assumption that the fitted model is correct is unknown (Neter, Kutner, Nachtsheim and Wassermann, 1996) As a result, using R2 to assess goodness-of-fit for a logit model is not appropriate. There are a couple of statistical measures that can be applied. A common method is to examine the difference between the residuals of the model under the constraints that all regression coefficients are zero and the residuals of the estimated model. This difference can be tested as a χ2 statistic. In this paper, we use this model χ2 as the measure for the goodness-of-fit of logistic models. An alternative is the deviance-χ2 statistic. It indicates percent of uncertainty under the null hypothesis that the model has fit well (Hauser, 1978). We are able to reject the null hypothesis when the deviance-χ2 is “large.” The statistic can also be used to assess goodness-of-fit for more parsimonious models.
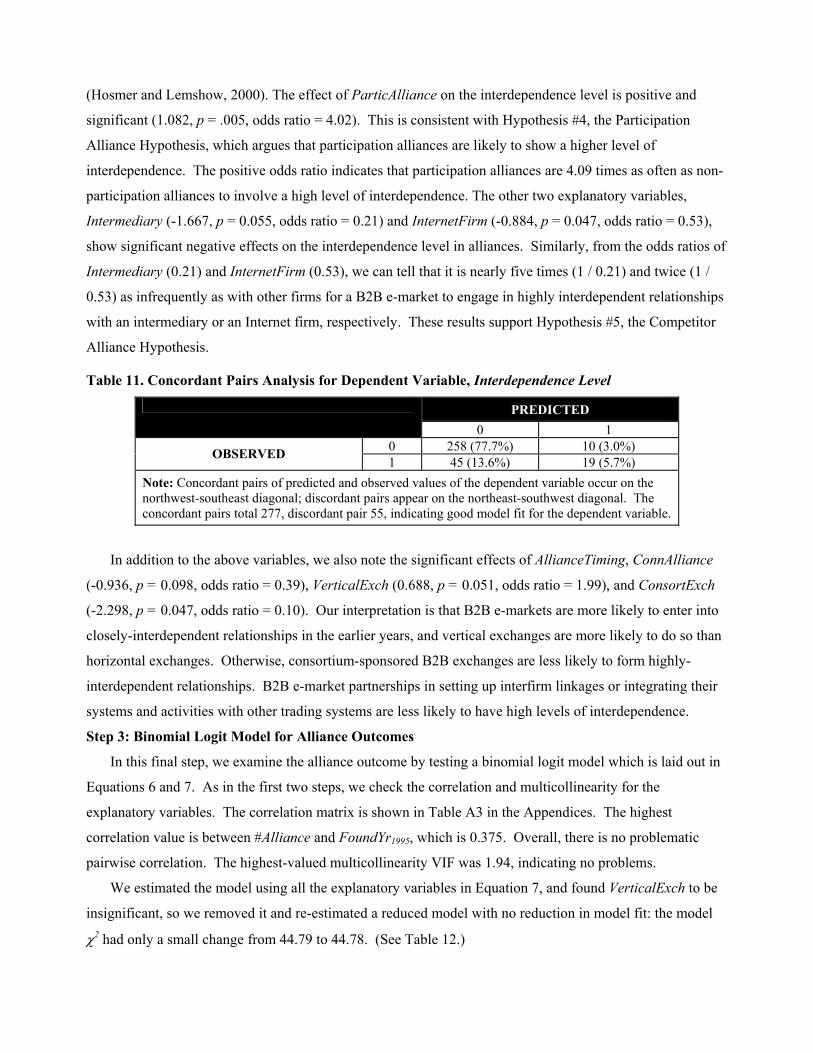
(Hosmer and Lemshow, 2000). The effect of ParticAlliance on the interdependence level is positive and
significant (1.082, p = .005, odds ratio = 4.02). This is consistent with Hypothesis #4, the Participation
Alliance Hypothesis, which argues that participation alliances are likely to show a higher level of
interdependence. The positive odds ratio indicates that participation alliances are 4.09 times as often as non-
participation alliances to involve a high level of interdependence. The other two explanatory variables,
Intermediary (-1.667, p = 0.055, odds ratio = 0.21) and InternetFirm (-0.884, p = 0.047, odds ratio = 0.53),
show significant negative effects on the interdependence level in alliances. Similarly, from the odds ratios of
Intermediary (0.21) and InternetFirm (0.53), we can tell that it is nearly five times (1 / 0.21) and twice (1 /
0.53) as infrequently as with other firms for a B2B e-market to engage in highly interdependent relationships
with an intermediary or an Internet firm, respectively. These results support Hypothesis #5, the Competitor
Alliance Hypothesis.
Table 11. Concordant Pairs Analysis for Dependent Variable, Interdependence Level
PREDICTED
0 1 0 258 (77.7%) 10 (3.0%) OBSERVED 1 45 (13.6%) 19 (5.7%)
Note: Concordant pairs of predicted and observed values of the dependent variable occur on the northwest-southeast diagonal; discordant pairs appear on the northeast-southwest diagonal. The concordant pairs total 277, discordant pair 55, indicating good model fit for the dependent variable.
In addition to the above variables, we also note the significant effects of AllianceTiming, ConnAlliance
(-0.936, p = 0.098, odds ratio = 0.39), VerticalExch (0.688, p = 0.051, odds ratio = 1.99), and ConsortExch
(-2.298, p = 0.047, odds ratio = 0.10). Our interpretation is that B2B e-markets are more likely to enter into
closely-interdependent relationships in the earlier years, and vertical exchanges are more likely to do so than
horizontal exchanges. Otherwise, consortium-sponsored B2B exchanges are less likely to form highly-
interdependent relationships. B2B e-market partnerships in setting up interfirm linkages or integrating their
systems and activities with other trading systems are less likely to have high levels of interdependence.
Step 3: Binomial Logit Model for Alliance Outcomes
In this final step, we examine the alliance outcome by testing a binomial logit model which is laid out in
Equations 6 and 7. As in the first two steps, we check the correlation and multicollinearity for the
explanatory variables. The correlation matrix is shown in Table A3 in the Appendices. The highest
correlation value is between #Alliance and FoundYr1995, which is 0.375. Overall, there is no problematic
pairwise correlation. The highest-valued multicollinearity VIF was 1.94, indicating no problems.
We estimated the model using all the explanatory variables in Equation 7, and found VerticalExch to be
insignificant, so we removed it and re-estimated a reduced model with no reduction in model fit: the model
χ2 had only a small change from 44.79 to 44.78. (See Table 12.)
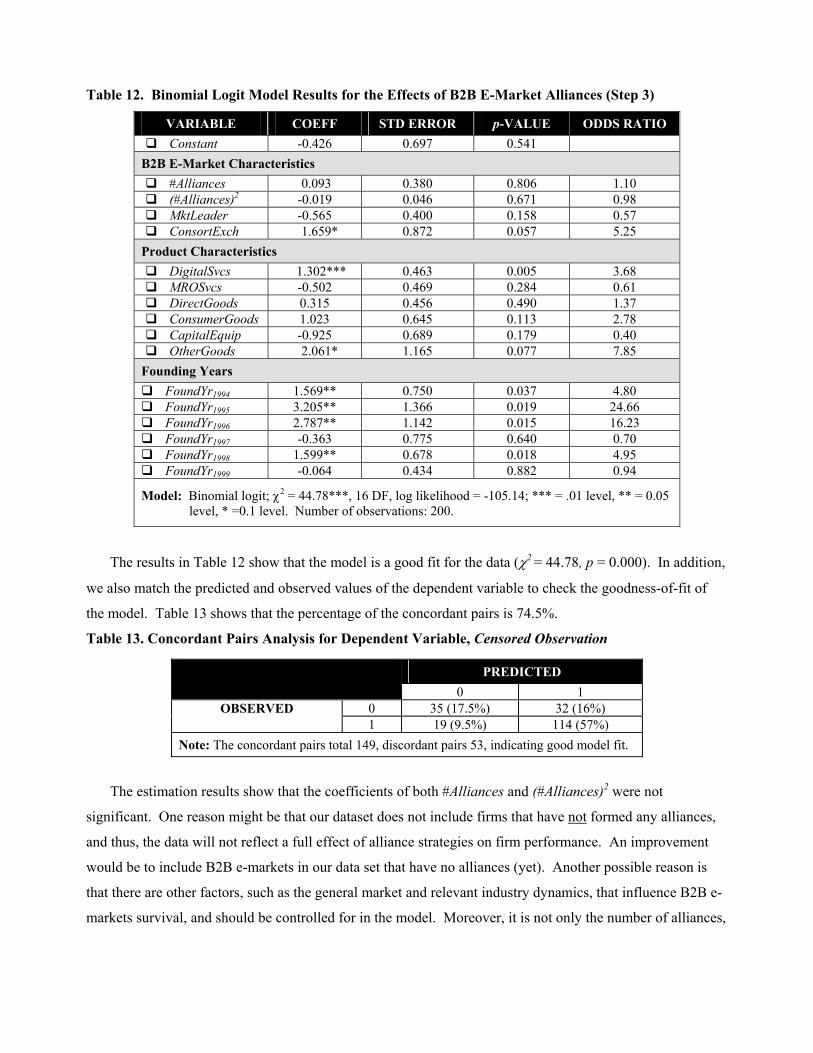
Table 12. Binomial Logit Model Results for the Effects of B2B E-Market Alliances (Step 3)
VARIABLE COEFF STD ERROR p-VALUE ODDS RATIO Constant -0.426 0.697 0.541
B2B E-Market Characteristics #Alliances 0.093 0.380 0.806 1.10 (#Alliances)2 -0.019 0.046 0.671 0.98 MktLeader -0.565 0.400 0.158 0.57 ConsortExch 1.659* 0.872 0.057 5.25
Product Characteristics DigitalSvcs 1.302*** 0.463 0.005 3.68 MROSvcs -0.502 0.469 0.284 0.61 DirectGoods 0.315 0.456 0.490 1.37 ConsumerGoods 1.023 0.645 0.113 2.78 CapitalEquip -0.925 0.689 0.179 0.40 OtherGoods 2.061* 1.165 0.077 7.85
Founding Years FoundYr1994 1.569** 0.750 0.037 4.80 FoundYr1995 3.205** 1.366 0.019 24.66 FoundYr1996 2.787** 1.142 0.015 16.23 FoundYr1997 -0.363 0.775 0.640 0.70 FoundYr1998 1.599** 0.678 0.018 4.95 FoundYr1999 -0.064 0.434 0.882 0.94
Model: Binomial logit; χ2 = 44.78***, 16 DF, log likelihood = -105.14; *** = .01 level, ** = 0.05 level, * =0.1 level. Number of observations: 200.
The results in Table 12 show that the model is a good fit for the data (χ2 = 44.78, p = 0.000). In addition,
we also match the predicted and observed values of the dependent variable to check the goodness-of-fit of
the model. Table 13 shows that the percentage of the concordant pairs is 74.5%.
Table 13. Concordant Pairs Analysis for Dependent Variable, Censored Observation
PREDICTED
0 1 0 35 (17.5%) 32 (16%) OBSERVED 1 19 (9.5%) 114 (57%)
Note: The concordant pairs total 149, discordant pairs 53, indicating good model fit.
The estimation results show that the coefficients of both #Alliances and (#Alliances)2 were not
significant. One reason might be that our dataset does not include firms that have not formed any alliances,
and thus, the data will not reflect a full effect of alliance strategies on firm performance. An improvement
would be to include B2B e-markets in our data set that have no alliances (yet). Another possible reason is
that there are other factors, such as the general market and relevant industry dynamics, that influence B2B e-
markets survival, and should be controlled for in the model. Moreover, it is not only the number of alliances,
but also the management of alliance portfolios that affect how successful B2B e-markets can become in the
market.
Although the effect of #Alliance is not significant, our results show several other interesting effects.
First, the DigitalSvcs (1.302, p = .005) has a significant positive effect, indicating that B2B e-markets
operating online marketplaces for business services or information products have an advantage over others
because of the higher product transactability relative to physical goods. Second, the significant positive
effects of three founding year variables, FoundYr1994, (1.569, p = 0.037), FoundYr1995 (3.205, p =0.019), and
FoundYr1996 (2.787, p = 0.015), tell that B2B e-markets enjoy first-mover advantages which may be
reinforced by the positive network effects in the growth of electronic trading networks. Third, industry
consortium-sponsored B2B e-markets have a better chance to survive in the market as indicated by the
positive effect of ConsortExch (1.659, p = 0.057). This effect may be explained by the observation that
consortium-supported exchanges tend to have more financial resources to sustain their operation.
CONCLUSION
Although alliances have been common among B2B e-markets (Lenz, Zimmerman and Heitmann, 2002;
Rajgopal, Venkatachalam and Kotha, 2002), there is a need for formal knowledge about their strategies in
partnering with other organizations. Our study draws upon theoretical and empirical research in strategic
alliances, transaction costs and property rights analysis, and digital intermediaries, to examine cooperative
strategies in the context of B2B e-markets. We first identified four main types of B2B e-market alliances
based on the nature and tasks of the alliances, including marketing, functionality, participation and
connection alliances. This classification helps us look into B2B e-market cooperation in a structured manner.
We conduct empirical tests and point out several patterns in B2B e-market alliance strategies, including
alliance formation and structuring.
This study reveals that not every B2B e-market uses cooperative strategies in the same manner because
of differences in both motivation and opportunity. More specifically, B2B e-markets that entered into this
marketplace at the early stage of e-commerce are more likely to have allied with other organizations due to a
need for market acceptance. For the same reason, B2B e-markets offering strategic products to buyers are
also inclined to form more alliances. In addition, leading B2B e-markets are more likely to develop
partnerships since they are perceived to have more resources and thus have more partnering opportunities.
B2B e-markets also structure their alliance contracts differently according to the level of interdependence
between partners. B2B e-markets tend to engage in highly interdependent relationships when their partners
are firms that join their online marketplaces for transactions. This permits them to obtain optimal level of
investments in their trading networks from these partners. In contrast, they are more likely to have less
interdependent relationships with Internet firms and conventional intermediaries so that they can protect core
competence from spilling over potential competitors. Moreover, we tested the effects of alliance strategies
on firm survivability. Although the nature of the effect is consistent with our hypothesis, it is not significant.
This means that just forming more alliances is not enough to improve B2B e-markets’ ability to survive
competition.
Further study is needed to investigate the effect of alliance strategies on firm performance. One topic for
future research is whether firm survivability is affected by the presence or absence of alliances. Another
related issue is how the alliance portfolio of a B2B e-market affects its performance. Analyses about these
issues will enhance our understanding about B2B e-market cooperative activities and offer more insights to
support success strategies in the arena of B2B e-commerce.
In our study, we had difficulty in obtaining data on the financial performance of B2B e-markets because
most B2B e-markets are private firms and data about firm characteristics and performances, such as annual
revenues or sales, are not available from public sources. As a result, such data are not included in our
empirical tests, and we use the founding year of B2B e-markets as the proxy for these omitted firm
characteristics. However, there still exist concerns about effects of omitted variables. Additional data on
such firm characteristics as size and financial status would enhance our study. Moreover, our analysis is
based on firm-level data that is aggregated over the whole period of time of the study. We could create more
insights into alliance strategies if we were able to disaggregate the data over time and study the path of the
changes in alliances over time.
REFERENCES
Agresti, A. Categorical Data Analysis, Second Edition, New York, NY: John Wiley and Sons, 2002.
Ahuja, G. “The Duality of Collaboration: Inducements and Opportunities in the Formation of Interfirm Linkages,” Strategic Management Journal (21:3), March 2000, 317-343.
Allen, J. and Phillips, G. M. “Corporate Equity Ownership, Strategic Alliances, and Product Market Relationships,” Journal of Finance (55), 2000, 2791-2815.
Bakos, J.Y. "Reducing Buyer Search Costs: Implications for Electronic Marketplaces," Management Science (43:12), December 1997, 1676-1692.
Bailey, J., and Bakos, Y. “An Exploratory Study of the Emerging Role of Electronic Intermediaries,” International Journal of Electronic Commerce (1:3), Spring 1997, 7-20.
Bakos, J. Y., and Nault, B. "Ownership and Investment in Electronic Networks," Information Systems Research. (8:4), 1997, 321-341.
Bamberger, G. E., Carlton, D. W., and Neumann, L. R. “An Empirical Investigation of the Competitive Effects of Domestic Airline Alliances,” Working paper, Graduate School of Business, University of Chicago, Chicago, IL, 2001.
Baum, J. A. C., Calabrese, T., and Silverman, B. S. “Don’t Go It Alone: Alliance Network Composition and Performance in Canadian Biotechnology,” Strategic Management Journal (21:3), March 2000, 267-294.
Cameron, A. C., and Trivedi, P. K. “Econometric Models Based on Count Data: Comparisons and Applications of Some Estimators and Tests,” Journal of Applied Econometrics (1), January 1986, pp. 29-54.
Cameron, A. C., and Trivedi, P. K. "Regression Based Tests for Overdispersion in the Poisson Model", Journal of Econometrics (46), December 1990, 347-364.
Cameron, A. C., and Trivedi, P. K. Regression Analysis of Count Data (Econometric Society Monograph No.30), Cambridge, UK: Cambridge University Press, 1998.
Chan, S., Kensinger, J. and Keown, A. “Do Strategic Alliances Create Value?” Journal of Financial Economics (46:2), 1997, 199-221.
Chen, Z. G., and Ross, T. "Strategic Alliances, Shared Facilities and Entry Deterrence," RAND Journal of Economics (31), Summer 2000, 326-344.
Chircu, A. M., and Kauffman, R. J. "Intermediation in Electronic Markets: An Analytical Model,” in Proceedings of the 2001 Workshop on Digitisation of Commerce: E-Intermediation, International Institute on Infonomics / Maastricht Economic Research Institute on Innovation and Technology, Maastricht, Netherlands, November 2001.
Dai, Q. and Kauffman, R. J. “To Be Or Not To B2B? An Evaluative Model for E-Procurement Channel Adoption”, The 5th INFORMS Conference on Information Systems and Technology, November 2000, San Antonio, TX, available on CD_ROM.
Dai, Q., and Kauffman, R. J. “Business Models for Internet-Based B2B Electronic Markets,” International Journal of Electronic Commerce (6: 4), Summer 2002, 41-72.
Deeds, D. L, and Hill, C. “Strategic Alliances and the Rate of New Product Development: An Empirical Study of Entrepreneurial Biotechnology Firms,” Journal of Business Venturing (11), January 1996, 41-55.
Dutta, S. and Weiss, A. M. "The Relationship Between a Firm’s Level of Technological Innovativeness And Its Pattern of Partnership Agreements," Management Science 43(3), March 1997, 343-356.
e-Chemmerce.com “DuPont Signs AssetTRADE for Used Equipment,” May 11, 2001. Available on the Internet at www.e-chemmerce.com/c/0500/p/05004p.html.
eChemPeople. “ChemCross and CheMatch Form Strategic Alliance,” February 20, 2001. Available on the Internet at www.echempeople.com/News/Feb_news.htm.
Ernst, D., Halevy, T., Monier, J.., and Sarrazin, H. “A Future for E-Alliances,” McKinsey Quarterly (2), 2001, 92-102.
Faulkner, D., and de Rond, M. (Edtors). Cooperative Strategy: Economic, Business and Organizational Issues, Oxford University Press: Cambridge, UK, 2000.
Gourieroux, C., and Magnac, T. (Guest Editors). “Special Issue on Event Count Data Methods,” Journal of Econometrics (79: 2), August 1979.
Greene, W. Econometric Analysis, Fourth Edition, Englewood Cliffs, NJ: Prentice Hall, 2000.
Grossman S. J., and Hart, O. D. “The Cost and Benefit of Ownership: A Theory of Lateral and Vertical Integration,” Journal of Political Economy (94), 1986, 691-719.
Harrell, F. E., Jr. Regression Modeling Strategies: With Applications to Linear Models, Logistic Models and Survival Analysis, New York, NY: Springer-Verlag, 2001.
Hart, O. D. "Incomplete Contracts and the Theory of the Firm," Journal of Law, Economics, and Organization (4:1), Spring 1988, 119-140. Reprinted in O. E. Williamson and S. G. Winter (Editors), The Nature of the Firm, Oxford University Press: New York, NY, 1991.
Hart, O. D., and Moore, J. “Property Rights and the Nature of the Firm,” Journal of Political Economy (98: 6), 1990, 1119-1158.
Hauser, J. “Testing the Accuracy, Usefulness and Significance of Probabilistic Choice Models: An Information Theoretic Approach,” Operations Research (26: 3), 1978, 406-21.

Hennart, J.-F. “The Transaction Cost Theory of Joint Ventures: An Empirical Study of Japanese Subsidiaries in the United States,” Management Science (37: 4), April 1991, 483-97.
Hosmer, D. W., and Lemeshow, S. Applied Logistic Regression, Second Edition, New York, NY: John Wiley and Sons, 2000.
Just-Style.com. “ProNetLink.com Continues International Expansion with Alliance with NetlinQ Group,” December 20, 1999. Available on the Internet at www.just-style.com/news_detail.asp?art=1785&c=1.
Kauffman, R. J. and Mohtadi, H. “Information Technology in B2B E-Procurement: Open versus Proprietary Systems,” Working paper, MIS Research Center, Carlson School of Management, University of Minnesota, Minneapolis, MN, 2001.
Kennedy, P. A. Guide to Econometrics, 4th edition, Cambridge, MA: MIT Press, 1998.
Krzanowski, W.J. Principles of Multivariate Analysis: A Users's Perpective. Oxford, UK: Clarendon Press, 1988.
Lenz, M.; Zimmermann, H-D.; and Heitmann, M. “Strategic Partnerhsips and Competitiveness of Business-to-Business E-Marketplaces: Preliminary Evidence from Europe,” Electronic Markets (12:2), Spring 2002, 100-111.
Lerner, J., and Merges, R. P. "The Control of Strategic Alliances: An Empirical Analysis of Biotechnology Collaborations," Working Paper 6014, National Bureau of Economic Research, Cambridge, MA, 1997.
Lorange, P. and Roos, J. Strategic Alliances, Blackwell Publishers: Cambridge, MA, 1992.
Maddala, G. S. Limited-Dependent and Qualitative Variables in Econometrics, Cambridge, UK: Cambridge University Press, 1983.
Mody, A. “Learning from Alliances,” Journal of Economic Behavior and Organization, (20) 1993, 151-170.
Neter, J., Kutner, H. M., Nachtsheim, C., and Wasserman, W. Applied Linear Regression Models, 3rd Edition, New York, NY: McGraw Hill, 1996.
Nicholson, S., Danzon, P. M., and McCollough, J. “Biotech-Pharmaceutical Alliances As a Signal of Asset and Firm Quality,” Working Paper #W9007, National Bureau of Economic Research, Cambridge, MA, 2002.
Oxley, J. E., “Appropriability Hazards and Governance in Strategic Alliances: A Transaction Cost Approach,” Journal of Law, Economics and Organization (13), 1997, 387-409.
Pisano, G., “Using Equity Participation to Support Exchange: Evidence from the Biotechnology Industry,” Journal of Law, Economics, and Organization (5), 1989, 109-126.
PRWeb. “Byers Engineering Company and BandWidth.com Announce Launch of New Telecommunica-tions Carrier-to-Carrier,” February 7, 2000. Available on the Internet at www.prweb.com/releases/2000/2/prweb11831.php.
Rajgopal, S.; Venkatachalam, M.; and Kotha, S. “Managerial Actions, Stock Returns, and Earnings: The Case of Business-to-Business Internet Firms,” Journal of Accounting Research (40:2), May 2002, pp. 529-557.
Rao, A. R. and Ruekert, R.W. "Brand Alliances As Signals of Product Quality," Sloan Management Review, Fall 1994, 87-97.
Robinson, D. T., and Stuart, T. E. “Just How Incomplete Are Incomplete Contracts? Evidence from the Biotech Strategic Alliances,” Working paper, Graduate School of Business, University of Chicago, 2002. Available on the Internet at home.uchicago.edu/~dtrobins/working/alliances20.pdf
Segal, I. R.; and Whinston, M. D. “Exclusive Contracts and Protection of Investments,” RAND Journal of Economics (31:4), Winter 2000, 603-633.
Shapiro, C., and Varian, H. R. Information Rules: A Strategic Guide to the Networked Economy. Harvard Business School Press: Boston, MA, 1999.
Teece, D. J. "Competition, Cooperation, and Innovation," Journal of Economic Behavior and Organization (18) 1992, 1-25.
Tirole, J. The Theory of Industrial Organization, MIT Press: Cambridge, MA, 1997.
Trivedi, P. K. (Guest Editor). “Special Issue: Econometric Models of Event Counts,” Journal of Applied Econometrics (12: 2), May-June 1997.
Williamson, O.E. “Transaction Cost Economics,” Chapter 3 in R. Schmalensee and R. Willig (Editors) The Handbook of Industrial Organization, North-Holland: Amsterdam, Netherlands, 1989.
Williamson, O.E. “The New Institutional Economics: Tacking Stock, Looking Ahead,” Journal of Economic Literature (38), 2000, 595-613.
Williamson, O.E., and Masten, S.E. (Editors). Transaction Cost Economics. Theory and Concepts, Edward Elgar Publishing, Aldershot, UK, 1995.
Winkelmann, R. Econometric Analysis of Count Data, Second Edition, Heidelberg, Germany: Springer-Verlag, 1997.
Winkelmann, R. and Zimmermann, K. F. "Recent Developments in Count Data Modeling: Theory and Application", Journal of Economic Surveys (9), 1995, 1-24.
Zhu, K. “Information Transparency in Electronic Marketplaces: Why Data Transparency May Hinder the Adoption of B2B Exchanges,” Electronic Markets (12:2), Spring 2002, 92-99.
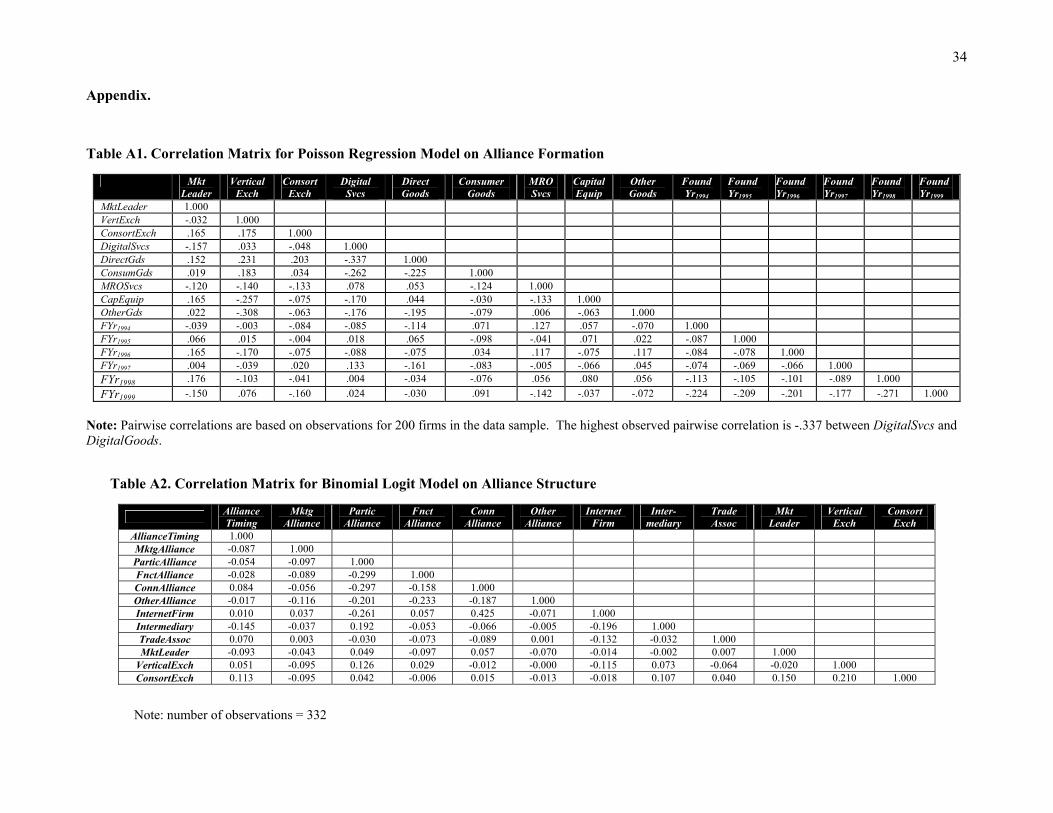
34
Appendix.
Table A1. Correlation Matrix for Poisson Regression Model on Alliance Formation
Mkt Leader
Vertical Exch
Consort Exch
Digital Svcs
Direct Goods
Consumer Goods
MRO Svcs
CapitalEquip
Other Goods
FoundYr1994
Found Yr1995
Found Yr1996
Found Yr1997
Found Yr1998
Found Yr1999
MktLeader 1.000 VertExch -.032 1.000 ConsortExch .165 .175 1.000 DigitalSvcs -.157 .033 -.048 1.000 DirectGds .152 .231 .203 -.337 1.000 ConsumGds .019 .183 .034 -.262 -.225 1.000 MROSvcs -.120 -.140 -.133 .078 .053 -.124 1.000 CapEquip .165 -.257 -.075 -.170 .044 -.030 -.133 1.000 OtherGds .022 -.308 -.063 -.176 -.195 -.079 .006 -.063 1.000 FYr1994 -.039 -.003 -.084 -.085 -.114 .071 .127 .057 -.070 1.000 FYr1995 .066 .015 -.004 .018 .065 -.098 -.041 .071 .022 -.087 1.000 FYr1996 .165 -.170 -.075 -.088 -.075 .034 .117 -.075 .117 -.084 -.078 1.000 FYr1997 .004 -.039 .020 .133 -.161 -.083 -.005 -.066 .045 -.074 -.069 -.066 1.000 FYr1998 .176 -.103 -.041 .004 -.034 -.076 .056 .080 .056 -.113 -.105 -.101 -.089 1.000 FYr1999 -.150 .076 -.160 .024 -.030 .091 -.142 -.037 -.072 -.224 -.209 -.201 -.177 -.271 1.000
Note: Pairwise correlations are based on observations for 200 firms in the data sample. The highest observed pairwise correlation is -.337 between DigitalSvcs and DigitalGoods.
Table A2. Correlation Matrix for Binomial Logit Model on Alliance Structure
Alliance Timing
Mktg Alliance
Partic Alliance
Fnct Alliance
Conn Alliance
Other Alliance
Internet Firm
Inter-mediary
Trade Assoc
Mkt Leader
Vertical Exch
Consort Exch
AllianceTiming 1.000 MktgAlliance -0.087 1.000 ParticAlliance -0.054 -0.097 1.000 FnctAlliance -0.028 -0.089 -0.299 1.000 ConnAlliance 0.084 -0.056 -0.297 -0.158 1.000OtherAlliance -0.017 -0.116 -0.201 -0.233 -0.187 1.000 InternetFirm 0.010 0.037 -0.261 0.057 0.425 -0.071 1.000 Intermediary -0.145 -0.037 0.192 -0.053 -0.066 -0.005 -0.196 1.000 TradeAssoc 0.070 0.003 -0.030 -0.073 -0.089 0.001 -0.132 -0.032 1.000 MktLeader -0.093 -0.043 0.049 -0.097 0.057 -0.070 -0.014 -0.002 0.007 1.000
VerticalExch 0.051 -0.095 0.126 0.029 -0.012 -0.000 -0.115 0.073 -0.064 -0.020 1.000ConsortExch 0.113 -0.095 0.042 -0.006 0.015 -0.013 -0.018 0.107 0.040 0.150 0.210 1.000
Note: number of observations = 332
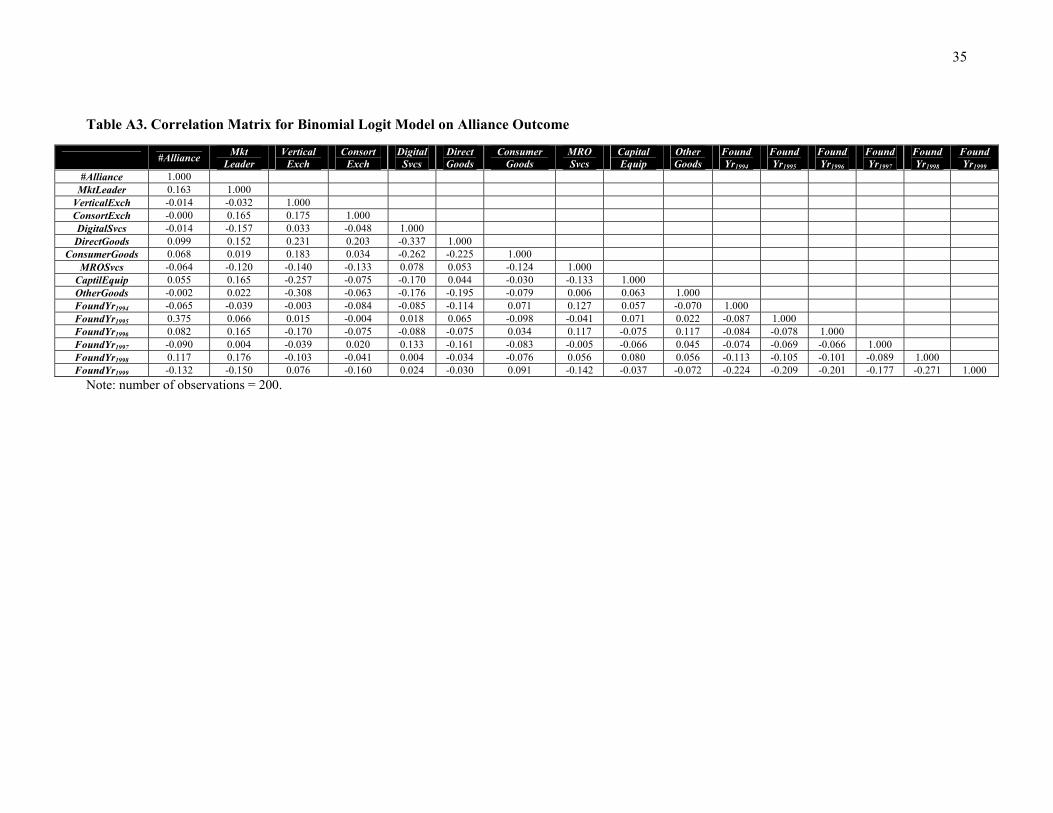
35
Table A3. Correlation Matrix for Binomial Logit Model on Alliance Outcome
#Alliance Mkt Leader
Vertical Exch
Consort Exch
Digital Svcs
Direct Goods
Consumer Goods
MRO Svcs
Capital Equip
Other Goods
Found Yr1994
Found Yr1995
Found Yr1996
Found Yr1997
Found Yr1998
Found Yr1999
#Alliance 1.000 MktLeader 0.163 1.000
VerticalExch -0.014 -0.032 1.000 ConsortExch -0.000 0.165 0.175 1.000 DigitalSvcs -0.014 -0.157 0.033 -0.048 1.000DirectGoods 0.099 0.152 0.231 0.203 -0.337 1.000
ConsumerGoods 0.068 0.019 0.183 0.034 -0.262 -0.225 1.000MROSvcs -0.064 -0.120 -0.140 -0.133 0.078 0.053 -0.124 1.000
CaptilEquip 0.055 0.165 -0.257 -0.075 -0.170 0.044 -0.030 -0.133 1.000 OtherGoods -0.002 0.022 -0.308 -0.063 -0.176 -0.195 -0.079 0.006 0.063 1.000FoundYr1994 -0.065 -0.039 -0.003 -0.084 -0.085 -0.114 0.071 0.127 0.057 -0.070 1.000 FoundYr1995 0.375 0.066 0.015 -0.004 0.018 0.065 -0.098 -0.041 0.071 0.022 -0.087 1.000FoundYr1996 0.082 0.165 -0.170 -0.075 -0.088 -0.075 0.034 0.117 -0.075 0.117 -0.084 -0.078 1.000FoundYr1997 -0.090 0.004 -0.039 0.020 0.133 -0.161 -0.083 -0.005 -0.066 0.045 -0.074 -0.069 -0.066 1.000FoundYr1998 0.117 0.176 -0.103 -0.041 0.004 -0.034 -0.076 0.056 0.080 0.056 -0.113 -0.105 -0.101 -0.089 1.000FoundYr1999 -0.132 -0.150 0.076 -0.160 0.024 -0.030 0.091 -0.142 -0.037 -0.072 -0.224 -0.209 -0.201 -0.177 -0.271 1.000
Note: number of observations = 200.