Embed Size (px)
Citation preview

Copyright 2007-2016, The PTR Group, Inc.
UNDERSTANDING ARM HW DEBUG OPTIONS
Mike Anderson Chief Scientist
The PTR Group, Inc.
http://ThePTRGroup.com

Copyright 2007-2016, The PTR Group, Inc.
Who is The PTR Group? The PTR Group was founded in 2000 We are involved in multiple areas of work: Robotics (NASA space arm) Flight software (over 35 satellites on orbit) Defensive cyber operations
• I’ll leave this to your imagination
Embedded software ports to RTOS/Linux/bare metal
IoT systems architecture and deployment
OIOT-SD-0416-2

Copyright 2007-2016, The PTR Group, Inc.
Who am I? Over 39 years in the embedded space Long-time developer in the RTOS field Instructor for Linux/Android internals Mentor for FRC #116 FIRST Robotics Team Frequent speaker at: Embedded Linux Conference Embedded Systems Conference CIA Emerging Technology Conference And more…
OIOT-SD-0416-3

Copyright 2007-2016, The PTR Group, Inc.
What We Will Talk About… Understanding ARM debugging The JTAG interface Types of JTAG interfaces Single Wire Debug/ Single Wire Output OpenSDA CMSIS-DAP OpenOCD project Getting and installing OpenOCD Starting OpenOCD Connecting GDB Debugging Code w/ OpenOCD
ELC-SD-0416-4

Copyright 2007-2016, The PTR Group, Inc.
Understanding the Debugging Spectrum
ARM-based processors continue to expand their scope and capability
Ranges from the smallest Cortex-M0 mPs to the new Cortex-A72s for data-center applications
Debugging can range from a simple printf/printk to various hardware interfaces
Many ARM devices support multiple variants of debugging interfaces
ELC-SD-0416-5

Copyright 2007-2016, The PTR Group, Inc.
Debugging on the Core Small processors may be running a lightweight RTOS or they might run “bare metal” RAM < 512K, flash < 1M (typical Cortex-M0+: 32K RAM and 64K of flash)
There are several techniques that are used on these small processors Printf-type debug statements Blinky LEDs Hardware-debugging interfaces
• JTAG • SWD/SWO • OpenSDA • CMSIS-DAP
The first two are essentially free But, hardware debuggers can cost from $70 to $10K+ depending on features
ELC-SD-0416-6

Copyright 2007-2016, The PTR Group, Inc.
Mainstream Processor Debug For more capable processors, Linux debugging can be broken up into different phases
Kernel debugging
• Early debug of BSP or statically-linked device drivers
• Debugging of loadable kernel modules
User-space debugging
ELC-SD-0416-7

Copyright 2007-2016, The PTR Group, Inc.
User-Space Debugging Debugging in user space is generally the realm of software debuggers like gdb It is possible to touch physical hardware such as registers for LEDs Use UIO-based drivers in user space to access
them
Hardware debugging via JTAG is rare in user space as it requires a run-mode debugger Very few examples of this type of interface
ELC-SD-0416-8

Copyright 2007-2016, The PTR Group, Inc.
Early Kernel Debug Debugging early in the boot cycle is particularly tricky You need to get some hardware working before you can do
much of anything
However, the kernel does support the CONFIG_EARLY_PRINTK option Allows you to dump printk output to frame buffer or serial port May rely on boot firmware to configure the interface initially You can add timing info to the printk output by enabling the
CONFIG_PRINTK_TIMES option to the kernel as well
However, hardware debuggers like JTAG/SWD can make things much easier to debug if they’re available
ELC-SD-0416-9

Copyright 2007-2016, The PTR Group, Inc.
LKM Debugging If you can postpone your debug issues until you can install a loadable kernel module (LKM), then you have more options available KDB is a symbolic disassembler front-end for KGDB
• You can set breakpoints and single step code via keyboard or serial port
KGDB can operate via the system’s console port • Use a secondary system to run the debugger interface
Again, you can use JTAG/SWD if they’re available
ELC-SD-0416-10

Copyright 2007-2016, The PTR Group, Inc.
Oscilloscopes and Logic Analyzers If we can toggle a GPIO pin, we can use an oscilloscope or logic analyzer on the pin to help in debugging Useful for timing of ISRs Count the pulses to determine
where in the code you are dying
Relatively inexpensive PC-based oscilloscopes and logic analyzers can be fast enough But, you’ve got to be able to access the GPIO pin with
the test leads
ELC-SD-0416-11
Source: salae.com

Copyright 2007-2016, The PTR Group, Inc.
JTAG Port The Joint Test Action Group (JTAG) is the name associated with the IEEE 1149.1 standard entitled Standard Test Access Port and Boundary-Scan Architecture Originally introduced in 1990 as a means
to test printed circuit boards
An alternative to the bed of nails
Source: Test Electronics
ELC-SD-0416-12

Copyright 2007-2016, The PTR Group, Inc.
JTAG Details JTAG is a simple serial protocol
Enables the use of “wiggler”-style interfaces
Configuration is done by manipulating the state machine of the device via the TMS line
ELC-SD-0416-13

Copyright 2007-2016, The PTR Group, Inc.
JTAG Connections The maximum speed of JTAG is 100 MHz A ribbon cable is usually sufficient to connect to
the target
Connection to the development host is accomplished via Parallel port USB Serial port Ethernet
Source: Abatron
Source: Segger
Source: Macraigor
ELC-SD-0416-14

Copyright 2007-2016, The PTR Group, Inc.
JTAG User Interface Several JTAG interfaces use a GDB-style software interface Any GDB-aware front end will work
Others have Eclipse plug-ins to access the JTAG via an IDE Many still use a command line interface A few JTAGs require Windows Many will work in Linux A few will work in OS/X
Source: ibm.com
ELC-SD-0416-15

Copyright 2007-2016, The PTR Group, Inc.
What can you do with a JTAG? Typical JTAG usage includes reflashing boot firmware Even the really cheap JTAG units can do this
However, it is in the use as a debugging aid that JTAG comes into its own You can set hardware or software breakpoints and debug
in source code Sophisticated breakpoint strategies and multi-core
debugging usually require the more expensive units
JTAG units can also be used to exercise the address bus and peripherals This is what JTAG was originally designed for
ELC-SD-0416-16

Copyright 2007-2016, The PTR Group, Inc.
Hardware Configuration Files Most JTAG units require you to describe the hardware registers in a configuration file This is also how you describe what processor architecture
you are using
Register map information is often supplied by the JTAG manufacturer or by the SoC vendor Highly integrated SoCs may be just the core and standard
peripherals
Unfortunately, there is no standard format for these configuration files Each JTAG vendor uses different syntax
ELC-SD-0416-17

Copyright 2007-2016, The PTR Group, Inc.
Typical JTAG Connectors The traditional JTAG connector could have as many as 20 pins with .1” spacing TI used a 14-pin variant Considered too big for many
applications these days
A smaller 10-pin connector has replaced the traditional connector in most Cortex-M development boards 1.5mm pin spacing
A 20-pin variant of JTAG+ETM also exists
Source: ARM.com
ELC-SD-0416-18

Copyright 2007-2016, The PTR Group, Inc.
SWD/SWO SoCs tend to be highly pin constrained The JTAG connector requires too many pins
for many applications
A variant of the JTAG was introduced called single wire debug (SWD) Uses just 2 pins with clock and
bi-directional data pin • SWDIO and SWCLK are overlaid on
the TMS and TCK pins
Up to 4 MBs/sec @ 50MHz
Serial Wire Output (SWO) is similar to SWD in that it uses just 2 pins Provides a serial port-like facility also integrated into the Integrated
Trace Macrocell (ITM)
Source: st-micro.com
ELC-SD-0416-19

Copyright 2007-2016, The PTR Group, Inc.
ETM The Embedded Trace Macrocell (ETM) capability provides a means to trace instruction execution to see what happened in the past on the processor Includes the ability to perform timestamps on instructions for detailed SoC debugging
The ETM interface includes: an instruction interface a secure control bus a data address interface a pipeline advance interface a data value interface a coprocessor interface other connections to the core
Some JTAG interfaces include a trace buffer that could be as much as 16MBs of trace buffer Unfortunately, not all ARM SoCs support ETM capability Source: segger.com
ELC-SD-0416-20

Copyright 2007-2016, The PTR Group, Inc.
OpenSDA OpenSDA is a serial and debug adapter that is built into several development boards Bridges between SWD/JTAG and USB interface
Provides for flash programming via drag and drop onto an apparent mounted USB drive with a USB serial interface for printf-style debugging
Source: nxp.com
ELC-SD-0416-21

Copyright 2007-2016, The PTR Group, Inc.
CMSIS-DAP ARM’s Cortex Microcontroller Software Interface Standard (CMSIS) has an IP block that’s specifically targeted at debugging The Debug Access Port (DAP)
CMSIS-DAP is also typically routed via a USB interface to the host debugger Provides access to the SWD/JTAG interface
Source: keil.com
ELC-SD-0416-22

Copyright 2007-2016, The PTR Group, Inc.
OpenOCD Project This project was started in 2008 to create a software interface for the inexpensive wiggler-style interfaces Based on a graduate thesis paper
Original targets were lower-end ARM MCUs ARM7TDMI/ARM9TDMI and Cortex-M
Now supports many high-end ARM processors such as TI DaVinci and Cortex-A9 Currently hosted as a GIT repository at http://sourceforge.net/projects/openocd Provides a GDB interface to several dozen different debugger interfaces Includes Wiggler-style JTAG/SWD and CMSIS-DAP
Provides an ARM disassembler feature as well Supported on Windows, OS/X and Linux Pre-packaged versions are often available for development hosts
ELC-SD-0416-23
Copyright 2007-2016, The PTR Group, Inc.
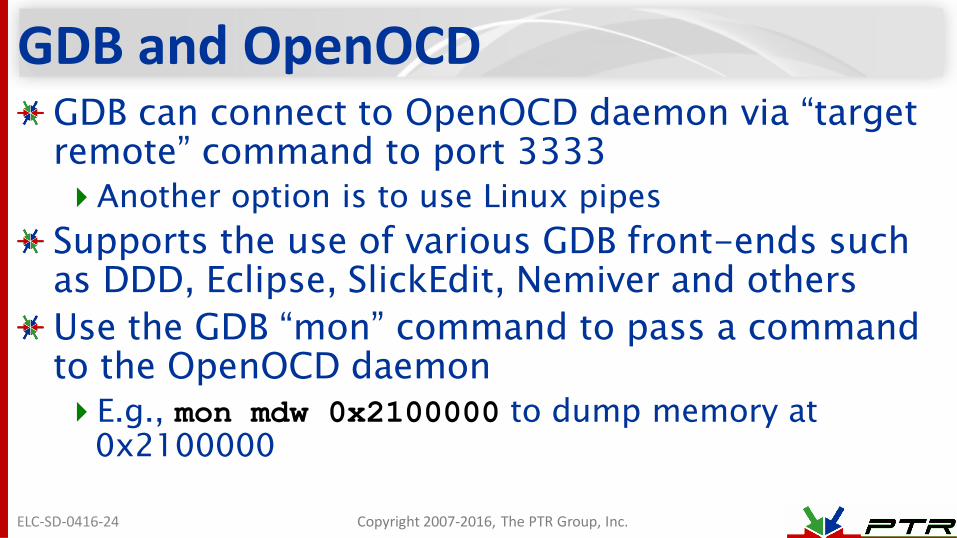
GDB and OpenOCD GDB can connect to OpenOCD daemon via “target remote” command to port 3333 Another option is to use Linux pipes
Supports the use of various GDB front-ends such as DDD, Eclipse, SlickEdit, Nemiver and others
Use the GDB “mon” command to pass a command to the OpenOCD daemon E.g., mon mdw 0x2100000 to dump memory at
0x2100000
ELC-SD-0416-24

Copyright 2007-2016, The PTR Group, Inc.
DDD GUI Front-End Example Invoked from command line with kernel compiled for debugging Use the –debugger
command line option to load the cross debugger back end:
ddd –debugger arm-linux-gdb vmlinux
Then attach to JTAG using “target remote” command: (gdb) target remote 127.0.0.1:3333
ELC-SD-0416-25

Copyright 2007-2016, The PTR Group, Inc.
Debugging Linux Kernel Code Compile the kernel with debugging enabled Only needed for the debugger – you don’t have to
run the debug kernel
If your problem is early in the boot cycle with statically linked code, the compiled kernel image (vmlinux) has all of the symbols you’ll need
If you’re debugging an LKM, then you’ll need to pull symbol table info from someplace else
ELC-SD-0416-26

Copyright 2007-2016, The PTR Group, Inc.
Example for Linux 4.2.8
ELC-SD-0416-27

Copyright 2007-2016, The PTR Group, Inc.
Loading Symbols into the JTAG UI Depending on the JTAG UI, you may simply have to load the kernel’s vmlinux image to be able to access the symbols by name The techniques for doing this vary by JTAG vendor
Attach the JTAG to the hardware Reset the board via JTAG and hold in reset Set H/W breakpoint using the JTAG Load the vmlinux via the JTAG (this loads the symbols) Command the JTAG to tell the hardware to “go”
Once you encounter the hardware breakpoint, you can step in assembly until the MMU is enabled The MMU will translate physical addresses to virtual addresses Once virtual addressing is on, set breakpoints as normal
ELC-SD-0416-28

Copyright 2007-2016, The PTR Group, Inc.
Using JTAG to Dump printk Buffer If you kernel hangs right after displaying “Uncompressing Kernel Image … OK” message… You probably have printk() output, but the serial
console isn’t initialized yet We can dump the printk buffer using the JTAG! Look in the kernel’s System.map file for
something like “__log_buf” $ grep __log_buf /boot/System.map
c0445980 b __log_buf
ELC-SD-0416-29

Copyright 2007-2016, The PTR Group, Inc.
Dumping printk Buffer #2 The address of the buffer is a translated kernel address Strip off the 0xC0000000 portion of the address to get
(typically) the physical address on processors like the X86 i.e., 0xc0445980 would typically be at physical address
0x445980 You must understand your processor to do the
translations correctly
Now, use the JTAG to dump that address Raw printk output, but you can get an idea of what it was
doing when it crashed Data is still there even after reset (but not power-off)
ELC-SD-0416-30

Copyright 2007-2016, The PTR Group, Inc.
Debugging Loadable Modules In order to debug a loaded module, we need to tell the debugger where the module is in memory The module’s information is not in the vmlinux
image because that shows only statically-linked drivers
How we proceed depends on where we need to debug If we need to debug the __init code, we need to set a
breakpoint in the load_module() function
ELC-SD-0416-31

Copyright 2007-2016, The PTR Group, Inc.
Debugging Loadable Modules #2 We’ll need to breakpoint just before the control is transferred to the module_init() Somewhere around line 3233 of module.c (4.2.8
kernel):
/* Start the module */
if (mod->init != NULL)
ret = do_one_initcall(mod->init);
ELC-SD-0416-32

Copyright 2007-2016, The PTR Group, Inc.
Debugging Loadable Modules #3 Once the breakpoint is encountered, we can walk the module address list to find the assigned address for the module We then use the add-symbol-file GDB command to
add the debug symbols for the driver at the address for the loaded module
E.g., add-symbol-file ./mydriver.ko 0x<addr> -e .init.text
ELC-SD-0416-33

Copyright 2007-2016, The PTR Group, Inc.
Debugging Loadable Modules #4 Now, you can set breakpoints via the GDB commands to the JTAG and tell the system to continue until a breakpoint in encountered
Typically, you’ll set breakpoints at oops(), panic() and sys_sync() as a good starting point
ELC-SD-0416-34

Copyright 2007-2016, The PTR Group, Inc.
What if the __init is Working? If you do not need to debug the __init code, then load the driver and look in the /sys/modules/<modulename>/sections/.text for the address of the text segment
Next, use the add-symbol-file command again, but use the .text address and omit the “–e .init.text” Set your breakpoints and continue
ELC-SD-0416-35

Copyright 2007-2016, The PTR Group, Inc.
Summary JTAG/SWD adds significant capability when debugging microcontrollers However, they require access to the JTAG pins on the processor
JTAG/SWD can use open protocols like GDB with open interface software like OpenOCD You pretty much get what you pay for in most JTAG/SWD interfaces A $75 JTAG just doesn’t have the features of a $3K version
Despite its low cost, OpenOCD and simple wiggler-style JTAG/SWD interfaces make a powerful combination Unfortunately, there is no multi-core support in OpenOCD yet
ELC-SD-0416-36