Embed Size (px)
Citation preview
Comparative Response Assessment of MinimallyCompliant Low-Rise Base-Isolated andConventional Steel Moment-Resisting
Frame BuildingsPrayag J. Sayani1; Emrah Erduran2; and Keri L. Ryan, M.ASCE3
Abstract: In this study, the multihazard response of code-designed conventional and base-isolated steel frame buildings is evaluated usingnonlinear response history analysis. The results of hazard and structural response analysis for 3-story moment-resisting frame buildings arepresented in this paper. Three-dimensional models for both buildings are created, and seismic response is assessed for three scenario earth-quakes. The response history analysis results indicate that the performance of the isolated building is superior to the conventional building inthe design event. However, for the Maximum Considered Earthquake, the presence of outliers in the response data reduces confidence that theisolated building provides superior performance to its conventional counterpart. The potential causes of the outliers have been carefullyevaluated. DOI: 10.1061/(ASCE)ST.1943-541X.0000358. © 2011 American Society of Civil Engineers.
CE Database subject headings: Acceleration; Base isolation; Ductility; Nonlinear analysis; Performance characteristics; Responsespectra; Seismic effects; Structural response; Low-rise buildings; Frames.
Author keywords: Acceleration; Base isolation; Ductility; Nonlinear analysis; Performance characteristics; Response spectra; Seismiceffects; Structural response.
Introduction
The principal benefit of seismic isolation for buildings—to offer farsuperior performance in a design level earthquake—is generallyaccepted and recognized by structural engineers. With seismic iso-lation, flexible devices installed at the base lengthen or shift thebuilding’s natural period to the low acceleration region of the spec-trum. Consequently, an isolated building accommodates the lowerdesign forces elastically, and structural damage is eliminated orgreatly reduced relative to a conventional building that accommo-dates the design forces through inelastic response. Furthermore,nonstructural components and building contents, which make upat least 80% of the building’s value [Applied Technology Council(ATC) 2008; Taghavi and Miranda 2003], are also better protectedin an isolated building because of lowered acceleration demands.
In the United States, seismic performance objectives, whichdiffer for isolated and conventional systems, are only implicitly
embedded in code design standards [ASCE 2005; InternationalCode Council (ICC) 2006, Building Seismic Safety Council(BSSC) 2004]. These codes provide design standards with refer-ence to a single earthquake intensity level, a design earthquake witha 10% probability of occurring in a 50-year window. The code ob-jective for this event is to limit damage in a conventional buildingthrough controlled yielding of ductile components, such that lifesafety is preserved. In an isolated building, the objective is to pre-vent damage of structural components through elastic response andprevent damage of nonstructural components through reduced ac-celerations. Although it is expected that the performance objectivesfor an isolated building are met, the vast majority of isolated build-ings are designed beyond minimum code compliance because ofowner objectives or jurisdiction requirements, which compoundscosts and leads to the impression that seismic isolation is tooexpensive for typical projects.
Emerging techniques, such as those used for economic analysisand life cycle performance assessment (ATC 2009a), will requiremultilevel response evaluation. The intuitive assumption that supe-rior performance of an isolated building in a design event naturallyleads to superior performance in other earthquake scenarios de-serves critical examination. Yielding of the isolated superstructurein extreme events is likely, and the associated response trends havebeen examined by many (Pinto and Vanzi 1992; Palazzo and Petti1996; Ceccoli et al. 1999; Naaseh et al. 2002; Ordonez et al. 2003;Politopoulos and Sollogoub 2005; Kikuchi et al. 2008; Sayani andRyan 2009). A key observation is that an isolated structure, onyielding, accumulates ductility demands in the superstructure morequickly than a comparable conventional building, and thus the driftdemand in the isolated superstructure can in fact be greater than in acomparable conventional building. FEMA P695 (ATC 2009b) con-cluded that, when designed by current code standards, conventionaland seismic isolated RC buildings have about the same probability
1Structural Engineer, Gandhi Engineering, Inc., 111 John St., 3rd Floor,New York, NY 10038; formerly, Ph.D. Candidate, Dept. of Civil andEnvironmental Engineering, Utah State Univ., Logan, UT 84322-4110.
2Research Engineer, NORSAR, Gunnar Randers vei 15, P.O. Box 53,NO-2027, Kjeller, Norway; formerly, Post-Doctorate Researcher, Dept. ofCivil and Environmental Engineering, Utah State Univ., Logan, UT 84322-4110.
3Assistant Professor, Dept. of Civil and Environmental Engineering,Univ. of Nevada, Reno/MS 0258, Reno, NV 89557-0258; formerly, Assis-tant Prof., Dept. of Civil and Environmental Engineering, Utah State Univ.,Logan, UT 84322-4110 (corresponding author). E-mail: [email protected]
Note. This manuscript was submitted on July 7, 2009; approved on De-cember 15, 2010; published online on December 17, 2010. Discussion per-iod open until March 1, 2012; separate discussions must be submitted forindividual papers. This paper is part of the Journal of Structural Engineer-ing, Vol. 137, No. 10, October 1, 2011. ©ASCE, ISSN 0733-9445/2011/10-1118–1131/$25.00.
1118 / JOURNAL OF STRUCTURAL ENGINEERING © ASCE / OCTOBER 2011
Downloaded 02 Nov 2011 to 129.123.244.162. Redistribution subject to ASCE license or copyright. Visit http://www.ascelibrary.org
of collapse in the Maximum Considered Earthquake (MCE).Furthermore, response of an isolated building attributable to a“frequent” earthquake intensity may be suboptimal when largeisolator deformations are anticipated in the design event.
A number of studies have performed comparative responseevaluation of isolated and conventional buildings (e.g., Shentonand Lin 1993; Lin and Shenton 1992; Hall and Ryan 2000; Dolceand Cardone 2003; Hamidi et al. 2003; Agarwal et al. 2007;Dolce et al. 2007). Some have evaluated the buildings in referenceto code standards. Researchers (Lin and Shenton 1992; Shentonand Lin 1993) compared the response of concrete and steel framesdesigned to the 1991 Uniform Building Code. However, the seis-mic provisions of building codes have evolved rapidly over theyears, and to the best of the authors’ knowledge, a comparativeevaluation of code-designed buildings using ground motionssystematically selected to represent multiple hazards has not beenperformed.
The objective of this study is to comparatively evaluate themultilevel seismic response of minimally code-compliant 3-storyconventional and base-isolated steel moment-resisting framebuildings. A moment frame has been selected to address whethera similar benefit can be provided by applying isolation to a rela-tively flexible lateral system compared with an ideal stiff system.Post-Northridge moment-resisting frames are attractive, providingreliable seismic performance and allowing for flexibility of architec-tural design.Anumber ofmidrise steelmoment frame isolated build-ings are in various phases of the design and construction process inCalifornia. Groundmotions are selected for three distinct earthquakescenarios representing 2, 10, and 50% probabilities of exceedance in50 years. Statistical responses determined from nonlinear responsehistory analysis of high fidelity three-dimensional numerical simu-lation models are presented and analyzed.
Design and Modeling Assumptions for the Buildings
Design Assumptions
Hypothetical 3-story conventional and base-isolated moment-resisting frame buildings were designed by Forell/Elsesser Engi-neers Inc. for use in this study. These office buildings (occupancycategory II and importance factor I ¼ 1:0) were designed by theEquivalent Lateral Force Method to meet the requirements of2006 International Building Code (ICC 2006), ASCE 7-05 (ASCE2005), and AISC 341-05 (AISC 2005). The buildings were de-signed for a Los Angeles, California, location (34.50 N, 118.2 W)on stiff soil (site class D with reference shear wave velocity of 180to 360 m=s). The mapped spectral accelerations for this locationare Ss ¼ 2:2 g for short periods and S1 ¼ 0:74 g for a 1-s period(g = gravitational acceleration).
The conventional building was detailed for high ductility as aspecial moment-resisting frame (SMRF) and uses reduced beamsection (RBS) connections, which are prequalified according toAISC 341-05 (AISC 2005). However, the isolated building, whichhas lower ductility requirements, was detailed as an intermediatemoment-resisting frame (IMRF) utilizing welded unreinforcedflange, welded web (WUF-W) beam-column connections. As such,design force reduction factors were R ¼ 8 for the SMRF, andRI ¼ 1:67 for the isolated IMRF—assuming a design yield strengthof 345 MPa (50 ksi) for structural steel. Design drift limits were2.5% for the SMRF and 1.5% for the isolated IMRF, and the designof both buildings was drift controlled.
The building configurations are based on the plan layout for the3-story buildings designed for the SAC Steel Project (FEMA
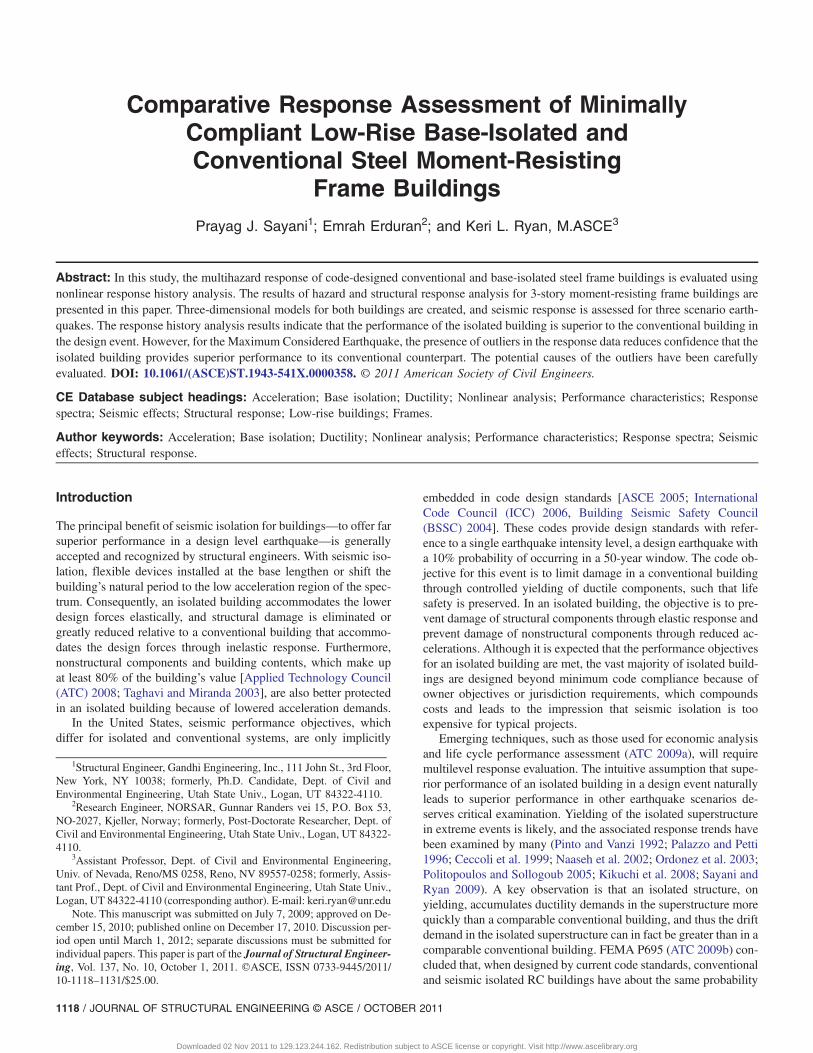
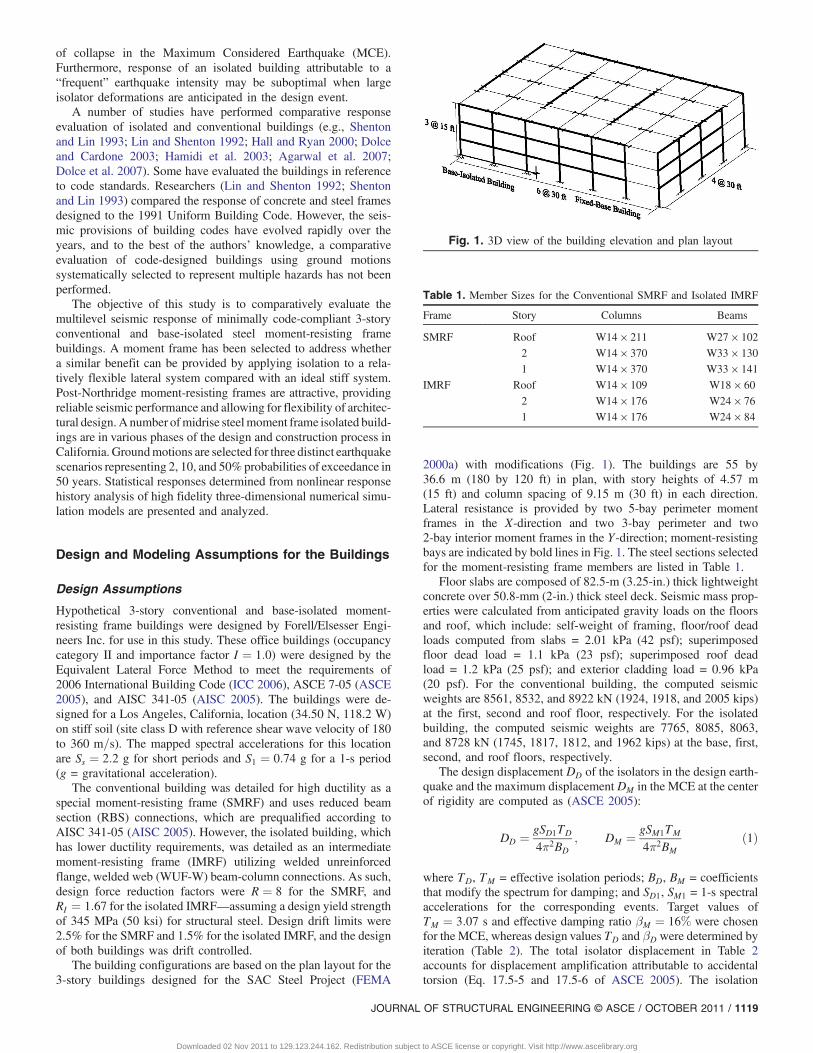
2000a) with modifications (Fig. 1). The buildings are 55 by36.6 m (180 by 120 ft) in plan, with story heights of 4.57 m(15 ft) and column spacing of 9.15 m (30 ft) in each direction.Lateral resistance is provided by two 5-bay perimeter momentframes in the X-direction and two 3-bay perimeter and two2-bay interior moment frames in the Y-direction; moment-resistingbays are indicated by bold lines in Fig. 1. The steel sections selectedfor the moment-resisting frame members are listed in Table 1.
Floor slabs are composed of 82.5-m (3.25-in.) thick lightweightconcrete over 50.8-mm (2-in.) thick steel deck. Seismic mass prop-erties were calculated from anticipated gravity loads on the floorsand roof, which include: self-weight of framing, floor/roof deadloads computed from slabs = 2.01 kPa (42 psf); superimposedfloor dead load = 1.1 kPa (23 psf); superimposed roof deadload = 1.2 kPa (25 psf); and exterior cladding load = 0.96 kPa(20 psf). For the conventional building, the computed seismicweights are 8561, 8532, and 8922 kN (1924, 1918, and 2005 kips)at the first, second and roof floor, respectively. For the isolatedbuilding, the computed seismic weights are 7765, 8085, 8063,and 8728 kN (1745, 1817, 1812, and 1962 kips) at the base, first,second, and roof floors, respectively.
The design displacement DD of the isolators in the design earth-quake and the maximum displacement DM in the MCE at the centerof rigidity are computed as (ASCE 2005):
DD ¼ gSD1TD
4π2BD; DM ¼ gSM1TM
4π2BMð1Þ
where TD, TM = effective isolation periods; BD, BM = coefficientsthat modify the spectrum for damping; and SD1, SM1 = 1-s spectralaccelerations for the corresponding events. Target values ofTM ¼ 3:07 s and effective damping ratio βM ¼ 16% were chosenfor the MCE, whereas design values TD and βD were determined byiteration (Table 2). The total isolator displacement in Table 2accounts for displacement amplification attributable to accidentaltorsion (Eq. 17.5-5 and 17.5-6 of ASCE 2005). The isolation
Fig. 1. 3D view of the building elevation and plan layout
Table 1. Member Sizes for the Conventional SMRF and Isolated IMRF
Frame Story Columns Beams
SMRF Roof W14 × 211 W27 × 102
2 W14 × 370 W33 × 130
1 W14 × 370 W33 × 141
IMRF Roof W14 × 109 W18 × 60
2 W14 × 176 W24 × 76
1 W14 × 176 W24 × 84
JOURNAL OF STRUCTURAL ENGINEERING © ASCE / OCTOBER 2011 / 1119
Downloaded 02 Nov 2011 to 129.123.244.162. Redistribution subject to ASCE license or copyright. Visit http://www.ascelibrary.org
devices have not been designed in detail so that the study is neutralwith respect to isolation system. The isolated building does notqualify for design exclusively by the equivalent lateral forcemethod because S1 > 0:6 g and the MCE effective periodTM > 3:0 s (ASCE 2005).
Modeling Assumptions
Models for evaluation were based on ASCE 7 (ASCE 2005) fordesign of new buildings and ASCE 41 (ASCE 2007) for evaluationof existing buildings. Detailed three-dimensional (3D) numericalmodels of both buildings were developed in OpenSees. Althoughthe buildings are symmetric about both axes, the mass centers wereshifted by 5% of the longest plan dimension in both directions toaccount for accidental torsion (ASCE 2005). Equivalent mass androtational inertia were lumped at the center of mass. Slab action wasaccounted for through a rigid diaphragm constraint, except at thebase level of the isolated IMRF, where slabs were modeled withshell elements to enhance the rigidity of the model against localisolator uplift.
Member capacities were based on the expected yield strength ofstructural steel f ye ¼ 379 MPa (55 ksi) rather than the nominal de-sign strength (ASCE 2007). All columns and moment-resistingbeams were modeled using force-based nonlinear beam-columnelements that combine finite length “plastic hinge” regions atthe element ends with an interior elastic region (Scott and Fenves2006). The columns were modeled using fiber sections that inher-ently account for moment-axial force interaction at each analysisstep, whereas stress resultant models were chosen for themoment-resisting beam elements. The steel stress-strain andmoment-curvature relationships were assumed to be bilinear, witha strain hardening ratio of 3%. Gravity beams were modeled usingelastic frame elements with moment releases at both ends. In theSMRF, moment-resisting and gravity columns were fixed andpinned at the base, respectively; whereas in the IMRF, momentconnections were assumed at all base level beam-column joints.
Energy dissipation was applied to the conventional structure andthe isolated superstructure using stiffness proportional dampingcalibrated to give 2.5% damping at their respective first modefrequencies. Stiffness proportional damping was selected sinceRayleigh damping has been observed to artificially suppressthe first mode of an isolated building even compared with a rigidstructure approximation (Ryan and Polanco 2008). Stiffness pro-portional damping in conventional buildings might be expectedto suppress higher mode response. However, damping comparisonstudies of the SMRF subjected to large intensity ground motionsindicated only a trivial difference in median responses betweenRayleigh damping and stiffness proportional damping (less than2% discrepancy in the median peak interstory drift ratio), whichallowed this concern to be dismissed. Tangent stiffness proportionaldamping rather than initial stiffness proportional damping was se-lected to prevent the damping forces from becoming unrealisticallylarge compared with the element forces after the superstructureyields (Hall 2006; Charney 2008).
The final analytical models for assessment were developed instages through a series of increasingly complex models that were
verified for accuracy. For each building, a basic centerline model ofthe moment-resisting frame system was developed first, referred toas M1. Next, in model M2, rotational springs were incorporated tomodel panel zone behavior, coupled with rigid end offsets to ac-count for clear length dimensions of beams and columns (FEMA2000a). Centerline models and panel zone models are recognized tohave the same stiffness in the linear range. Finally, for the conven-tional SMRF only, a multielement approach was used to simulatethe behavior of RBS (model M3). Thus, the response assessmentwas performed with M3 for the SMRF and M2 for the IMRF.
Panel Zone Flexibility
Panel zones exhibit desirable hysteretic behavior characterizedby considerable strain hardening following yielding and stablehysteresis loops. Several mathematical models for panel zoneshear force-shear strain (V-γ) relationships have been proposed(Krawinkler 1978; Lu et al. 1988; Tsai and Popov 1988; Kimand Engelhardt 2002). This study utilizes rotational springs thatsimulate trilinear force-strain behavior (Fig. 2) (Krawinkler1978; FEMA 2000a). The control values for yield force Vy, plasticforce Vp, yield stain γy, and plastic strain γp are given by:
Vy ¼ 0:55f yedctw Vp ¼ Vy
�1þ 3bcf t2cf
dbdctw
�ð2a Þ
γy ¼f yeffiffiffi3
pG
γp ¼ 4γy ð2b Þ
where dc = column depth; bcf = column flange width; db = beamdepth; tw = web thickness; tcf = column flange thickness; andG = shear modulus. The elastic stiffness Ke and the postyield stiff-ness Kp are calculated as the slopes from 0 to yield force Vy andfrom Vy to the plastic capacity Vp, respectively. Beyond the plasticcapacity, mild hardening is represented by a slope of αKp withα ¼ 0:03 (Fig. 2). To implement the rotational springs, the shearstrain γ = the rotation angle, and the panel zone shear V is related toΔM (the net moment transferred to the connection) according to:
V ¼ ΔMdb
ð3Þ
Reduced Beam Section
The RBS approach was developed as an improved approach fol-lowing the unexpected brittle failures of steel moment frame con-nections in the Northridge earthquake, and is now used extensively(Foutch and Yun 2002; FEMA 2000b). In the RBS configuration,portions of the beam flanges at a section away from the beam end
Table 2. Design Parameters for the Isolation Systems
Isolator properties Design earthquake MCE
Effective period (s) TD ¼ 2:77 TM ¼ 3:07
Effective damping (%) BD ¼ 24:2 BM ¼ 15:8
Isolator displacement [cm (in.)] DD ¼ 32:1 (12.7) DM ¼ 61:7 (24.3)
Total displacement [cm (in.)] DTD ¼ 38:8 (15.3) DTM ¼ 74:6 (29.4)
Fig. 2. Panel zone force-deformation behavior
1120 / JOURNAL OF STRUCTURAL ENGINEERING © ASCE / OCTOBER 2011
Downloaded 02 Nov 2011 to 129.123.244.162. Redistribution subject to ASCE license or copyright. Visit http://www.ascelibrary.org
are tapered. This approach has been observed to effectively elimi-nate brittle fractures by transferring the zone of plasticity awayfrom the column (Lee and Foutch 2002; FEMA 2000b), as wellas improve the overall ductility capacity of the beam-to-columnassembly (Shen et al. 2000).
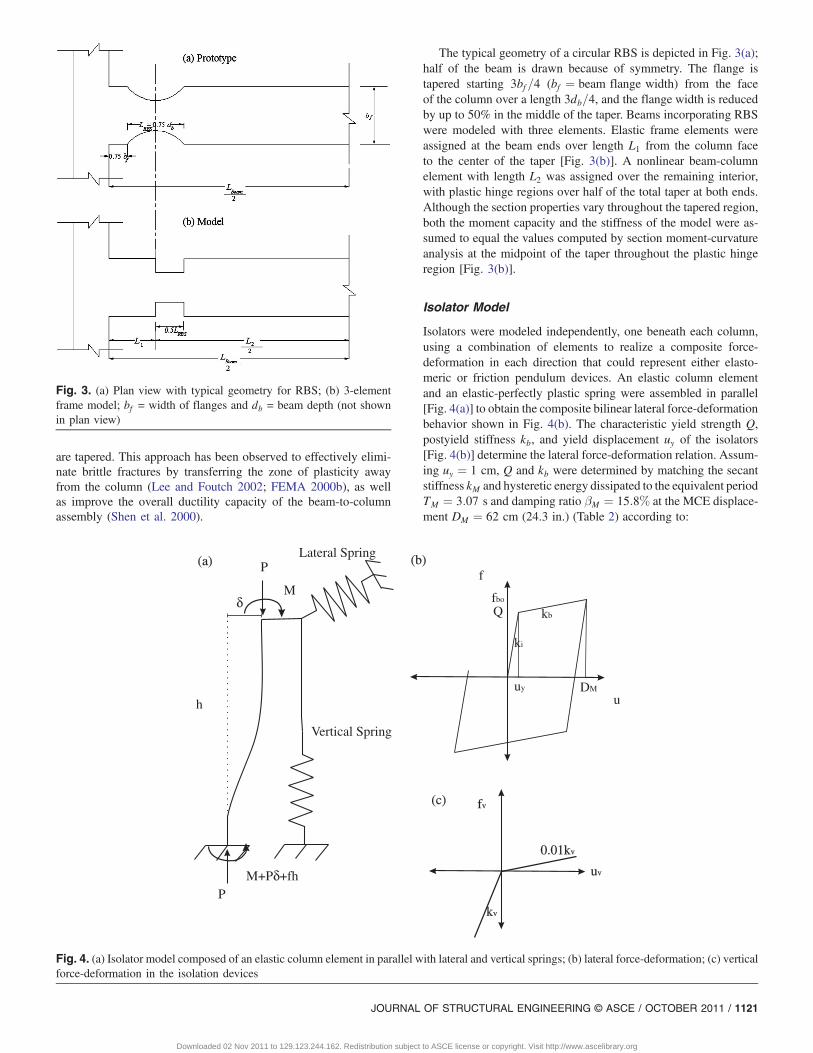
The typical geometry of a circular RBS is depicted in Fig. 3(a);half of the beam is drawn because of symmetry. The flange istapered starting 3bf =4 (bf ¼ beam flange width) from the faceof the column over a length 3db=4, and the flange width is reducedby up to 50% in the middle of the taper. Beams incorporating RBSwere modeled with three elements. Elastic frame elements wereassigned at the beam ends over length L1 from the column faceto the center of the taper [Fig. 3(b)]. A nonlinear beam-columnelement with length L2 was assigned over the remaining interior,with plastic hinge regions over half of the total taper at both ends.Although the section properties vary throughout the tapered region,both the moment capacity and the stiffness of the model were as-sumed to equal the values computed by section moment-curvatureanalysis at the midpoint of the taper throughout the plastic hingeregion [Fig. 3(b)].
Isolator Model
Isolators were modeled independently, one beneath each column,using a combination of elements to realize a composite force-deformation in each direction that could represent either elasto-meric or friction pendulum devices. An elastic column elementand an elastic-perfectly plastic spring were assembled in parallel[Fig. 4(a)] to obtain the composite bilinear lateral force-deformationbehavior shown in Fig. 4(b). The characteristic yield strength Q,postyield stiffness kb, and yield displacement uy of the isolators[Fig. 4(b)] determine the lateral force-deformation relation. Assum-ing uy ¼ 1 cm, Q and kb were determined by matching the secantstiffness kM and hysteretic energy dissipated to the equivalent periodTM ¼ 3:07 s and damping ratio βM ¼ 15:8% at the MCE displace-ment DM ¼ 62 cm (24.3 in.) (Table 2) according to:
Fig. 3. (a) Plan view with typical geometry for RBS; (b) 3-elementframe model; bf = width of flanges and db = beam depth (not shownin plan view)
δ
P
M
P
h
M+P +fhδ
uy DM
ki
u
f
fbo
Q
fvfv
uvuv
kvkv
0.01kv0.01kv
Lateral Spring
Vertical Spring
(a)(a) (b)(b)
(c)(c)
kb
Fig. 4. (a) Isolator model composed of an elastic column element in parallel with lateral and vertical springs; (b) lateral force-deformation; (c) verticalforce-deformation in the isolation devices
JOURNAL OF STRUCTURAL ENGINEERING © ASCE / OCTOBER 2011 / 1121
Downloaded 02 Nov 2011 to 129.123.244.162. Redistribution subject to ASCE license or copyright. Visit http://www.ascelibrary.org
Q ¼ πkMβMD2M
2ðDM � uyÞð4Þ
kb ¼ kM � QDM
ð5Þ
The elastic-perfectly plastic spring, with stiffness ki-kb and yieldstrengthQ, is a bidirectionally coupled element with a circular yieldsurface that exhibits identical resistance in any direction in the x-yplane. The column allows transfer of the approximate moments thatarise attributable to the lateral deformation of the isolator. For thecolumn element, EI was selected to obtain a lateral stiffness kb, andthe effective height h0 was selected such that the moment in theelement f h0 equals the moment f hþ Pδ in the isolator at the designdisplacement.
Likewise, the composite vertical force-deformation behavior[Fig. 4(c)] was built from the axial stiffness of the column elementacting in parallel with a compression-only vertical spring [Fig. 4(a)].The compressive stiffness kv of the isolatorswas computed assuminga vertical frequency of 10 Hz. Since typical bearings have no or lowresistance to tension, the tensile stiffness was assumed to be 1% ofthe value of the compressive stiffness, and EA for the columnelement was calibrated to a stiffness of 0:01kv. The energy dissipa-tion is provided by hysteresis in the lateral directions and 5%viscousdamping in the vertical direction at 10 Hz.
Fundamental Properties
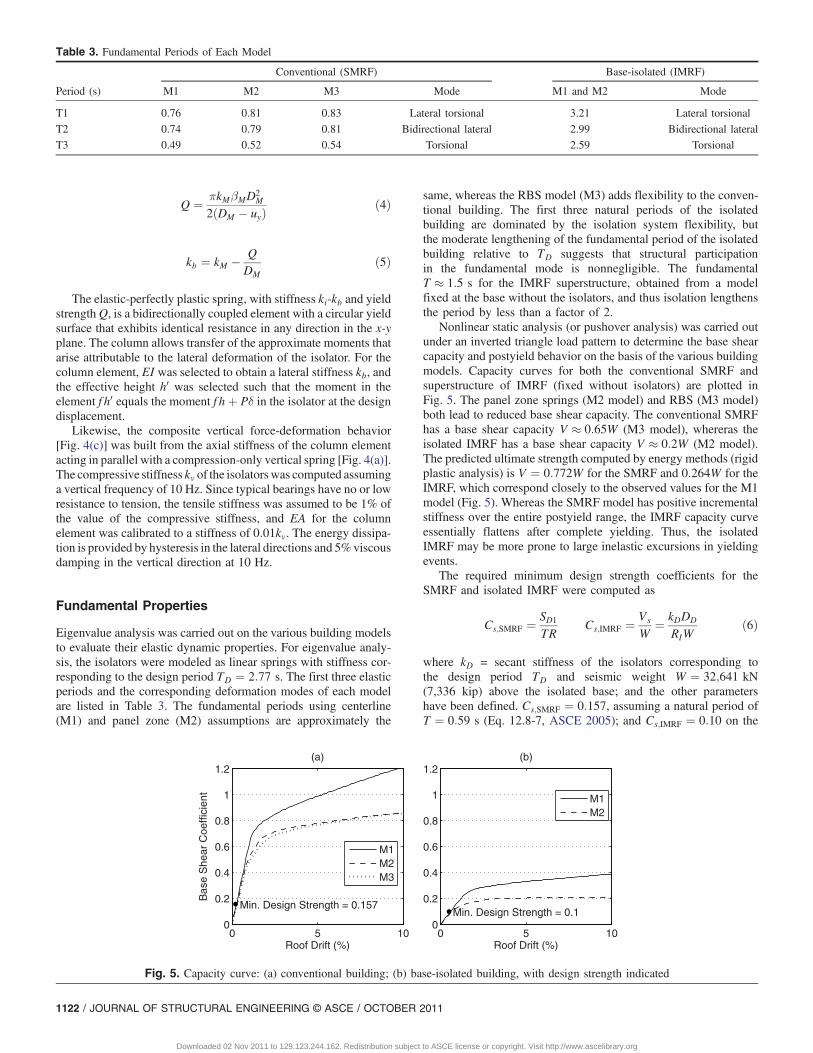
Eigenvalue analysis was carried out on the various building modelsto evaluate their elastic dynamic properties. For eigenvalue analy-sis, the isolators were modeled as linear springs with stiffness cor-responding to the design period TD ¼ 2:77 s. The first three elasticperiods and the corresponding deformation modes of each modelare listed in Table 3. The fundamental periods using centerline(M1) and panel zone (M2) assumptions are approximately the
same, whereas the RBS model (M3) adds flexibility to the conven-tional building. The first three natural periods of the isolatedbuilding are dominated by the isolation system flexibility, butthe moderate lengthening of the fundamental period of the isolatedbuilding relative to TD suggests that structural participationin the fundamental mode is nonnegligible. The fundamentalT ≈ 1:5 s for the IMRF superstructure, obtained from a modelfixed at the base without the isolators, and thus isolation lengthensthe period by less than a factor of 2.
Nonlinear static analysis (or pushover analysis) was carried outunder an inverted triangle load pattern to determine the base shearcapacity and postyield behavior on the basis of the various buildingmodels. Capacity curves for both the conventional SMRF andsuperstructure of IMRF (fixed without isolators) are plotted inFig. 5. The panel zone springs (M2 model) and RBS (M3 model)both lead to reduced base shear capacity. The conventional SMRFhas a base shear capacity V ≈ 0:65W (M3 model), whereras theisolated IMRF has a base shear capacity V ≈ 0:2W (M2 model).The predicted ultimate strength computed by energy methods (rigidplastic analysis) is V ¼ 0:772W for the SMRF and 0:264W for theIMRF, which correspond closely to the observed values for the M1model (Fig. 5). Whereas the SMRF model has positive incrementalstiffness over the entire postyield range, the IMRF capacity curveessentially flattens after complete yielding. Thus, the isolatedIMRF may be more prone to large inelastic excursions in yieldingevents.
The required minimum design strength coefficients for theSMRF and isolated IMRF were computed as
Cs;SMRF ¼ SD1TR
Cs;IMRF ¼ Vs
W¼ kDDD
RIWð6Þ
where kD = secant stiffness of the isolators corresponding tothe design period TD and seismic weight W ¼ 32;641 kN(7,336 kip) above the isolated base; and the other parametershave been defined. Cs;SMRF ¼ 0:157, assuming a natural period ofT ¼ 0:59 s (Eq. 12.8-7, ASCE 2005); and Cs;IMRF ¼ 0:10 on the
Table 3. Fundamental Periods of Each Model
Period (s)
Conventional (SMRF) Base-isolated (IMRF)
M1 M2 M3 Mode M1 and M2 Mode
T1 0.76 0.81 0.83 Lateral torsional 3.21 Lateral torsional
T2 0.74 0.79 0.81 Bidirectional lateral 2.99 Bidirectional lateral
T3 0.49 0.52 0.54 Torsional 2.59 Torsional
0 5 100
0.2
0.4
0.6
0.8
1
1.2(a)
Roof Drift (%)
Bas
e S
hear
Coe
ffici
ent
Min. Design Strength = 0.157
M1M2M3
0 5 100
0.2
0.4
0.6
0.8
1
1.2(b)
Roof Drift (%)
Min. Design Strength = 0.1
M1M2
Fig. 5. Capacity curve: (a) conventional building; (b) base-isolated building, with design strength indicated
1122 / JOURNAL OF STRUCTURAL ENGINEERING © ASCE / OCTOBER 2011
Downloaded 02 Nov 2011 to 129.123.244.162. Redistribution subject to ASCE license or copyright. Visit http://www.ascelibrary.org
basis of Vs ¼ kDDD=RI ¼ 3;306 kN (743 kip). The SMRF is ob-served to be at least three times stronger than the IMRF, mostlybecause the SMRF has more overstrength. The design of bothbuildings is drift-controlled; however, the code factor Cd by whichelastic drift is amplified is 5.5 for the SMRF and only 1.67 (equal toRI ) for the IMRF. Thus, considering the effects of overstrength, theductility based R≈ 2 for the SMRF and 1 for the IMRF, suggestingthat the observed level of yielding in the two structures is closerthan expected.
Ground Motions
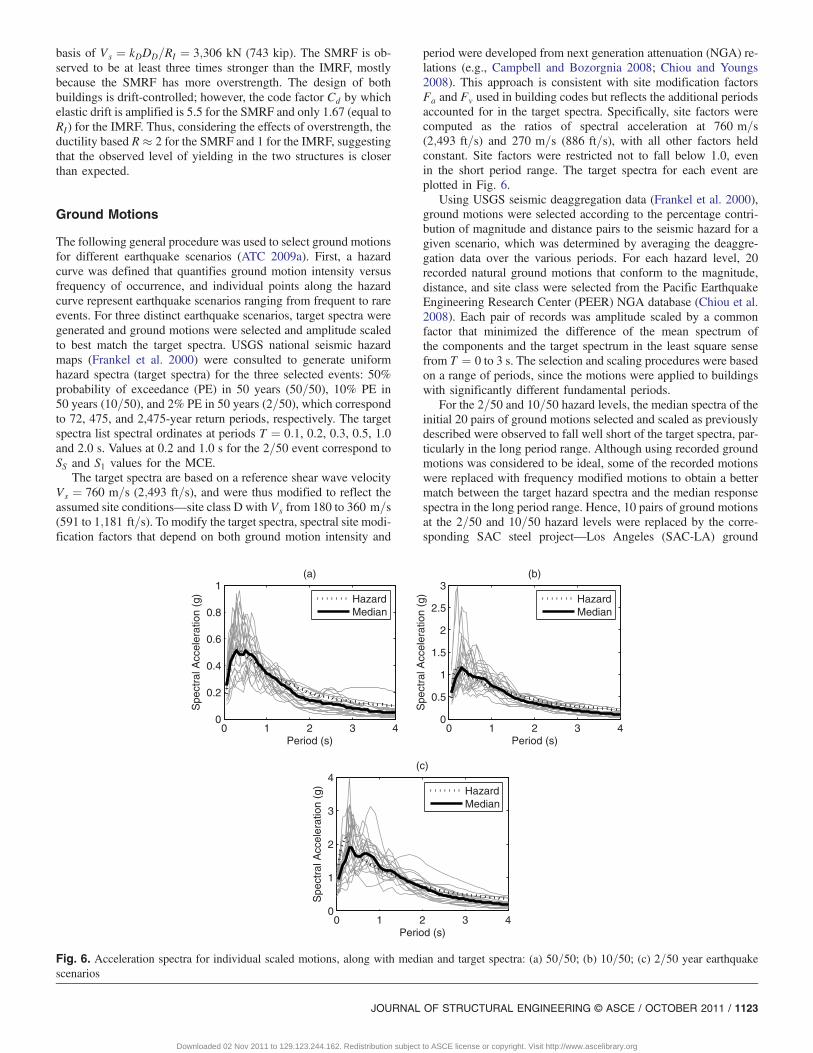
The following general procedure was used to select ground motionsfor different earthquake scenarios (ATC 2009a). First, a hazardcurve was defined that quantifies ground motion intensity versusfrequency of occurrence, and individual points along the hazardcurve represent earthquake scenarios ranging from frequent to rareevents. For three distinct earthquake scenarios, target spectra weregenerated and ground motions were selected and amplitude scaledto best match the target spectra. USGS national seismic hazardmaps (Frankel et al. 2000) were consulted to generate uniformhazard spectra (target spectra) for the three selected events: 50%probability of exceedance (PE) in 50 years (50=50), 10% PE in50 years (10=50), and 2% PE in 50 years (2=50), which correspondto 72, 475, and 2,475-year return periods, respectively. The targetspectra list spectral ordinates at periods T ¼ 0:1, 0.2, 0.3, 0.5, 1.0and 2.0 s. Values at 0.2 and 1.0 s for the 2=50 event correspond toSS and S1 values for the MCE.
The target spectra are based on a reference shear wave velocityVs ¼ 760 m=s (2;493 ft=s), and were thus modified to reflect theassumed site conditions—site class D with Vs from 180 to 360 m=s(591 to 1;181 ft=s). To modify the target spectra, spectral site modi-fication factors that depend on both ground motion intensity and
period were developed from next generation attenuation (NGA) re-lations (e.g., Campbell and Bozorgnia 2008; Chiou and Youngs2008). This approach is consistent with site modification factorsFa and Fv used in building codes but reflects the additional periodsaccounted for in the target spectra. Specifically, site factors werecomputed as the ratios of spectral acceleration at 760 m=s(2;493 ft=s) and 270 m=s (886 ft=s), with all other factors heldconstant. Site factors were restricted not to fall below 1.0, evenin the short period range. The target spectra for each event areplotted in Fig. 6.
Using USGS seismic deaggregation data (Frankel et al. 2000),ground motions were selected according to the percentage contri-bution of magnitude and distance pairs to the seismic hazard for agiven scenario, which was determined by averaging the deaggre-gation data over the various periods. For each hazard level, 20recorded natural ground motions that conform to the magnitude,distance, and site class were selected from the Pacific EarthquakeEngineering Research Center (PEER) NGA database (Chiou et al.2008). Each pair of records was amplitude scaled by a commonfactor that minimized the difference of the mean spectrum ofthe components and the target spectrum in the least square sensefrom T ¼ 0 to 3 s. The selection and scaling procedures were basedon a range of periods, since the motions were applied to buildingswith significantly different fundamental periods.
For the 2=50 and 10=50 hazard levels, the median spectra of theinitial 20 pairs of ground motions selected and scaled as previouslydescribed were observed to fall well short of the target spectra, par-ticularly in the long period range. Although using recorded groundmotions was considered to be ideal, some of the recorded motionswere replaced with frequency modified motions to obtain a bettermatch between the target hazard spectra and the median responsespectra in the long period range. Hence, 10 pairs of ground motionsat the 2=50 and 10=50 hazard levels were replaced by the corre-sponding SAC steel project—Los Angeles (SAC-LA) ground
0 1 2 3 40
1
2
3
4
Spe
ctra
l Acc
eler
atio
n (g
)
Period (s)
(c)
HazardMedian
0 1 2 3 40
0.5
1
1.5
2
2.5
3
Spe
ctra
l Acc
eler
atio
n (g
)
Period (s)
(b)
HazardMedian
0 1 2 3 40
0.2
0.4
0.6
0.8
1
Spe
ctra
l Acc
eler
atio
n (g
)
Period (s)
(a)
HazardMedian
Fig. 6. Acceleration spectra for individual scaled motions, along with median and target spectra: (a) 50=50; (b) 10=50; (c) 2=50 year earthquakescenarios
JOURNAL OF STRUCTURAL ENGINEERING © ASCE / OCTOBER 2011 / 1123
Downloaded 02 Nov 2011 to 129.123.244.162. Redistribution subject to ASCE license or copyright. Visit http://www.ascelibrary.org
motion sets. These SAC motions were originally selected forsimilar location and site conditions and frequency modified tomatch the target spectra (Somerville et al. 1998).
The ground motions selected for the nonlinear response historyanalyses for the 50=50, 10=50, and 2=50 events, respectively, arelisted on the Network for Earthquake Engineering Simulation(NEES) TIPS project website (NEES 2009). Fig. 6 compares5% damped acceleration spectra (mean of the x and y components)of the 20 pairs of scaled motions along with their median with thetarget spectra for each hazard level. A large variance in spectra forindividual motions relative to the median is observed. In particular,each hazard level includes some motions with peak accelerationsthat are 2–3 times the target values at high frequencies. The 2=50event contains at least one motion with very large spectral accel-erations in the long period range [Fig. 6(c)]. However, for all hazardlevels, the median spectrum falls somewhat short of the target spec-trum beyond T ¼ 1:5 s despite the introduction of frequency modi-fied motions.
Comparative Results of Nonlinear Response HistoryAnalysis
Nonlinear response history analyses (RHA) were carried out tocomparatively evaluate the structural response of the conventionalSMRF and isolated IMRF when subjected to the ground motionsuites described previously. The statistical distribution of variousresponse quantities for 2=50, 10=50, and 50=50 year events arepresented. The selected response quantities include peak andresidual story drift ratio, peak total floor acceleration, local element(beam, column, and panel zone) plastic rotations, and isolator de-formations (lateral and vertical). Story drift ratios indicate damageto structural elements and drift-sensitive nonstructural components,whereas floor accelerations indicate damage in acceleration sensi-tive nonstructural components and contents. Plastic rotation
demands of individual elements can more precisely indicate localdamage, and residual drift criteria determine the threshold betweenrestoring and demolishing a damaged building.
Seismic responses, when sampled overmany groundmotions, arewidely accepted to be lognormally distributed. As such, themedian x̂and dispersion δ of the lognormal data were generally used to de-scribe the central tendencies and variability of the response quantitiesfor different ground motion sets. They were computed as
x̂ ¼ exp
�Pni¼1 ln xin
�δ ¼
�Pni¼1ðln xi � ln x̂Þ2
n� 1
�1=2
ð7Þ
However, statistical evaluation on the basis of lognormal distri-bution [Eq. (7)] is not valid when the sampling set contains zeros,as is the case for plastic rotations. Thus, arithmetic mean μ andstandard deviation σ
μ ¼Pixi
nσ ¼
ffiffiffiffiffiffiffiffiffiffiffiffiffiffiffiffiffiffiffiffiffiffiPiðxi � x̂Þ2
n� 1
vuut ð8Þ
valid for a normal distribution, were used to describe centraltendency and variability of the plastic rotation demands. The84th percentile values were computed as x̂ expðδÞ when used withEq. (7) and μþ σ when used with Eq. (8).
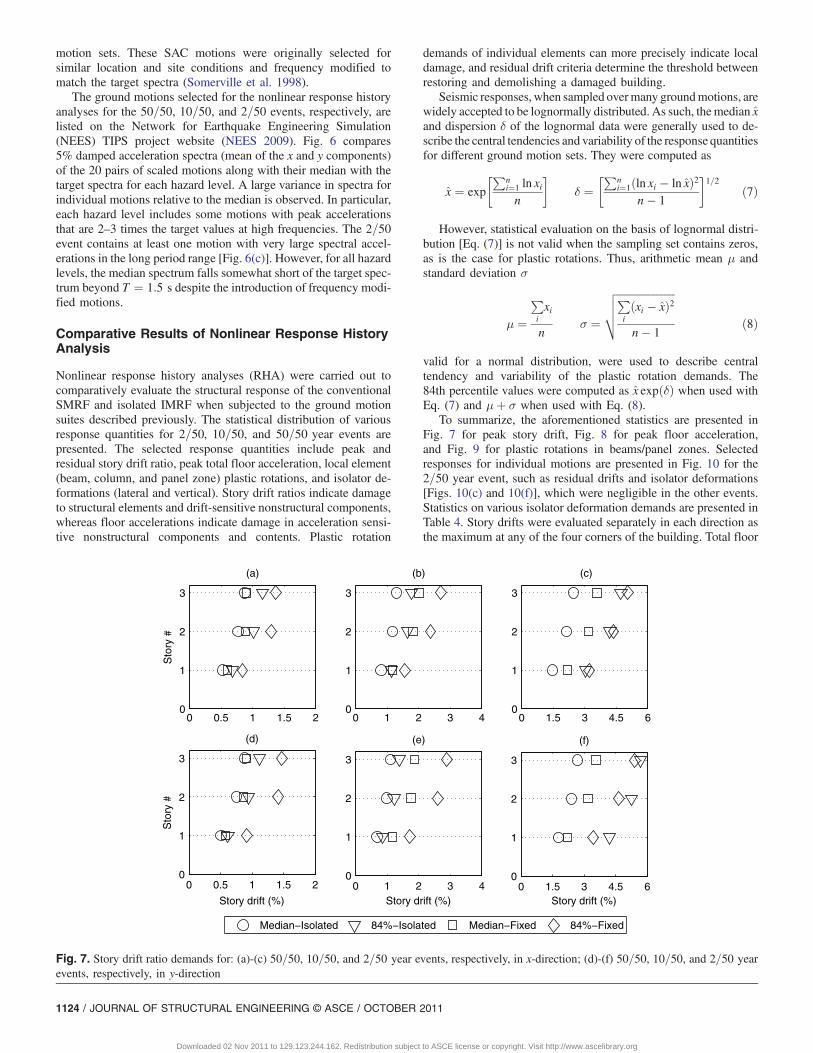
To summarize, the aforementioned statistics are presented inFig. 7 for peak story drift, Fig. 8 for peak floor acceleration,and Fig. 9 for plastic rotations in beams/panel zones. Selectedresponses for individual motions are presented in Fig. 10 for the2=50 year event, such as residual drifts and isolator deformations[Figs. 10(c) and 10(f)], which were negligible in the other events.Statistics on various isolator deformation demands are presented inTable 4. Story drifts were evaluated separately in each direction asthe maximum at any of the four corners of the building. Total floor
0 0.5 1 1.5 20
1
2
3
(a)
Sto
ry #
0 1 2 3 40
1
2
3
(b)
0 1.5 3 4.5 60
1
2
3
(c)
0 0.5 1 1.5 20
1
2
3
(d)
Story drift (%)
Sto
ry #
Median−Isolated 84%−Isolated Median−Fixed 84%−Fixed
0 1 2 3 40
1
2
3
Story drift (%)
(e)
0 1.5 3 4.5 60
1
2
3
Story drift (%)
(f)
Fig. 7. Story drift ratio demands for: (a)-(c) 50=50, 10=50, and 2=50 year events, respectively, in x-direction; (d)-(f) 50=50, 10=50, and 2=50 yearevents, respectively, in y-direction
1124 / JOURNAL OF STRUCTURAL ENGINEERING © ASCE / OCTOBER 2011
Downloaded 02 Nov 2011 to 129.123.244.162. Redistribution subject to ASCE license or copyright. Visit http://www.ascelibrary.org
acceleration at the center of mass and isolator deformations (maxi-mum over all devices) were evaluated as the vector sums of thedemands in the x and y directions. Plastic rotation demands wereevaluated as the maximum over all pertinent elements at the givenlevel. When multiple locations or elements were considered,statistics reflect the median (mean) of the local maxima, whichmay occur at different locations/elements for different groundmotions.
Response in Design (10=50 Year) and Frequent(50=50Year) Events
Although not explicitly identified in building codes, typical designobjectives for an isolated building are to suppress yielding and at-tenuate accelerations to well below the peak ground acceleration
(PGA) in the design (10=50 year) event. Using approximate designprinciples, yield interstory drifts Δy were evaluated as
Δy ¼εyh3
�αhdc
þ Lbdb
�ð9Þ
where εy = yield strain; α = reduction factor of 0.8; h and dc = storyheight and depth of the column; and Lb and db = length and depth ofthe beam, which led to yield interstory drift values of 1.2% in theconventional SMRF and 1.5% in the isolated IMRF.
For both the frequent (50=50 year) and design events, the storydrift demands in the isolated IMRF are below the yield limit of1.5% [Figs. 7(a), 7(b), 7(d), and 7(e)], with the exception of the84th percentile in the design event. Beam plastic rotation demandsare essentially zero [Figs. 9(a) and 9(b)]. The conventional SMRF
0 0.25 0.5 0.75 1
0
1
2
3
Total Floor Acceleration (g)
(a)
Sto
ry #
0 0.4 0.8 1.2 1.6
0
1
2
3
Total Floor Acceleration (g)
(b)
0 0.4 0.8 1.2 1.6
0
1
2
3
Total Floor Acceleration (g)
(c)
Median−Isolated 84%−Isolated Median−Fixed 84%−Fixed
Fig. 8. Total floor acceleration demands: (a) 50=50; (b) 10=50; (c) 2=50 year events
0 0.005 0.010
1
2
3
Sto
ry #
(a)
0 0.01 0.020
1
2
3
(b)
0 0.01 0.02 0.03 0.040
1
2
3
(c)
0 0.005 0.010
1
2
3
Plastic rotation θp (rad)
Sto
ry #
(d)
0 0.01 0.020
1
2
3
Plastic rotation θp (rad)
(e)
0 0.02 0.04 0.06 0.080
1
2
3
Plastic rotation θp (rad)
(f)
Mean−Isolated 84%−Isolated Mean−Fixed 84%−Fixed
Fig. 9. Beam plastic rotation demands for: (a) 50=50; (b) 10=50; (c) 2=50 year events; and panel zone plastic rotation demands for: (d) 50=50;(e) 10=50; (f) 2=50 year events
JOURNAL OF STRUCTURAL ENGINEERING © ASCE / OCTOBER 2011 / 1125
Downloaded 02 Nov 2011 to 129.123.244.162. Redistribution subject to ASCE license or copyright. Visit http://www.ascelibrary.org
more certainly yields in the design event, with median story driftdemands around 2% in stories 2 and 3 [Figs. 7(b) and 7(e)], andmedian beam plastic rotation demands from 0.01 to 0.015 rad infloors 1 and 2 [Fig. 9(b)]. In the frequent event, the conventionalSMRF is on the verge of yielding, with median story drifts around1.2% [Fig. 7(a)] and accumulated beam plastic rotations around0.004 rad. Column plastic rotation demands (not shown) were gen-erally close to zero everywhere in both buildings. Column plasticrotations occur only at the base of the conventional SMRF inthe design and larger events, thus the capacity design concepteffectively prevents column yielding and soft story mechanisms.Minor panel zone yielding is observed in the isolated IMRF for
the design and even frequent events [Figs. 9(d) and 9(e)]. AISC341 (2005) intends that panel zone yielding should not precedehinge formation in an SMRF; however, the same criteria do notapply to systems detailed as IMRF, which could explain whythe panel zone yielding occurs even in relatively small events. Itmay be desirable to further examine the IMRF design criteriafor isolated buildings. Although minor instances of yielding areobserved in the design event, the design objectives could be inter-preted as having been met or nearly met.
With respect to accelerations, the median roof acceleration in theisolated IMRF is attenuated by a factor of almost 2 (PGA ¼ 0:61 gand roof acceleration ¼ 0:33 g) in the design event [Fig. 8(b)].However, the median roof acceleration demand in the conventionalSMRF is amplified to 1.15 g for the same event. The accelerationsat level 0 (ground) designate PGA and the accelerations between 0and 1 designate accelerations just above the isolators (Fig. 8). Thedesign objectives for acceleration in the IMRF have certainlybeen met.
For the design and frequent events, the demands in the isolatedbuilding can be predicted with high confidence as the dispersions(reflected in the difference between median and 84th percentileresponses) in story drifts and especially total floor accelerationsare quite small [Figs. 7(a), 7(b), 7(d), 7(e), 8(a), and 8(b)]. Sincethe isolated IMRF responds close to elastically, the dispersion instory drift is limited relative to the conventional SMRF. Regarding
0 5 10 15 200
5
10
15
20
EQ No #P
eak
Sto
ry D
rift (
%)
(a)
0 5 10 15 200
0.5
1
1.5
2
EQ No #
Acc
eler
atio
n (g
)
(b)
PGA ,for figure (b) only Conventional Isolated
0 5 10 15 200
5
10
15
EQ No #
Res
idua
l Drif
t (%
)
(c)
0 5 10 15 200
50
100
150
200
EQ No #
Pea
k La
tera
l Def
. (cm
)
(d)
0 5 10 15 200
5
10
15
EQ No #
Upl
ift D
ispl
acem
ent (
cm)
(e)
0 5 10 15 200
2
4
6
8
10
EQ No #
Res
idua
l Lat
eral
Def
. (cm
) (f)
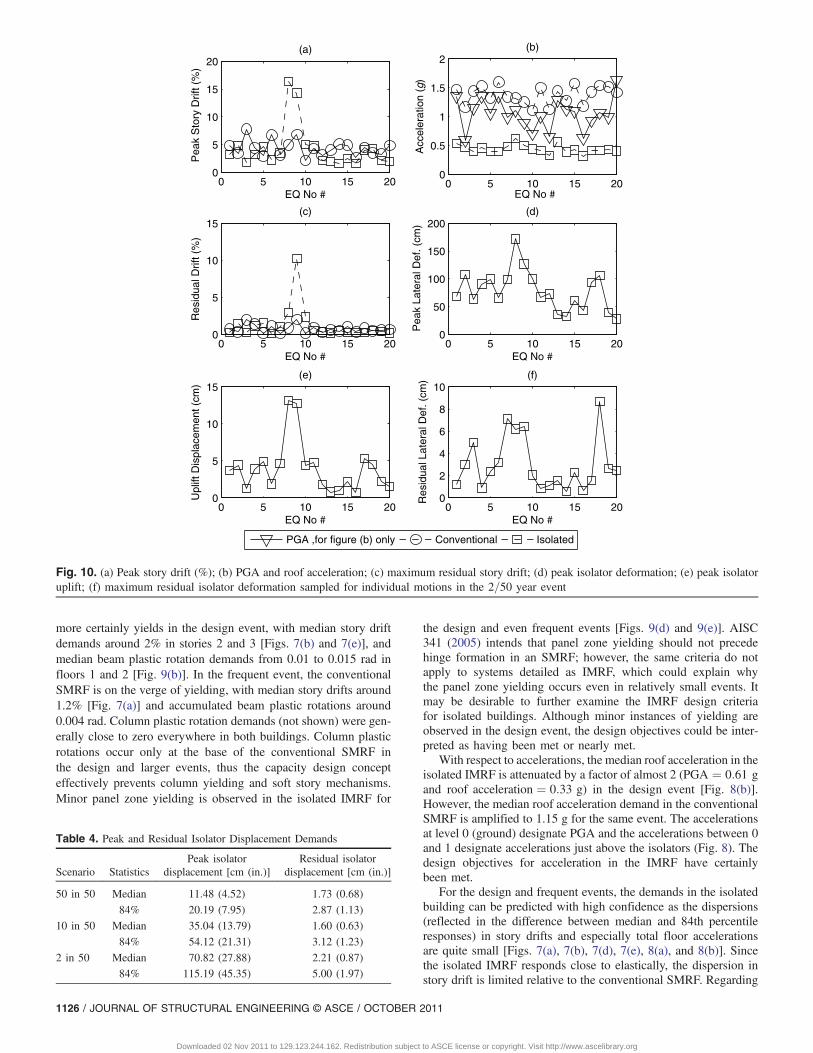
Fig. 10. (a) Peak story drift (%); (b) PGA and roof acceleration; (c) maximum residual story drift; (d) peak isolator deformation; (e) peak isolatoruplift; (f) maximum residual isolator deformation sampled for individual motions in the 2=50 year event
Table 4. Peak and Residual Isolator Displacement Demands
Scenario StatisticsPeak isolator
displacement [cm (in.)]Residual isolator
displacement [cm (in.)]
50 in 50 Median 11.48 (4.52) 1.73 (0.68)
84% 20.19 (7.95) 2.87 (1.13)
10 in 50 Median 35.04 (13.79) 1.60 (0.63)
84% 54.12 (21.31) 3.12 (1.23)
2 in 50 Median 70.82 (27.88) 2.21 (0.87)
84% 115.19 (45.35) 5.00 (1.97)
1126 / JOURNAL OF STRUCTURAL ENGINEERING © ASCE / OCTOBER 2011
Downloaded 02 Nov 2011 to 129.123.244.162. Redistribution subject to ASCE license or copyright. Visit http://www.ascelibrary.org
floor accelerations, extreme values (high or low) of PGA are ob-served not to correlate well with extreme values of roof accelerationin the isolated IMRF, as shown plotted for each ground motion[Fig. 10(b)] for the 2=50 year event (MCE), where limiteddispersion was also observed [Fig. 8(c)]. One possible explanationfor the small dispersion in acceleration is that period lengtheninggenerally has a smoothing effect on spectral accelerations, whichare correlated to floor accelerations.
Although the benefits of seismic isolation are apparent, storydrift reduction is somewhat suppressed compared with ideal appli-cations because of the flexibility of the moment frame. For thedesign event, median story drift demands in the isolated IMRFare reduced on the order of 33–50% relative to the conventionalSMRF [Figs. 7(b) and 7(e)], which is small compared with expect-ations set by pedagogical studies (e.g., Kelly 1997). Althoughcomparative studies often assume comparable natural periods(e.g., Sayani and Ryan 2009), in this study, the IMRF without iso-lators is substantially more flexible than the conventional SMRF.Furthermore, the effective isolation period (TD ¼ 2:77 s) exceedsthe superstructure natural period (T ¼ 1:5 s) by less than a factorof 2 at the design displacement. Therefore, significant structuralparticipation in the first mode, leading to moderate story driftdemands, is unsurprising. Damage in drift-sensitive nonstructuralcomponents is not eliminated in the design event by seismic iso-lation, as damage to interior partition walls is predicted at mediandrifts as low as 0.25% (ATC 2009a).
The relative drift reduction is even smaller for the frequent eventcompared with the design event, wherein median story drift de-mands are reduced only slightly relative to the conventional SMRF[Figs. 7(a) and 7(d)]. To interpret, the isolation system becomes lesseffective for earthquake intensities lower than the design event be-cause it is not fully activated [median deformation ¼ 11:48 cm(4.52 in.) (Table 4)], resulting in a higher effective stiffness anda smaller period separation compared with the superstructure.As further evidence, floor accelerations, normally reduced by atleast a factor of 2 relative to PGA, are no less than 2=3 of PGAin the frequent event [Fig. 8(a)].
Response in MCE (2=50 Year Event)
Although story drifts for the isolated IMRF are generally reduced inthe MCE (2=50 year event) relative to the conventional SMRF, thesame confidence in the superior performance of isolation in adesign event cannot be extended to the MCE. For example, themedian peak story drift is reduced from about 3.6% for the conven-tional SMRF to about 2.7% for the isolated IMRF, but the 84thpercentile story drift demands are comparable in both, if not largerin the IMRF [Figs. 7(c) and 7(f)]. The increase in the 84th percen-tile drift is the result of outliers; for example, records 8 and 9 inducepeak drift demands on the order of 15–16% in the isolated IMRF[Fig. 10(a)]. The residual story drift in the isolated IMRF from re-cord 9 is predicted to be on the order of 11% [Fig. 10(c)], whichwould almost certainly lead to collapse. Similar outliers are not ob-served for the conventional SMRF, as several motions induce peakstory drifts on the order of 5–8% [Fig. 10(a)] and residual drifts onthe order of 1–2% [Fig. 10(c)]. Analysis of the outliers is discussedfurther in the next section. The isolation system is very effective inlimiting total floor accelerations to levels well below the PGA[Fig. 8(c)]. Through the simple force balance concept, structuralyielding helps to limit acceleration demands. Thus, accelerationoutliers [Fig. 10(b)] or large acceleration dispersions [Fig. 8(c)]are not observed for the isolated IMRF in the MCE.
Several motions in addition to those that have been declared asoutliers induce isolator deformation demands beyond those thatcould reasonably be accommodated by the isolation system, and
in such instances the predicted response of the IMRF is unreliable.The median isolator deformation of 70.82 cm (27.88 in.) (Table 4)exceeds the MCE displacement DM ¼ 61:7 cm (24.3 in.) (Table 2),and the 84th percentile deformation of 115.19 cm (45.35 in.)(Table 4) exceeds DTM ¼ 74:6 cm (29.4 in.) (Table 2). Further-more, the peak isolator deformation exceeds DTM for 9 of 20ground motions [Fig. 10(d)]. Since the seismic gap length and moatwall location are at the designer’s discretion, the potential collisionwith a moat wall was not simulated in this study. However, underreasonable design practices, collisions with the outer moat wallwould be expected for some of the ground motions considered,and the impact would transmit high-frequency waves throughthe superstructure that may lead to an increase in drifts and accel-erations in the superstructure compared with those predicted inthis study.
The uplift displacement demands in isolators, sampled for indi-vidual ground motions in Fig. 10(e), are also of concern. The aver-age uplift is around 2.5 cm (1 in.), which would probably beacceptable in design, but exceeds 12.5 cm (5 in.) for two of theground motions. In reality, different isolation devices manage upliftin a variety of ways that are not well captured in this study.
Residual drift demands in both buildings are usually below 1%,but demands above 2% are induced by a couple of motions for theconventional SMRF and several motions for the isolated IMRF,including one outlier that has already been discussed [Fig. 10(c)].Residual isolator deformations are generally below 2.5 cm (1 in.),but for a few records, fall between 5 and 10 cm (2 and 4 in.)[Fig. 10(f)]. As observed previously, drift demands are somewhatcomparable in both buildings [Figs. 7(c) and 7(f)]. Beam plasticrotations are the source of large drifts for the conventional SMRF[Fig. 9(c)], whereas panel zone plastic rotations are the source oflarge drifts for the isolated IMRF [Fig. 9(f)]. Beam rotations arelarger for the conventional SMRF because the RBS model reducesthe beam capacity relative to the panel zone capacity. Even thoughthe relative beam versus panel zone plastic rotations are known tobe sensitive to the modeling assumptions, the high panel zone ro-tation demands in the isolated IMRF, on the order of 0.06–0.07 rad(6–7%) at the 84th percentile, confirms the previous suggestion thatthe appropriateness of the IMRF panel zone design criteria for usein isolated buildings should be verified. The ductility capacity ofthe WUF-W connection used in the IMRF is expected to be lowerthan the RBS connection used in the SMRF, perhaps putting theisolated IMRF at risk of weld fractures in the MCE.
As stated previously, although design objectives could be inter-preted as being met, significant performance benefits would likelybe seen, especially in the MCE, by stiffening and strengthening thesuperstructure of the isolated IMRF beyond minimum codecompliance. Some California jurisdictions have chosen to exceedInternational Building Code (IBC) requirements by enforcing a de-sign of RI ¼ 1 in the MCE for nonductile systems, such as IMRFand ordinary braced frames. On the other hand, no amount ofstrengthening and stiffening would help to control isolator defor-mations in the MCE. The deformation demands are very suscep-tible to the ground motions, which are discussed further in thenext section.
Discussion of Outliers
The phenomenon of the outlier responses is studied further byanalyzing the feasibility of both the isolator deformations andstory drifts predicted in the simulation. Recall that the isolation sys-tem was designed for a period TM ¼ 3:07 s and damping ratioβM ¼ 15:8%, with a design deformation of 62 cm (24 in.) (Table 2).For the 2=50 year event, 20 ground motion records were selectedand scaled such that the mean component spectra (i.e., mean of
JOURNAL OF STRUCTURAL ENGINEERING © ASCE / OCTOBER 2011 / 1127
Downloaded 02 Nov 2011 to 129.123.244.162. Redistribution subject to ASCE license or copyright. Visit http://www.ascelibrary.org
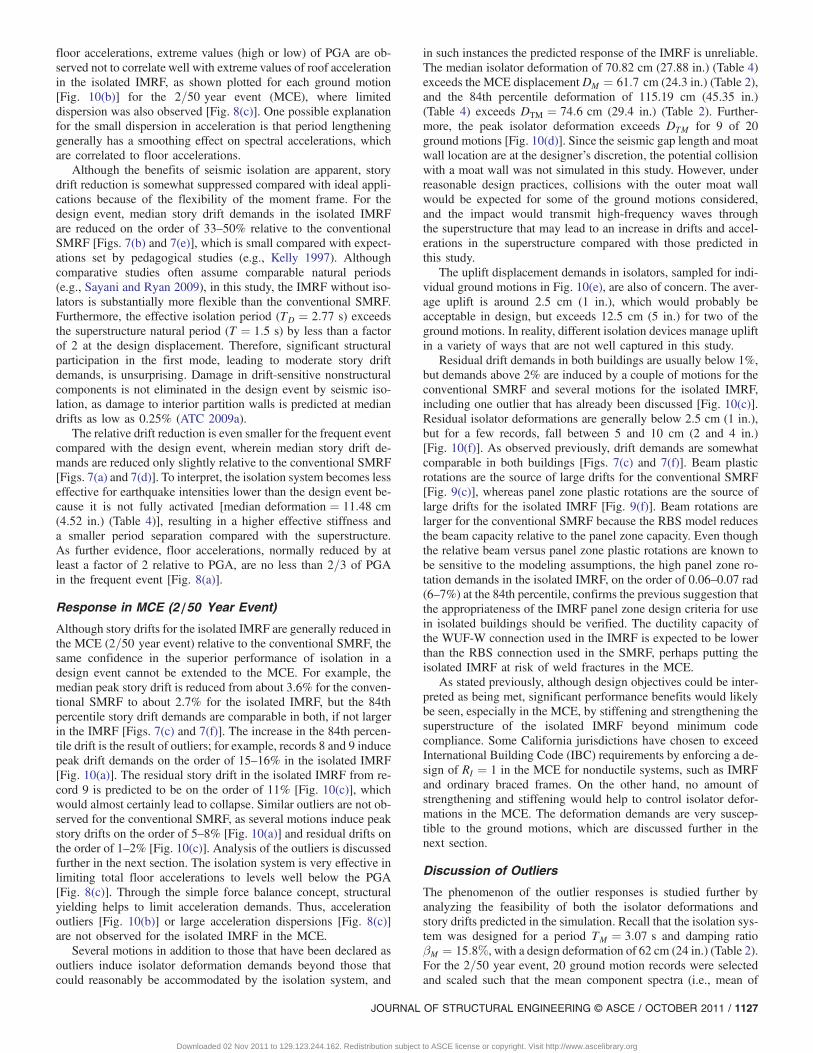
x and y-component spectral response) best fit the 5% damped targetspectrum. In accordance with the isolation system design parame-ters, the 16% damped mean component displacement spectra isshown in Fig. 11(a) for individual records, along with the medianover the 20 records. At a period Tn ¼ 3:1 s, the median displace-ment is about 53 cm (21 in.), which is below the MCE displacementtarget of 62 cm (24 in.), consistent with the target spectrain Fig. 6(c). The mean component displacement falls between25 and 76 cm (10 and 30 in.) for 18 of 20 motions, but records#8 and #9 have higher displacements of 140 and 94 cm (55 and37 in.), respectively.
However, the isolation system is not linear as assumed, but bi-linear, with parameters selected to match equivalent period anddamping ratio at the target displacement. As a net result of the non-linearity, the median displacement increases slightly [from 53 to56 cm (21 to 22 in.) at 3.1 s], and the displacement of the outliersincreases by a lot [from 140 to 163 cm (55 to 64 in.) for record #8and from 94 to 122 cm (37 to 48 in.) for record #9] [Fig. 11(b)].
Finally, the relevant displacement for the isolation system is notthe mean component displacement but the peak displacement inany direction, which is a vector sum of the two components at eachtime step. The peak vector spectral displacement is illustrated inFig. 11(c) for a linear system and in Fig. 11(d) for a bilinear systemwith equivalent linear properties. The peak vector displacement isobserved to increase significantly compared with the correspondingmean component displacement. For a bilinear system [Fig. 11(d)],the median displacement at 3.1 s is 79 cm (31 in.), and the displace-ment is between 36 and 112 cm (14 and 44 in.) for 18 of 20motions. On the basis of Fig. 11(d), the expected peak isolator
displacements attributable to records #8 and #9 have increasedto 229 and 171 cm (90 and 67 in.), respectively.
The code Equivalent Lateral Force Procedure (ELFP) does notdirectly account for bidirectionality or the discrepancy betweenlinear and nonlinear (equivalent linear) response. The dynamic pro-cedures (response spectrum and response history analysis) havemore direct procedures for incorporating these effects. However,ELFP indirectly includes further increases in MCE displace-ment/gap width through a torsion factor. Furthermore, the peakisolator deformation observed during dynamic analysis of the3D building model is reduced compared with that of the bilinearspectral analysis [Fig. 11(d)], which offsets some of the increasesnot accounted for in the code. This occurs because some of thespectral displacement is carried as interstory drift in the superstruc-ture, especially when the superstructure is as flexible as a momentframe. Consequently, the predicted isolator deformations to records#8 and #9, 175 and 125 cm (70 and 50 in.), respectively, are veryplausible.
The next item to explore is what happens to the superstructurewhen the isolation system experiences a deformation demand of175 cm (70 in.). The force coefficient f b=W in the isolators (equalto the base shear coefficient passed to the superstructure) can befound by normalizing the force-deformation curve [Fig. 4(b)] bythe weight:
f bW
¼ QW
þ ω2b
gD ð10Þ
where Q is defined in Eq. (4); ωb = frequency corresponding to kb[Eq. (5)]; and D = deformation in the isolators. The parameters for
0 1 2 3 4 50
50
100
150
200
250
300
Mea
n C
ompo
nent
Dis
p. (
cm)
Period Tn (s)
(a)
0 1 2 3 4 5Effective Period T
eff (s)
(b)
0
19.7
39.4
59.1
78.7
98.4
118.1
Mean C
omponent D
isp. (in)
0 1 2 3 4 50
50
100
150
200
250
300
Pea
k V
ecto
r D
isp.
(cm
)
Period Tn (s)
(c)
0 1 2 3 4 5Effective Period T
eff (s)
(d)
0
19.7
39.4
59.1
78.7
98.4
118.1
Peak V
ector Disp. (in)
EQ #8
EQ #9
Median
Median
EQ #8
EQ #9
EQ #8
EQ #8
EQ #9
Median
Median
EQ #9
Fig. 11. Spectral displacement for 16% damping for individual records in the 2=50 year event: (a) and (b) mean of x and y-component displacementfor a linear system and a bilinear system with given equivalent linear properties, respectively; (c) and (d) peak displacement in any direction for alinear system and a bilinear isolation system with given equivalent linear properties, respectively
1128 / JOURNAL OF STRUCTURAL ENGINEERING © ASCE / OCTOBER 2011
Downloaded 02 Nov 2011 to 129.123.244.162. Redistribution subject to ASCE license or copyright. Visit http://www.ascelibrary.org
this isolation system, found by solving Eqs. (4) and (5), areQ=W ¼ 0:066 and ω2
b ¼ 3:06 rad=s. At the MCE displacementof 62 cm (24 in.), the force coefficient f b=W ¼ 0:26 and the push-over analysis of model M2 [Fig. 5(b)] suggest that the superstruc-ture has already yielded. At an isolator displacement of 175 cm(70 in.), nearly three times the MCE displacement, the force coef-ficient f b=W ¼ 0:62, which implies that the superstructure is sub-jected to a base shear 2.5 to 3 times its strength, or a force reductionfactor R ≥ 2:5. Under such demands, a conventional long periodstructure might be expected to follow the equal displacement rule,where ductility demand μ ¼ R. However, a recent study by the au-thors (Sayani and Ryan 2009) suggests that ductility demand ac-cumulates much faster in an isolated building, and based on thesuperstructure period, the isolated building could be expected tosee a ductility demand on the order of μ ¼ 6 when subjected to R ¼2:5 [Fig. 3 of Sayani and Ryan (2009)]. With a yield drift demandof 1.5%, μ ¼ 6 could, on average, lead to a peak drift demand ofabout 9% in a simplistic SDOF structural model. However, consid-ering the added complexities of the 3D model, including accidentaltorsion, uplift of the isolation system, and the fact that interstorydrift demands on average exceed peak roof drift demands, it iscredible that the actual peak interstory drift demands for record#8 exceed 15%.
Other studies have also drawn conclusions that help confirm thatoutliers occur, e.g., yielding is self-limiting in conventional struc-tures but self-propagating in isolated structures (Kikuchi et al.2008), and isolated buildings are more sensitive than conventionalbuildings to statistically reasonable uncertainties in ground motions(Politopoulos and Sollogoub 2005).
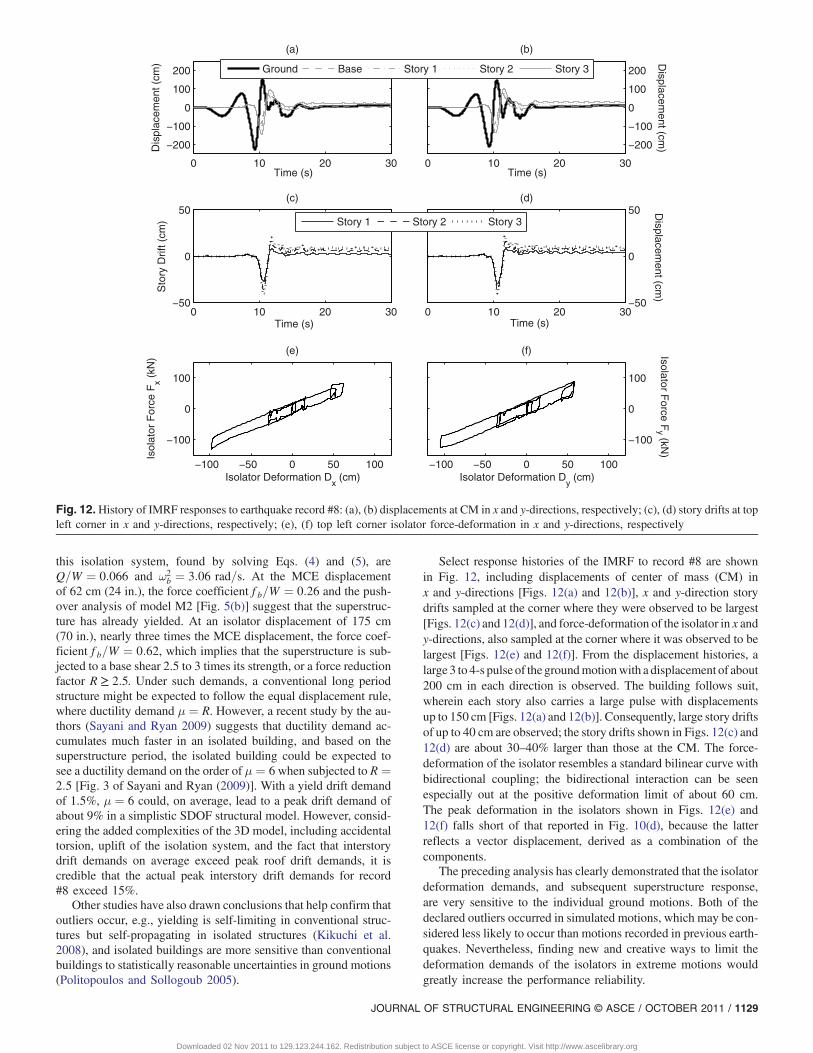
Select response histories of the IMRF to record #8 are shownin Fig. 12, including displacements of center of mass (CM) inx and y-directions [Figs. 12(a) and 12(b)], x and y-direction storydrifts sampled at the corner where they were observed to be largest[Figs. 12(c) and 12(d)], and force-deformation of the isolator in x andy-directions, also sampled at the corner where it was observed to belargest [Figs. 12(e) and 12(f)]. From the displacement histories, alarge 3 to 4-s pulse of the groundmotionwith a displacement of about200 cm in each direction is observed. The building follows suit,wherein each story also carries a large pulse with displacementsup to 150 cm [Figs. 12(a) and 12(b)]. Consequently, large story driftsof up to 40 cm are observed; the story drifts shown in Figs. 12(c) and12(d) are about 30–40% larger than those at the CM. The force-deformation of the isolator resembles a standard bilinear curve withbidirectional coupling; the bidirectional interaction can be seenespecially out at the positive deformation limit of about 60 cm.The peak deformation in the isolators shown in Figs. 12(e) and12(f) falls short of that reported in Fig. 10(d), because the latterreflects a vector displacement, derived as a combination of thecomponents.
The preceding analysis has clearly demonstrated that the isolatordeformation demands, and subsequent superstructure response,are very sensitive to the individual ground motions. Both of thedeclared outliers occurred in simulated motions, which may be con-sidered less likely to occur than motions recorded in previous earth-quakes. Nevertheless, finding new and creative ways to limit thedeformation demands of the isolators in extreme motions wouldgreatly increase the performance reliability.
0 10 20 30
−200
−100
0
100
200
Time (s)
Dis
plac
emen
t (cm
)
(a)
0 10 20 30
−200
−100
0
100
200
Time (s)
Displacem
ent (cm)
(b)
Ground Base Story 1 Story 2 Story 3
0 10 20 30−50
0
50
Time (s)
Sto
ry D
rift (
cm)
(c)
0 10 20 30−50
0
50(d)
Time (s)
Displacem
ent (cm)
Story 1 Story 2 Story 3
−100 −50 0 50 100
−100
0
100
Isolator Deformation Dx (cm)
Isol
ator
For
ce F
x (kN
)
(e)
−100 −50 0 50 100
−100
0
100
Isolator Deformation Dy (cm)
Isolator Force F
y (kN)
(f)
Fig. 12.History of IMRF responses to earthquake record #8: (a), (b) displacements at CM in x and y-directions, respectively; (c), (d) story drifts at topleft corner in x and y-directions, respectively; (e), (f) top left corner isolator force-deformation in x and y-directions, respectively
JOURNAL OF STRUCTURAL ENGINEERING © ASCE / OCTOBER 2011 / 1129
Downloaded 02 Nov 2011 to 129.123.244.162. Redistribution subject to ASCE license or copyright. Visit http://www.ascelibrary.org
Influence of Isolation System Parameters
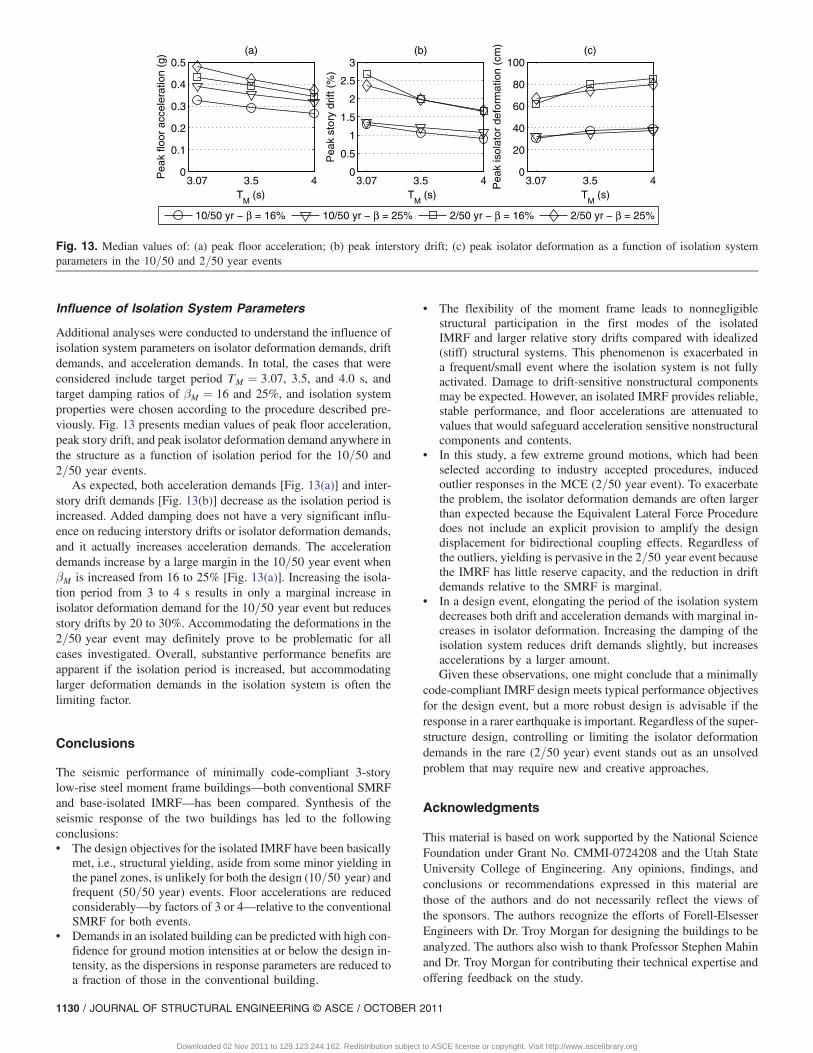
Additional analyses were conducted to understand the influence ofisolation system parameters on isolator deformation demands, driftdemands, and acceleration demands. In total, the cases that wereconsidered include target period TM ¼ 3:07, 3.5, and 4.0 s, andtarget damping ratios of βM ¼ 16 and 25%, and isolation systemproperties were chosen according to the procedure described pre-viously. Fig. 13 presents median values of peak floor acceleration,peak story drift, and peak isolator deformation demand anywhere inthe structure as a function of isolation period for the 10=50 and2=50 year events.
As expected, both acceleration demands [Fig. 13(a)] and inter-story drift demands [Fig. 13(b)] decrease as the isolation period isincreased. Added damping does not have a very significant influ-ence on reducing interstory drifts or isolator deformation demands,and it actually increases acceleration demands. The accelerationdemands increase by a large margin in the 10=50 year event whenβM is increased from 16 to 25% [Fig. 13(a)]. Increasing the isola-tion period from 3 to 4 s results in only a marginal increase inisolator deformation demand for the 10=50 year event but reducesstory drifts by 20 to 30%. Accommodating the deformations in the2=50 year event may definitely prove to be problematic for allcases investigated. Overall, substantive performance benefits areapparent if the isolation period is increased, but accommodatinglarger deformation demands in the isolation system is often thelimiting factor.
Conclusions
The seismic performance of minimally code-compliant 3-storylow-rise steel moment frame buildings—both conventional SMRFand base-isolated IMRF—has been compared. Synthesis of theseismic response of the two buildings has led to the followingconclusions:• The design objectives for the isolated IMRF have been basically
met, i.e., structural yielding, aside from some minor yielding inthe panel zones, is unlikely for both the design (10=50 year) andfrequent (50=50 year) events. Floor accelerations are reducedconsiderably—by factors of 3 or 4—relative to the conventionalSMRF for both events.
• Demands in an isolated building can be predicted with high con-fidence for ground motion intensities at or below the design in-tensity, as the dispersions in response parameters are reduced toa fraction of those in the conventional building.
• The flexibility of the moment frame leads to nonnegligiblestructural participation in the first modes of the isolatedIMRF and larger relative story drifts compared with idealized(stiff) structural systems. This phenomenon is exacerbated ina frequent/small event where the isolation system is not fullyactivated. Damage to drift-sensitive nonstructural componentsmay be expected. However, an isolated IMRF provides reliable,stable performance, and floor accelerations are attenuated tovalues that would safeguard acceleration sensitive nonstructuralcomponents and contents.
• In this study, a few extreme ground motions, which had beenselected according to industry accepted procedures, inducedoutlier responses in the MCE (2=50 year event). To exacerbatethe problem, the isolator deformation demands are often largerthan expected because the Equivalent Lateral Force Proceduredoes not include an explicit provision to amplify the designdisplacement for bidirectional coupling effects. Regardless ofthe outliers, yielding is pervasive in the 2=50 year event becausethe IMRF has little reserve capacity, and the reduction in driftdemands relative to the SMRF is marginal.
• In a design event, elongating the period of the isolation systemdecreases both drift and acceleration demands with marginal in-creases in isolator deformation. Increasing the damping of theisolation system reduces drift demands slightly, but increasesaccelerations by a larger amount.Given these observations, one might conclude that a minimally
code-compliant IMRF design meets typical performance objectivesfor the design event, but a more robust design is advisable if theresponse in a rarer earthquake is important. Regardless of the super-structure design, controlling or limiting the isolator deformationdemands in the rare (2=50 year) event stands out as an unsolvedproblem that may require new and creative approaches.
Acknowledgments
This material is based on work supported by the National ScienceFoundation under Grant No. CMMI-0724208 and the Utah StateUniversity College of Engineering. Any opinions, findings, andconclusions or recommendations expressed in this material arethose of the authors and do not necessarily reflect the views ofthe sponsors. The authors recognize the efforts of Forell-ElsesserEngineers with Dr. Troy Morgan for designing the buildings to beanalyzed. The authors also wish to thank Professor Stephen Mahinand Dr. Troy Morgan for contributing their technical expertise andoffering feedback on the study.
3.07 3.5 40
0.1
0.2
0.3
0.4
0.5
TM
(s)
Pea
k flo
or a
ccel
erat
ion
(g) (a)
3.07 3.5 40
0.5
1
1.5
2
2.5
3
TM
(s)
Pea
k st
ory
drift
(%
)
(b)
3.07 3.5 40
20
40
60
80
100
TM
(s)
Pea
k is
olat
or d
efor
mat
ion
(cm
)
(c)
10/50 yr − β = 16% 10/50 yr − β = 25% 2/50 yr − β = 16% 2/50 yr − β = 25%
Fig. 13. Median values of: (a) peak floor acceleration; (b) peak interstory drift; (c) peak isolator deformation as a function of isolation systemparameters in the 10=50 and 2=50 year events
1130 / JOURNAL OF STRUCTURAL ENGINEERING © ASCE / OCTOBER 2011
Downloaded 02 Nov 2011 to 129.123.244.162. Redistribution subject to ASCE license or copyright. Visit http://www.ascelibrary.org

References
Agarwal, V. K., Niedzwecki, J. M., and van de Lindt, J. W. (2007). “Earth-quake induced pounding in friction varying base isolated buildings.”Eng. Struct., 29(11), 2825–2832.
American Institute of Steel Construction (AISC). (2005). “Seismic provi-sions for structural steel buildings.” AISC 341-05, Chicago.
American Society of Civil Engineers (ASCE). (2005). “Minimum designloads for buildings and other structures.” ASCE 7-05, Reston, VA.
American Society of Civil Engineers (ASCE). (2007). “Seismic rehabili-tation of existing buildings.” ASCE 41, Reston, VA.
Applied Technology Council (ATC). (2008a). “Reducing the risks ofnonstructural earthquake damage.” ATC-69 Project Rep.—State ofthe Art and Practice, Prepared for Federal Emergency ManagementAgency, Washington, DC.
Applied Technology Council (ATC). (2009a). Guidelines for SeismicPerformance Assessment of Buildings 50% Complete Draft, Preparedfor Department of Homeland Security, Washington, DC.
Applied Technology Council (ATC). (2009b). “Quantification of buildingseismic performance factors.” ATC-63 Project Rep., FEMA P695,Prepared for Federal Emergency Management Agency, Washington,DC.
Building Seismic Safety Council (BSSC). (2004). “NEHRP recommendedprovisions and commentary for seismic regulations for new buildingsand other structures.” FEMA 450, Washington, DC.
Campbell, K. W., and Bozorgnia, Y. (2008). “NGA ground motion modelfor the geometric mean horizontal component of PGA, PGV, PGD and5% damped linear elastic response spectra for periods ranging from 0.01to 10 s.” Earthquake Spectra, 24(1), 139–171.
Ceccoli, C., Mazzotti, C., and Savoia, M. (1999). “Non-linear seismicanalysis of base-isolated RC frame structures.” Earthquake Eng. Struct.Dyn., 28(6), 633–653.
Charney, F. A. (2008). “Unintended consequences of modeling damping instructures.” J. Struct. Eng., 134(4), 581–592.
Chiou, B., Darragh, R., Gregor, N., and Silva, W. (2008). “NGA projectstrong-motion database.” Earthquake Spectra, 24(1), 23–44.
Chiou, B. S.-J., and Youngs, R. S. (2008). “An NGA model for the averagehorizontal component of peak ground motion and response spectra.”Earthquake Spectra, 24(1), 173–216.
Dolce, M., and Cardone, D. (2003). “Seismic protection of light secondarysystems through different base isolation systems.” J. Earthquake Eng.,7(2), 223–250.
Dolce, M., Cardone, D., and Ponzo, F. C. (2007). “Shaking-table testson reinforced concrete frames with different isolation systems.”Earthquake Eng. Struct. Dyn., 36(5), 573–596.
Federal Emergency Management Agency (FEMA). (2000a). “State of theart report on systems performance of steel moment frames subjected toearthquake ground shaking.” FEMA 355-C, Washington, DC.
Federal Emergency Management Agency (FEMA). (2000b). “ State of theart report on connection performance.” FEMA 355-D, Washington, DC.
Foutch, D. A., and Yun, S. (2002). “Modeling of steel moment frames forseismic loads.” J. Constr. Steel Res., 58(5–8), 529–564.
Frankel, A. D. et al. (2000). “USGS national seismic hazard maps.”Earthquake Spectra, 16(1), 1–19.
Hall, J. F. (2006). “Problems encountered from the use (or misuse) ofRayleigh damping.” Earthquake Eng. Struct. Dyn., 35(5), 525–545.
Hall, J. F., and Ryan, K. L. (2000). “Isolated buildings and the 1997 UBCnear-source factors.” Earthquake Spectra, 16(2), 393–412.
Hamidi, M., El Naggar, M. H., and Vafai, A. (2003). “Response of struc-tures supported on SCF isolation systems.” Earthquake Eng. Struct.Dyn., 32(10), 1555–1584.
International Code Council (ICC). (2006). International Building Code(IBC), Falls Church, VA.
Kelly, J. M. (1997). Earthquake-resistant design with rubber, 2nd Ed.,Springer-Verlag, London.
Kikuchi, M., Black, C. J., and Aiken, I. D. (2008). “On the response ofyielding seismically isolated structures.” Earthquake Eng. Struct.Dyn., 37(5), 659–679.
Kim, K. D., and Engelhardt, M. D. (2002). “Monotonic and cyclic loadingmodels for panel zones in steel moment frames.” J. Constr. Steel Res.,58(5–8), 605–635.
Krawinkler, H. (1978). “Shear in beam-column joints in seismic design ofsteel frames.” Eng. J., 15(3), 82–91.
Lee, K., and Foutch, D. (2002). “Performance evaluation of new steelframe buildings for seismic loads.” Earthquake Eng. Struct. Dyn.,31(3), 653–670.
Lin, A. N., and Shenton III, H. W. (1992). “Seismic performance offixed-base and base-isolated steel frames.” J. Eng. Mech., 118(5),921–941.
Lu, L. W., Wang, S. J., and Lee, S. J. (1988). “Cyclic behavior of steel andcomposite joints with panel zone deformation.” Proc. 9th World Conf.on Earthquake Engineering, Vol. IV, International Association forEarthquake Engineering, Tokyo.
Naaseh, S., Morgan, T. A., and Walters, M. T. (2002). “A critical evaluationof current US building code provisions and FEMA guidelines for thedesign of seismic isolated structures.” Proc. ATC 17-2 Seminar onSeismic Isolation, Passive Energy Dissipation and Active Control,Applied Technology Council, Los Angeles.
Network for Earthquake Engineering Simulation (NEES). (2009). “Toolsfor isolation and protective systems (TIPS).” ⟨http://www.neng.usu.edu/cee/faculty/kryan/NEESTIPS/PBEE_study.html⟩ (Jul. 13,2009).
Ordonez, D., Foti, D., and Bozzo, L. (2003). “Comparative study of theinelastic response of base isolated buildings.” Earthquake Eng. Struct.Dyn., 32(1), 151–164.
Palazzo, B., and Petti, L. (1996). “Reduction factors for base isolated struc-tures.” Comput. Struct., 60(6), 945–956.
Pinto, P. E., and Vanzi, I. (1992). “Base isolation: Reliability for differentdesign criteria.” Proc. 10th World Conf. on Earthquake Engineering,Balkema, Rotterdam, Netherlands, 2033–2038.
Politopoulos, I., and Sollogoub, P. (2005). “Vulnerability of elastomericbearing isolated buildings and their equipment.” J. Earthquake Eng.,9(4), 525–545.
Ryan, K. L., and Polanco, J. (2008). “Problems with Rayleigh damping inbase-isolated buildings.” J. Struct. Eng., 134(11), 1780–1784.
Sayani, P. J., and Ryan, K. L. (2009). “Comparative evaluation of base-isolated and fixed-base buildings using a comprehensive responseindex.” J. Struct. Eng., 135(6), 698–707.
Scott, M. H., and Fenves, G. L. (2006). “Plastic hinge integration methodsfor force-based beam-column elements.” J. Struct. Eng., 132(2),244–252.
Shen, J., Kitjasateanphun, T., and Srivanich, W. (2000). “Seismic perfor-mance of steel moment frames with reduced beam sections.” Eng.Struct., 22(8), 968–983.
Shenton III, H. W., and Lin, A. N. (1993). “Relative performance offixed-base and base-isolated concrete frames.” J. Struct. Eng., 119(10),2952–2968.
Somerville, P., Anderson, D., Sun, J., Punyamurthula, S., and Smith, N.(1998). “Generation of ground motion time histories for performance-based seismic engineering.” Proc. 6th, U.S. National Conf. ofEarthquake Engineering, Earthquake Engineering Research Institute,Oakland, CA.
Taghavi, S., and Miranda, E. (2003). “Response assessment of nonstruc-tural building elements.” PEER Rep. No. 2003–05, Pacific EarthquakeEngineering Research Center, Univ. of California, Berkeley, CA.
Tsai, K. C., and Popov, E. P. (1988). “Steel beam-column joints inseismic moment resisting frames.” Rep. No. UCB/EERC-88/19,Earthquake Engineering Research Center (EERC), Univ. ofCalifornia, Berkeley, CA.
JOURNAL OF STRUCTURAL ENGINEERING © ASCE / OCTOBER 2011 / 1131
Downloaded 02 Nov 2011 to 129.123.244.162. Redistribution subject to ASCE license or copyright. Visit http://www.ascelibrary.org


![[PPT]Anorexia Nervosa - Mr Sitar's Website - homemrsitarswebsite.wikispaces.com/file/view/Anorexia Nervosa... · Web viewWhat is the definition to this illness? Anorexia nervosa is](https://img.pdfslide.us/doc/110x75/5af162f57f8b9ad0618f592d/pptanorexia-nervosa-mr-sitars-website-nervosaweb-viewwhat-is-the-definition.jpg)