Embed Size (px)
Citation preview

Understanding and Optimizing the H2/Br2 Redox Flow Battery for Grid-Scale Energy Sto
rage
Michael Tucker, Kyu Taek Cho, Vincent Battaglia, Venkat Sr
inivsan, and Adam Z. Weber
Environmental Energy Technologies Division Lawrence Berkeley National Laboratory
2nd MRES Northeastern, August 19, 2014
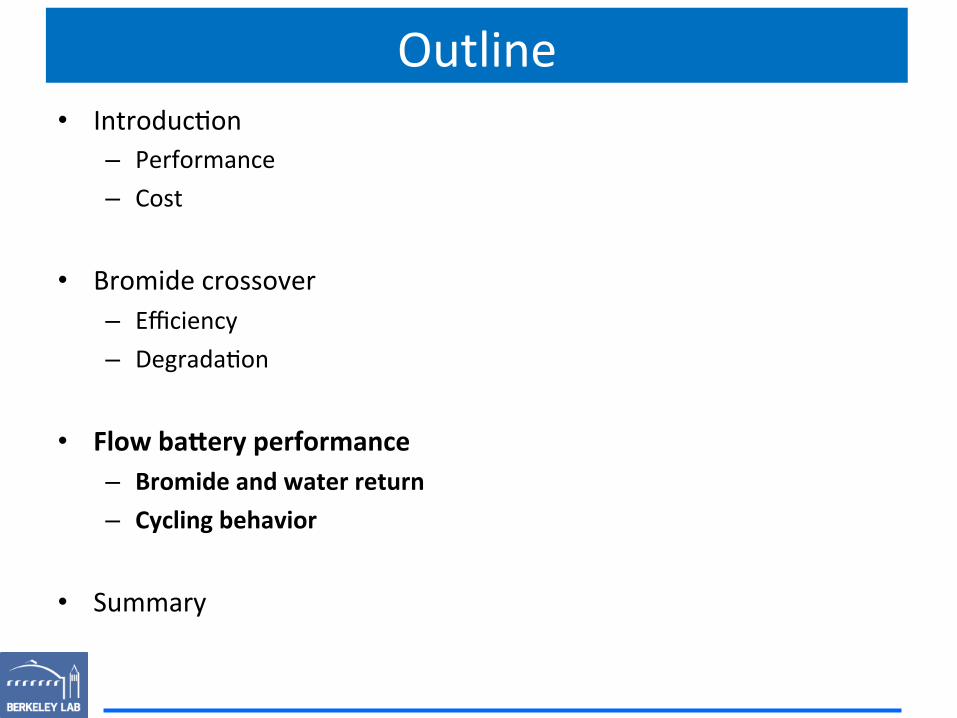
Outline • Introduc.on
– Performance – Cost
• Bromide crossover – Efficiency – Degrada.on
• Flow ba?ery performance – Bromide and water return – Cycling behavior
• Summary
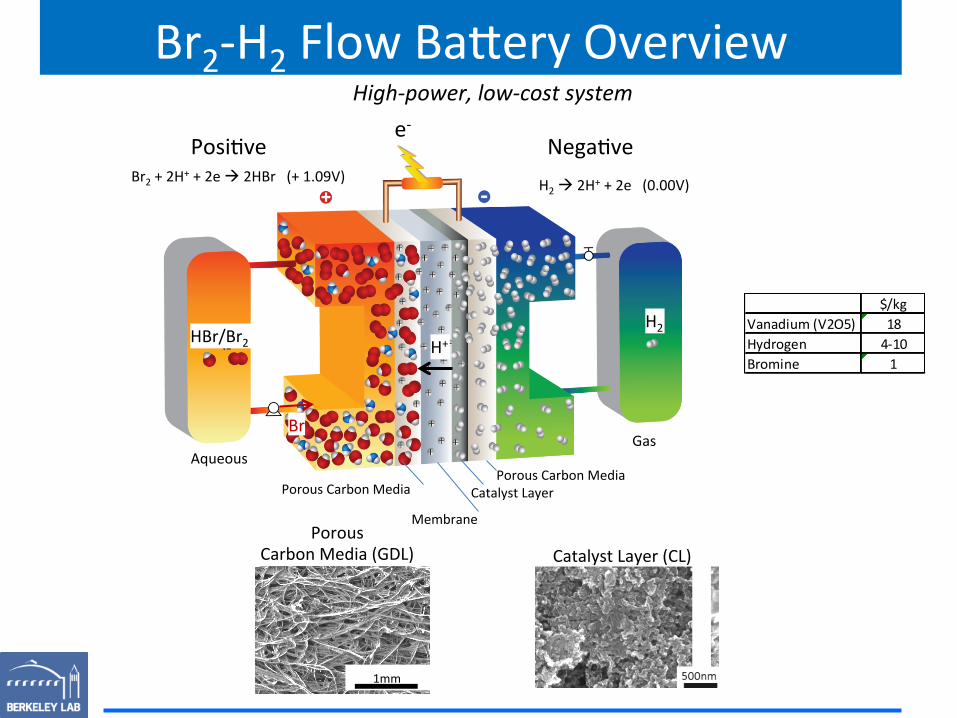
Br2-‐H2 Flow Ba?ery Overview
$/kgVanadium (V2O5) 18Hydrogen 4-‐10Bromine 1
Porous Carbon Media (GDL) Catalyst Layer (CL)
1mm
High-‐power, low-‐cost system e-‐
H2 HBr/Br2
H2 à 2H+ + 2e (0.00V) Br2 + 2H+ + 2e à 2HBr (+ 1.09V)
Nega.ve Posi.ve
Aqueous Gas
Membrane
Porous Carbon Media Catalyst Layer Porous Carbon Media
H+
Br
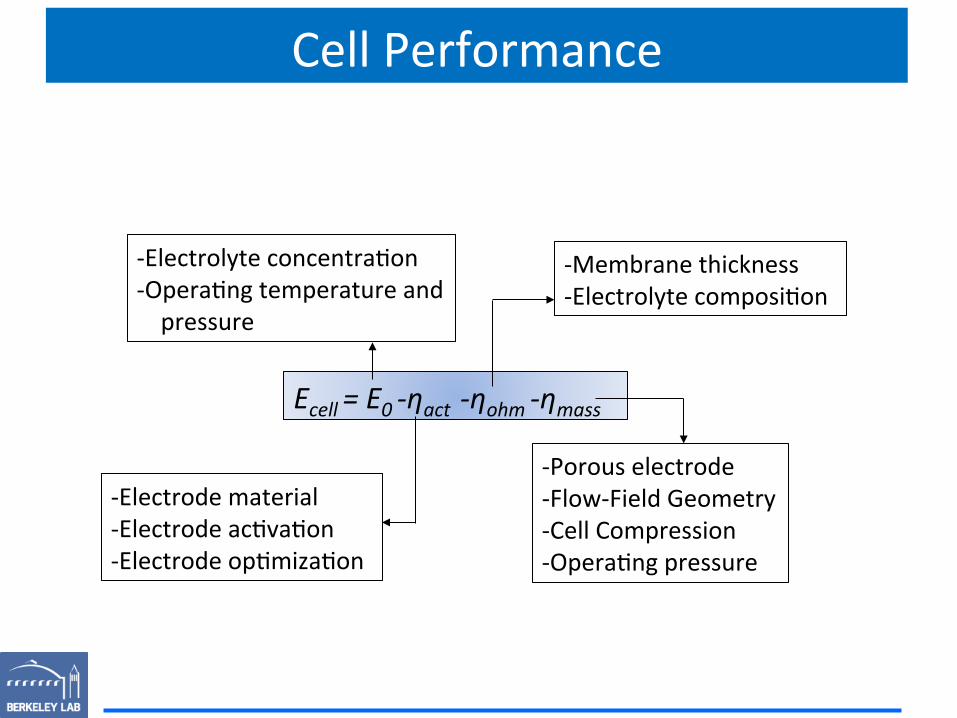
-‐Porous electrode -‐Flow-‐Field Geometry -‐Cell Compression -‐Opera.ng pressure
Ecell = E0 -‐ηact -‐ηohm -‐ηmass
-‐Electrode material -‐Electrode ac.va.on -‐Electrode op.miza.on
-‐Membrane thickness -‐Electrolyte composi.on
-‐Electrolyte concentra.on -‐Opera.ng temperature and pressure
Cell Performance Cell Performance
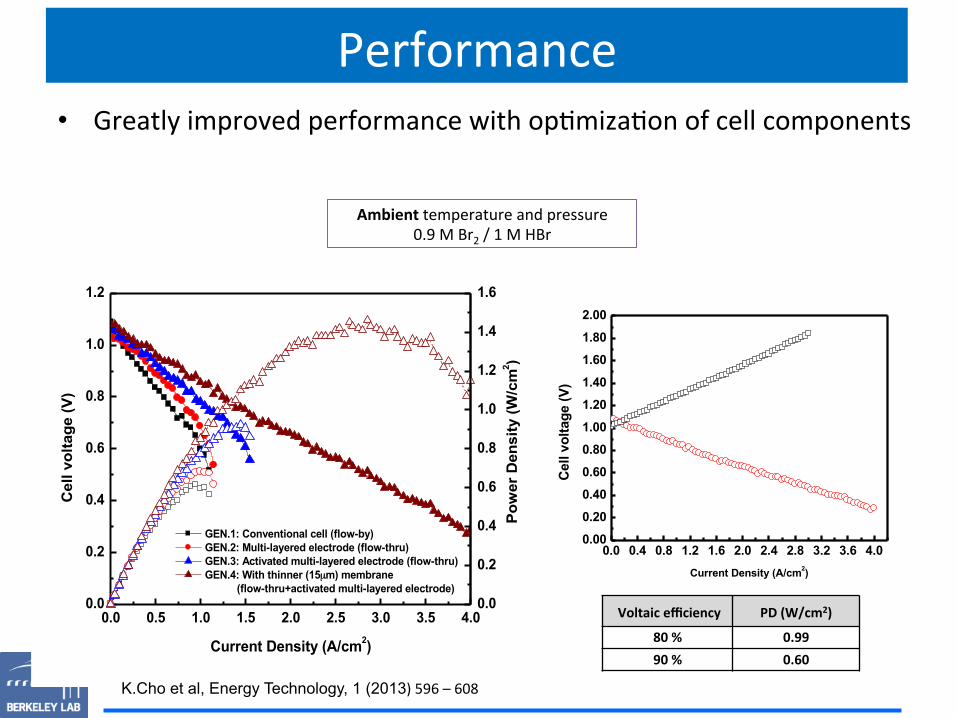
Performance • Greatly improved performance with op.miza.on of cell components
0.0 0.4 0.8 1.2 1.6 2.0 2.4 2.8 3.2 3.6 4.00.00
0.20
0.40
0.60
0.80
1.00
1.20
1.40
1.60
1.80
2.00
Cel
l vol
tage
(V)
Current Density (A/cm2)
Ambient temperature and pressure 0.9 M Br2 / 1 M HBr
Voltaic efficiency PD (W/cm2)
80 % 0.99 90 % 0.60
0.0 0.5 1.0 1.5 2.0 2.5 3.0 3.5 4.00.0
0.2
0.4
0.6
0.8
1.0
1.2
GEN.1: Conventional cell (flow-by) GEN.2: Multi-layered electrode (flow-thru) GEN.3: Activated multi-layered electrode (flow-thru) GEN.4: With thinner (15µm) membrane
(flow-thru+activated multi-layered electrode)
Cel
l vol
tage
(V)
Current Density (A/cm2)
0.0
0.2
0.4
0.6
0.8
1.0
1.2
1.4
1.6
Pow
er D
ensi
ty (W
/cm
2 )
K.Cho et al, Energy Technology, 1 (2013) 596 – 608
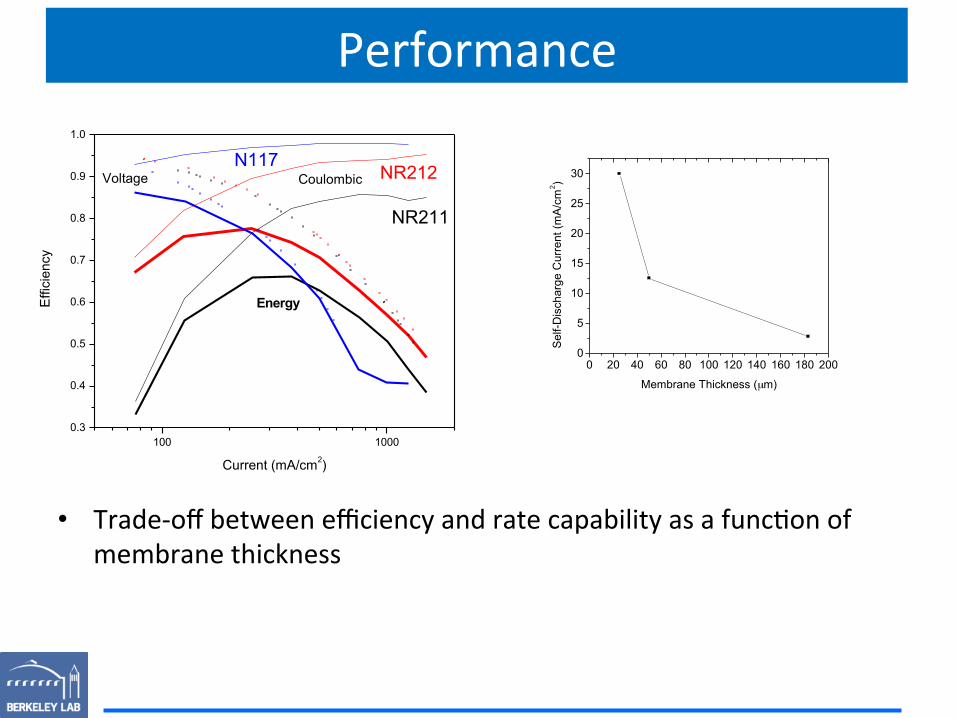
Performance
• Trade-‐off between efficiency and rate capability as a func.on of membrane thickness
100 10000.3
0.4
0.5
0.6
0.7
0.8
0.9
1.0
N117
NR211
NR212
Energy
Voltage
Effi
cien
cy
Current (mA/cm2)
Coulombic
2.8MPH2 = 30psi
0 20 40 60 80 100 120 140 160 180 2000
5
10
15
20
25
30
Membrane Thickness (µm)
Sel
f-Dis
char
ge C
urre
nt (m
A/c
m2 )
2.8MPH2 = 30psi
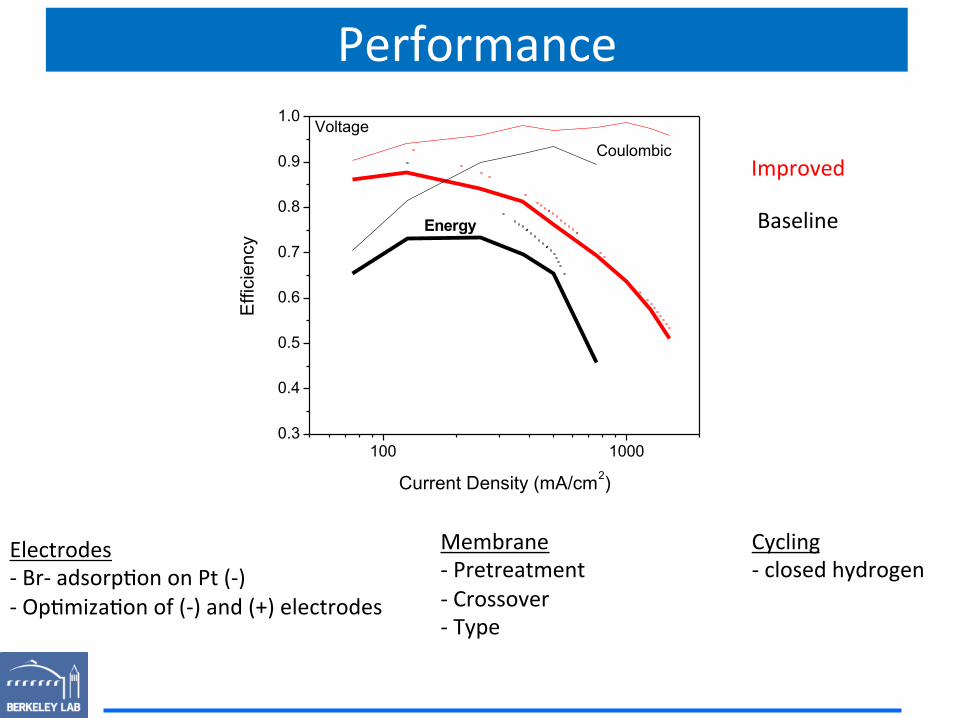
Performance
Electrodes -‐ Br-‐ adsorp.on on Pt (-‐) -‐ Op.miza.on of (-‐) and (+) electrodes
100 10000.3
0.4
0.5
0.6
0.7
0.8
0.9
1.0
Energy
Voltage
Effi
cien
cy
Current Density (mA/cm2)
Coulombic
Baseline
Improved
Membrane -‐ Pretreatment -‐ Crossover -‐ Type
Cycling -‐ closed hydrogen
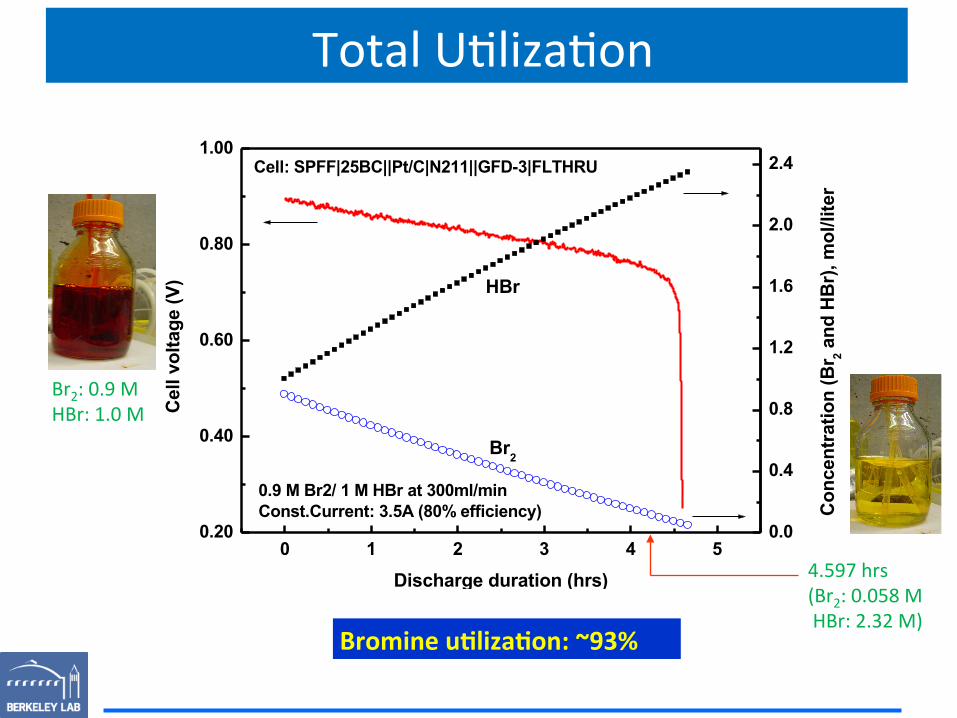
Total U.liza.on
0 1 2 3 4 50.20
0.40
0.60
0.80
1.00
Br2
HBr
0.9 M Br2/ 1 M HBr at 300ml/minConst.Current: 3.5A (80% efficiency)
Cell: SPFF|25BC||Pt/C|N211||GFD-3|FLTHRUC
ell v
olta
ge (V
)
Discharge duration (hrs)
0.0
0.4
0.8
1.2
1.6
2.0
2.4
Con
cent
ratio
n (B
r 2 and
HB
r), m
ol/li
ter
4.597 hrs (Br2: 0.058 M HBr: 2.32 M)
Br2: 0.9 M HBr: 1.0 M
Bromine uBlizaBon: ~93%
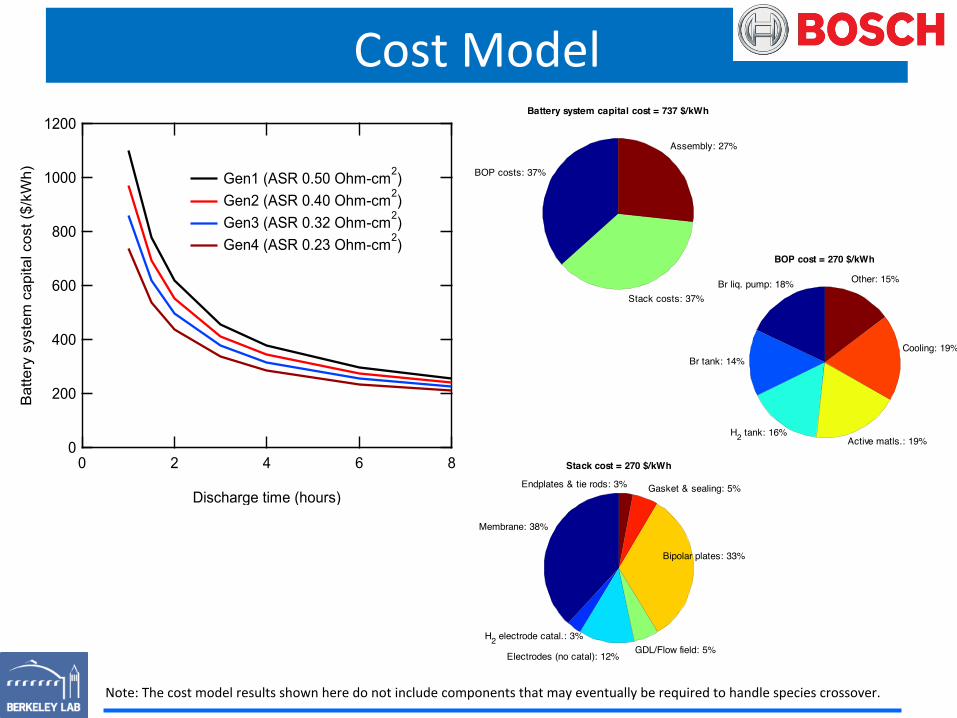
Cost Model
Note: The cost model results shown here do not include components that may eventually be required to handle species crossover.
1200
1000
800
600
400
200
0
Bat
tery
sys
tem
cap
ital c
ost (
$/kW
h)
86420
Discharge time (hours)
Gen1 (ASR 0.50 Ohm-cm2) Gen2 (ASR 0.40 Ohm-cm2) Gen3 (ASR 0.32 Ohm-cm2) Gen4 (ASR 0.23 Ohm-cm2)
BOP costs: 37%
Stack costs: 37%
Assembly: 27%
Battery system capital cost = 737 $/kWh
Membrane: 38%
H2 electrode catal.: 3%
Electrodes (no catal): 12% GDL/Flow field: 5%
Bipolar plates: 33%
Gasket & sealing: 5%Endplates & tie rods: 3%
Stack cost = 270 $/kWh
Br liq. pump: 18%
Br tank: 14%
H2 tank: 16%Active matls.: 19%
Cooling: 19%
Other: 15%
BOP cost = 270 $/kWh
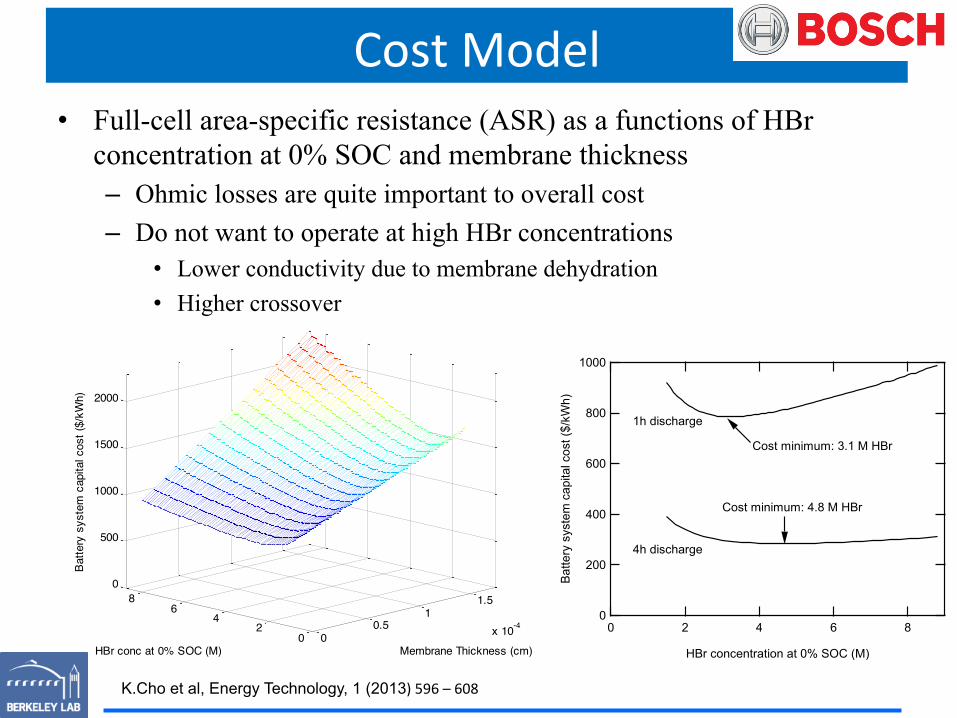
Cost Model • Full-cell area-specific resistance (ASR) as a functions of HBr
concentration at 0% SOC and membrane thickness – Ohmic losses are quite important to overall cost – Do not want to operate at high HBr concentrations
• Lower conductivity due to membrane dehydration • Higher crossover
1000
800
600
400
200
0
Batte
ry s
yste
m c
apita
l cos
t ($/
kWh)
86420
HBr concentration at 0% SOC (M)
4h discharge
1h discharge
Cost minimum: 3.1 M HBr
Cost minimum: 4.8 M HBr
00.5
11.5
x 10-40
24
68
0
500
1000
1500
2000
Membrane Thickness (cm)HBr conc at 0% SOC (M)
Batte
ry s
yste
m c
apita
l cos
t ($/
kWh)
K.Cho et al, Energy Technology, 1 (2013) 596 – 608
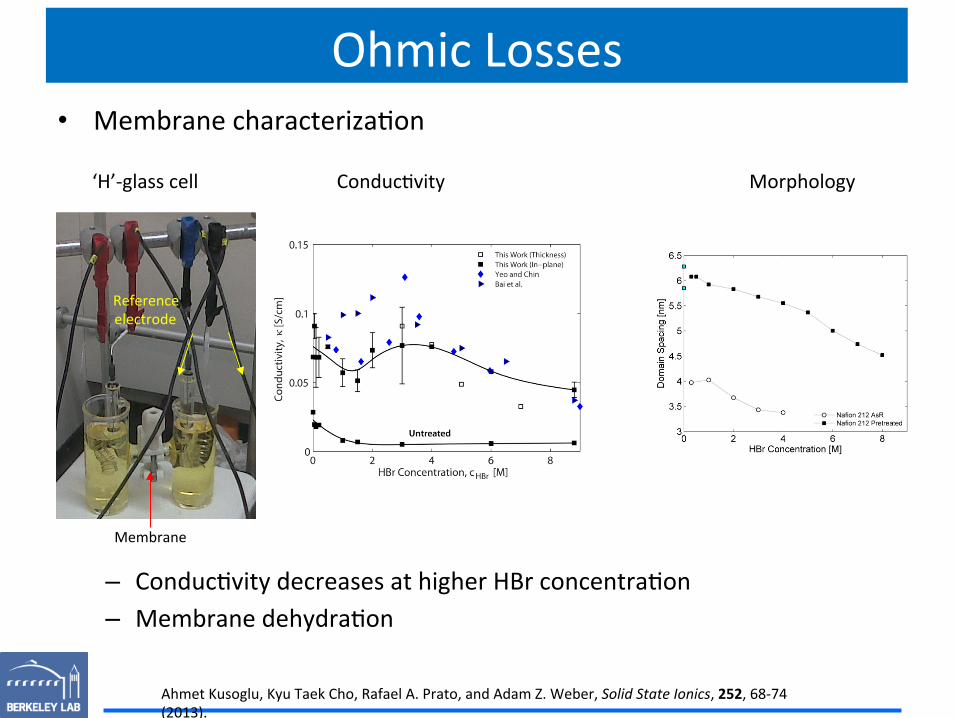
• Membrane characteriza.on
– Conduc.vity decreases at higher HBr concentra.on – Membrane dehydra.on
‘H’-‐glass cell
Membrane
Reference electrode
Conduc.vity
Ohmic Losses
Ahmet Kusoglu, Kyu Taek Cho, Rafael A. Prato, and Adam Z. Weber, Solid State Ionics, 252, 68-‐74 (2013).
Morphology
Outline • Introduc.on
– Performance – Cost
• Bromide crossover – Efficiency – DegradaBon
• Flow ba?ery performance – Bromide and water return – Cycling behavior
• Summary
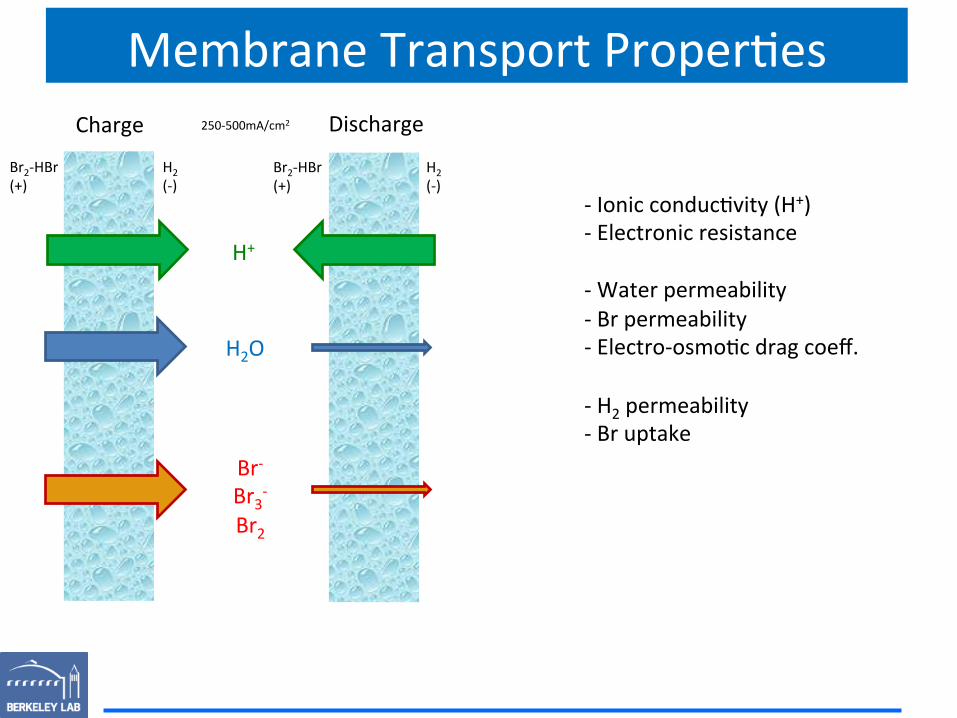
Membrane Transport Proper.es Charge Discharge
-‐ Ionic conduc.vity (H+) -‐ Electronic resistance -‐ Water permeability -‐ Br permeability -‐ Electro-‐osmo.c drag coeff. -‐ H2 permeability -‐ Br uptake
Br2-‐HBr (+)
H2 (-‐)
H+
H2O
Br-‐ Br3-‐ Br2
Br2-‐HBr (+)
H2 (-‐)
250-‐500mA/cm2
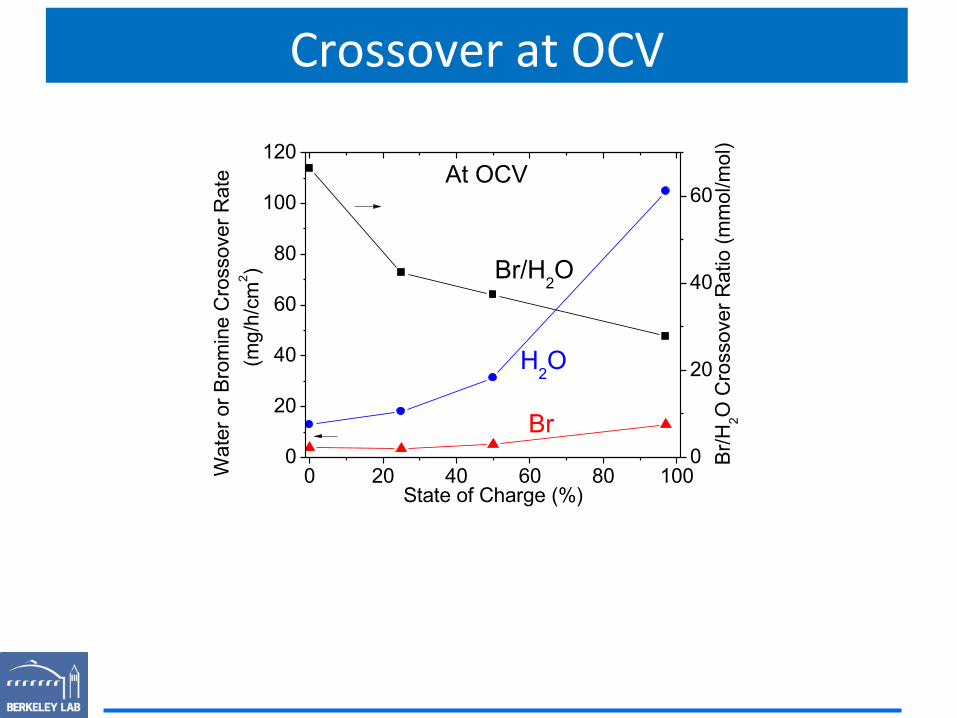
Crossover at OCV
0 20 40 60 80 1000
20
40
60
80
100
120
State of Charge (%)
Wat
er o
r Bro
min
e C
ross
over
Rat
e
(mg/
h/cm
2 )
0
20
40
60
H2O
Br
Br/H
2O C
ross
over
Rat
io (m
mol
/mol
)
Br/H2O
At OCV
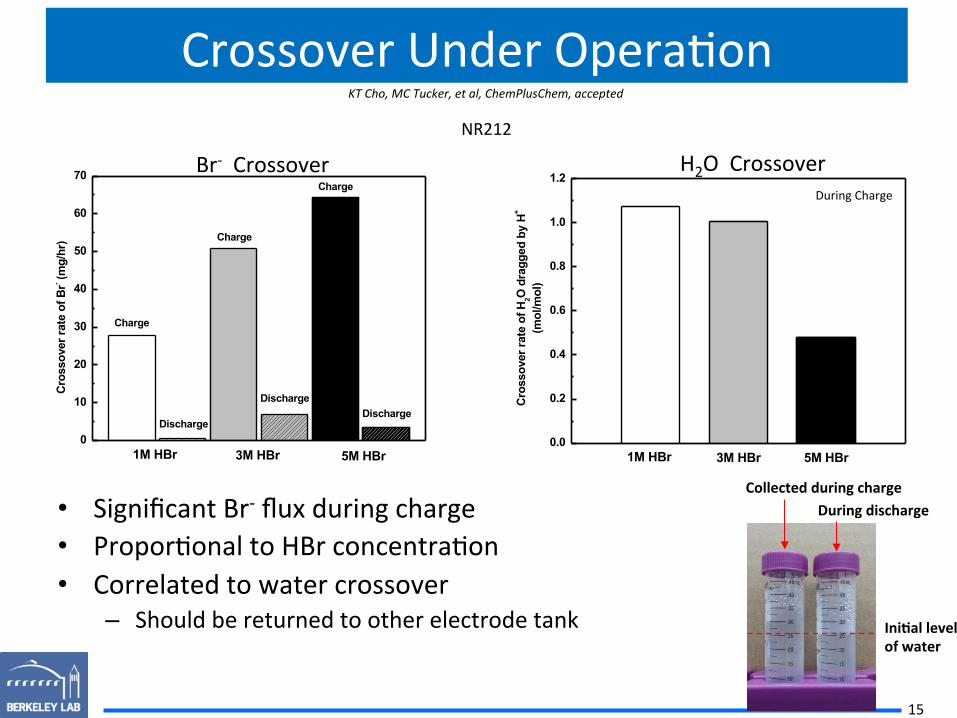
Crossover Under Opera.on
• Significant Br-‐ flux during charge • Propor.onal to HBr concentra.on • Correlated to water crossover
– Should be returned to other electrode tank
15
0
10
20
30
40
50
60
70
5M HBr3M HBr1M HBr
Discharge
Charge
Discharge
Charge
Discharge
Charge
Cros
sove
r rat
e of
Br- (m
g/hr
)
0.0
0.2
0.4
0.6
0.8
1.0
1.2
5M HBr3M HBr1M HBr
Cro
ssov
er ra
te o
f H2O
dra
gged
by
H+
(mol
/mol
)
KT Cho, MC Tucker, et al, ChemPlusChem, accepted
NR212
During Charge
Br-‐ Crossover H2O Crossover
Collected during charge During discharge
IniBal level of water
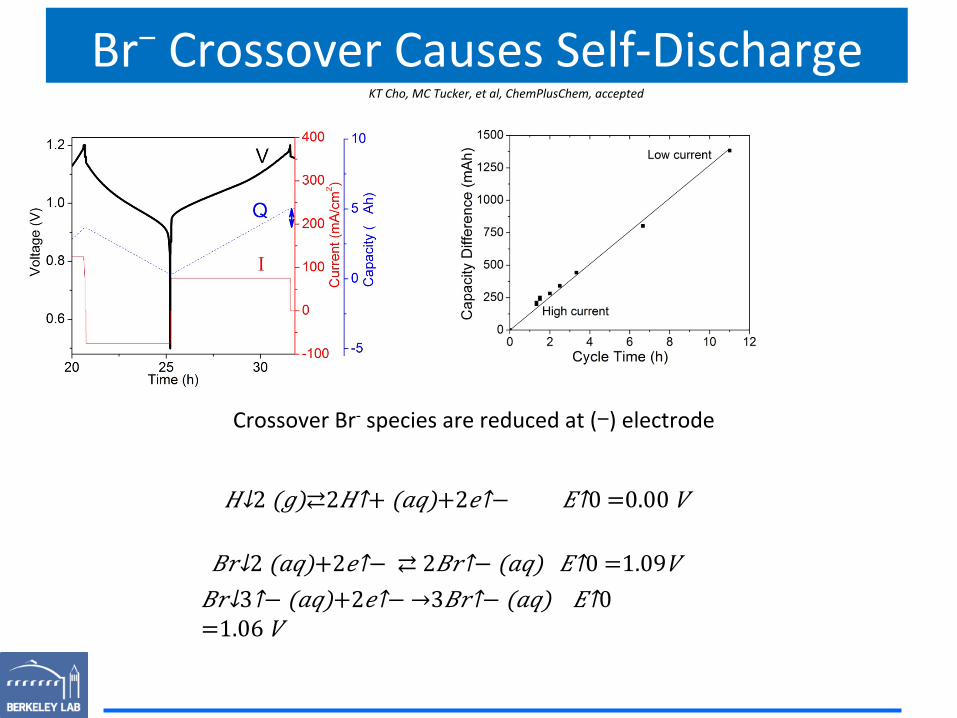
Br- Crossover Causes Self-‐Discharge
𝐻↓2 (𝑔)⇄2𝐻↑+ (𝑎𝑞)+2𝑒↑− 𝐸↑0 =0.00 𝑉
𝐵𝑟↓3↑− (𝑎𝑞)+2𝑒↑− →3𝐵𝑟↑− (𝑎𝑞) 𝐸↑0 =1.06 𝑉
𝐵𝑟↓2 (𝑎𝑞)+2𝑒↑− ⇄ 2𝐵𝑟↑− (𝑎𝑞) 𝐸↑0 =1.09𝑉
Crossover Br-‐ species are reduced at (-) electrode
KT Cho, MC Tucker, et al, ChemPlusChem, accepted
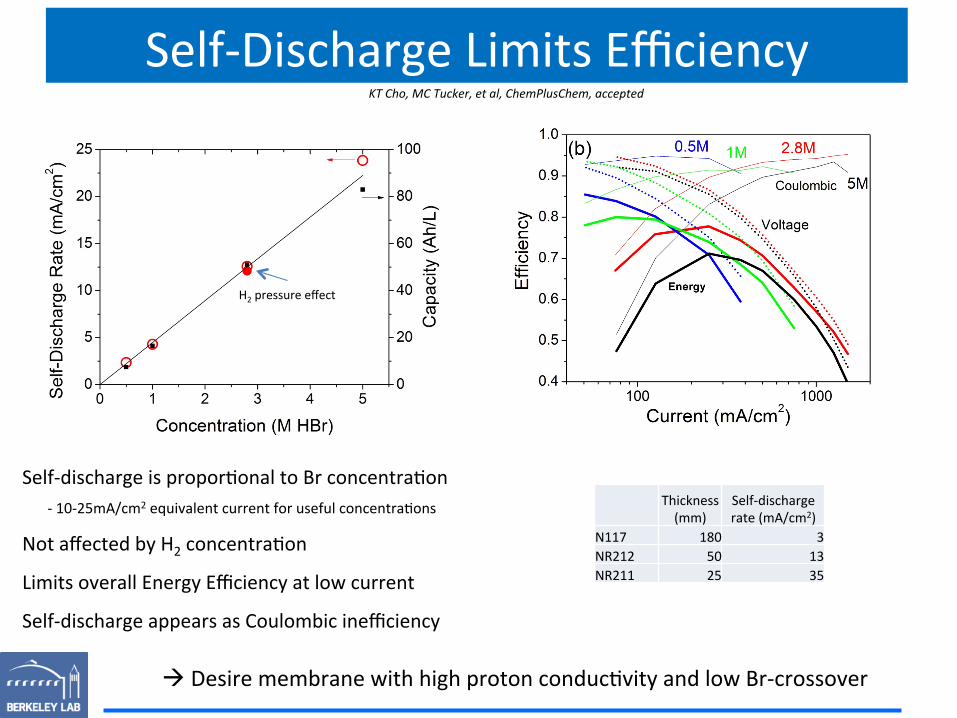
Self-‐Discharge Limits Efficiency
H2 pressure effect
Self-‐discharge is propor.onal to Br concentra.on -‐ 10-‐25mA/cm2 equivalent current for useful concentra.ons
Not affected by H2 concentra.on
Limits overall Energy Efficiency at low current
Self-‐discharge appears as Coulombic inefficiency
à Desire membrane with high proton conduc.vity and low Br-‐crossover
KT Cho, MC Tucker, et al, ChemPlusChem, accepted
Thickness (mm)
Self-‐discharge rate (mA/cm2)
N117 180 3 NR212 50 13 NR211 25 35
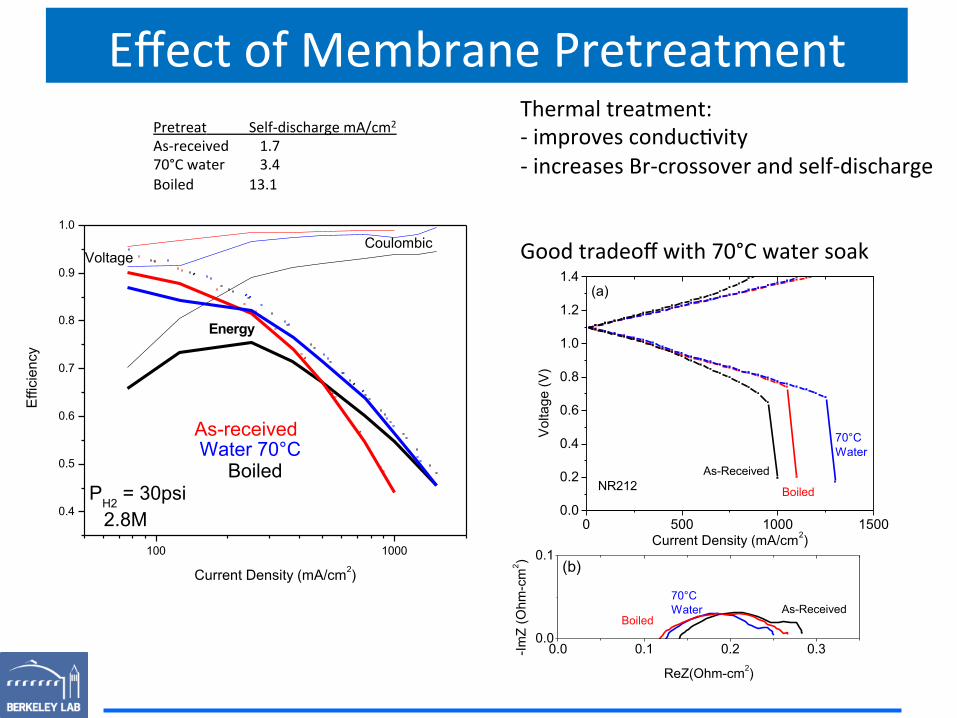
Effect of Membrane Pretreatment
100 1000
0.4
0.5
0.6
0.7
0.8
0.9
1.0
Water 70°CBoiled
Energy
PH2 = 30psi
Voltage
Effi
cien
cy
Current Density (mA/cm2)
Coulombic
2.8M
As-received
Pretreat Self-‐discharge mA/cm2
As-‐received 1.7 70°C water 3.4 Boiled 13.1
Thermal treatment: -‐ improves conduc.vity -‐ increases Br-‐crossover and self-‐discharge Good tradeoff with 70°C water soak
0 500 1000 15000.0
0.2
0.4
0.6
0.8
1.0
1.2
1.4
Current Density (mA/cm2)V
olta
ge (V
)
70°C Water
As-Received
BoiledNR212
(a)
0.0 0.1 0.2 0.30.0
0.1
ReZ(Ohm-cm2)
-ImZ
(Ohm
-cm
2 ) (b)
70°C Water
BoiledAs-Received
0.0
0.2
0.4
0.6
0.8
1.0
1.2
1.4
1.6
Current Density (mA/cm2)
Cel
l Vol
tage
(V)
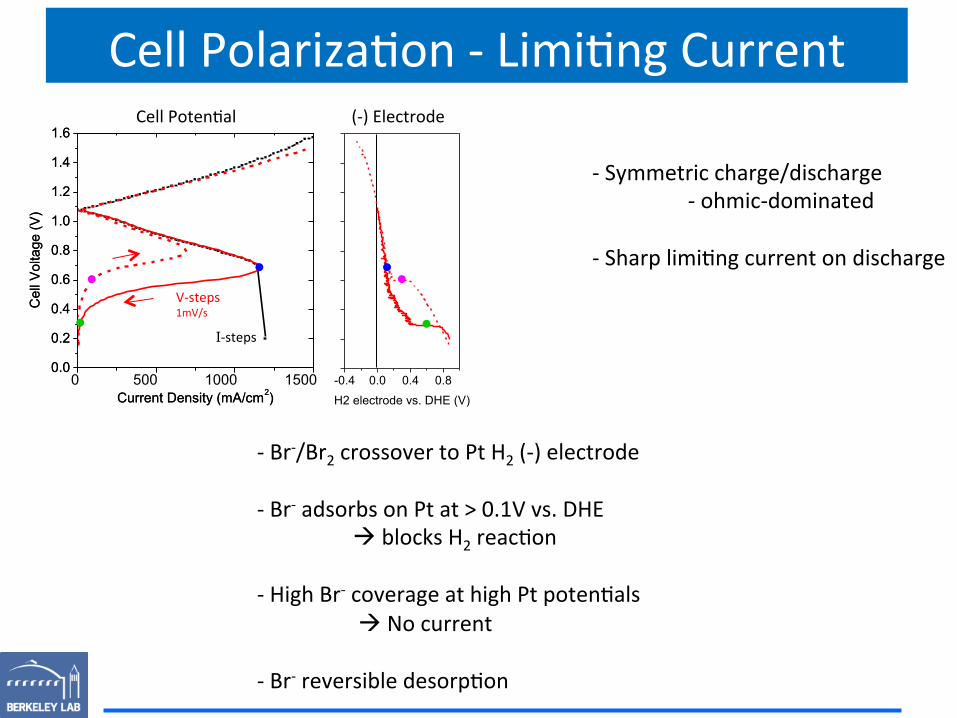
Cell Polariza.on -‐ Limi.ng Current
0 1000 1500 500
Cell Poten.al
-‐ Symmetric charge/discharge -‐ ohmic-‐dominated
-‐ Sharp limi.ng current on discharge
0.0
0.2
0.4
0.6
0.8
1.0
1.2
1.4
1.6
Current Density (mA/cm2)
Cel
l Vol
tage
(V)
-0.4 0.0 0.4 0.8
H2 electrode vs. DHE (V)
V-‐steps 1mV/s
(-‐) Electrode
-‐ Br-‐/Br2 crossover to Pt H2 (-‐) electrode -‐ Br-‐ adsorbs on Pt at > 0.1V vs. DHE
à blocks H2 reac.on -‐ High Br-‐ coverage at high Pt poten.als
à No current -‐ Br-‐ reversible desorp.on
I-‐steps
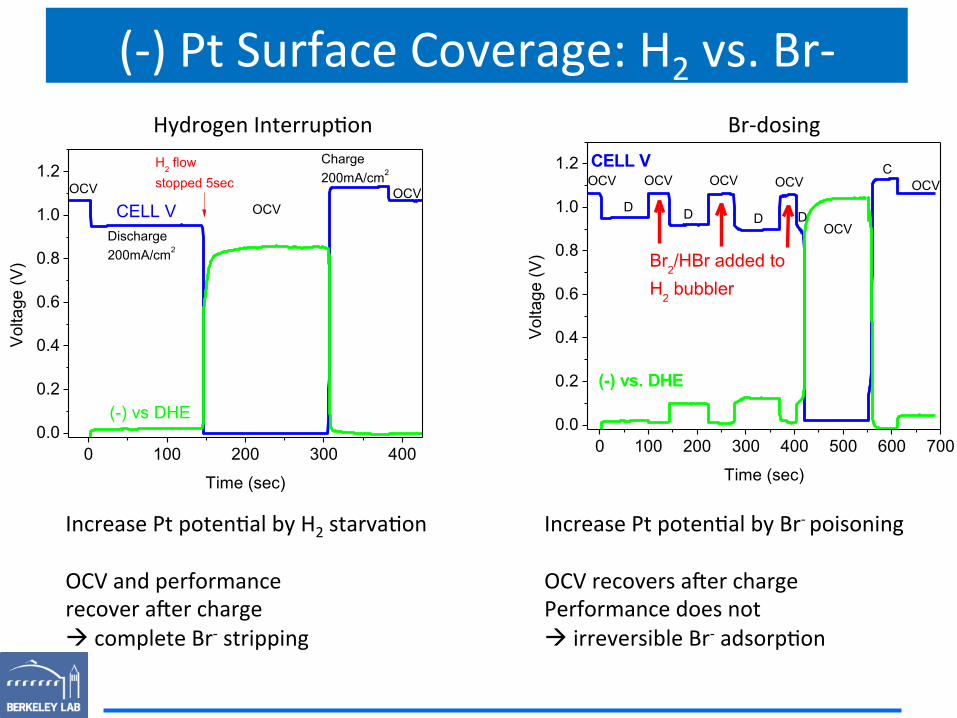
(-‐) Pt Surface Coverage: H2 vs. Br-‐
0 100 200 300 4000.0
0.2
0.4
0.6
0.8
1.0
1.2
(-) vs DHE
H2 flowstopped 5sec
OCV
Charge200mA/cm2
Discharge200mA/cm2
OCV
Time (sec)
Vol
tage
(V)
OCV
CELL V
Increase Pt poten.al by H2 starva.on OCV and performance recover aner charge à complete Br-‐ stripping
Hydrogen Interrup.on
0 100 200 300 400 500 600 7000.0
0.2
0.4
0.6
0.8
1.0
1.2
D D D
OCVOCVOCV
(-) vs. DHE
Br2/HBr added to H2 bubbler
OCV
C
D
OCV
Time (sec)
Vol
tage
(V)
OCVCELL V
Increase Pt poten.al by Br-‐ poisoning OCV recovers aner charge Performance does not à irreversible Br-‐ adsorp.on
Br-‐dosing
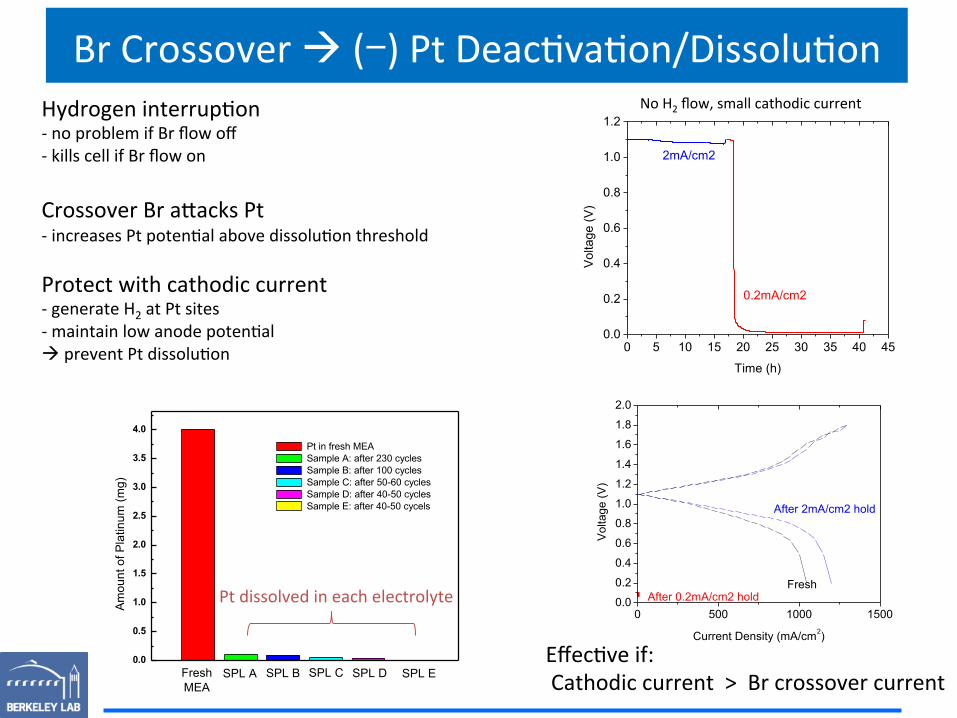
Br Crossover à (-) Pt Deac.va.on/Dissolu.on
0 5 10 15 20 25 30 35 40 450.0
0.2
0.4
0.6
0.8
1.0
1.2
2mA/cm2
Time (h)
Vol
tage
(V)
0.2mA/cm2
No H2 flow, small cathodic current Hydrogen interrup.on -‐ no problem if Br flow off -‐ kills cell if Br flow on Crossover Br a?acks Pt -‐ increases Pt poten.al above dissolu.on threshold Protect with cathodic current -‐ generate H2 at Pt sites -‐ maintain low anode poten.al à prevent Pt dissolu.on
Effec.ve if: Cathodic current > Br crossover current
0 500 1000 15000.0
0.2
0.4
0.6
0.8
1.0
1.2
1.4
1.6
1.8
2.0
After 0.2mA/cm2 hold
Current Density (mA/cm2)
Vol
tage
(V)
After 2mA/cm2 hold
Fresh
0.0
0.5
1.0
1.5
2.0
2.5
3.0
3.5
4.0
FreshMEA
SPL ESPL DSPL CSPL B
Pt in fresh MEA Sample A: after 230 cycles Sample B: after 100 cycles Sample C: after 50-60 cycles Sample D: after 40-50 cycles Sample E: after 40-50 cycels
SPL A
Am
ount
of P
latin
um (m
g)
Pt dissolved in each electrolyte
Outline • Introduc.on
– Performance – Cost
• Bromide crossover – Efficiency – Degrada.on
• Flow baQery performance – Bromide and water return – Cycling behavior
• Summary
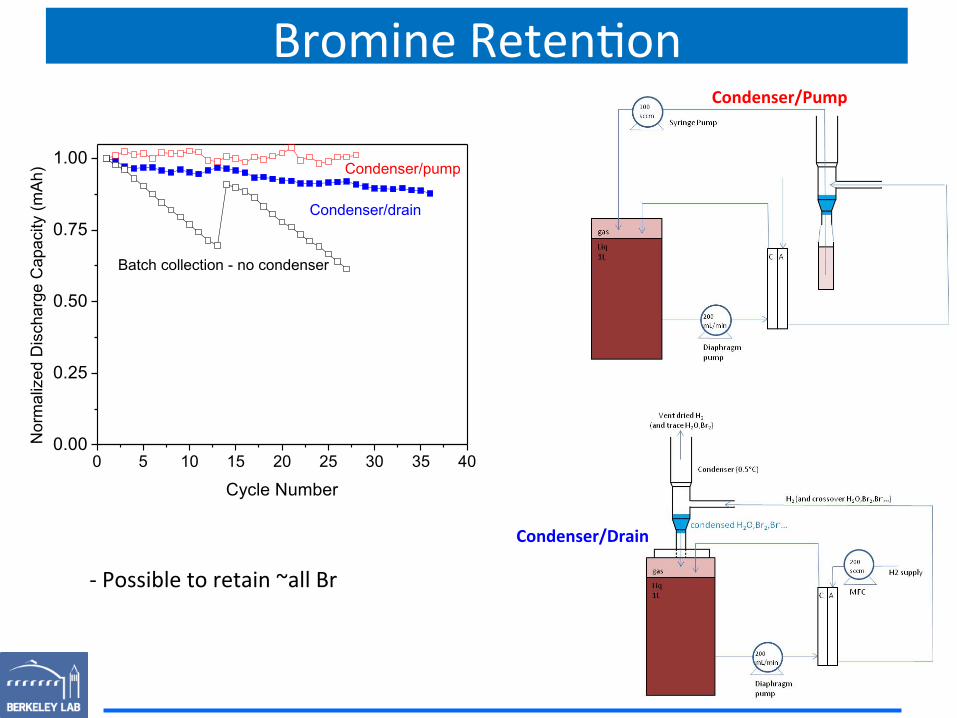
Bromine Reten.on
0 5 10 15 20 25 30 35 400.00
0.25
0.50
0.75
1.00Condenser/pump
Batch collection - no condenser
Nor
mal
ized
Dis
char
ge C
apac
ity (m
Ah)
Cycle Number
Condenser/drain
Condenser/Drain
-‐ Possible to retain ~all Br
Condenser/Pump
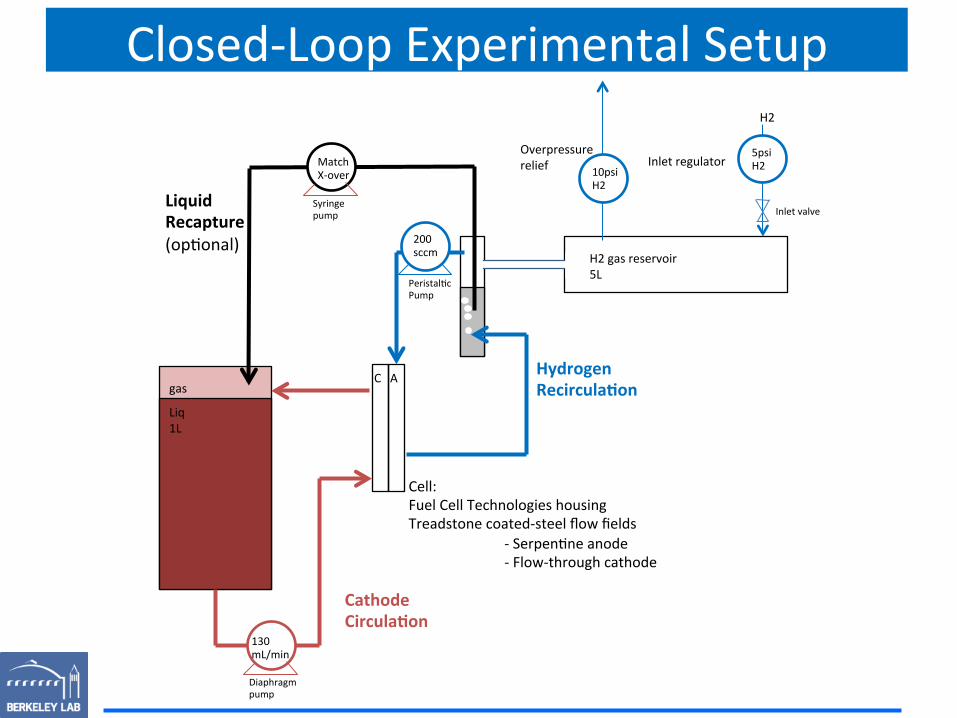
Closed-‐Loop Experimental Setup
gas
Liq 1L
C A
Peristal.c Pump
H2 gas reservoir 5L
200 sccm
Diaphragm pump
130 mL/min
H2
5psi H2 Inlet regulator
10psi H2
Overpressure relief
Syringe pump
Match X-‐over
Liquid Recapture (op.onal)
Inlet valve
Cell: Fuel Cell Technologies housing Treadstone coated-‐steel flow fields
-‐ Serpen.ne anode -‐ Flow-‐through cathode
Hydrogen RecirculaBon
Cathode CirculaBon
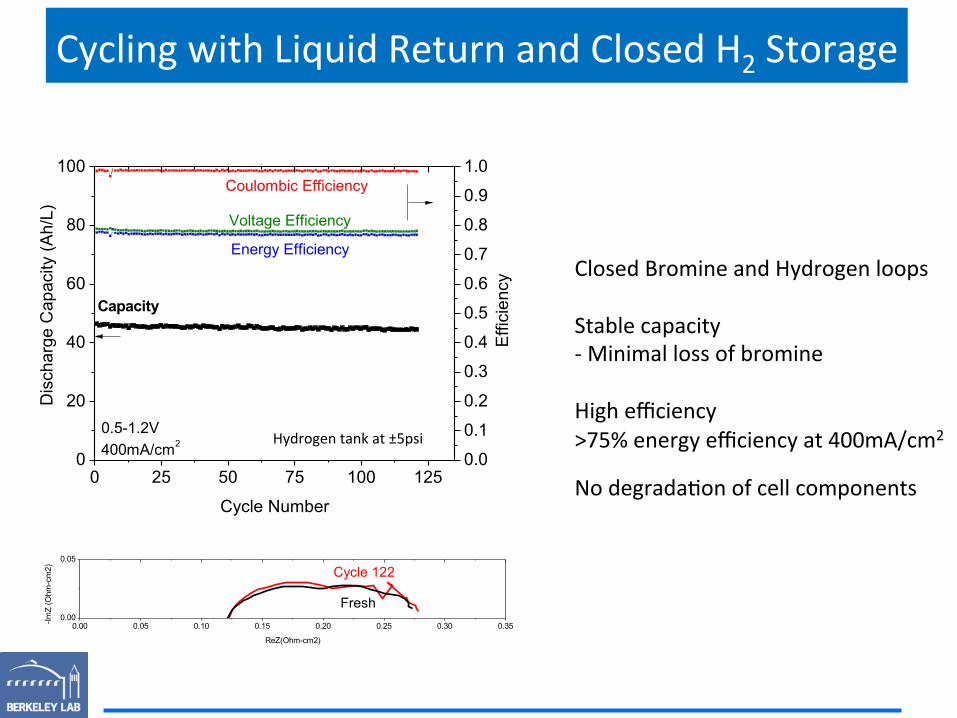
Cycling with Liquid Return and Closed H2 Storage
0 25 50 75 100 1250
20
40
60
80
100
Cycle Number
Dis
char
ge C
apac
ity (A
h/L)
0.0
0.1
0.2
0.3
0.4
0.5
0.6
0.7
0.8
0.9
1.0
0.5-1.2V400mA/cm2
Energy Efficiency
Voltage Efficiency
Effi
cien
cy
Capacity
Coulombic Efficiency
Hydrogen tank at ±5psi
Closed Bromine and Hydrogen loops Stable capacity -‐ Minimal loss of bromine High efficiency >75% energy efficiency at 400mA/cm2
No degrada.on of cell components
0.00 0.05 0.10 0.15 0.20 0.25 0.30 0.350.00
0.05
Cycle 122
ReZ(Ohm-cm2)
-ImZ
(Ohm
-cm
2)
Fresh
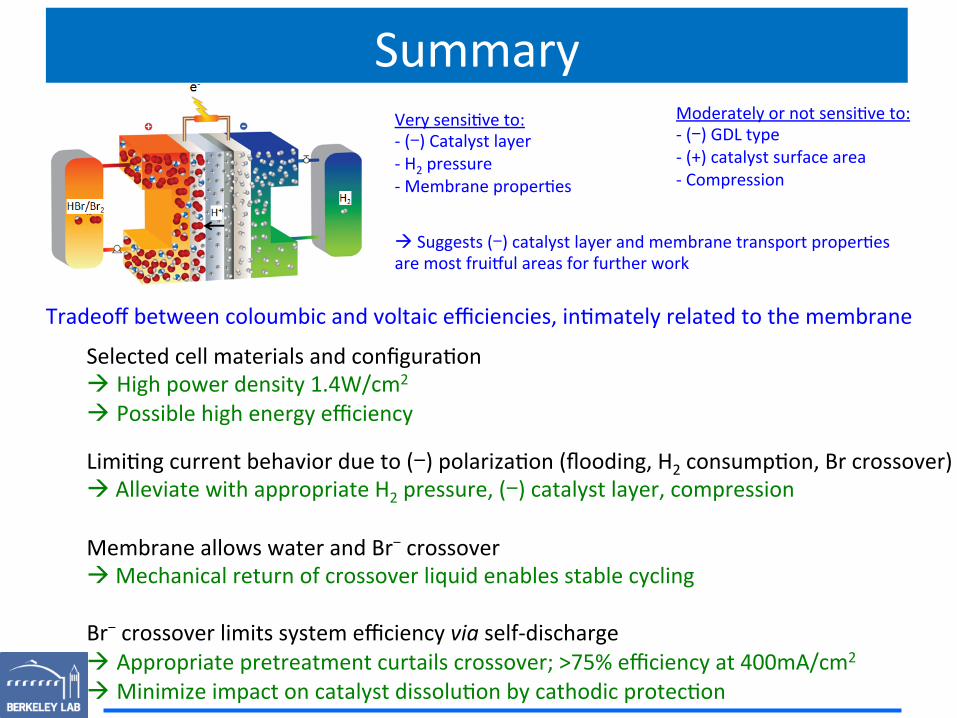
Selected cell materials and configura.on à High power density 1.4W/cm2 à Possible high energy efficiency
Limi.ng current behavior due to (-) polariza.on (flooding, H2 consump.on, Br crossover) à Alleviate with appropriate H2 pressure, (-) catalyst layer, compression Membrane allows water and Br- crossover à Mechanical return of crossover liquid enables stable cycling Br- crossover limits system efficiency via self-‐discharge à Appropriate pretreatment curtails crossover; >75% efficiency at 400mA/cm2
à Minimize impact on catalyst dissolu.on by cathodic protec.on
Very sensi.ve to: -‐ (-) Catalyst layer -‐ H2 pressure -‐ Membrane proper.es
Moderately or not sensi.ve to: -‐ (-) GDL type -‐ (+) catalyst surface area -‐ Compression
à Suggests (-) catalyst layer and membrane transport proper.es are most fruitul areas for further work
Summary
Tradeoff between coloumbic and voltaic efficiencies, in.mately related to the membrane
Acknowledgements • Membrane characteriza.on
– Rafael A. Prato (UC Santa Barbara), Ahmet Kusoglu (LBNL) • Durability
– Markus Ding, Karen Sugano • Kine.c Measurements
– Paul Ridgway (LBNL) • Cost Model
– Paul Albertus (Bosch) • Funding
– US DOE ARPA-‐E • Robert Bosch Corp. • TVN Systems K.T. Cho et al., J. Electrochem. Soc. 159 (2012) A1806
A. Kusoglu et al., Solid State Ionics, 252, 68-74 (2013)
K.T. Cho et al., Chempluschem, doi: 10.1002/cplu.201402043
K.T. Cho et al., Energy Technology 1 (2013) 557-557
M.C. Tucker, et al., J. Appl. Electrochem., under review
Understanding and Optimizing the H2/Br2 Redox Flow Battery for Grid-Scale Energy Sto
rage
Michael Tucker, Kyu Taek Cho, Vincent Battaglia, Venkat Sr
inivsan, and Adam Z. Weber
Environmental Energy Technologies Division Lawrence Berkeley National Laboratory
2nd MRES Northeastern, August 19, 2014
Back-‐up Slides
0 500 1000 1500 20000.0
0.2
0.4
0.6
0.8
1.0
1.2
3020105
Current Density (mA/cm2)
Vol
tage
(V)
PH2 = 0psi
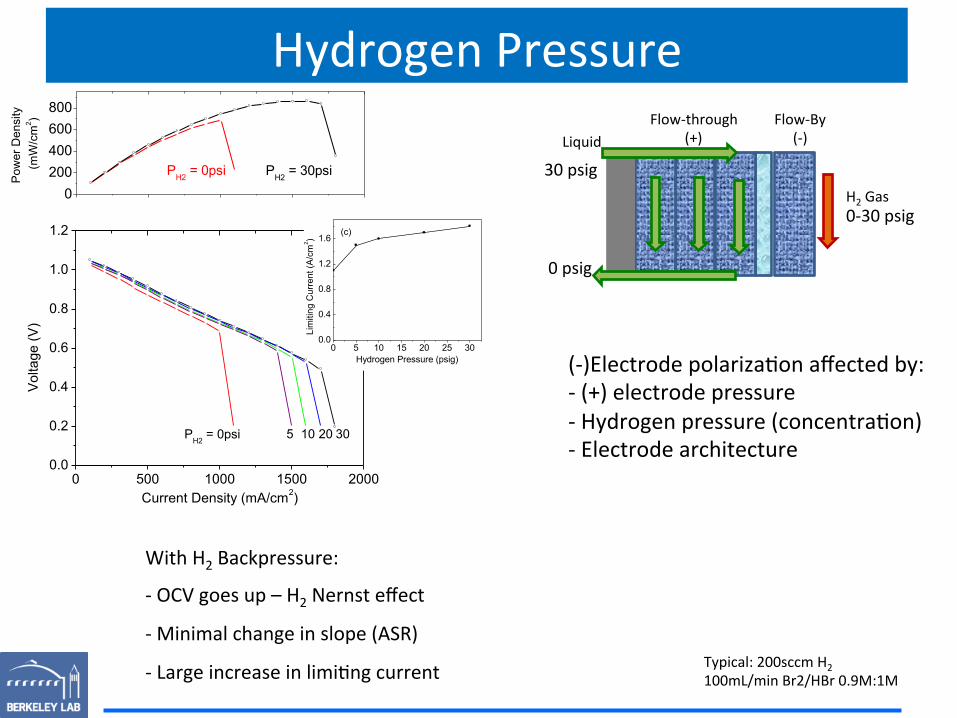
Hydrogen Pressure
With H2 Backpressure:
-‐ OCV goes up – H2 Nernst effect
-‐ Minimal change in slope (ASR)
-‐ Large increase in limi.ng current
Flow-‐through (+) Liquid
Flow-‐By (-‐)
H2 Gas
0 psig
30 psig
0-‐30 psig
(-‐)Electrode polariza.on affected by: -‐ (+) electrode pressure -‐ Hydrogen pressure (concentra.on) -‐ Electrode architecture
Typical: 200sccm H2 100mL/min Br2/HBr 0.9M:1M
0200400600800
Pow
er D
ensi
ty
(mW
/cm
2 )
PH2 = 30psiPH2 = 0psi
0 5 10 15 20 25 300.0
0.4
0.8
1.2
1.6
Lim
iting
Cur
rent
(A/c
m2 )
Hydrogen Pressure (psig)
(c)
0 500 1000 1500 2000 2500 30000.0
0.2
0.4
0.6
0.8
1.0
1.2
Current Density (mA/cm2)
Vol
tage
(V)
BareCarbonBlack(+)
0 500 1000 1500 2000 25000
250
500
750
1000
1250
1500
Current Density (mA/cm2)
Pow
er D
ensi
ty (m
W/c
m2 )
BareCarbonBlack (+)
0.0 0.1 0.2 0.30.00
0.05
ReZ(Ohm-cm2)
-ImZ(Ohm-cm2 )
Bare
Carbon(b)
0 500 1000 1500 2000 2500 30000.0
0.2
0.4
0.6
0.8
1.0
1.2
Current Density (mA/cm2)
Vol
tage
(V)
BareCarbonBlack(+)
Pt/C(-)
0.0 0.1 0.2 0.30.00
0.05
ReZ(Ohm-cm2)
-ImZ(Ohm-cm2 )
Bare
CarbonPt/C(b)
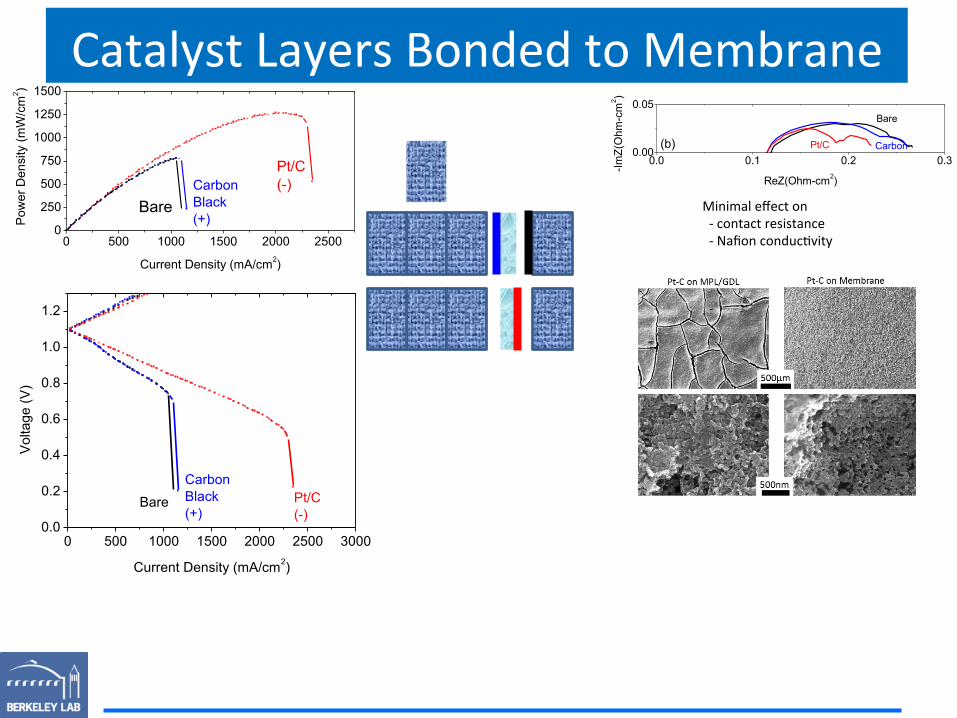
Minimal effect on -‐ contact resistance -‐ Nafion conduc.vity
0 500 1000 1500 2000 25000
250
500
750
1000
1250
1500
Current Density (mA/cm2)
Pow
er D
ensi
ty (m
W/c
m2 )
BareCarbonBlack (+)
Pt/C(-)
Catalyst Layers Bonded to Membrane (+) (-‐)
High S.A. carbon (+) does not help either ASR or limi.ng current -‐ (+) does not limit performance for bare membrane
Pt/C improves (-‐) polariza.on and ASR -‐ Peak power 1.27 W/cm2 (1.4 W/cm2 with 30psi backpressure)
-‐ no pooling between membrane and Pt/C -‐ ejects water be?er -‐ ion transfer at CL/Membrane improves
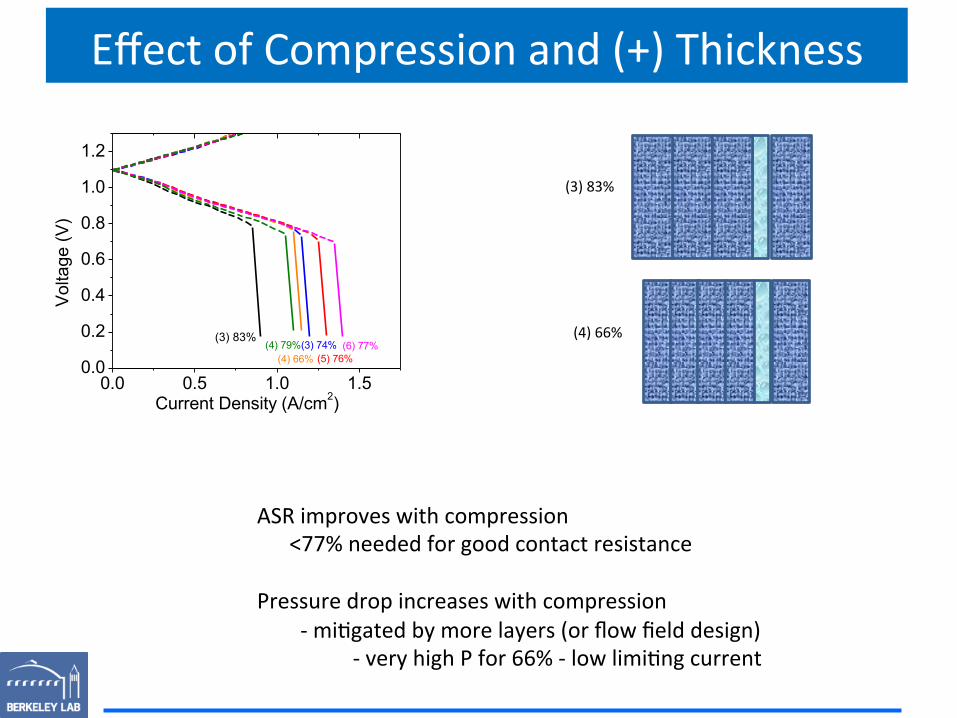
Effect of Compression and (+) Thickness
ASR improves with compression <77% needed for good contact resistance Pressure drop increases with compression -‐ mi.gated by more layers (or flow field design)
-‐ very high P for 66% -‐ low limi.ng current
(3) 83%
(4) 66%
0.0 0.5 1.0 1.50.0
0.2
0.4
0.6
0.8
1.0
1.2
(6) 77%(4) 79%(5) 76%(4) 66%
(3) 74%(3) 83%
Current Density (A/cm2)
Vol
tage
(V)
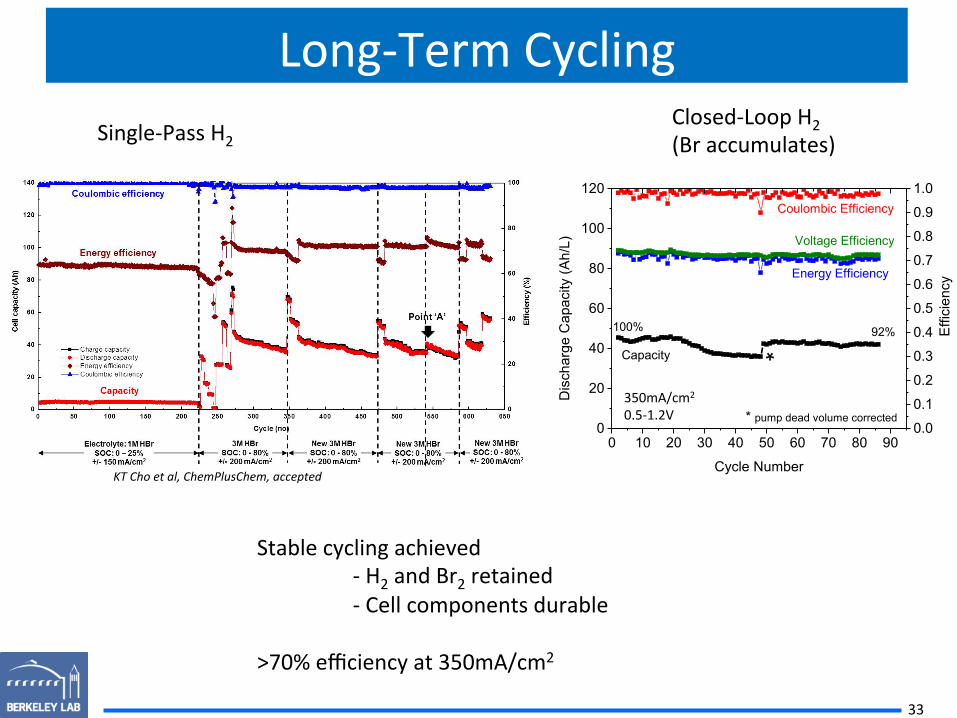
Long-‐Term Cycling Single-‐Pass H2
Closed-‐Loop H2 (Br accumulates)
KT Cho et al, ChemPlusChem, accepted
Stable cycling achieved -‐ H2 and Br2 retained -‐ Cell components durable
>70% efficiency at 350mA/cm2
350mA/cm2
0.5-‐1.2V
33
0 10 20 30 40 50 60 70 80 900
20
40
60
80
100
120
Cycle Number
Dis
char
ge C
apac
ity (A
h/L)
0.0
0.1
0.2
0.3
0.4
0.5
0.6
0.7
0.8
0.9
1.0
92%
Energy Efficiency
Voltage Efficiency
Effi
cien
cy
Capacity
Coulombic Efficiency
100% *
* pump dead volume corrected
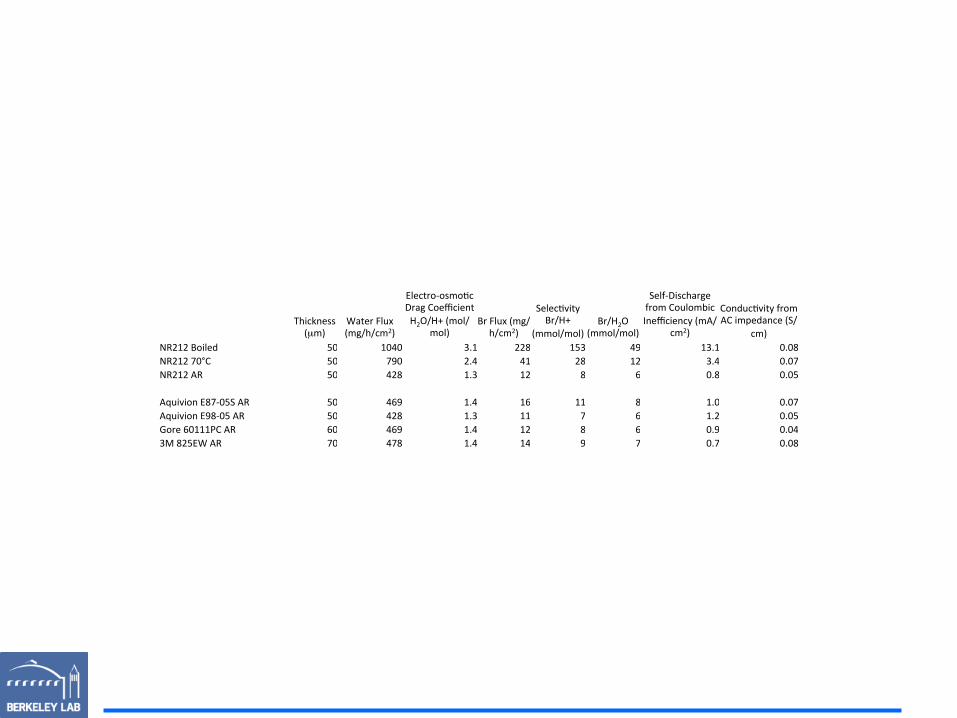
Thickness (µm)
Water Flux (mg/h/cm2)
Electro-‐osmo.c Drag Coefficient H2O/H+ (mol/
mol) Br Flux (mg/
h/cm2)
Selec.vity Br/H+
(mmol/mol) Br/H2O
(mmol/mol)
Self-‐Discharge from Coulombic Inefficiency (mA/
cm2)
Conduc.vity from AC impedance (S/
cm) NR212 Boiled 50 1040 3.1 228 153 49 13.1 0.08 NR212 70°C 50 790 2.4 41 28 12 3.4 0.07 NR212 AR 50 428 1.3 12 8 6 0.8 0.05
Aquivion E87-‐05S AR 50 469 1.4 16 11 8 1.0 0.07 Aquivion E98-‐05 AR 50 428 1.3 11 7 6 1.2 0.05 Gore 60111PC AR 60 469 1.4 12 8 6 0.9 0.04 3M 825EW AR 70 478 1.4 14 9 7 0.7 0.08


![Aruba Mobility Master and VMC Installation Guidecommunity.arubanetworks.com/aruba/attachments/aruba/unified-wired...[root@localhost~]#cat/etc/sysconfig/network-scripts/ifcfg-br2 DEVICE=br2](https://img.pdfslide.us/doc/110x75/5b1ec9a17f8b9a7f2f8bebae/aruba-mobility-master-and-vmc-installation-rootlocalhostcatetcsysconfignetwork-scriptsifcfg-br2.jpg)