Embed Size (px)
Citation preview

UNDERSTANDING AND MAPPING ROTUNDONE
SPATIAL VARIABILITY IN VITIS VINIFERA L. C.V DURAS
COMPREHENSION ET CARTOGRAPHIE DE LA VARIABILITE SPATIALE EN
ROTUNDONE CHEZ VITIS VINIFERA L. C.V. DURAS ___________________________
Olivier GEFFROY1*, Thibaut SCHOLASCH2, Thierry DUFOURCQ3, Eric SERRANO1 1Institut Français de la Vigne et du Vin – Pôle Sud-Ouest, V’innopôle, BP22, 81310 LISLE SUR TARN – France 2Fruition Sciences SAS, Cap Omega, Rond-point Benjamin Franklin CS 39521, 34960 MONTPELLIER - France
3Institut Français de la Vigne et du Vin – Pôle Sud-Ouest, Château de Mons, 32100 CAUSSENS – France
*Corresponding author: O. GEFFROY, +33 563 336 262, fax. +33 563 336 260, Email: [email protected]
Abstract
Recent research works highlighted large variability in rotundone concentration - the main compound responsible for peppery
aroma in red wines - within a vineyard block associated with variation in land underlying the vineyard and vine water
deficit. In order to further study and determine practical ways to map rotundone spatial variability, a study was carried on a
0.41 ha Duras vineyard from the South West of France under oceanic climatic influence. The smart point method was used
and in order to optimize vineyard sampling, variability in vine architecture of the plot was assessed through measurements of
trunk circumference (TC). On the basis of the three classes of TC obtained, six smart points made of 50 vines were positioned
and followed independently over the vine growing season and winter dormancy for shoot elongation, stem water potential (Ψ
stem), mineral uptake (petiole analysis and Dualex® measurements), airborne multispectral video imagery (NDVI), fruit
quality, pruning wood weights (Physiocap® and manual weighing) and yields at harvest. At each smart point, rotundone was
measured in wines obtained by microvinification techniques (1 L Erlenmeyer). Differences between smart points were very
weak from an agronomic standpoint. However, a few plant physiological indicators (i.e. Ψ stem, Dualex® measurements)
allowed discriminating vine performances. Despite this very low variability between plant and fruit measured variables
(including those related to grape and wine quality but excluding TC), rotundone concentration was on average more than
50% higher in the wines from the high TC area. Thus, our data set suggests that a link exists between plant architecture (TC)
and rotundone, and that TC can be used to approach rotundone spatial distribution. Our results also tend to strengthen the
hypothesis that rotundone is very sensitive to fine variations of grapevine water status.
Key-words: rotundone, peppery aroma, spatial variability, geostatistics, remote and proximal sensing
Résumé
Des travaux récents ont mis en avant une importante variabilité de concentration en rotundone - le principal composé
responsable de l’arôme poivré des vins rouges - au sein d’une même parcelle, en lien avec les caractéristiques du sol et le
niveau de contrainte hydrique. Afin d’aller plus loin et d’identifier une méthode pour cartographier de manière simplifiée
cette variabilité spatiale, une étude a été lancée sur une parcelle de Duras N de 0,41 ha du Sud-Ouest, sous influence
climatique de type océanique. La méthode dite des « smart points » a été mise en œuvre et afin d’optimiser l’échantillonnage,
la variabilité parcellaire dans l’architecture de la vigne a été évaluée grâce à des mesures de circonférence moyenne de tronc
(TC). Sur la base des trois classes de TC obtenues, six « smart points » de 50 pieds ont été définis et suivis indépendamment
sur la période végétative et le repos hivernal pour l’élongation des rameaux, le potentiel hydrique foliaire de tige, la nutrition
minérale (analyses pétiolaires et mesures de Dualex®), l’indice de végétation par imagerie aérienne (NDVI), la qualité des
raisins, le poids des bois de taille (Physiocap® et pesage manuel) et les rendements à la récolte. Pour chaque smart point, la
rotundone a été mesurée dans des vins élaborés en condition de microvinification (Erlenmeyer d’1 L). Les différences
observées entre les smart points sont très faibles d’un point de vue agronomique. Cependant, peu d’indicateurs de la
physiologie de la plante (par exemple les mesures de potentiel hydrique foliaire de tige et de Dualex®) ont permis de
discriminer le comportement de la vigne. Malgré cette faible variabilité pour la plupart des variables mesurés sur la vigne et
les raisins y compris ceux liés à la qualité du raisin et du vin à l’exception du TC, la concentration en rotundone est en
moyenne 50% plus élevée dans les vins issus de la zone à fort TC. Nos données suggèrent qu’il existe un lien entre la
rotundone et l’architecture de la vigne (TC) et que la circonférence des troncs peut être utilisée afin d’approcher la
distribution spatiale de la rotundone. Nos résultats tendent également à renforcer l’hypothèse selon laquelle la rotundone est
très sensible à de fines variations de contrainte hydrique.
Mots-Clés: rotundone, arome poivré, variabilité spatiale, géostatistiques, télé et proxi-détections
1. Introduction Rotundone is the main compound responsible for peppery aroma in red wines which has been identified in a growing number
of cultivars. Recent research works highlighted large variability in rotundone concentration within a vineyard block
associated with variation in land underlying the vineyard (Scarlett et al. 2014) and vine water deficit (Geffroy et al. 2014).
The last author identified good correlations (R2 = 0.76 in 2011 and R2 = 0.74 in 2012) between rotundone in wine and δ13C
measured on grape sugar at harvest within the same vineyard. These findings suggest that it may be possible to manipulate
rotundone content and the peppery character in wines through selective harvest. In order to further study and determine practical ways to map rotundone spatial variability, a study was carried on a Duras vineyard from the South West of France.

Unlike the approach proposed by Scarlett et al. (2014) which was more focused on relationships between land characteristics
(soil conductivity, elevation, slope) and rotundone, our experiment proposed to focus on potential relationships involving
plant and fruit physiological variables. To reach that goal we implemented an optimized sampling protocol to develop an
agronomic approach based on vine physiological behavior.
2. Material and methods
Experimental vineyard, climatic background and sampling optimization protocol
The experiment was carried out on a 0.41 ha Guyot trained Duras vineyard from the South West of France planted in 1999
with 2.20 m × 1 m vine spacing. The plot that has been followed for 5 years was selected because both high concentration of
rotundone and spatial variability in this variable were previously recorded. It is located in an area under oceanic climatic
influence with normal annual rainfall and mean air temperature over the 1981-2010 period of 638 mm and 12.9°C,
respectively. The vintage of study was characterized by a rainy and warm winter, a normal spring and an extremely rainy
summer with 160 mm of rain recorded between mid-July and the end of August. Climatic conditions over the maturation
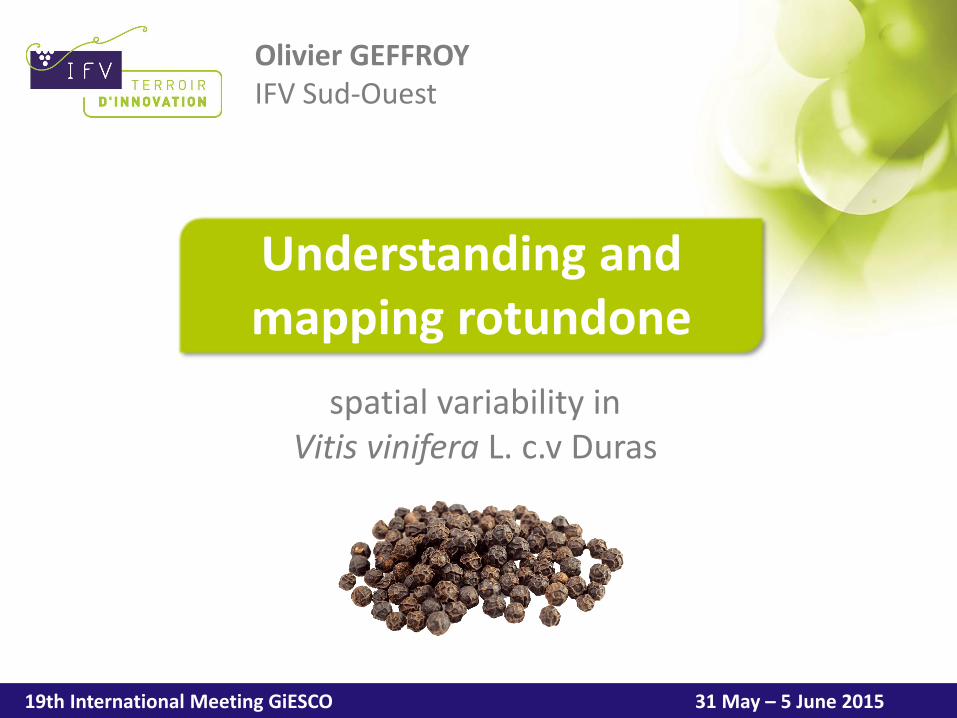
period were dry and hot. The smart point method was used and vineyard sampling was optimized according to the approach
proposed by Meyers et al. (2011). Variability in vine architecture of the plot was assessed during winter dormancy through
measurements of mean trunk circumference (TC). Twenty-five plots made of four consecutive vines in a row were selected
and TC was monitored at each plot at three different heights. According to Tisseyre et al. (2005), this integrative variable
reflects, among other factors, vine response to water and mineral deficits since plantation and thus can be used to determine
areas of high water deficit when monitored along with other variables to assess vine nutrition. Data collected were
normalized and spatialized through the kriging method (Figure 1A). On the basis of the three classes of TC obtained, six
smart points were positioned with A and B corresponding to high, C and D to average and E and F to low TC classes. Each
smart point consists of 50 vines selected over five different rows and the six smart points represents 17.5% of the whole
block area. They were followed independently over the vine growing season.
Vegetative growth, mineral uptake and water deficit
Several indicators were used in order to reflect the vegetative growth and expression of the vine. Shoot elongation, an early
indicator of water deficit (Pellegrino et al. 2005) was monitored weekly on three smart points (A, D and F) between 100 and
500 growing degree days (GDD) on trellised shoots (four shoots per vine and four consecutive vines per smart point).
Remotely sensed imagery (airborne multispectral video imagery with a ground resolution of 50 cm) of the plot was obtained
at veraison, on 4 August. Number of shoots and pruning wood weights were measured in January 2015 on the whole plot
through Physiocap®, a new system to measure the number and the diameter of vine shoots. On each smart point, pruning
wood mass (kg/vine) was also measured individually for 30 out of 50 vines. The uptake of mineral elements was accessed
through petiole analyses (major and trace minerals) on an average sample of 50 basal leaves (1 per vine) at six key time
points between flower cluster with floret separation and harvest, on three smart points (A, D and F). On each smart point,
nitrogen status was also characterized on 50 leaves (1 leaf per vine) through measurements of Dualex® (Force A, Orsay,
France), a fluorescence based sensor which allows the calculation of a chlorophyll flavonols ratio named NBI® (Nitrogen
Balance Index). For each smart point, stem water potentials (Ψ stem) were measured from 10 of the 50 vines according to the
protocol defined by Choné et al. (2001) at 4 time points (closing of the bunch, mid-veraison and harvest).
Fruit composition and rotundone
For each smart point, six grape samples were collected between 10 days before mid-veraison and harvest. Each sample
consisted of 200 berries from both sides of the row and several parts of the cluster. After weighting, crushing and
centrifugation, potential alcohol, titratable acidity, pH, malic acid, yeast assimilable nitrogen (YAN) and polyphenolic
compounds (harvest sample only) were measured. For each smart point, 600 berry samples were also collected at harvest for
indirect determination on rotundone in wines prepared by microvinification techniques (1-L Erlenmeyer) according to the
protocol described by Geffroy et al. (2014). For each smart point, the 50 sample vines were harvested and yields at harvest
(kg/vine) were monitored individually.
Statistical analysis
Statistical analyses were conducted with Xlstat software (Addinsoft, Paris, France). Analytical data with replicated
measurements (stem water potentials, NBI, yields at harvest and pruning wood weights) were subjected to an ANOVA
treatment. Fisher’s least significant difference test was used as a post-hoc comparison of means at P < 0.05. Principal
component analysis (PCA) was employed using means for each of the smart point for most of indicators followed, with
rotundone as an additional variable.
3. Results and discussion
Agronomical behavior of the smart points
No differences in budburst date nor in other phenological stages were observed between the smart points. From 350 GDD
which corresponds to 5 days before berry set, shoot elongation started to slow down on smart point F (Figure 2A). This
deceleration could be linked rather to an early water deficit than to a nitrogen deficiency (Table 1) as higher NBI values were
recorded on lower TC smart points (E and F). Both indicators i.e. petiole analysis by reference method and NBI showed
lower nitrogen content in the high TC smart point at berry set which suggests a dilution of this element. While Physiocap®
measurements showed a relative good homogeneity of the plot for pruning wood biomass (Figure 2B), manual weighing
tends to strengthen this hypothesis (Table 1) as higher average values - non-significant statistically - were recorded on smart
points A and B. As the vineyard block was characterized by a significant rate of missing plants (15%) with high mortality due
to trunk diseases, Physiocap® measurements which occur at a frequency of 1 Hz may have been biased toward the detection
of spatial variation reflecting areas with more missing plants than biomass differences between heatlhy vines. The month
preceding veraison and far beyond until the end of August, frequent rain events contributed to the development of the inter-
row grass cover crop. Despite potential signal perturbation due to the presence of this green cover at veraison and the high
percentage of missing plants, NDVI spatial pattern (Figure 2C) tends to visually overlaying the TC map. At closing of the
bunch and veraison, probably because of the heavy rains, Dualex® measurements were perturbed. Due to bad weather
conditions, measurement of stem water potential at veraison was delayed of 25 days and at harvest, leaves were in a bad
condition to perform the measurement. Ψ stem especially at bunch closure, allows a perfect discrimination of the smart point
according to the classes of TC defined. This observation corroborates previous research works (Tisseyre et al. 2005).
According to the threshold defined by van Leeuwen et al. (2009) water deficit experienced by the vine on the plot was null to
weak. Surprisingly at harvest and possibly earlier in the season, nitrogen status from the average TC class as reflected by the
NBI values in leaves and YAN in grapes presented higher nitrogen levels which may be the combined effect of a better
assimilation in comparison with the low TC smart points in relation with water deficit, and of a lesser dilution in comparison
with the high TC smart points. In terms of sugar accumulation over the maturation period (Figure 2B) and polyphenolics in
grapes at harvest (Table 1), little differences were noticed between the smart points. The slight decrease observed in the last
sample may reflect more a measurement artefact than a real loss in sugar by respiration.
Differences between the smart points were very weak which is consistent with the hypothesis that low water deficit leads to
low spatial contrast within the smart points (Taylor et al. 2010). Indicators used in routine and well known by winegrowers
such as yields at harvest, fruit quality, mineral uptake through petiole analysis, pruning wood weights were not enough
powerful to discriminate the smart points from an agronomical point of view while much better results were obtained with
trunk circumference, Ψ stem, NBI.
Discussion about the average TC class and rotundone concentration in wine
It is always difficult to position an average class and to relate it either to a lower or to a higher group. This is not an
unimportant matter as the average TC area of the studied plot represents almost half of the whole surface (Figure 1A). The
wide range of indicators followed during our study and their analysis through a PCA treatment (Figure 3) should allow us to
discuss it. It appears that smart points C and D have more similarities with smart points E and F and should be merged with
the low TC class when considering selective harvest. This is consistent with the rotundone concentration, with average values
of 94.5, 60.5 and 61 ng/L found in wines from the high, average and low TC area respectively. The PCA plots show that
rotundone is correlated with variables related directly or indirectly to water deficit such as Ψ stem, weight of 200 berries and
malic acid level, which is consistent with Geffroy et al. (2014).
4. Conclusion
The present works allowed us to set up a methodology for assessing rotundone spatial distribution through the smart point
method, under oceanic climatic influence. Despite very small differences between smart points for most of the measured
variables including those related to wine quality, rotundone was on average more than 50% higher in the wines from the high
TC area. Our results suggest that a link exists between rotundone in wine and plant architecture (TC) and that this cost-
effective indicator - the time to perform the 25 measurements on the plot didn’t exceed one hour - can be used to approach
rotundone spatial distribution. As TC is known to be closely correlated with apparent soil electrical conductivity (ECa)
(Bramley et al. 2011), our results are in agreement with recent research works (Scarlett et al. 2014) that show correlations
between ECa and rotundone concentration. Our study also tends to strengthen the link existing within a vineyard between
small variations in water deficit and rotundone in wine, highlighting the high sensitivity of the compound to fine variation of
grapevine water status. In 2015, the same method will be implemented on a Syrah plot and grapes will be harvested
selectively thanks to a new commercial harvester.
5. Acknowledgments
This study was carried out with financial support from FranceAgriMer and Midi-Pyrénées region. We are grateful to Manon
Morlet and Olivier Garcia (both: CIVC, Epernay, France) for the Physiocap® measurements. Jérémie Diesel (IFV), Malek
Hamouda and Sébastien Payen (Fruition Sciences) are also acknowledged for their technical assistance.
Literature Cited
Bramley R.G.V., Trought, M.C.T., Praat J. P. 2011. Vineyard variability in Marlborough, New Zealand: characterising
variation in vineyard performance and options for the implementation of Precision Viticulture. Australian Journal of Grape
and Wine Research, 17, 72-78.

Choné X., Van Leeuwen C., Dubourbieu D., Gaudillère, J.P., 2001. Stem water potential is a sensitive indicator of
grapevine water status. Annals of Botany 87, 477–483.
Geffroy O., Dufourcq T., Carcenac D., Siebert T., Herderich M., Serrano, E., 2014. Effect of ripeness and viticultural
techniques on the rotundone concentration in red wine made from Vitis vinifera L. cv. Duras. Australian Journal of Grape
and Wine Research, 20, 401-408.
Meyers J. M., Sacks G. L., Van Es H. M., Vanden Heuvel J. E., 2011. Improving vineyard sampling efficiency via
dynamic spatially explicit optimisation. Australian Journal of Grape and Wine Research, 17, 306-315.
Pellegrino A., Lebon E., Simonneau T., & Wery, J. 2005. Towards a simple indicator of water stress in grapevine (Vitis
vinifera L.) based on the differential sensitivities of vegetative growth components. Australian Journal of Grape and Wine
Research, 11, 306-315.
Scarlett N. J., Bramley R. G. V., Siebert T. E., 2014. Within vineyard variation in the ‘pepper’compound rotundone is
spatially structured and related to variation in the land underlying the vineyard. Australian Journal of Grape and Wine
Research, 20, 214-222.
Taylor J. A., Acevedo‐Opazo C., Ojeda H., Tisseyre B., 2010. Identification and significance of sources of spatial
variation in grapevine water status. Australian Journal of Grape and Wine Research, 16, 218-226.
Tisseyre B., Ojeda H., Carillo N., Deis L., & Heywang M. 2005. Precision viticulture and water status, mapping the
predawn water potential to define within-vineyard zones. In Proceedings of 14th GiESCO Congress (pp. 23-27). Geisenheim
Germany.
Van Leeuwen C., Trégoat O., Choné X., Bois B., Pernet D. and Gaudillère J.P., 2009. Vine water status is a key factor in
grape ripening and vintage quality for red Bordeaux wine. How can it be assessed for vineyard management purposes?
Journal International des Sciences de la Vigne et du Vin 43, 121–134.
Figure 1: Variation in (A) trunk circumference, (B) pruning wood biomass, and (C) NDVI index in a 0.41 ha Duras vineyard
in the South West of France.
Figure 1 : Variation (A) de circonférence de tronc, (B) biomasse de bois de taille, et (C) d’index NDVI au sein d’une
parcelle de 0,41 ha du Sud-Ouest de la France.
Figure 2: Differences between the smart points in (A) shoot elongation from 100 to 500 GDD and (B) sugar accumulation
between 10 days before mid-veraison and harvest.
Figure 2 : Différences observées entre les smart point pour (A) l’élongation des rameaux sur la période 100-500 et (B)
l’accumulation en sucre entre 10 jours avant la mi-véraison et la récolte.

Table I: Differences between the smart points for several variables followed over the vine growing season and winter
dormancy aPruning wood weights. bFlower cluster with floret separation.
Table I: Differences entre les smart points pour plusieurs variables mesurés au cours du cycle de la vigne et lors du repos
hivernal. aPoids des bois de taille. bBoutons floraux séparés.
Figure 3: Principal component analysis of data collected on the six smart points. (A) PC1 vs PC2; (B) PC1 vs PC3.
Figure 3 : Analyse en composantes principales des données collectées sur six smart points. (a) PC1 vs PC2; b) PC1 vs PC3.
Variable Phenological stage P-values Smart point
A B C D E F
Nitrogen status (NBI) FCFSa 0.008 4.40 b - - 4.97 a - 4.72 a
Berry set < 0.0001 4.63 d 4.99 cd 5.24 bc 5.33 abc 5.68 a 5.43 ab
Berry set + 10 days 0.005 4.88 b 4.87 b 5.11 ab 5.44 a 5.50 a 5.44 a
Bunch closure 0.128 5.20 a 5.12 a 5.67 a 5.28 a 5.19 a 5.15 a
Veraison 0.068 5.12 a 5.11 a 5.63 a 5.49 a 5.39 a 5.63 a
Harvest < 0.001 5.71 c 5.86 c 6.64 a 5.51 ab 5.36 ab 6.10 bc
Total N FCFS - 0.8 - - 0.9 - 0.9 (% dry matter) Berry set - 0.6 - - 0.6 - 0.6
Pea size - 0.5 - - 0.5 - 0.6
Bunch closure - 0.5 - - 0.5 - 0.5
Veraison - 0.4 - - 0.5 - 0.5
Harvest - 0.5 - - 0.6 - 0.6
Ψstem (Mpa) Bunch closure < 0.0001 -0.43 a -0.42 a -0.61 b -0.57 b -0.63 b -0.66 b
Veraison + 25 days < 0.0001 -0.43 a -0.39 a -0.55 b -0.58 bc -0.64 bc -0.67 c
Harvest < 0,0001 -0,56 a -0,54 a -0,91 c -0,72 b -0,82 bc -1,07 d Yields (kg / vine) Harvest 0.194 2.81 a 2.91 a 3.48 a 2.87 a 3.03 a 2.61 a
YAN (mg/L) Harvest - 103 89 133 135 114 119
Anthocyanins (mg/L) Harvest - 1036 1091 1077 1077 962 1092
TPI Harvest - 94 97 92 92 86 97
PWWb(kg/vine) Winter dormancy 0.158 0.371 a 0.400 a 0.337 a 0.336 a 0.315 a 0.318 a
Rotundone in wine (ng/L) Harvest - 86 103 50 71 75 47
Understanding and mapping rotundone
spatial variability in Vitis vinifera L. c.v Duras
Olivier GEFFROY IFV Sud-Ouest
19th International Meeting GiESCO 31 May – 5 June 2015

Understanding and mapping rotundone spatial variability
2
• Compound responsible for peppery aroma in wines discovered recently in Australia (Wood et al. 2008)
• Identified in a growing number of cultivars (Duras, Négrette, Fer, Abouriou, Syrah, Malbec, Pinot Noir, Gamay, Mondeuse, Pineau d’Aunis, Arani, Vespolina, Schioppettino, Grüner Veltliner, Maturana T…)
• Perception threshold of 8 ng/l (water) and 16 ng/l (red wine)
• 20 mg are enough to “contaminate” an Olympic swimming pool
• One of the 16 most impacting aroma compound in wine (Ferreira 2012)
• 20% of anosmia • Well perceived by consumers
Reminder about rotundone

3
Correlation between rotundone and δ13C at harvest
• Good correlation between rotundone and δ13C on a 428 m2 Duras block • Rotundone variability is spatially structured which was also confirmed in
Australia (Scarlett et al. 2014) • Possibility to identify regions of water deficit within a vineyard, which would
facilitate the identification of zones for selective harvesting
r² = 0.76
0
10
20
30
40
50
60
70
-27.20 -27.00 -26.80 -26.60 -26.40 -26.20 -26.00 -25.80
rotu
nd
on
e co
nce
ntr
ati
on
(n
g/L
)
δ13C
A
r² = 0.74
0
5
10
15
20
25
30
35
40
-25.50 -25.00 -24.50 -24.00 -23.50 -23.00 -22.50ro
tun
don
e co
nce
ntr
ati
on
(n
g/L
)
δ13C
B
r² = 0.76
0
10
20
30
40
50
60
70
-27.20 -27.00 -26.80 -26.60 -26.40 -26.20 -26.00 -25.80
ro
tun
do
ne c
on
cen
tra
tio
n
(ng
/L)
δ13C
A
r² = 0.74
0
5
10
15
20
25
30
35
40
-25.50 -25.00 -24.50 -24.00 -23.50 -23.00 -22.50
ro
tun
do
ne c
on
cen
tra
tio
n (
ng
/L)
δ13C
B
Geffroy et al. 2014, Aust J Grape Wine Res 20(3), 401-408
Understanding and mapping rotundone spatial variability
2011 2012

4
How to gain access to rotundone spatial distribution ‘easily’ ?
• Work consists in optimizing the sampling by getting access to vine architecture using precision viticulture (Meyers et al. 2011)
• Conducted in 2014, a wet vintage, in collaboration with Fruition Sciences on a 0,4 ha Duras block (PDO Gaillac) under Atlantic climate conditions
• Trunk Circumference (TC) which reflects vine response to mineral and water deficit since the plantation (Tisseyre et al. 2005) was measured at 3 levels on 25 plots made of 4 consecutive vines
• Data were normalized, spatialized through the krigeage method
• On the basis of the 3 classes obtained, 6 ‘smart points’ of 50 vines were positioned
=> 17,5% of the whole block
Understanding and mapping rotundone spatial variability
Gaillac
5
Understanding and mapping rotundone spatial variability
Main measurements performed on the smart points
And on the whole block
• Remotely sensed imagery (NDVI) • Physiocap® measurements, a sensor to
assess wood biomass
• Pruning wood weights (PWW) • Petiole analyses and Dualex®
measurements (NBI), a fluorescence based sensor at 5 time points
• Stem water potentials (Ψstem) + δ13C at 3 time points
• Fruit quality (Brix, TA, pH, YAN, phenolics) at 5 time points and grape yields at harvest
• Rotundone in wines prepared by microvinification techniques (1L)

6
A B
C
D
E
F
Nb of clusters Yield
Ψstem (closing)
Ψstem (50% ver)
Ψstem (50% ver +25)
Ψstem (harvest)
YAN (harvest)
NBI (berry set)
NBI (berry set +10)
NBI (closure)
NBI (veraison)
NBI (harvest)
Malic (veraison) Malic (harvest) Brix (harvest)
δ13C (closing)
δ13C (veraison) δ13C (harvest)
Anthocyanins (harvest)
TPI (harvest)
Nb shoots
PWW Weight 200 berries
(harvest)
TA (harvest)
Rotundone
-6
-4
-2
0
2
4
6
8
-6 -4 -2 0 2 4 6
PC
2 (
18
,26
%)
PC1 (59,97 %)
Understanding and mapping rotundone spatial variability
Variable R2 (n=6)
Ψstem (closure) 0,75 Ψstem (harvest) 0,87
NBI (veraison) 0,91 Malic (veraison) 0,76 δ13C (veraison) 0,93 δ13C (harvest) 0,82 W. 200 berries 0,85
TA (harvest) 0,75
• The average TC class (C,D) should be merged with the low TC class (E,F)
• Rotundone is correlated with variables related directly or indirectly to water status
Results overview

7
Understanding and mapping rotundone spatial variability
Nitrogen uptake and water status
• Low water deficit due to rainy summer conditions which leads to little differences between the smartpoints in accordance with previous works (Taylor et al. 2010)
• Ψstem (veraison+25) allows a very good discrimination between the 6 smartpoints • Dualex® was powerful to discriminate the smartpoints in the early stages (until berry
set +10) • Lower nitrogen content in the high TC smartpoint => dilution
a Flower cluster with floret separation
8
Understanding and mapping rotundone spatial variability
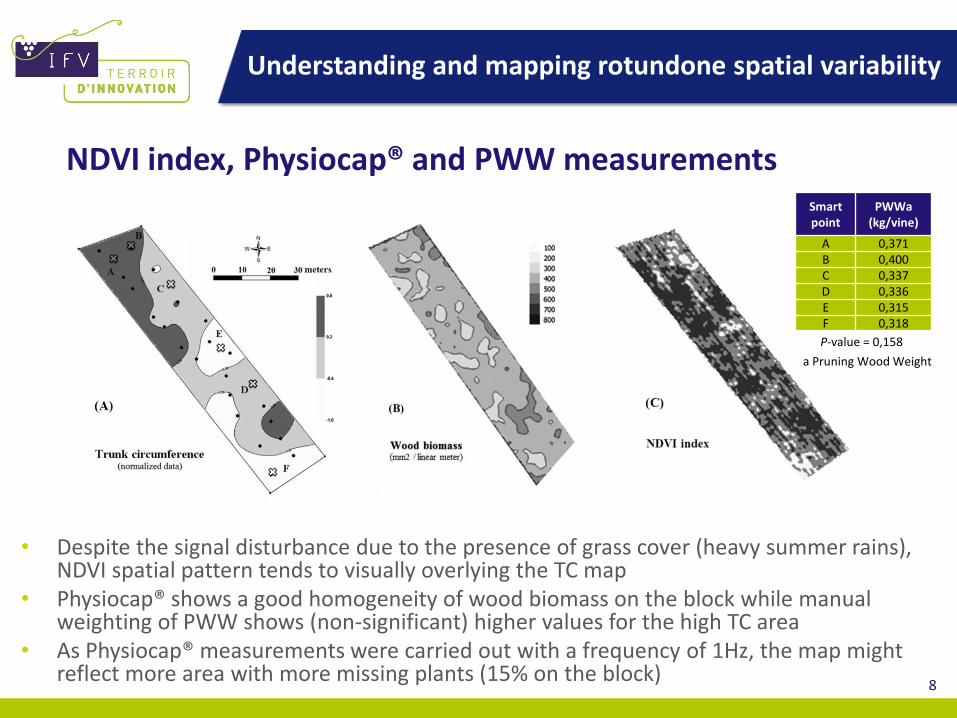
NDVI index, Physiocap® and PWW measurements
• Despite the signal disturbance due to the presence of grass cover (heavy summer rains), NDVI spatial pattern tends to visually overlying the TC map
• Physiocap® shows a good homogeneity of wood biomass on the block while manual weighting of PWW shows (non-significant) higher values for the high TC area
• As Physiocap® measurements were carried out with a frequency of 1Hz, the map might reflect more area with more missing plants (15% on the block)
Smart point
PWWa (kg/vine)
A 0,371 B 0,400 C 0,337 D 0,336 E 0,315 F 0,318
P-value = 0,158
a Pruning Wood Weight
9
Understanding and mapping rotundone spatial variability
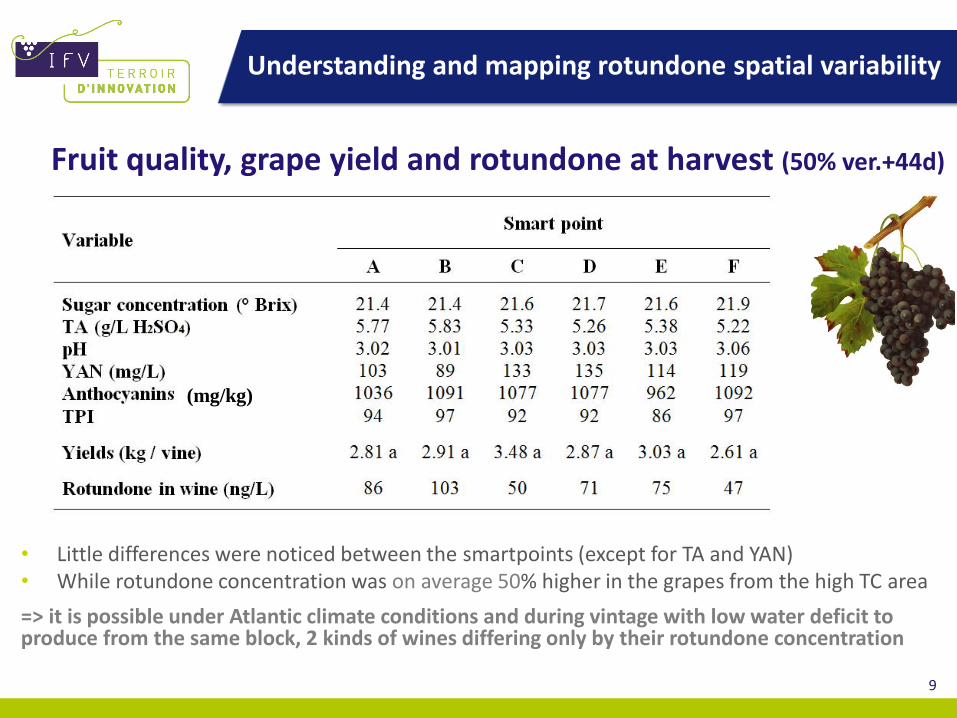
Fruit quality, grape yield and rotundone at harvest (50% ver.+44d)
• Little differences were noticed between the smartpoints (except for TA and YAN) • While rotundone concentration was on average 50% higher in the grapes from the high TC area
=> it is possible under Atlantic climate conditions and during vintage with low water deficit to produce from the same block, 2 kinds of wines differing only by their rotundone concentration
(mg/kg)

10
Understanding and mapping rotundone spatial variability
Conclusions of the study
• Our results confirm that rotundone is very sensitive to variations of water status
• and suggest that a link exists between TC and rotundone which is consistent with previous works (Scarlett et al. 2014)
• During this wet vintage, wines made from the high TC area had the same ‘quality’ (classical enological parameters) in comparison with the rest of the plot…
• but it is susceptible to differ depending on climate contexts and vintage conditions (less qualitative if moderate water deficit or more qualitative if excessive water stress)
• We set up a methodology for assessing rotundone spatial distribution and TC which is temporally stable, can be used to map rotundone spatial distribution
• The same methodology is presently implemented on a Syrah block and grapes will be harvested selectively thanks to a prototype harvesting machine

11
Understanding and mapping rotundone spatial variability
2015 trial on a Syrah block with no missing plants
Wood Biomass (Physiocap®) Trunk Circumference (TC)

12
Understanding and mapping rotundone spatial variability
Thanks for your attention and to the partners of the study
This study was carried out with financial support from FranceAgriMer
and Midi-Pyrénées region.