Embed Size (px)
Citation preview
39
Understanding and Leveraging the Impact of ResponseLatency on User Behaviour in Web Search
XIAO BAI, Yahoo ResearchIOANNIS ARAPAKIS∗, Telefonica ResearchB. BARLA CAMBAZOGLU∗, NTENTANA FREIRE, Universitat Pompeu Fabra
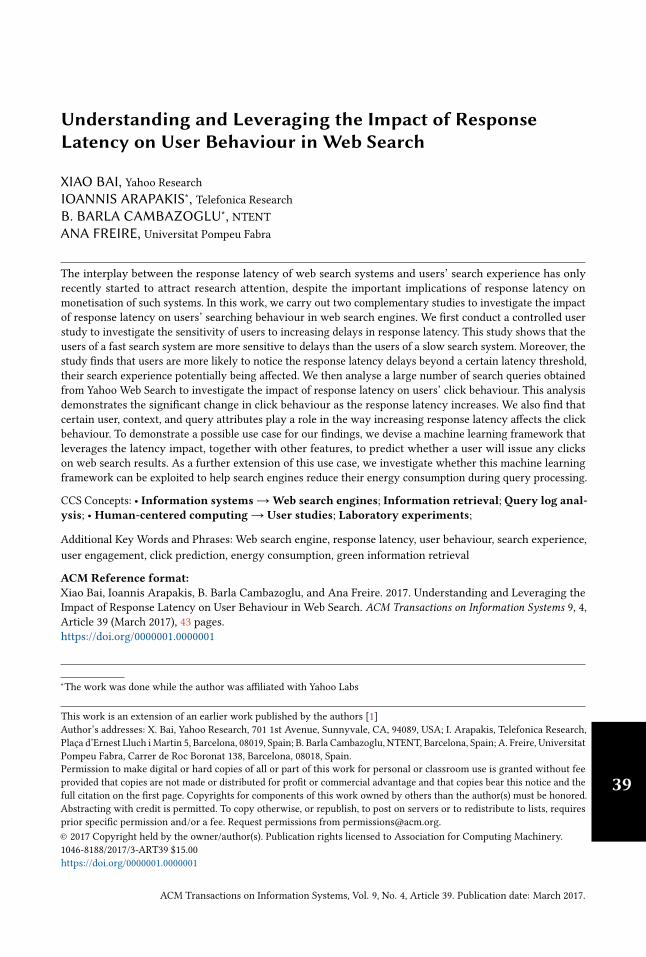
The interplay between the response latency of web search systems and users’ search experience has onlyrecently started to attract research attention, despite the important implications of response latency onmonetisation of such systems. In this work, we carry out two complementary studies to investigate the impactof response latency on users’ searching behaviour in web search engines. We first conduct a controlled userstudy to investigate the sensitivity of users to increasing delays in response latency. This study shows that theusers of a fast search system are more sensitive to delays than the users of a slow search system. Moreover, thestudy finds that users are more likely to notice the response latency delays beyond a certain latency threshold,their search experience potentially being affected. We then analyse a large number of search queries obtainedfrom Yahoo Web Search to investigate the impact of response latency on users’ click behaviour. This analysisdemonstrates the significant change in click behaviour as the response latency increases. We also find thatcertain user, context, and query attributes play a role in the way increasing response latency affects the clickbehaviour. To demonstrate a possible use case for our findings, we devise a machine learning framework thatleverages the latency impact, together with other features, to predict whether a user will issue any clickson web search results. As a further extension of this use case, we investigate whether this machine learningframework can be exploited to help search engines reduce their energy consumption during query processing.
CCS Concepts: • Information systems→Web search engines; Information retrieval; Query log anal-ysis; • Human-centered computing→ User studies; Laboratory experiments;
Additional Key Words and Phrases: Web search engine, response latency, user behaviour, search experience,user engagement, click prediction, energy consumption, green information retrieval
ACM Reference format:Xiao Bai, Ioannis Arapakis, B. Barla Cambazoglu, and Ana Freire. 2017. Understanding and Leveraging theImpact of Response Latency on User Behaviour in Web Search. ACM Transactions on Information Systems 9, 4,Article 39 (March 2017), 43 pages.https://doi.org/0000001.0000001
∗The work was done while the author was affiliated with Yahoo Labs
This work is an extension of an earlier work published by the authors [1]Author’s addresses: X. Bai, Yahoo Research, 701 1st Avenue, Sunnyvale, CA, 94089, USA; I. Arapakis, Telefonica Research,Plaça d’Ernest Lluch i Martin 5, Barcelona, 08019, Spain; B. Barla Cambazoglu, NTENT, Barcelona, Spain; A. Freire, UniversitatPompeu Fabra, Carrer de Roc Boronat 138, Barcelona, 08018, Spain.Permission to make digital or hard copies of all or part of this work for personal or classroom use is granted without feeprovided that copies are not made or distributed for profit or commercial advantage and that copies bear this notice and thefull citation on the first page. Copyrights for components of this work owned by others than the author(s) must be honored.Abstracting with credit is permitted. To copy otherwise, or republish, to post on servers or to redistribute to lists, requiresprior specific permission and/or a fee. Request permissions from [email protected].© 2017 Copyright held by the owner/author(s). Publication rights licensed to Association for Computing Machinery.1046-8188/2017/3-ART39 $15.00https://doi.org/0000001.0000001
ACM Transactions on Information Systems, Vol. 9, No. 4, Article 39. Publication date: March 2017.
39:2 X. Bai et al.
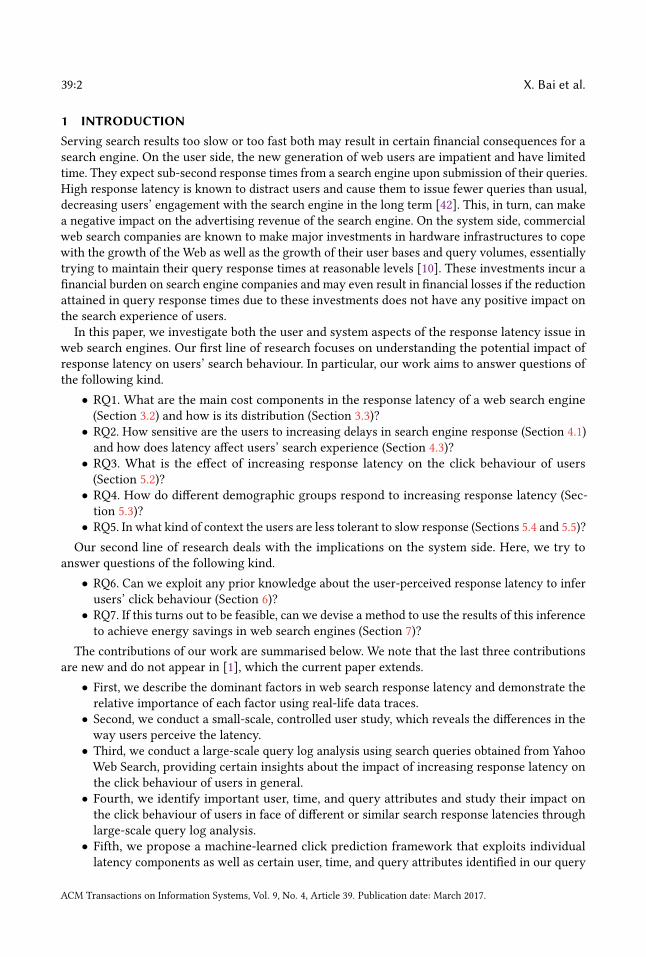
1 INTRODUCTIONServing search results too slow or too fast both may result in certain financial consequences for asearch engine. On the user side, the new generation of web users are impatient and have limitedtime. They expect sub-second response times from a search engine upon submission of their queries.High response latency is known to distract users and cause them to issue fewer queries than usual,decreasing users’ engagement with the search engine in the long term [42]. This, in turn, can makea negative impact on the advertising revenue of the search engine. On the system side, commercialweb search companies are known to make major investments in hardware infrastructures to copewith the growth of the Web as well as the growth of their user bases and query volumes, essentiallytrying to maintain their query response times at reasonable levels [10]. These investments incur afinancial burden on search engine companies and may even result in financial losses if the reductionattained in query response times due to these investments does not have any positive impact onthe search experience of users.In this paper, we investigate both the user and system aspects of the response latency issue in
web search engines. Our first line of research focuses on understanding the potential impact ofresponse latency on users’ search behaviour. In particular, our work aims to answer questions ofthe following kind.• RQ1. What are the main cost components in the response latency of a web search engine(Section 3.2) and how is its distribution (Section 3.3)?• RQ2. How sensitive are the users to increasing delays in search engine response (Section 4.1)and how does latency affect users’ search experience (Section 4.3)?• RQ3. What is the effect of increasing response latency on the click behaviour of users(Section 5.2)?• RQ4. How do different demographic groups respond to increasing response latency (Sec-tion 5.3)?• RQ5. In what kind of context the users are less tolerant to slow response (Sections 5.4 and 5.5)?
Our second line of research deals with the implications on the system side. Here, we try toanswer questions of the following kind.• RQ6. Can we exploit any prior knowledge about the user-perceived response latency to inferusers’ click behaviour (Section 6)?• RQ7. If this turns out to be feasible, can we devise a method to use the results of this inferenceto achieve energy savings in web search engines (Section 7)?
The contributions of our work are summarised below. We note that the last three contributionsare new and do not appear in [1], which the current paper extends.• First, we describe the dominant factors in web search response latency and demonstrate therelative importance of each factor using real-life data traces.• Second, we conduct a small-scale, controlled user study, which reveals the differences in theway users perceive the latency.• Third, we conduct a large-scale query log analysis using search queries obtained from YahooWeb Search, providing certain insights about the impact of increasing response latency onthe click behaviour of users in general.• Fourth, we identify important user, time, and query attributes and study their impact onthe click behaviour of users in face of different or similar search response latencies throughlarge-scale query log analysis.• Fifth, we propose a machine-learned click prediction framework that exploits individuallatency components as well as certain user, time, and query attributes identified in our query
ACM Transactions on Information Systems, Vol. 9, No. 4, Article 39. Publication date: March 2017.
Understanding and Leveraging the Impact of Response Latency on User Behaviour in Web Search39:3
log analysis as features. We demonstrate that we can anticipate with reasonable accuracywhether a user will issue any click on web search results or not using these features.• Sixth, we present a technique that uses the proposed click prediction framework to reducethe energy consumption of web search engines through early termination of the processingof queries that are predicted to not receive any click in the case of high response latency.
The selected findings of our work are the following.
• Query processing and result page rendering times are the two main components in theresponse latency of a web search engine. Network latency becomes more pronounced as theend-to-end latency increases.• The users of a fast search system are more likely to notice the delays in latency than theusers of a slow search system.• As long as the delay added to a response remains under 500ms, users cannot distinguishbetween a delayed response and a regular response with no added delay. When the introduceddelay is larger than 1000ms, users are very likely to notice the presence of a delay.• Given two content-wise identical search result pages, users are more likely to perform clickson the result page that is served with lower latency.• The degree to which response latency affects click behaviour varies according to user at-tributes. For example, females and elders can tolerate high latency better.• It is possible to accurately predict whether a user will issue any click on web search results ornot, relying on simple features extracted from the response latency, user, query, and context.• Terminating query processing, based on the predicted click likelihood at increasing latencyintervals, can lead to reduction in energy consumption of search engines.
The rest of the paper is organised as follows. We survey the related work in Section 2. InSection 3, we provide some initial experiments aiming to characterise the response latency of aweb search engine. The details and findings of our controlled user study are presented in Section 4.In Section 5, we present our large-scale query log analysis. In Section 6, we present a machinelearning framework to predict whether a user will issue any click on a search engine result pageby exploiting a subset of the features investigated in Section 5. In Section 7, we investigate thefeasibility of using this machine learning framework to reduce the energy consumption of a websearch engine. The paper is concluded in Section 8.
2 RELATEDWORK2.1 Cost of SearchingA related line of research has investigated the trade-off between the cost of searching and usereffectiveness in interactive information retrieval. In [43], the querying cost was represented by thephysical or mental effort spent by the users when searching for certain information in a retrievalsystem. In [2], the microeconomic theory was applied to interactive information retrieval, andit was shown that useful information obtained by a user during a search session is functionallyrelated to the effort spent by issuing queries and examining retrieved results. In [3], the authorsconducted a user study where participants were split into three groups to use different searchinterfaces, each requiring a different amount of physical and mental effort for issuing queries.Although most results reported by the study were not statistically significant, the authors observedthat the participants who used the search interface with high querying cost submitted fewer queries,examined more result documents per query, and spent more time on search result pages. In [35],the authors verified the validity of five different hypotheses (taken from information foraging andsearch economic theories) about how users’ search behaviour should change when faced with
ACM Transactions on Information Systems, Vol. 9, No. 4, Article 39. Publication date: March 2017.
39:4 X. Bai et al.
delays. The study involved 48 participants who interacted with four different search interfaces withdifferent types of delays (no delay, only query response delay, only document download delay, andboth query response and document download delays). The study found strong support for the threeof the hypotheses. In [6], the authors simulated interactive search sessions assuming a desktop PCscenario, where querying effort is low, and a smart phone scenario, which requires high queryingeffort. They showed that the user effort spent on searching, when coupled with a time constrainton the session duration, affected the user experience in both scenarios. In particular, they foundthat the smart phone scenario led to deeper result scanning while the desktop PC scenario favouredbetter queries.
2.2 MetricsCertain effectiveness metrics, such as DCG [28] and RBP [38], incorporated the user effort implicitlyby decaying the information gain with increasing rank (assuming users scan search results fromtop to bottom and spend a fixed amount of effort when examining each result). The time-basedgain measure in [44] incorporated the user effort more explicitly by using the time spent scanningthe results.
2.3 Page Load TimeThere are a number of studies on the response time of general computer systems in the contextof human-computer interaction. The reader may refer to [15] for a discussion of those studies. Inthe more specific context of web systems, earlier studies investigated the impact of page load timeon the web browsing behaviour of users [16–18, 21, 26, 39, 41, 45]. The study in [45] (follow-upwork to [18]) reported web page load time tolerable by users who are seeking information in theWeb to be in the 7 to 11 seconds range. The same study showed that there is a latency thresholdat which users start examining the content of web pages more thoroughly before navigating tonew pages. Although the context is different, this finding is consistent with the cost-interactionhypothesis, which states that users examine search results in more depth before issuing querieswhen the querying effort is high [3]. Despite being outdated, [39] provides extensive references tostudies on identifying the largest page load time that users can tolerate.
2.4 Query Response LatencyIn [42], the authors exposed a commercial search engine’s users to response time delays of varyingmagnitude and observed the impact of different levels of delay on users’ long-term search behaviour.They observed that the users who were exposed to higher time delays issued fewer queries thanthey usually do. Interestingly, the effects were shown to be persistent in the long-term even after theresponse latency had returned to the original levels. Our work differs from [42] in two ways. First,our user study allows us to introduce artificial response time delays on the client side, whereas [42]relies on server-side delays. This lets us work with more realistic (user-perceived) latency valuesand provides better control on certain parameters. Second, in our query log analysis, we focuson the short-term click behaviour of individual users, instead of the change in aggregate queryvolumes, which is the main metric in [42].
The most relevant work to ours is the user study presented in [8], although it differs significantlywith respect to the adopted methodology. In [8], the participants interacted with two simpleinterfaces serving search results at controlled latency values, and stated their preferences betweena slow and a fast search interface through a questionnaire. The findings of the study regardingthe impact of latency on users’ preferences were mainly inconclusive. In our user study, insteadof assigning participants into two fixed latency buckets, we expose each participant to multiple
ACM Transactions on Information Systems, Vol. 9, No. 4, Article 39. Publication date: March 2017.
Understanding and Leveraging the Impact of Response Latency on User Behaviour in Web Search39:5
levels of latency, allowing us to investigate the way they perceive the latency better. Moreover, weexperiment with much lower latency levels, which are more realistic for today’s web standards(our latency values range between 0 and 2750ms with an increment of 250ms, whereas the latencyvalues used in [8] range between 1 and 5 seconds with an increment of 1 second).
In [5], the authors conducted a controlled user study to reveal the physiological effects of responselatency on users. The reported results indicate that the latency effects are present even at smallincreases in response latency. They complemented their user study by a query log analysis similarto ours. The user studies conducted in our work differ from those in [5] in that our work focuses onthe perceivable effects of increasing response latency, while the latter work investigatesunconsciouslatency effects that may still effect user behaviour.Last, the authors in [46] performed a query log analysis on the impact of increasing response
latency on user engagement. Their analysis indicated that, with increasing response latency, thelikelihood that the user will click on the search results decreased. Moreover, the authors observedan increase in the time the users issue the first click on the search result page as the responselatency increases. Both findings point out the negative consequences of slow response on userengagement.
2.5 Latency PredictionIn [25], techniques are proposed to improve the response latency of a web search engine. Thestudy focused on the reduction of tail latency by leveraging features collected at run time (dynamicprediction), enabling estimation of query execution time with higher accuracy. Using both multicoreand heterogeneous processors, authors showed how this dynamic prediction can improve theperformance of a search engine. In our scenario, we cannot exploit such run-time features sinceour experiments are based on simulations. Earlier works on latency prediction in the context ofweb search engines include [34], [29], and [31].
2.6 Click PredictionClick prediction has a number of applications. One notable example is the domain of online adver-tising, which in the past years has attracted the attention of major companies such as Google [37],Facebook [24], and Yahoo [13]. In the context of web search, click information has been widelyused in machine-learned ranking strategies to improve the search result quality and promote betteruser experience [27].
2.7 Energy Consumption of Search Data CentresWhile several efforts have been made so far to reduce the power consumption of general-purposedata centres, few of them are actually focused on proposing efficiency improvements and designingmore sustainable web search engines [14]. Previous research has addressed power consumption withrespect to different web search architectures, such as geographically distributed data centres [30],replicated search engines [19, 20], and single servers [11]. Some of the above approaches leveragethe fluctuation in query traffic along the day; others combine workload with electricity rates totake the most suitable decision. However, to the best of our knowledge, our work is the first to useclick prediction as a way to reduce the energy consumption of web search engines.
2.8 Extensions to the Previous VersionOur paper extends an earlier work published as a conference paper [1]. The extensions over theprevious paper are three-fold. First, we analyse the interplay between search response latency anddifferent attributes, such as gender, age, level of search activity, time of the day, query length, query
ACM Transactions on Information Systems, Vol. 9, No. 4, Article 39. Publication date: March 2017.
39:6 X. Bai et al.
User Searchfrontend
Searchbackend
tpre tproc
tpost
tfb
tbf
tuf
tfu
trender
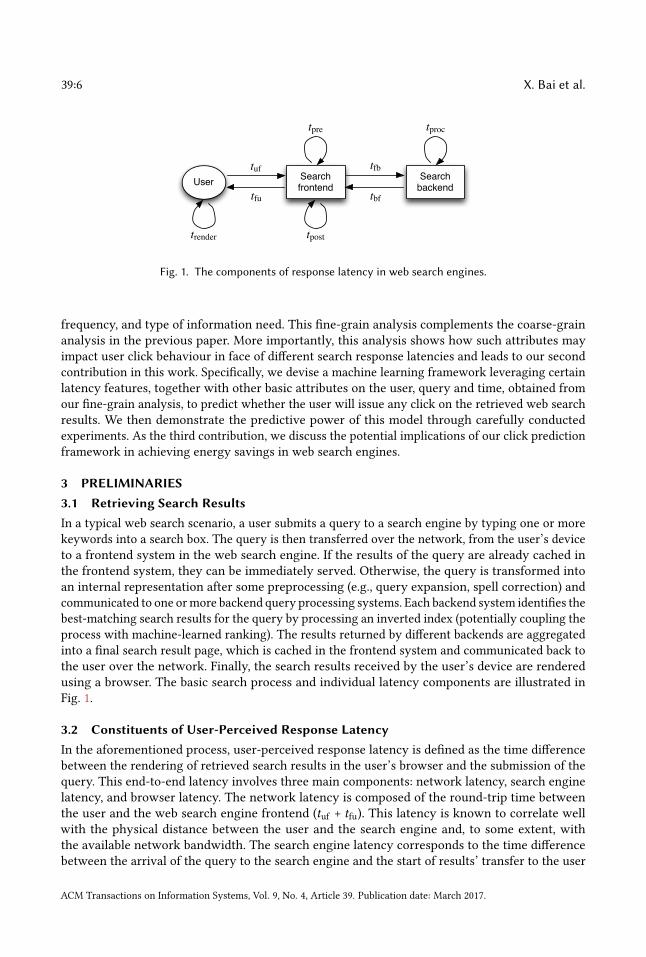
Fig. 1. The components of response latency in web search engines.
frequency, and type of information need. This fine-grain analysis complements the coarse-grainanalysis in the previous paper. More importantly, this analysis shows how such attributes mayimpact user click behaviour in face of different search response latencies and leads to our secondcontribution in this work. Specifically, we devise a machine learning framework leveraging certainlatency features, together with other basic attributes on the user, query and time, obtained fromour fine-grain analysis, to predict whether the user will issue any click on the retrieved web searchresults. We then demonstrate the predictive power of this model through carefully conductedexperiments. As the third contribution, we discuss the potential implications of our click predictionframework in achieving energy savings in web search engines.
3 PRELIMINARIES3.1 Retrieving Search ResultsIn a typical web search scenario, a user submits a query to a search engine by typing one or morekeywords into a search box. The query is then transferred over the network, from the user’s deviceto a frontend system in the web search engine. If the results of the query are already cached inthe frontend system, they can be immediately served. Otherwise, the query is transformed intoan internal representation after some preprocessing (e.g., query expansion, spell correction) andcommunicated to one ormore backend query processing systems. Each backend system identifies thebest-matching search results for the query by processing an inverted index (potentially coupling theprocess with machine-learned ranking). The results returned by different backends are aggregatedinto a final search result page, which is cached in the frontend system and communicated back tothe user over the network. Finally, the search results received by the user’s device are renderedusing a browser. The basic search process and individual latency components are illustrated inFig. 1.
3.2 Constituents of User-Perceived Response LatencyIn the aforementioned process, user-perceived response latency is defined as the time differencebetween the rendering of retrieved search results in the user’s browser and the submission of thequery. This end-to-end latency involves three main components: network latency, search enginelatency, and browser latency. The network latency is composed of the round-trip time betweenthe user and the web search engine frontend (tuf + tfu). This latency is known to correlate wellwith the physical distance between the user and the search engine and, to some extent, withthe available network bandwidth. The search engine latency corresponds to the time differencebetween the arrival of the query to the search engine and the start of results’ transfer to the user
ACM Transactions on Information Systems, Vol. 9, No. 4, Article 39. Publication date: March 2017.
Understanding and Leveraging the Impact of Response Latency on User Behaviour in Web Search39:7
0
0.005
0.010
0.015
0.020
0.025
0.030
0.035
0.040
0.4 0.6 0.8 1.0 1.2 1.4 1.6 1.8 2.0 2.2 2.40
0.2
0.4
0.6
0.8
1.0
Frac
tion
of q
uerie
s
Cum
ulat
ive
fract
ion
of q
uerie
s
Latency (normalized by the mean)
(a) Distribution of latency.
0
20
40
60
80
100
0.4 0.6 0.8 1.0 1.2 1.4 1.6 1.8 2.0 2.2 2.4
Con
tribu
tion
per c
ompo
nent
(%)
Latency (normalized by the mean)
search engine latencynetwork latencybrowser latency
(b) Dissection of latency.
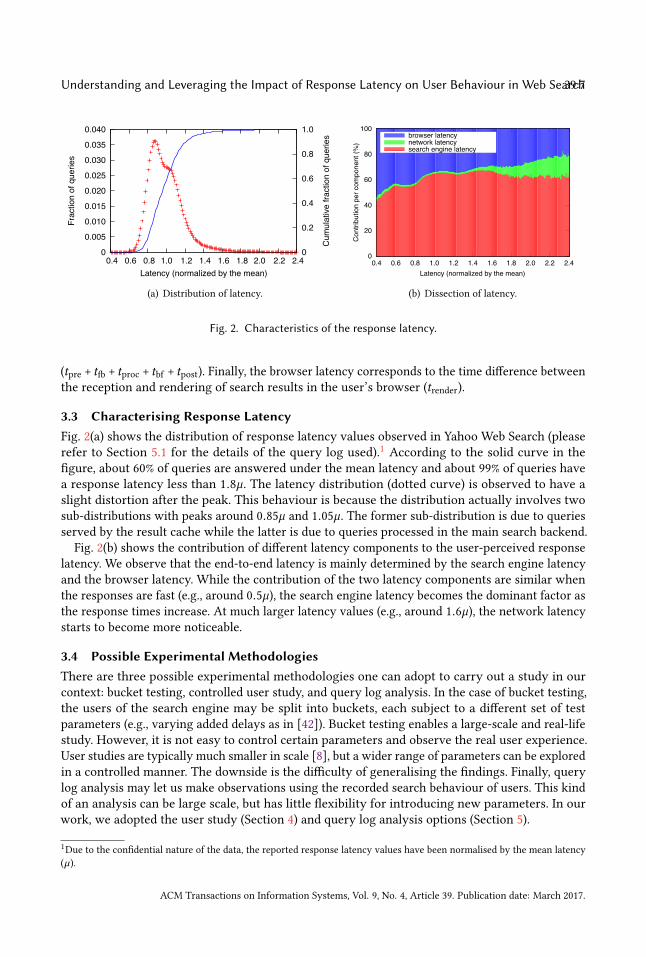
Fig. 2. Characteristics of the response latency.
(tpre + tfb + tproc + tbf + tpost). Finally, the browser latency corresponds to the time difference betweenthe reception and rendering of search results in the user’s browser (trender).
3.3 Characterising Response LatencyFig. 2(a) shows the distribution of response latency values observed in Yahoo Web Search (pleaserefer to Section 5.1 for the details of the query log used).1 According to the solid curve in thefigure, about 60% of queries are answered under the mean latency and about 99% of queries havea response latency less than 1.8µ. The latency distribution (dotted curve) is observed to have aslight distortion after the peak. This behaviour is because the distribution actually involves twosub-distributions with peaks around 0.85µ and 1.05µ. The former sub-distribution is due to queriesserved by the result cache while the latter is due to queries processed in the main search backend.
Fig. 2(b) shows the contribution of different latency components to the user-perceived responselatency. We observe that the end-to-end latency is mainly determined by the search engine latencyand the browser latency. While the contribution of the two latency components are similar whenthe responses are fast (e.g., around 0.5µ), the search engine latency becomes the dominant factor asthe response times increase. At much larger latency values (e.g., around 1.6µ), the network latencystarts to become more noticeable.
3.4 Possible Experimental MethodologiesThere are three possible experimental methodologies one can adopt to carry out a study in ourcontext: bucket testing, controlled user study, and query log analysis. In the case of bucket testing,the users of the search engine may be split into buckets, each subject to a different set of testparameters (e.g., varying added delays as in [42]). Bucket testing enables a large-scale and real-lifestudy. However, it is not easy to control certain parameters and observe the real user experience.User studies are typically much smaller in scale [8], but a wider range of parameters can be exploredin a controlled manner. The downside is the difficulty of generalising the findings. Finally, querylog analysis may let us make observations using the recorded search behaviour of users. This kindof an analysis can be large scale, but has little flexibility for introducing new parameters. In ourwork, we adopted the user study (Section 4) and query log analysis options (Section 5).
1Due to the confidential nature of the data, the reported response latency values have been normalised by the mean latency(µ ).
ACM Transactions on Information Systems, Vol. 9, No. 4, Article 39. Publication date: March 2017.
39:8 X. Bai et al.
4 CONTROLLED USER STUDYTo demonstrate the impact of response latency on search behaviour we carried out two controlledexperiments that examine users’ interactions with two different search sites. The first experimentinvestigates users’ sensitivity to different levels of latency, as well as their perception of responsetime. The second experiment demonstrates the effects of increasing response latency on the searchexperience and, more specifically, on user engagement and satisfaction. In addition, we looked atpotential bias due to search site branding.
4.1 User Sensitivity to Latency4.1.1 Experimental Design. The experiment consisted of two types of tasks and used a repeated-
measures design with three independent variables: adjusted latency (with 8 levels in milliseconds:“0”, “250”, “500”, “750”, “1000”, “1250”, “1500”, “1750”), fixed latency (with 10 levels in milliseconds:“500”, “750”, “1000”, “1250”, “1500”, “1750”, “2000”, “2250”, “2500”, “2750”), and search site speed (withtwo levels: “slow”, “fast”).
The adjusted latency was controlled through a client-side script that adjusted the search latencyexperienced by the participants by a desired amount of delay. The fixed latency was controlled in asimilar manner, by fixing the search latency experienced by the participants to a desired amountof delay. The two types of latencies differ with respect the following aspects: (1) how the finalsearch latency is set (by adding to the base latency a fixed amount or by adding to the base latencya variable amount to fix it to a value) and (2) their range of values. The combined sets of latencyranges of the adjusted latency and fixed latency is a set with 12 values (“0”, “250”, “500”, “750”, “1000”,“1250”, “1500”, “1750”, “2000”, “2250”, “2500”, “2750”).
The search site speed was controlled by completing the study using two different commercialsearch sites: one with a generally slow response rate (slow SE) and one with a generally fastresponse rate (fast SE). The participants were aware that they were using two different searchengines. When comparing the two commercial search engines, the main difference lies in theobserved response rate while some minor differences can be noticed in the “look and feel” of theuser interface. Finally, although the two search sites were different, the returned search resultswere very similar due to the nature of the queries used (see Section 4.1.5). The dependent variableswere (i) sensitivity to search latency and (ii) prediction accuracy of search latency.
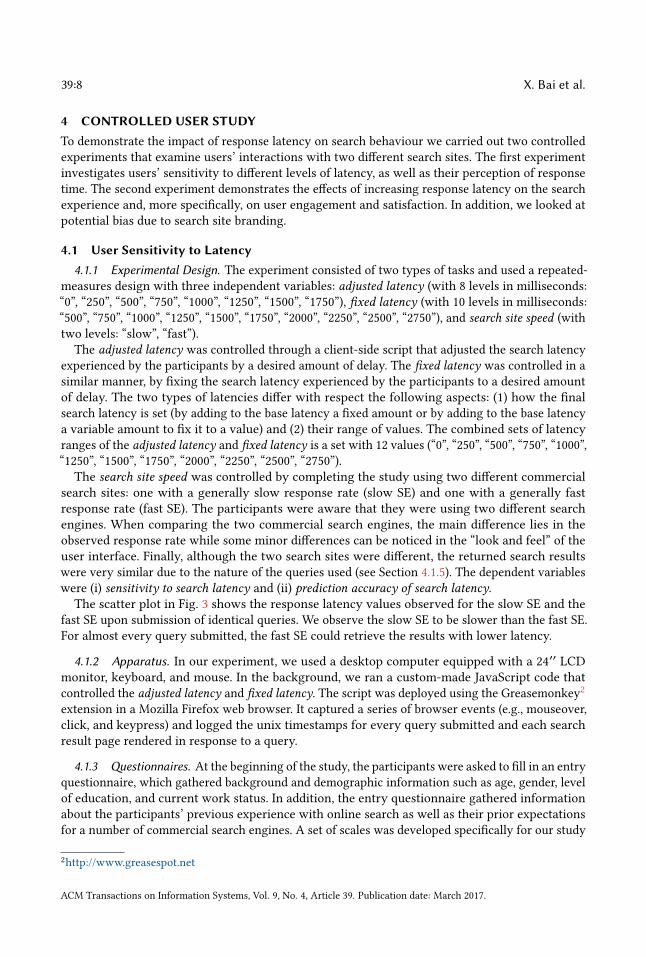
The scatter plot in Fig. 3 shows the response latency values observed for the slow SE and thefast SE upon submission of identical queries. We observe the slow SE to be slower than the fast SE.For almost every query submitted, the fast SE could retrieve the results with lower latency.
4.1.2 Apparatus. In our experiment, we used a desktop computer equipped with a 24′′ LCDmonitor, keyboard, and mouse. In the background, we ran a custom-made JavaScript code thatcontrolled the adjusted latency and fixed latency. The script was deployed using the Greasemonkey2extension in a Mozilla Firefox web browser. It captured a series of browser events (e.g., mouseover,click, and keypress) and logged the unix timestamps for every query submitted and each searchresult page rendered in response to a query.
4.1.3 Questionnaires. At the beginning of the study, the participants were asked to fill in an entryquestionnaire, which gathered background and demographic information such as age, gender, levelof education, and current work status. In addition, the entry questionnaire gathered informationabout the participants’ previous experience with online search as well as their prior expectationsfor a number of commercial search engines. A set of scales was developed specifically for our study
2http://www.greasespot.net
ACM Transactions on Information Systems, Vol. 9, No. 4, Article 39. Publication date: March 2017.
Understanding and Leveraging the Impact of Response Latency on User Behaviour in Web Search39:9
0 250 500 750 1000 1250 1500 1750 2000 2250 2500 2750 3000Response latency of the fast SE (ms)
0
250
500
750
1000
1250
1500
1750
2000
2250
2500
2750
3000
Res
pons
e la
tenc
y of
the
slow
SE
(ms)
User queries
Fig. 3. Response latency values attained by the fast and slow SEs for the same query.
(e.g., easy/difficult, relaxing/stressful, and satisfying/frustrating) based on users’ response to thestatement “Using a search site is generally . . . ”.
4.1.4 Participants. There were 12 participants (female=6, male=6) aged from 24 to 41. Theparticipants were of mixed nationality, came from a variety of educational backgrounds (41.6% hadan MSc degree and 58.3% had a PhD degree), and were all proficient with the English language(8% intermediate level, 75% advanced level, 17% native speakers). They were primarily pursuingfurther studies while working (54.3%) although there were a number of students (33.3%) and full-time employees (16.6%). Participants reported using a search site at home or work very often(M = 6.58, SE = .79) and that they find online searching a very easy (M = 6.00, SE = 1.53) andsatisfying (M = 5.50, SE = 1.16) task.
4.1.5 Procedure. The user study was carried out in a laboratory setting and followed a think-aloud protocol. At the beginning of their session, the participants were informed about the con-ditions of the experiment and were asked to complete a demographics questionnaire. Then, theywere asked to perform two types of tasks using both search engines (slow SE and fast SE). The goalwas the same for both types of tasks: submitting a fixed number of randomly selected navigationalqueries, i.e., queries that seek a single website or web page of a single entity. The web domain listwas created using the web analytics provided by Alexa.3
Throughout the study, participants were presented with two web browser windows: the firstwindow displayed the search site while the second window displayed the questionnaire. For eachnavigational query, participants were instructed to locate the associated URL among the first tenresults of the search result page and copy-paste it in the corresponding box of the questionnaire.We limited the study to navigational queries because they impose a smaller cognitive load to thesearcher (compared to other types of queries), promote a convergence in the search intent across allusers, and do not require native-level knowledge of the English language. Therefore, by mitigatingthe effort of query formulation, our participants were able to assess the latency effect better. Notime limit was imposed on any of the tasks.
The first type of task asked the participants to verbally report to the experimenter their subjectiveimpression of the search site’s response latency, i.e., whether they felt that the response was “slow”
3http://www.alexa.com/topsites
ACM Transactions on Information Systems, Vol. 9, No. 4, Article 39. Publication date: March 2017.
39:10 X. Bai et al.
500 750 1000 1250 1500 1750 2000 2250 2500 2750 3000Actual search latency (ms)
0
250
500
750
1000
1250
1500
1750
Add
ed d
elay
(ms)
Slow SE; noted added delaySlow SE; did not note added delayFast SE; noted added delayFast SE; did not note added delay
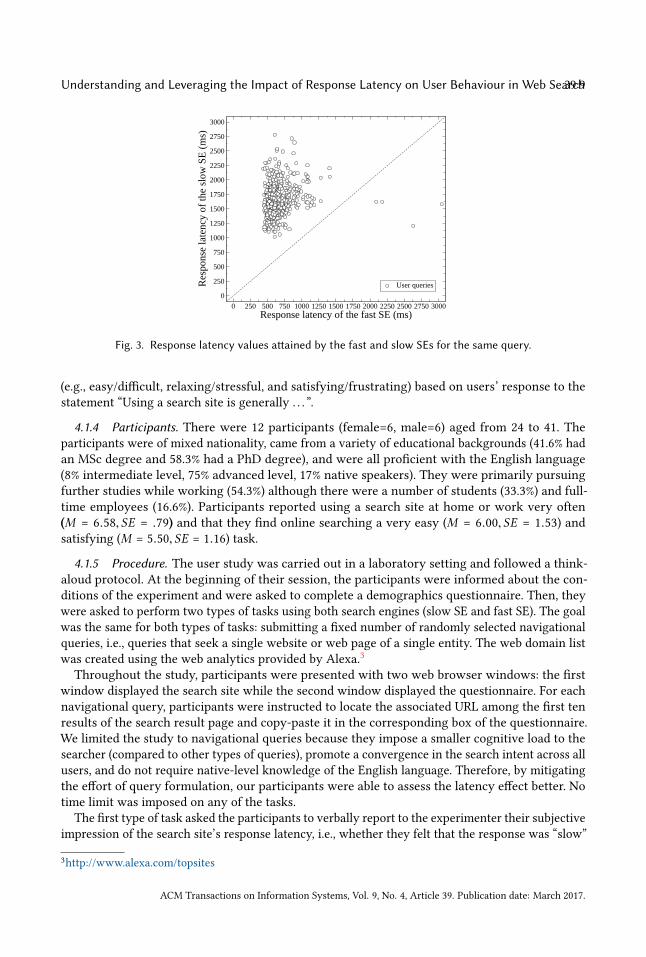
Fig. 4. Each point in the plot indicates a query for which a participant noted an added delay in the searchengine response or not as the actual latency and added delay vary.
or “normal”, after the search engine returned the results for each submitted query. In this type oftask, we manipulated the adjusted latency variable by increasing it by a fixed amount that rangedfrom 0 to 1750 ms, using a step of 250 ms. The reason for opting for this particular variable isbecause we were interested in knowing whether users can perceive added latencies and can tellif the experienced search latency deviates from the “normal” search latency. Each latency value(0 ms, 250 ms, . . . , 1750 ms) was introduced five times and in a random order, in combinationwith 40 randomly selected navigational queries (8 latency values × 5 = 40 navigational queries).The provided navigational queries were submitted to the search site the same way they would besubmitted in a realistic search scenario, i.e., through typing and clicking.The second type of task required the participants to provide an estimation of the experienced
search latency in milliseconds. More specifically, the participants were asked to report verbally tothe experimenter their subjective estimation of the search latency for each submitted query. Whenestimating search latency, participants were instructed to consider the time difference from thequery submission until the search result page was rendered. Here, we chose to manipulate the fixedlatency variable by setting it to a fixed value that ranged from 500 ms to 2750 ms, using a step of250 ms. The reason for that is because we were interested in absolute latencies and how well userswould be able to predict them. Similar to the previous task, each latency value was introduced fivetimes and in a random order, in combination with 50 navigational queries (10 latency values ×5 = 50 navigational queries). To familiarise themselves with the default behaviour of the searchsite and establish a measure of comparison, the participants were asked to submit a set of trainingqueries before each task.In total, each participant performed four tasks (2 search engines × 2 types of tasks). Finally, to
control for order effects, the task assignment was randomised.
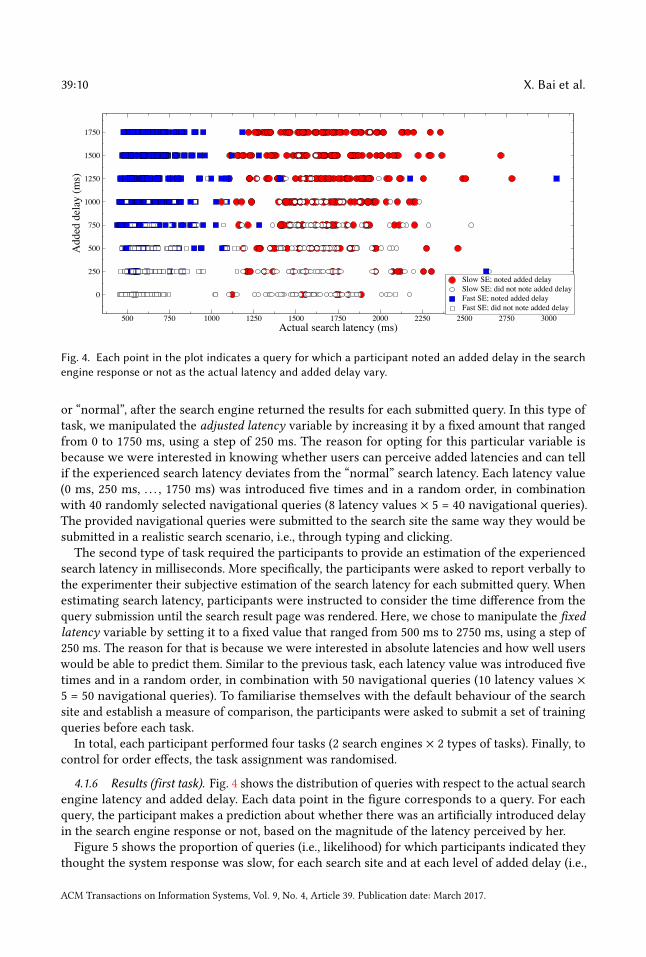
4.1.6 Results (first task). Fig. 4 shows the distribution of queries with respect to the actual searchengine latency and added delay. Each data point in the figure corresponds to a query. For eachquery, the participant makes a prediction about whether there was an artificially introduced delayin the search engine response or not, based on the magnitude of the latency perceived by her.Figure 5 shows the proportion of queries (i.e., likelihood) for which participants indicated they
thought the system response was slow, for each search site and at each level of added delay (i.e.,
ACM Transactions on Information Systems, Vol. 9, No. 4, Article 39. Publication date: March 2017.
Understanding and Leveraging the Impact of Response Latency on User Behaviour in Web Search39:11
0 250 500 750 1000 1250 1500 1750Added delay (ms)
0.0
0.1
0.2
0.3
0.4
0.5
0.6
0.7
0.8
0.9
1.0
Like
lihoo
d of
feel
ing
adde
d la
tenc
y
Slow SEFast SE
Fig. 5. Fraction of cases whereparticipants said that they no-ticed added delay in the responseof the slow and fast SEs, as theadded delay varies.
0 250 500 750 1000 1250 1500 1750Added delay (ms)
0.0
0.2
0.4
0.6
0.8
1.0
Like
lihoo
d of
feel
ing
adde
d la
tenc
yMalesFemales
Fig. 6. Fraction of cases wheremale and female participants saidthat they noticed added delay inthe response, as the added delayvaries.
0 250 500 750 1000 1250 1500 1750Added delay (ms)
0.0
0.1
0.2
0.3
0.4
0.5
0.6
0.7
0.8
0.9
1.0
Like
lihoo
d of
feel
ing
adde
d la
tenc
y
Slow SE - MalesSlow SE - FemalesFast SE - MalesFast SE - Females
Fig. 7. Fraction of cases wheremale and female participants saidthat they noticed added delay inthe response of the slow and fastSEs.
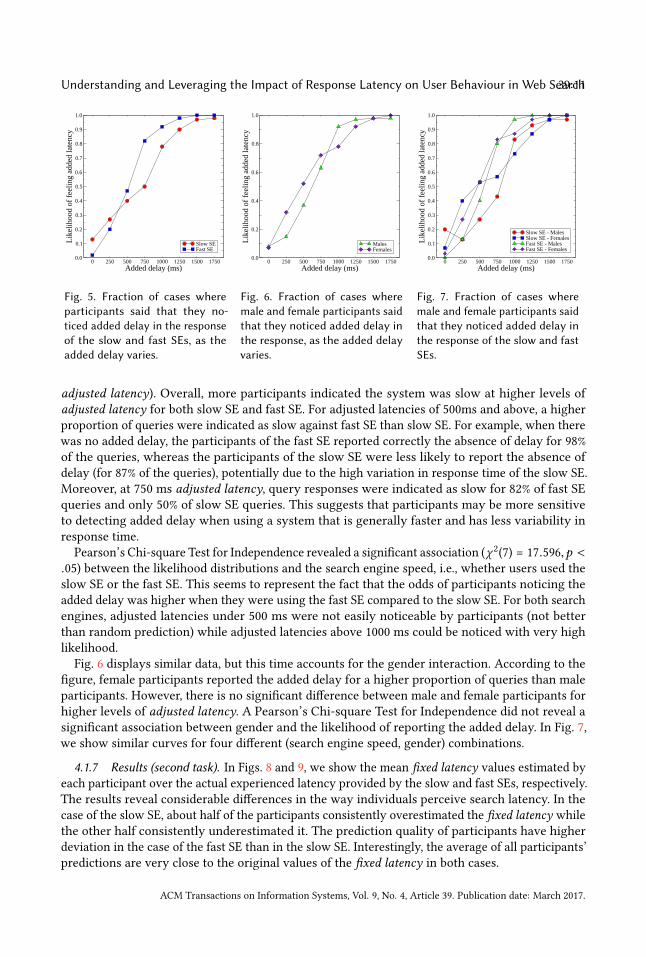
adjusted latency). Overall, more participants indicated the system was slow at higher levels ofadjusted latency for both slow SE and fast SE. For adjusted latencies of 500ms and above, a higherproportion of queries were indicated as slow against fast SE than slow SE. For example, when therewas no added delay, the participants of the fast SE reported correctly the absence of delay for 98%of the queries, whereas the participants of the slow SE were less likely to report the absence ofdelay (for 87% of the queries), potentially due to the high variation in response time of the slow SE.Moreover, at 750 ms adjusted latency, query responses were indicated as slow for 82% of fast SEqueries and only 50% of slow SE queries. This suggests that participants may be more sensitiveto detecting added delay when using a system that is generally faster and has less variability inresponse time.
Pearson’s Chi-square Test for Independence revealed a significant association (χ 2(7) = 17.596,p <.05) between the likelihood distributions and the search engine speed, i.e., whether users used theslow SE or the fast SE. This seems to represent the fact that the odds of participants noticing theadded delay was higher when they were using the fast SE compared to the slow SE. For both searchengines, adjusted latencies under 500 ms were not easily noticeable by participants (not betterthan random prediction) while adjusted latencies above 1000 ms could be noticed with very highlikelihood.Fig. 6 displays similar data, but this time accounts for the gender interaction. According to the
figure, female participants reported the added delay for a higher proportion of queries than maleparticipants. However, there is no significant difference between male and female participants forhigher levels of adjusted latency. A Pearson’s Chi-square Test for Independence did not reveal asignificant association between gender and the likelihood of reporting the added delay. In Fig. 7,we show similar curves for four different (search engine speed, gender) combinations.
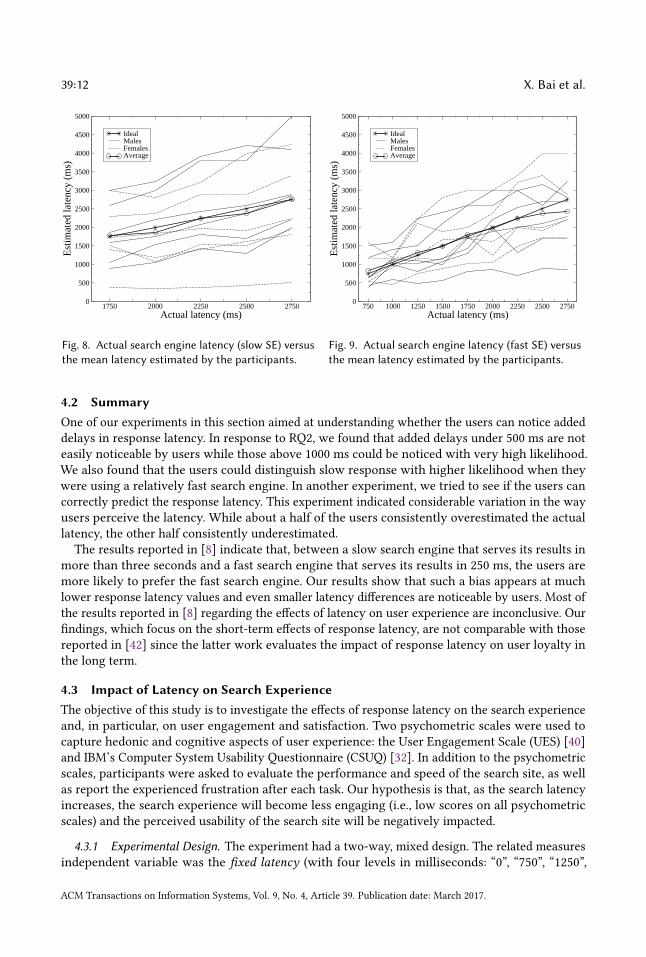
4.1.7 Results (second task). In Figs. 8 and 9, we show the mean fixed latency values estimated byeach participant over the actual experienced latency provided by the slow and fast SEs, respectively.The results reveal considerable differences in the way individuals perceive search latency. In thecase of the slow SE, about half of the participants consistently overestimated the fixed latency whilethe other half consistently underestimated it. The prediction quality of participants have higherdeviation in the case of the fast SE than in the slow SE. Interestingly, the average of all participants’predictions are very close to the original values of the fixed latency in both cases.
ACM Transactions on Information Systems, Vol. 9, No. 4, Article 39. Publication date: March 2017.
39:12 X. Bai et al.
1750 2000 2250 2500 2750Actual latency (ms)
0
500
1000
1500
2000
2500
3000
3500
4000
4500
5000
Estim
ated
late
ncy
(ms)
IdealMalesFemalesAverage
Fig. 8. Actual search engine latency (slow SE) versusthe mean latency estimated by the participants.
750 1000 1250 1500 1750 2000 2250 2500 2750Actual latency (ms)
0
500
1000
1500
2000
2500
3000
3500
4000
4500
5000
Estim
ated
late
ncy
(ms)
IdealMalesFemalesAverage
Fig. 9. Actual search engine latency (fast SE) versusthe mean latency estimated by the participants.
4.2 SummaryOne of our experiments in this section aimed at understanding whether the users can notice addeddelays in response latency. In response to RQ2, we found that added delays under 500 ms are noteasily noticeable by users while those above 1000 ms could be noticed with very high likelihood.We also found that the users could distinguish slow response with higher likelihood when theywere using a relatively fast search engine. In another experiment, we tried to see if the users cancorrectly predict the response latency. This experiment indicated considerable variation in the wayusers perceive the latency. While about a half of the users consistently overestimated the actuallatency, the other half consistently underestimated.
The results reported in [8] indicate that, between a slow search engine that serves its results inmore than three seconds and a fast search engine that serves its results in 250 ms, the users aremore likely to prefer the fast search engine. Our results show that such a bias appears at muchlower response latency values and even smaller latency differences are noticeable by users. Most ofthe results reported in [8] regarding the effects of latency on user experience are inconclusive. Ourfindings, which focus on the short-term effects of response latency, are not comparable with thosereported in [42] since the latter work evaluates the impact of response latency on user loyalty inthe long term.
4.3 Impact of Latency on Search ExperienceThe objective of this study is to investigate the effects of response latency on the search experienceand, in particular, on user engagement and satisfaction. Two psychometric scales were used tocapture hedonic and cognitive aspects of user experience: the User Engagement Scale (UES) [40]and IBM’s Computer System Usability Questionnaire (CSUQ) [32]. In addition to the psychometricscales, participants were asked to evaluate the performance and speed of the search site, as wellas report the experienced frustration after each task. Our hypothesis is that, as the search latencyincreases, the search experience will become less engaging (i.e., low scores on all psychometricscales) and the perceived usability of the search site will be negatively impacted.
4.3.1 Experimental Design. The experiment had a two-way, mixed design. The related measuresindependent variable was the fixed latency (with four levels in milliseconds: “0”, “750”, “1250”,
ACM Transactions on Information Systems, Vol. 9, No. 4, Article 39. Publication date: March 2017.
Understanding and Leveraging the Impact of Response Latency on User Behaviour in Web Search39:13
“1750”). The unrelated measures independent variable was the search site speed (with two levels:“slow”, “fast”). The dependent variables were (i) experienced positive and negative affect, (ii) levelof focused attention, (iii) perceived system usability, and (iv) subjective beliefs about search siteperformance.The fixed latency was controlled through a client-side script that adjusted the search latency
experienced by the participants to a desired amount of delay. The choice of latency values wasinformed by the findings from the first study (see Section 4.1). The search site speed was controlledby completing the study using either a commercial search site with a generally slow response rate(slow SE) or a commercial search site with a generally fast response rate (fast SE). Despite the twosearch sites coming from different brands, the returned results were almost identical due to thenature of the search queries used (see Sections 4.1.1 and 4.3.5).
We note that, in this study the search site speed was designed as an unrelated measures indepen-dent variable. This is because the participants were asked to evaluate the usability of two searchengines, for different latency settings. Therefore, by completing the task for one of the two searchengines, they would become already familiar with the evaluation questions. This awareness ofthe aspects that we wanted to evaluate would have affected the spontaneity of their responsesby introducing carryover effects, and thus the first task performed would adversely influence theany follow-up tasks. On the contrary, in the previous study (Section 4.1), the search site speed wasdesigned as a related measures independent variable. The reason for that is because we wanted totest participants’ sensitivity to latency and we could afford to expose them to two different searchengines given task’s somewhat “computational” nature of estimating latencies.
4.3.2 Apparatus. The study had the same setup as in Section 4.1.2.
4.3.3 Questionnaires. We used two types of questionnaires. The first questionnaire (entry) wasintroduced at the beginning of the study and gathered background and demographic information, aswell as information about previous experience with online search. The second questionnaire (main)was administered at post-task and included the UES [40] and CSUQ [32] scales. The questions wereall forced-choice type and appeared in a random sequence to mitigate potential bias due to theordering effect. The UES [40] is multi-dimensional; its items pertain to positive and negative affect,perceived usability of the system, as well as users’ felt involvement and focused attention duringthe task. Affect refers to the emotion mechanisms that influence our everyday interactions and canact as the primary motivation for sustaining our engagement during information processing tasksor computer-mediated activities. Focused attention refers to the feeling of energised focus and totalinvolvement, often accompanied by loss of awareness of the outside world and distortions in thesubjective perception of time.The CSUQ [32] is a multi-dimensional user satisfaction questionnaire. Out of the four items
it consists, we considered only the scores from the responses to system usefulness (SYSUSE).Taken together, the UES and CSUQ-SYSUSE probe users’ perceptions of the pragmatic and hedonicqualities of their search interactions, as well as their perceptions of the search engine and ofthemselves using a technology, all of which are considered key facets of the user experience [23].More specifically, the questionnaires inquired about the following aspects:
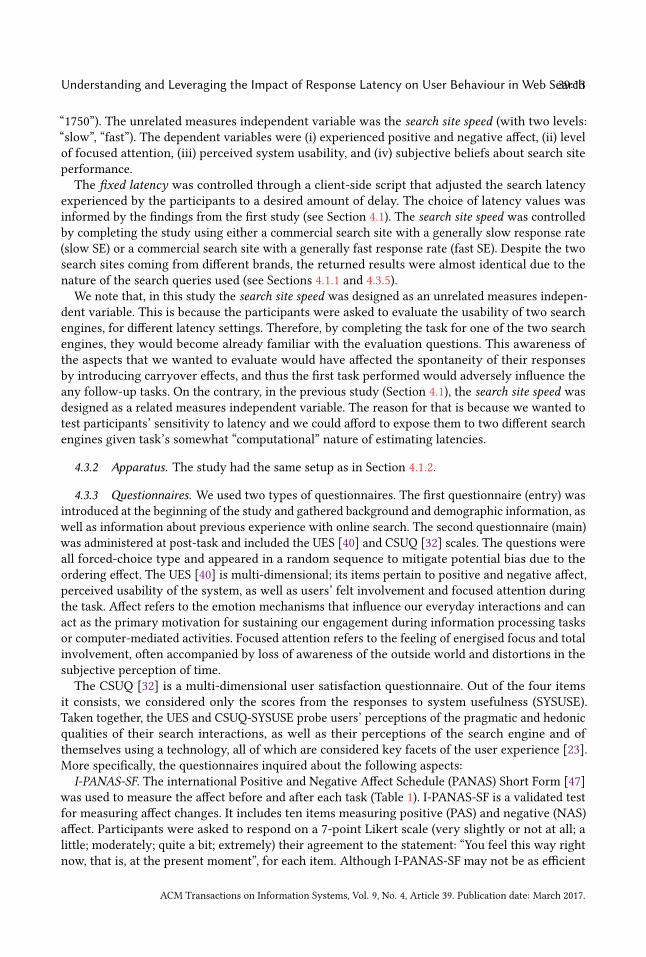
I-PANAS-SF. The international Positive and Negative Affect Schedule (PANAS) Short Form [47]was used to measure the affect before and after each task (Table 1). I-PANAS-SF is a validated testfor measuring affect changes. It includes ten items measuring positive (PAS) and negative (NAS)affect. Participants were asked to respond on a 7-point Likert scale (very slightly or not at all; alittle; moderately; quite a bit; extremely) their agreement to the statement: “You feel this way rightnow, that is, at the present moment”, for each item. Although I-PANAS-SF may not be as efficient
ACM Transactions on Information Systems, Vol. 9, No. 4, Article 39. Publication date: March 2017.
39:14 X. Bai et al.
Table 1. I-PANAS-SF [47] (1:Very slightly or not at all; ... 7:Extremely)
Question: You feel this way right now, that is, at the present moment...
Positive Affect Scale (PAS) Negative Affect Scale (NAS)
active afraidalert ashamed
attentive hostiledetermined nervousinspired upset
Table 2. FA scale [40] (1:strongly disagree; ... 7:strongly agree)
1. I forgot about my immediate surroundings while performing this search task.2. I was so involved in my search task that I ignored everything around me.3. I lost myself in this search experience.4. I was so involved in my search task that I lost track of time.5. I blocked out things around me when I was completing the search task.6. When I was performing this search task, I lost track of this world around me.7. The time I spent performing the search task just slipped away.8. I was absorbed in my search task.9. During this search task experience I let myself go.
Table 3. CSUQ-SYSUSE scale (1:strongly disagree; ... 7:strongly agree)
1. Overall, I am satisfied with how easy it is to use this search site.2. I can effectively complete my work using this search site.3. I am able to complete my work quickly using this search site.4. I am able to efficiently complete my work using this search site.5. I feel comfortable using this search site.6. I believe I became productive quickly using this search site
and accurate for capturing temporal micro-resolutions of emotional responses, there are severalexamples of studies from the domain of Library & Information Science [22, 33, 40] where PANAShas been successfully applied for measuring searchers’ affect between search tasks. Consideringthat the duration of our search tasks is comparable to those in the aforementioned studies, webelieve that our experimental approach to measuring emotion was reasonably accurate.
Focused attention. A 9-item focused attention (FA) subscale, part of the larger UES for measuringuser engagement [40], was adapted to the context of the search tasks. The FA subscale has been usedin past work [36] to evaluate users’ perceptions of time passing and their degree of awareness aboutwhat took place outside of their interaction with the given task. Given the context of our work,FA was a more meaningful dimension, at least compared to other subscales of engagement (e.g.,aesthetics, novelty) that were not relevant enough or were addressed by the other questionnairesemployed in our study (UES, CSUQ, i-PANAS-SF). To measure FA, the participants were instructedto report on a 7-point Likert scale (strongly disagree; disagree; ... agree; strongly agree) theiragreement to each item shown in Table 2.
ACM Transactions on Information Systems, Vol. 9, No. 4, Article 39. Publication date: March 2017.
Understanding and Leveraging the Impact of Response Latency on User Behaviour in Web Search39:15
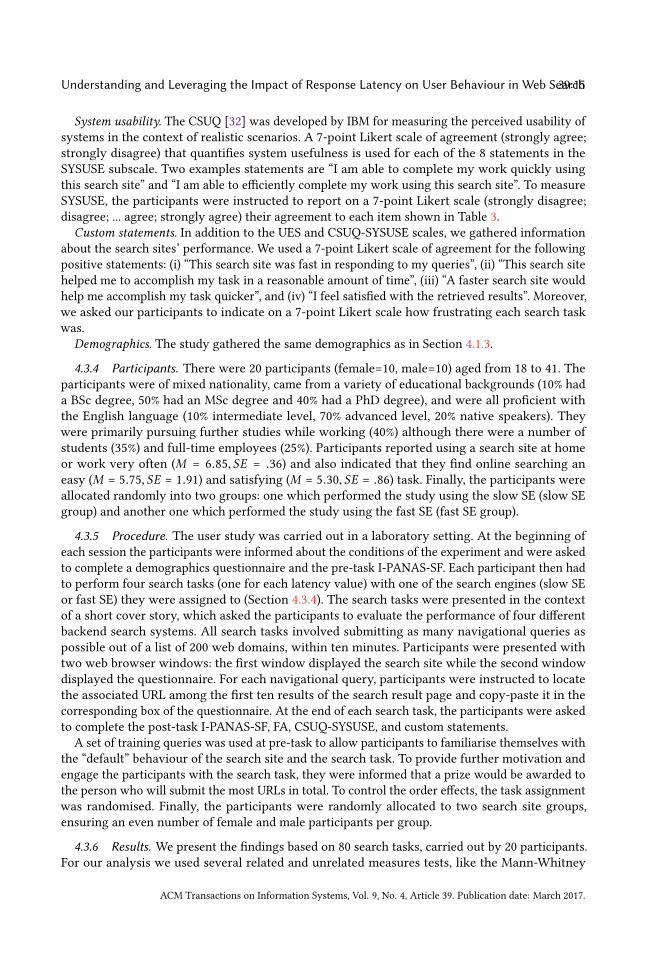
System usability. The CSUQ [32] was developed by IBM for measuring the perceived usability ofsystems in the context of realistic scenarios. A 7-point Likert scale of agreement (strongly agree;strongly disagree) that quantifies system usefulness is used for each of the 8 statements in theSYSUSE subscale. Two examples statements are “I am able to complete my work quickly usingthis search site” and “I am able to efficiently complete my work using this search site”. To measureSYSUSE, the participants were instructed to report on a 7-point Likert scale (strongly disagree;disagree; ... agree; strongly agree) their agreement to each item shown in Table 3.Custom statements. In addition to the UES and CSUQ-SYSUSE scales, we gathered information
about the search sites’ performance. We used a 7-point Likert scale of agreement for the followingpositive statements: (i) “This search site was fast in responding to my queries”, (ii) “This search sitehelped me to accomplish my task in a reasonable amount of time”, (iii) “A faster search site wouldhelp me accomplish my task quicker”, and (iv) “I feel satisfied with the retrieved results”. Moreover,we asked our participants to indicate on a 7-point Likert scale how frustrating each search taskwas.
Demographics. The study gathered the same demographics as in Section 4.1.3.
4.3.4 Participants. There were 20 participants (female=10, male=10) aged from 18 to 41. Theparticipants were of mixed nationality, came from a variety of educational backgrounds (10% hada BSc degree, 50% had an MSc degree and 40% had a PhD degree), and were all proficient withthe English language (10% intermediate level, 70% advanced level, 20% native speakers). Theywere primarily pursuing further studies while working (40%) although there were a number ofstudents (35%) and full-time employees (25%). Participants reported using a search site at homeor work very often (M = 6.85, SE = .36) and also indicated that they find online searching aneasy (M = 5.75, SE = 1.91) and satisfying (M = 5.30, SE = .86) task. Finally, the participants wereallocated randomly into two groups: one which performed the study using the slow SE (slow SEgroup) and another one which performed the study using the fast SE (fast SE group).
4.3.5 Procedure. The user study was carried out in a laboratory setting. At the beginning ofeach session the participants were informed about the conditions of the experiment and were askedto complete a demographics questionnaire and the pre-task I-PANAS-SF. Each participant then hadto perform four search tasks (one for each latency value) with one of the search engines (slow SEor fast SE) they were assigned to (Section 4.3.4). The search tasks were presented in the contextof a short cover story, which asked the participants to evaluate the performance of four differentbackend search systems. All search tasks involved submitting as many navigational queries aspossible out of a list of 200 web domains, within ten minutes. Participants were presented withtwo web browser windows: the first window displayed the search site while the second windowdisplayed the questionnaire. For each navigational query, participants were instructed to locatethe associated URL among the first ten results of the search result page and copy-paste it in thecorresponding box of the questionnaire. At the end of each search task, the participants were askedto complete the post-task I-PANAS-SF, FA, CSUQ-SYSUSE, and custom statements.
A set of training queries was used at pre-task to allow participants to familiarise themselves withthe “default” behaviour of the search site and the search task. To provide further motivation andengage the participants with the search task, they were informed that a prize would be awarded tothe person who will submit the most URLs in total. To control the order effects, the task assignmentwas randomised. Finally, the participants were randomly allocated to two search site groups,ensuring an even number of female and male participants per group.
4.3.6 Results. We present the findings based on 80 search tasks, carried out by 20 participants.For our analysis we used several related and unrelated measures tests, like the Mann-Whitney
ACM Transactions on Information Systems, Vol. 9, No. 4, Article 39. Publication date: March 2017.
39:16 X. Bai et al.
Table 4. Descriptive statistics (Median, SD) for reported I-PANAS-SF, FA, and CSUQ-SYSUSE scales (thereported scores were summed to obtain the final scores) for the slow SE
0ms 750ms 1250ms 1750ms 0-1750ms
postPAS 17.00 (9.04) 14.00 (7.59) 16.00 (7.21) 15.00 (7.47) 16.20 (7.57)postNAS 5.00 (3.80) 5.00 (2.70) 6.00 (3.27) 5.50 (3.28) 5.50 (3.17)postPAS-prePAS − 1.00 (8.49) − 2.50 (6.46) − 3.50 (6.34) − 2.50 (7.11) − 2.00 (6.72)postNAS-preNAS .00 (2.31) .00 (1.10) 0.50 (1.79) .00 (2.30) .00 (1.76)
Frustration 2.50 (2.20) 3.00 (2.02) 2.00 (2.02) 3.00 (2.21) 2.50 (2.04)
FA 21.50 (9.37) 21.00 (8.29) 18.50 (9.26) 21.00 (10.38) 21.00 (9.06)
CSUQ-SYSUSE 31.00 (6.73) 29.00 (5.40) 31.00 (7.63) 28.50 (6.89) 30.00 (6.70)
custom-1 5.50 (1.57) 5.00 (1.55) 5.00 (1.71) 3.00 (1.40) 5.00 (1.59)custom-2 5.50 (1.18) 5.00 (1.60) 5.50 (1.23) 4.50 (1.26) 5.00 (1.34)custom-3 5.50 (1.75) 6.00 (1.16) 6.00 (1.90) 6.00 (1.49) 6.00 (1.56)custom-4 6.00 (.94) 5.50 (.82) 5.50 (1.91) 5.50 (1.08) 6.00 (1.28)
Table 5. Descriptive statistics (Median, SD) for reported I-PANAS-SF, FA, and CSUQ-SYSUSE scales (thereported scores were summed to obtain the final scores) for the fast SE
0ms 750ms 1250ms 1750ms 0-1750ms
postPAS 20.00 (7.82) 18.50 (9.01) 23.50 (9.48) 18.50 (8.23) 21.00 (8.35)postNAS 5.50 (2.44) 6.50 (3.03) 6.00 (2.72) 6.50 (2.49) 6.00 (2.58)postPAS-prePAS 2.50 (5.95) 1.00 (6.13) 1.50 (6.01) 1.50 (6.29) 2.00 (5.90)postNAS-preNAS .00 (2.46) .00 (2.53) 0.50 (2.74) .00 (1.33) .00 (2.25)
Frustration 2.50 (1.40) 3.50 (1.63) 3.00 (1.08) 3.00 (.84) 3.00 (1.27)
FA 25.00 (10.41) 26.50 (9.23) 27.50 (9.85) 26.00 (10.56)
CSUQ-SYSUSE 36.50 (5.35) 33.50 (8.25) 31.50 (8.34) 35.00 (8.22) 33.50 (8.47)
custom-1 6.00 (1.72) 5.50 (1.87) 4.50 (1.90) 6.00 (1.64) 6.00 (1.78)custom-2 6.00 (1.18) 5.50 (1.48) 5.00 (1.23) 6.00 (1.35) 6.00 (1.29)custom-3 3.50 (2.16) 5.00 (2.06) 4.50 (2.23) 5.00 (1.89) 5.00 (2.03)custom-4 6.00 (1.25) 6.00 (.74) 6.00 (1.42) 6.00 (.95) 6.00 (1.08)
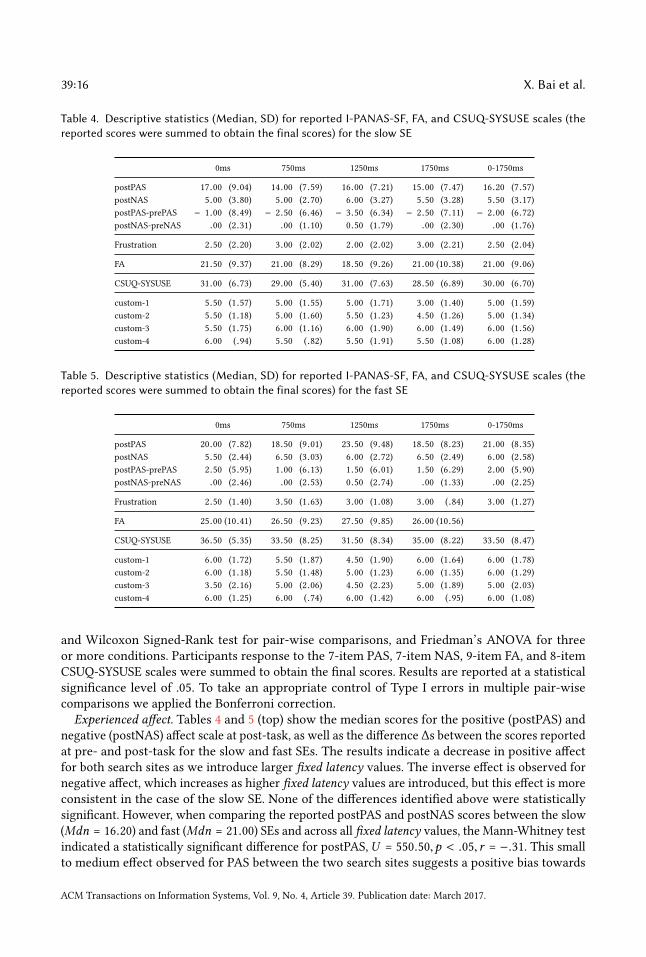
and Wilcoxon Signed-Rank test for pair-wise comparisons, and Friedman’s ANOVA for threeor more conditions. Participants response to the 7-item PAS, 7-item NAS, 9-item FA, and 8-itemCSUQ-SYSUSE scales were summed to obtain the final scores. Results are reported at a statisticalsignificance level of .05. To take an appropriate control of Type I errors in multiple pair-wisecomparisons we applied the Bonferroni correction.Experienced affect. Tables 4 and 5 (top) show the median scores for the positive (postPAS) and
negative (postNAS) affect scale at post-task, as well as the difference ∆s between the scores reportedat pre- and post-task for the slow and fast SEs. The results indicate a decrease in positive affectfor both search sites as we introduce larger fixed latency values. The inverse effect is observed fornegative affect, which increases as higher fixed latency values are introduced, but this effect is moreconsistent in the case of the slow SE. None of the differences identified above were statisticallysignificant. However, when comparing the reported postPAS and postNAS scores between the slow(Mdn = 16.20) and fast (Mdn = 21.00) SEs and across all fixed latency values, the Mann-Whitney testindicated a statistically significant difference for postPAS, U = 550.50,p < .05, r = −.31. This smallto medium effect observed for PAS between the two search sites suggests a positive bias towards
ACM Transactions on Information Systems, Vol. 9, No. 4, Article 39. Publication date: March 2017.
Understanding and Leveraging the Impact of Response Latency on User Behaviour in Web Search39:17
the fast SE, despite participants having experienced the same range of fixed latency values. Tables 4and 5 also display the median scores for reported level of frustration. There were no differencesamong the fixed latency values, nor between the two search sites.
Focused attention. Tables 4 and 5 (middle) display the median scores for FA. For the participantsof the slow SE, the variation of the scores across the fixed latency values did not indicate any visibletrend. For the participants of the fast SE, we observed a decrease in small- and medium-size fixedlatency although no significant effect was established.When comparing the reported FA between theparticipants of the slow (Mdn = 21.00) and fast (Mdn = 26.00) SEs, and across all fixed latency values,the Mann-Whitney test indicated a statistically significant difference,U = 568.50,p < .05, r = −.27.This represents a small to medium effect for the FA observed between the two search sites. Moreover,it suggests that the participants of the fast SE felt more deeply involved with the search task, despitehaving experienced the same range of fixed latency values.System usability. Tables 4 and 5 (bottom) display the median CSUQ-SYSUSE scores per fixed
latency value and per search site. For both search sites we observed a noticeable increase in thereported usability scores. More in specific, for the slow SE, there was a statistically significantdifference in the perceived usability of the search site depending on which amount of fixed latencywas introduced, χ 2(3) = 11.00,p < .05. Post-hoc analysis with Wilcoxon Signed-Rank test indicateda statistically significant difference in the perceived usability, as reported scores were significantlyhigher for the fixed latency value of “0” (Mdn = 31.00) compared to “1750” (Mdn = 28.50), Z =−2.66,p < .008, r = −0.42. This represents a large effect in the levels of perceived usability whenfixed latency was increased by 1750 ms. No significant differences were observed for the fast SE,suggesting that the participants were more tolerant towards the delays experienced for that searchsite despite the large fixed latency values introduced to their search interactions.
Additionally, the reported scores for perceived usability differed significantly between the partic-ipants of the slow (Mdn = 30.00) and fast (Mdn = 35.00) SEs,U = 596.00,p < .05, r = −.22. None ofthe differences identified in the number of submitted queries per fixed latency value were significant.However, when comparing the number of submitted queries between the two search sites, theMann-Whitney test revealed a statistically significant difference, U = 390.00,p < .01, r = −.44. Thelarge effect suggests that participants who interacted with the fast SE were able to submit morequeries (Mdn = 38.00) compared to participants who interacted with the slow SE (Mdn = 49.50),across all queries.Search experience. We evaluated the search experience promoted by the two search sites by
asking our participants to report their agreement to a set of custom statements. With respect tostatement (i), the Friedman’s ANOVA test indicated for the slow SE a significant difference in theperceived search site speed, depending on which fixed latency value was added. Multiple pair-wisecomparisons were performed to follow up this finding. The Wilcoxon test indicated a significantdifference between the fixed latency value “0” (Mdn = 5.50) and “1750” (Mdn = 3.00), with “1750”receiving significantly lower scores of agreement, T = 76.5,p < .05. Furthermore, the reportedperceived search site speed by participants of the slow SE did not differ significantly from thatof participants of the fast SE, which is an interesting finding considering the notable differencein the search sites’ performance. In regards to statement (ii), participants’ belief that the searchsite helped them accomplish their task more quickly changed significantly over the fixed latencyvalues (χ 3 = 10.80,p < .05). This effect was observed only for the slow SE. Post hoc tests revealeda statistically significant difference between the fixed latency values “0” (Mdn = 5.50) and “1750”(Mdn = 4.50),T = 74.5,p < .05. Finally, for statements (iii) and (iv), none of the differences identifiedin the reported scores were statistically significant across the search sites and fixed latency values.
ACM Transactions on Information Systems, Vol. 9, No. 4, Article 39. Publication date: March 2017.
39:18 X. Bai et al.
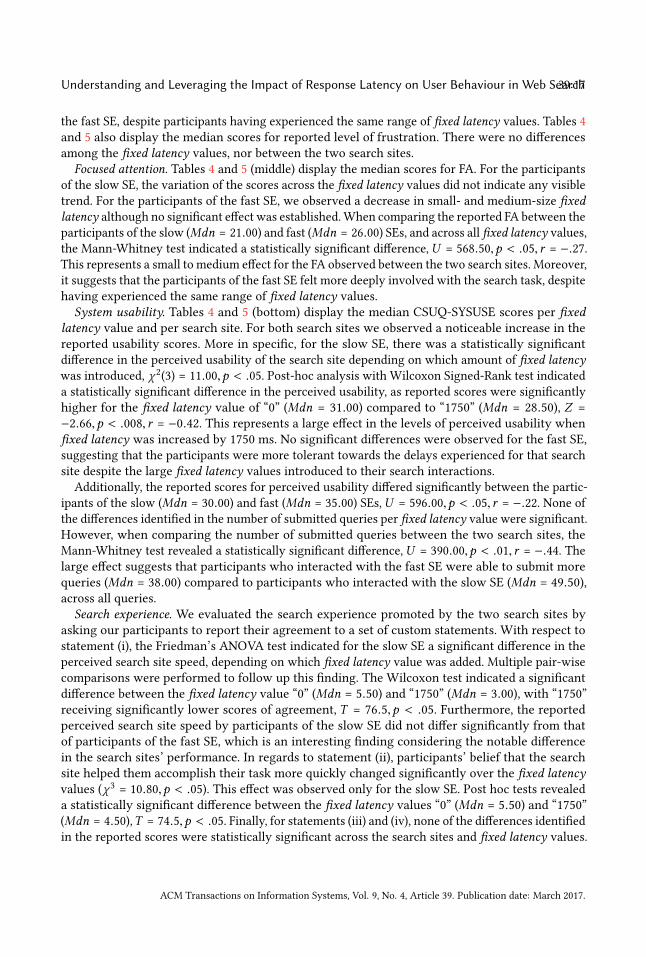
Table 6. Summary of correlations of subjective beliefs on search site performance and reported UE andCSUQ-SYSUSE scales
Slow SE will respond Slow SE will provide Fast SE will respond Fast SE will providefast to my queries relevant results fast to my queries relevant results
postPAS .455∗∗ .262 −.051∗∗ −.272postNAS .041 −.083 .245 .133
FA .702∗∗ .720∗∗ .341∗ −.133
CSUQ-SYSUSE .267 .411∗∗ .591∗∗ .378∗
custom-1 .177 .278 .330∗ .212custom-2 .177 .263 .443∗∗ .259custom-3 .105 .011 −.182 −.034custom-4 .082 .232 .624∗∗ .390∗
∗ . Correlation is significant at the .05 level (2-tailed). ∗∗ . Correlation is significant at the .01 level (2-tailed).
Coming back to statement (i), we further examined the participants’ reported agreement (Sec-tion 4.1) to the following statements from the first study: (ii) “X search will respond fast to myqueries” and (ii) “X search will provide relevant results”. The Wilcoxon text revealed that partic-ipants’ prior beliefs of search site speed was significantly higher (T = 25.5,p < .01) for the fastSE (Mdn = 6.00) compared to the slow SE (Mdn = 5.00). In addition, participants’ prior beliefsof results relevance was significantly higher (T = 35.5,p < .05) for the fast SE (Mdn = 6.00)compared to the slow SE (Mdn = 5.00). These results help us understand that the subjective searchexperience may be influenced by branding, as well as users’ preconceptions about the search siteperformance. For example, a search site perceived as “fast” or “efficient” may still result in engagingsearch interactions despite occasional poor performance. This suggests that a successful marketingapproach could go a long way to improve the reputation of a product and bias the end-users in apositively manner.
Correlation analysis of all factors. Finally, we report the results of a correlation analysis performedacross all search experience factors discussed above, including participants’ prior beliefs of thesearch site performance. The importance of this analysis is to understand better the influence ofsubjective beliefs on the hedonic and cognitive aspects on the search experience. Table 6 showsall interactions between UE and CSUQ-SYSUSE factors, and subjective beliefs. We observe that inthe case of the slow SE, positive bias in regards to the search site speed results in higher positiveaffect and FA, whereas strong belief that the search site will provide relevant results is positivelycorrelated with perceived usability. On the other hand, for the fast SE, we observe that participants’positive expectations regarding the search site speed is negatively correlated with positive affectand positively correlated with FA and perceived usability. Moreover, this favourable bias is alsopositively correlated with expectations that the given search site will respond fast to the queries, willbe helpful in accomplishing the task in a reasonable amount of time, and will provide satisfactoryresults. Despite our relatively small sample, these findings suggest that search engine bias cannot beruled out and users tend to interpret ambiguous evidence as supporting their existing beliefs. Hence,these tendencies to overestimate, or underestimate, system performance biases their interpretationsof search interactions and invokes negative behaviours that may result in search site abandonment.
4.4 SummaryIn response to RQ2, our second user study investigated the effects of response latency on userengagement and satisfaction. The main findings of this study are summarised below.
ACM Transactions on Information Systems, Vol. 9, No. 4, Article 39. Publication date: March 2017.
Understanding and Leveraging the Impact of Response Latency on User Behaviour in Web Search39:19
First, regarding the experienced affect, our analysis revealed a non-significant decrease in positiveaffect for both search sites as larger latency values were introduced, whereas for the negative affectwe observed an increasing trend which is also not statistically significant. Moreover, the positiveaffect experienced at post-task was found to be significantly higher for the fast SE, indicatinga potential positive bias towards the latter. These findings appear to be consistent with what isreported in [5], where the authors did not establish any significant effects of response latency onusers. However, we note that in [5], the search site condition was fixed and the authors did notperform the same brand comparison across different commercial search sites as we report in thecurrent study.
Second, with respect to FA, the reported scores of the users of the slow and fast SEs were foundto be statistically significantly different. On the other hand, the reported FA within each group didnot change significantly across the latency values. This finding appears to be analogous with whatis reported in [5], where the FA scale revealed a pattern which, although not statistically significant,suggests a reduced engagement as the latency increases to higher values.
Third, we observed a significant difference in the perceived usability between the latency valuesof “0” and “1750” ms for the slow SE, while for the fast SE the reported usability scores did not varysignificantly across the latency values. Similarly, the analysis in [5] did not indicate any significantdifferences in the CSUQ-SYSUSE scores across the latency values. However, when comparingthe reported usability scores between the participants of the slow SE and the fast SE, we noted asignificant difference (participants of the fast SE reported on average higher perceived usability),despite the participants having experienced the same latency conditions.
Last, when we examined the search experience promoted by the two search sites we noted severalsignificant effects. More specifically, the participants of the slow SE reported a significantly slowersearch site speed in response to their queries, as the latency increased, while the participants of thefast SE did not suffer from such an effect. Also, the participants of the slow SE where significantlyless in agreement to the statement that the search site helped them accomplish their task morequickly, as the latency values increased. No such effect was observed for the participants of the fastSE. Finally, no significant differences were identified with respect to the statements (iii) and (iv).
5 LARGE-SCALE QUERY LOG ANALYSISIn this section, we investigate the impact of increasing response latency on the click behaviourof real web search engine users. To this end, we use a random sample of search queries obtainedfrom Yahoo Web Search. We examine the variation in the click behaviour using the entire querysample as well as certain subsets of the sample with respect to one user attribute (i.e., gender, age,or level of activity), time attribute (i.e., work or non-work hours), or query attribute (i.e., querylength, frequency, or type of information need). We select these attributes as they represent thetypical context associated with a web search query. These attributes have impact on users’ clickbehaviour as we show in this section and using them as signals can help to improve the accuracyof click prediction model for web search as we will show in Section 6.
5.1 Experimental Setting5.1.1 Query Log. In our log data, each search query is associated with various latency values
measured at different steps of the retrieval process. In all of our experiments, we rely on the end-to-end (user-perceived) latency values. We limit our analysis to queries issued from desktop computersin order to reduce the potential bias due to the differences in end user devices. In addition, welimit the user space to the US, trying to reduce the variation in the network latency due to the
ACM Transactions on Information Systems, Vol. 9, No. 4, Article 39. Publication date: March 2017.
39:20 X. Bai et al.
geolocation of users. Furthermore, we select only queries that were issued to a particular searchdata centre. The resulting sample after these filtering steps contains about 30 million queries.
5.1.2 Methodology. To quantify the engagement of users with retrieved search results, weconsider for each query (i) whether the user clicked on the search result page of the query or not(i.e., click status) and (ii) the number of clicks performed on the search result page (i.e., click count).We first define specific metrics that relate to click status and click count in Section 5.2 to evaluate howincreasing response latency affects user click behaviour. We then compare the impact of responselatency on the click behaviour of users having different attributes (Section 5.3), issuing their queriesat different times of the day (Section 5.4), or issuing different types of queries (Section 5.5), withrespect to click status and click count, according to the specific metrics defined for them. Details ofthe metrics will be provided in the corresponding sections shortly.
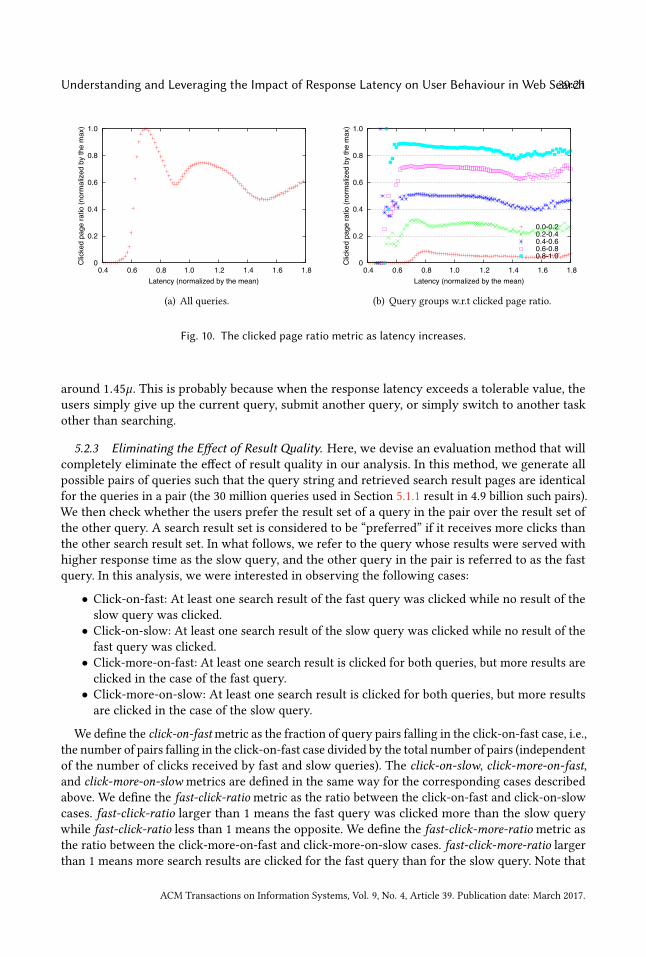
5.2 Impact of Latency on Click Behaviour5.2.1 Impact of Latency at First Glance. We define the clicked page ratio metric as the fraction of
search result pages where at least one result link is clicked by the user and observe how increasingresponse latency affects the metric. In this metric, higher values imply that the users interact moreoften with the presented search results. To increase the granularity of measurements, we groupqueries into buckets at every 10 millisecond latency interval and compute the clicked page ratiometric separately for each bucket, using all queries inside the bucket. Due to the confidential natureof the data, when we display this metric in the plots, we normalise the values by the maximumvalue observed in the plot. This should not form a concern since we are more interested in thevariation of the metric rather than the absolute metric values.
Fig. 10(a) shows the variation of the clicked page ratio metric as the response latency increases.Surprisingly, we observe the presence of two separate distributions with different peaks, insteadof a monotonically decreasing distribution. This result can be explained with the observation wemade when discussing Fig. 2(a): The first distribution in Fig. 10(a) corresponds to queries which areserved by the result cache at low response times. Most of these cached queries are navigationalqueries4 whose results are likely to receive at least one click. The second distribution correspondsto queries that are served by the relatively slow backend search system. These are mostly tailqueries, which are less likely to result in a click on the results.
5.2.2 Effect of ResultQuality. Intuitively, the quality of results has a considerably more importanteffect on the clicked page ratio metric than the response latency. In general, users are less likely toclick on irrelevant results even if they are served with low response latency. On the other hand,if the results are expected to be very relevant, users may be willing to engage with the results,tolerating the high response latency.
One way to reduce the influence of result quality in our analysis is to group queries according tothe likelihood of their results being clicked. The intuition here is that, if a query is very likely toresult in a click on the search results (e.g., query “facebook”), this implies that the results are veryoften satisfactory for the users. In this case, any variation in the clicked page ratio is more likelyto be due to the changes in user-perceived response latency. Similarly, if the results of a queryrarely receive clicks, the variation in the clicked page ratio is more likely to be due to the change inlatency.
Based on this intuition, we group queries into five buckets such that the clicked page ratio of allqueries within a bucket fall into the same interval. According to Fig. 10(b), for every query group,the clicked page ratio tends to decrease when the response latency increases, making a bottom4We detect navigational queries using the classifier described in Section 5.5.3.
ACM Transactions on Information Systems, Vol. 9, No. 4, Article 39. Publication date: March 2017.
Understanding and Leveraging the Impact of Response Latency on User Behaviour in Web Search39:21
0
0.2
0.4
0.6
0.8
1.0
0.4 0.6 0.8 1.0 1.2 1.4 1.6 1.8
Clic
ked
page
ratio
(nor
mal
ized
by
the
max
)
Latency (normalized by the mean)
(a) All queries.
0
0.2
0.4
0.6
0.8
1.0
0.4 0.6 0.8 1.0 1.2 1.4 1.6 1.8
Clic
ked
page
ratio
(nor
mal
ized
by
the
max
)
Latency (normalized by the mean)
0.0-0.20.2-0.40.4-0.60.6-0.80.8-1.0
(b) Query groups w.r.t clicked page ratio.
Fig. 10. The clicked page ratio metric as latency increases.
around 1.45µ. This is probably because when the response latency exceeds a tolerable value, theusers simply give up the current query, submit another query, or simply switch to another taskother than searching.
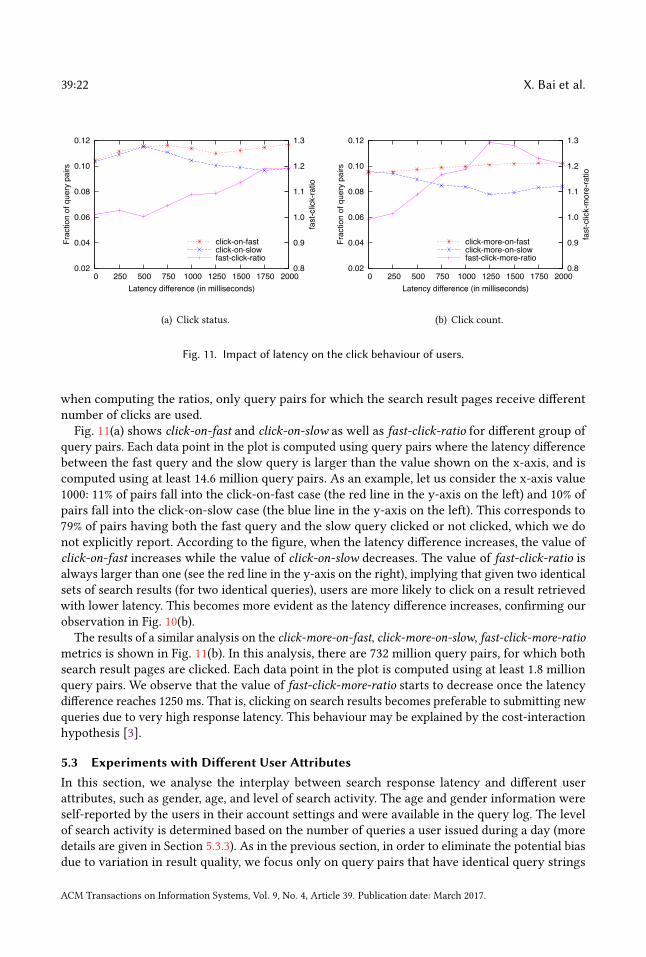
5.2.3 Eliminating the Effect of Result Quality. Here, we devise an evaluation method that willcompletely eliminate the effect of result quality in our analysis. In this method, we generate allpossible pairs of queries such that the query string and retrieved search result pages are identicalfor the queries in a pair (the 30 million queries used in Section 5.1.1 result in 4.9 billion such pairs).We then check whether the users prefer the result set of a query in the pair over the result set ofthe other query. A search result set is considered to be “preferred” if it receives more clicks thanthe other search result set. In what follows, we refer to the query whose results were served withhigher response time as the slow query, and the other query in the pair is referred to as the fastquery. In this analysis, we were interested in observing the following cases:
• Click-on-fast: At least one search result of the fast query was clicked while no result of theslow query was clicked.• Click-on-slow: At least one search result of the slow query was clicked while no result of thefast query was clicked.• Click-more-on-fast: At least one search result is clicked for both queries, but more results areclicked in the case of the fast query.• Click-more-on-slow: At least one search result is clicked for both queries, but more resultsare clicked in the case of the slow query.
We define the click-on-fastmetric as the fraction of query pairs falling in the click-on-fast case, i.e.,the number of pairs falling in the click-on-fast case divided by the total number of pairs (independentof the number of clicks received by fast and slow queries). The click-on-slow, click-more-on-fast,and click-more-on-slow metrics are defined in the same way for the corresponding cases describedabove. We define the fast-click-ratio metric as the ratio between the click-on-fast and click-on-slowcases. fast-click-ratio larger than 1 means the fast query was clicked more than the slow querywhile fast-click-ratio less than 1 means the opposite. We define the fast-click-more-ratio metric asthe ratio between the click-more-on-fast and click-more-on-slow cases. fast-click-more-ratio largerthan 1 means more search results are clicked for the fast query than for the slow query. Note that
ACM Transactions on Information Systems, Vol. 9, No. 4, Article 39. Publication date: March 2017.
39:22 X. Bai et al.
0.02
0.04
0.06
0.08
0.10
0.12
0 250 500 750 1000 1250 1500 1750 20000.8
0.9
1.0
1.1
1.2
1.3
Frac
tion
of q
uery
pai
rs
fast
-clic
k-ra
tio
Latency difference (in milliseconds)
click-on-fastclick-on-slowfast-click-ratio
(a) Click status.
0.02
0.04
0.06
0.08
0.10
0.12
0 250 500 750 1000 1250 1500 1750 20000.8
0.9
1.0
1.1
1.2
1.3
Frac
tion
of q
uery
pai
rs
fast
-clic
k-m
ore-
ratio
Latency difference (in milliseconds)
click-more-on-fastclick-more-on-slowfast-click-more-ratio
(b) Click count.
Fig. 11. Impact of latency on the click behaviour of users.
when computing the ratios, only query pairs for which the search result pages receive differentnumber of clicks are used.Fig. 11(a) shows click-on-fast and click-on-slow as well as fast-click-ratio for different group of
query pairs. Each data point in the plot is computed using query pairs where the latency differencebetween the fast query and the slow query is larger than the value shown on the x-axis, and iscomputed using at least 14.6 million query pairs. As an example, let us consider the x-axis value1000: 11% of pairs fall into the click-on-fast case (the red line in the y-axis on the left) and 10% ofpairs fall into the click-on-slow case (the blue line in the y-axis on the left). This corresponds to79% of pairs having both the fast query and the slow query clicked or not clicked, which we donot explicitly report. According to the figure, when the latency difference increases, the value ofclick-on-fast increases while the value of click-on-slow decreases. The value of fast-click-ratio isalways larger than one (see the red line in the y-axis on the right), implying that given two identicalsets of search results (for two identical queries), users are more likely to click on a result retrievedwith lower latency. This becomes more evident as the latency difference increases, confirming ourobservation in Fig. 10(b).
The results of a similar analysis on the click-more-on-fast, click-more-on-slow, fast-click-more-ratiometrics is shown in Fig. 11(b). In this analysis, there are 732 million query pairs, for which bothsearch result pages are clicked. Each data point in the plot is computed using at least 1.8 millionquery pairs. We observe that the value of fast-click-more-ratio starts to decrease once the latencydifference reaches 1250 ms. That is, clicking on search results becomes preferable to submitting newqueries due to very high response latency. This behaviour may be explained by the cost-interactionhypothesis [3].
5.3 Experiments with Different User AttributesIn this section, we analyse the interplay between search response latency and different userattributes, such as gender, age, and level of search activity. The age and gender information wereself-reported by the users in their account settings and were available in the query log. The levelof search activity is determined based on the number of queries a user issued during a day (moredetails are given in Section 5.3.3). As in the previous section, in order to eliminate the potential biasdue to variation in result quality, we focus only on query pairs that have identical query strings
ACM Transactions on Information Systems, Vol. 9, No. 4, Article 39. Publication date: March 2017.
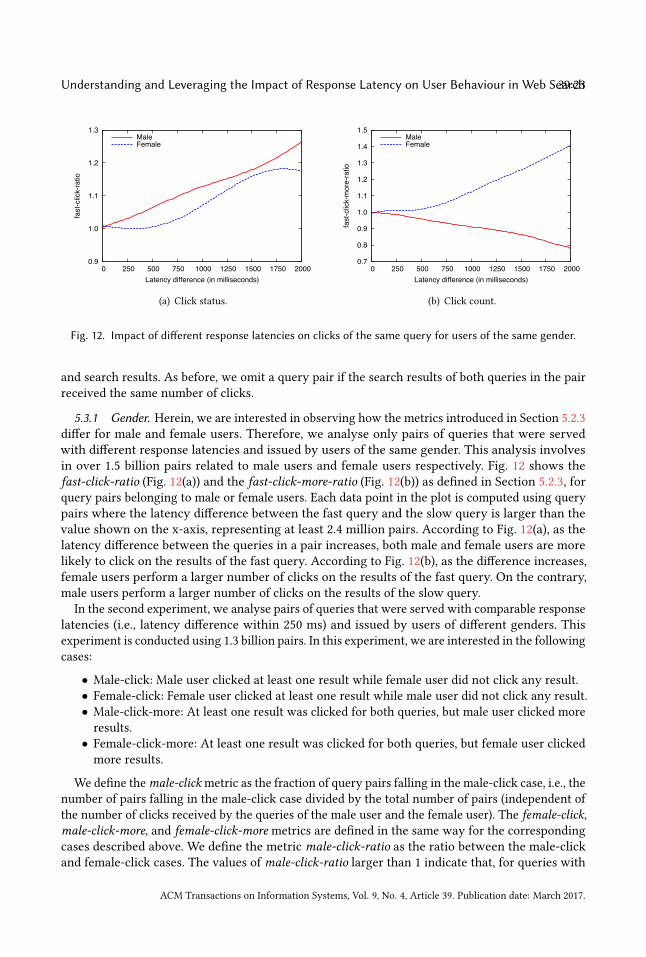
Understanding and Leveraging the Impact of Response Latency on User Behaviour in Web Search39:23
0.9
1.0
1.1
1.2
1.3
0 250 500 750 1000 1250 1500 1750 2000
fast
-clic
k-ra
tio
Latency difference (in milliseconds)
MaleFemale
(a) Click status.
0.7
0.8
0.9
1.0
1.1
1.2
1.3
1.4
1.5
0 250 500 750 1000 1250 1500 1750 2000
fast
-clic
k-m
ore-
ratio
Latency difference (in milliseconds)
MaleFemale
(b) Click count.
Fig. 12. Impact of different response latencies on clicks of the same query for users of the same gender.
and search results. As before, we omit a query pair if the search results of both queries in the pairreceived the same number of clicks.
5.3.1 Gender. Herein, we are interested in observing how the metrics introduced in Section 5.2.3differ for male and female users. Therefore, we analyse only pairs of queries that were servedwith different response latencies and issued by users of the same gender. This analysis involvesin over 1.5 billion pairs related to male users and female users respectively. Fig. 12 shows thefast-click-ratio (Fig. 12(a)) and the fast-click-more-ratio (Fig. 12(b)) as defined in Section 5.2.3, forquery pairs belonging to male or female users. Each data point in the plot is computed using querypairs where the latency difference between the fast query and the slow query is larger than thevalue shown on the x-axis, representing at least 2.4 million pairs. According to Fig. 12(a), as thelatency difference between the queries in a pair increases, both male and female users are morelikely to click on the results of the fast query. According to Fig. 12(b), as the difference increases,female users perform a larger number of clicks on the results of the fast query. On the contrary,male users perform a larger number of clicks on the results of the slow query.
In the second experiment, we analyse pairs of queries that were served with comparable responselatencies (i.e., latency difference within 250 ms) and issued by users of different genders. Thisexperiment is conducted using 1.3 billion pairs. In this experiment, we are interested in the followingcases:
• Male-click: Male user clicked at least one result while female user did not click any result.• Female-click: Female user clicked at least one result while male user did not click any result.• Male-click-more: At least one result was clicked for both queries, but male user clicked moreresults.• Female-click-more: At least one result was clicked for both queries, but female user clickedmore results.
We define themale-clickmetric as the fraction of query pairs falling in the male-click case, i.e., thenumber of pairs falling in the male-click case divided by the total number of pairs (independent ofthe number of clicks received by the queries of the male user and the female user). The female-click,male-click-more, and female-click-more metrics are defined in the same way for the correspondingcases described above. We define the metric male-click-ratio as the ratio between the male-clickand female-click cases. The values of male-click-ratio larger than 1 indicate that, for queries with
ACM Transactions on Information Systems, Vol. 9, No. 4, Article 39. Publication date: March 2017.
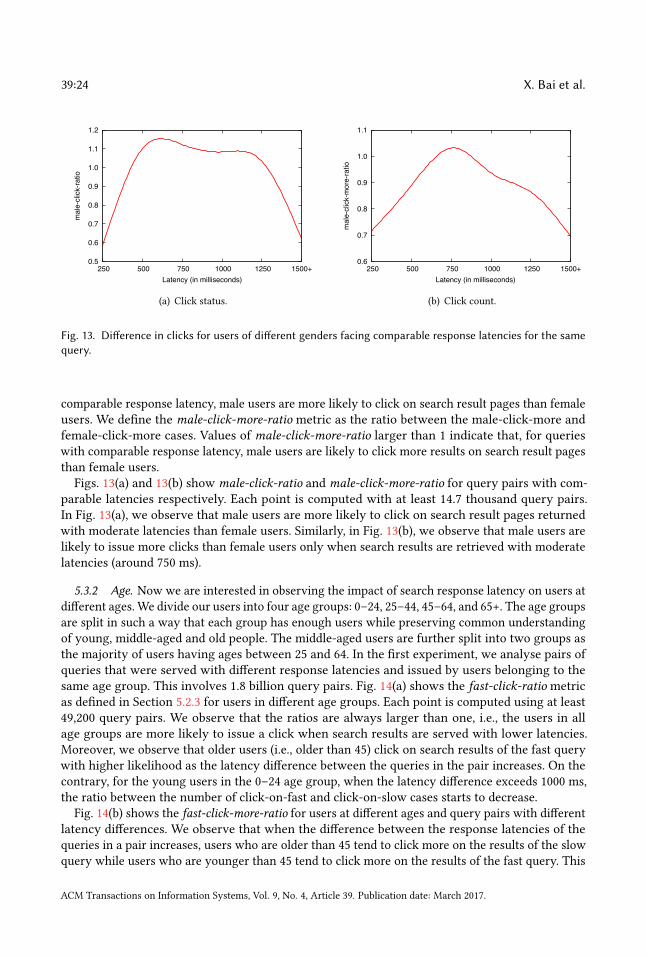
39:24 X. Bai et al.
0.5
0.6
0.7
0.8
0.9
1.0
1.1
1.2
250 500 750 1000 1250 1500+
mal
e-cl
ick-
ratio
Latency (in milliseconds)
(a) Click status.
0.6
0.7
0.8
0.9
1.0
1.1
250 500 750 1000 1250 1500+
mal
e-cl
ick-
mor
e-ra
tio
Latency (in milliseconds)
(b) Click count.
Fig. 13. Difference in clicks for users of different genders facing comparable response latencies for the samequery.
comparable response latency, male users are more likely to click on search result pages than femaleusers. We define the male-click-more-ratio metric as the ratio between the male-click-more andfemale-click-more cases. Values of male-click-more-ratio larger than 1 indicate that, for querieswith comparable response latency, male users are likely to click more results on search result pagesthan female users.Figs. 13(a) and 13(b) show male-click-ratio and male-click-more-ratio for query pairs with com-
parable latencies respectively. Each point is computed with at least 14.7 thousand query pairs.In Fig. 13(a), we observe that male users are more likely to click on search result pages returnedwith moderate latencies than female users. Similarly, in Fig. 13(b), we observe that male users arelikely to issue more clicks than female users only when search results are retrieved with moderatelatencies (around 750 ms).
5.3.2 Age. Now we are interested in observing the impact of search response latency on users atdifferent ages. We divide our users into four age groups: 0–24, 25–44, 45–64, and 65+. The age groupsare split in such a way that each group has enough users while preserving common understandingof young, middle-aged and old people. The middle-aged users are further split into two groups asthe majority of users having ages between 25 and 64. In the first experiment, we analyse pairs ofqueries that were served with different response latencies and issued by users belonging to thesame age group. This involves 1.8 billion query pairs. Fig. 14(a) shows the fast-click-ratio metricas defined in Section 5.2.3 for users in different age groups. Each point is computed using at least49,200 query pairs. We observe that the ratios are always larger than one, i.e., the users in allage groups are more likely to issue a click when search results are served with lower latencies.Moreover, we observe that older users (i.e., older than 45) click on search results of the fast querywith higher likelihood as the latency difference between the queries in the pair increases. On thecontrary, for the young users in the 0–24 age group, when the latency difference exceeds 1000 ms,the ratio between the number of click-on-fast and click-on-slow cases starts to decrease.
Fig. 14(b) shows the fast-click-more-ratio for users at different ages and query pairs with differentlatency differences. We observe that when the difference between the response latencies of thequeries in a pair increases, users who are older than 45 tend to click more on the results of the slowquery while users who are younger than 45 tend to click more on the results of the fast query. This
ACM Transactions on Information Systems, Vol. 9, No. 4, Article 39. Publication date: March 2017.
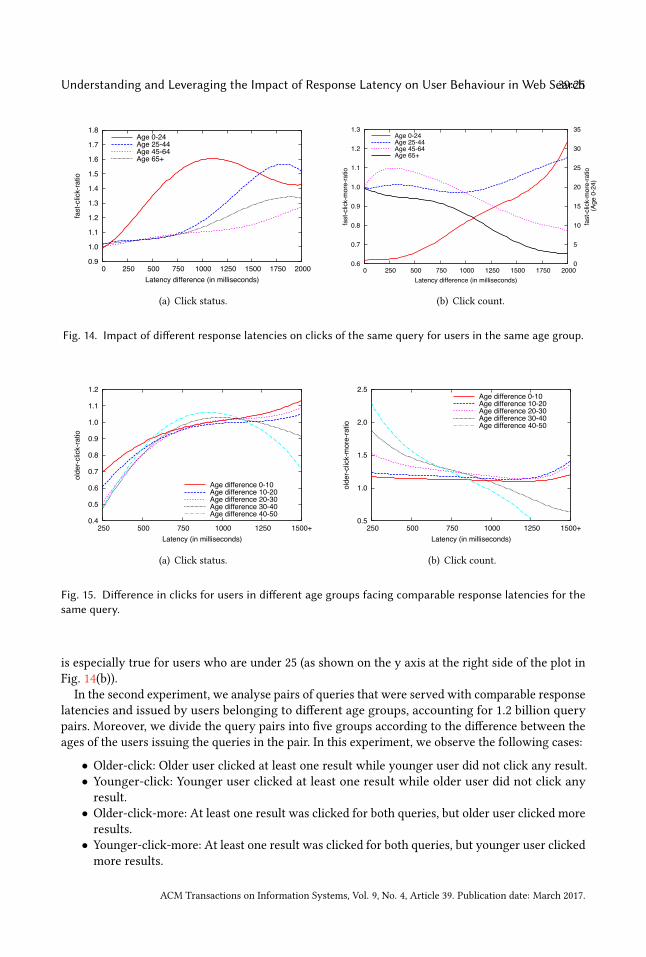
Understanding and Leveraging the Impact of Response Latency on User Behaviour in Web Search39:25
0.9
1.0
1.1
1.2
1.3
1.4
1.5
1.6
1.7
1.8
0 250 500 750 1000 1250 1500 1750 2000
fast
-clic
k-ra
tio
Latency difference (in milliseconds)
Age 0-24Age 25-44Age 45-64Age 65+
(a) Click status.
0.6
0.7
0.8
0.9
1.0
1.1
1.2
1.3
0 250 500 750 1000 1250 1500 1750 2000 0
5
10
15
20
25
30
35
fast
-clic
k-m
ore-
ratio
fast
-clic
k-m
ore-
ratio
(Age
0-2
4)
Latency difference (in milliseconds)
Age 0-24Age 25-44Age 45-64Age 65+
(b) Click count.
Fig. 14. Impact of different response latencies on clicks of the same query for users in the same age group.
0.4
0.5
0.6
0.7
0.8
0.9
1.0
1.1
1.2
250 500 750 1000 1250 1500+
olde
r-clic
k-ra
tio
Latency (in milliseconds)
Age difference 0-10Age difference 10-20Age difference 20-30Age difference 30-40Age difference 40-50
(a) Click status.
0.5
1.0
1.5
2.0
2.5
250 500 750 1000 1250 1500+
olde
r-clic
k-m
ore-
ratio
Latency (in milliseconds)
Age difference 0-10Age difference 10-20Age difference 20-30Age difference 30-40Age difference 40-50
(b) Click count.
Fig. 15. Difference in clicks for users in different age groups facing comparable response latencies for thesame query.
is especially true for users who are under 25 (as shown on the y axis at the right side of the plot inFig. 14(b)).
In the second experiment, we analyse pairs of queries that were served with comparable responselatencies and issued by users belonging to different age groups, accounting for 1.2 billion querypairs. Moreover, we divide the query pairs into five groups according to the difference between theages of the users issuing the queries in the pair. In this experiment, we observe the following cases:
• Older-click: Older user clicked at least one result while younger user did not click any result.• Younger-click: Younger user clicked at least one result while older user did not click anyresult.• Older-click-more: At least one result was clicked for both queries, but older user clicked moreresults.• Younger-click-more: At least one result was clicked for both queries, but younger user clickedmore results.
ACM Transactions on Information Systems, Vol. 9, No. 4, Article 39. Publication date: March 2017.
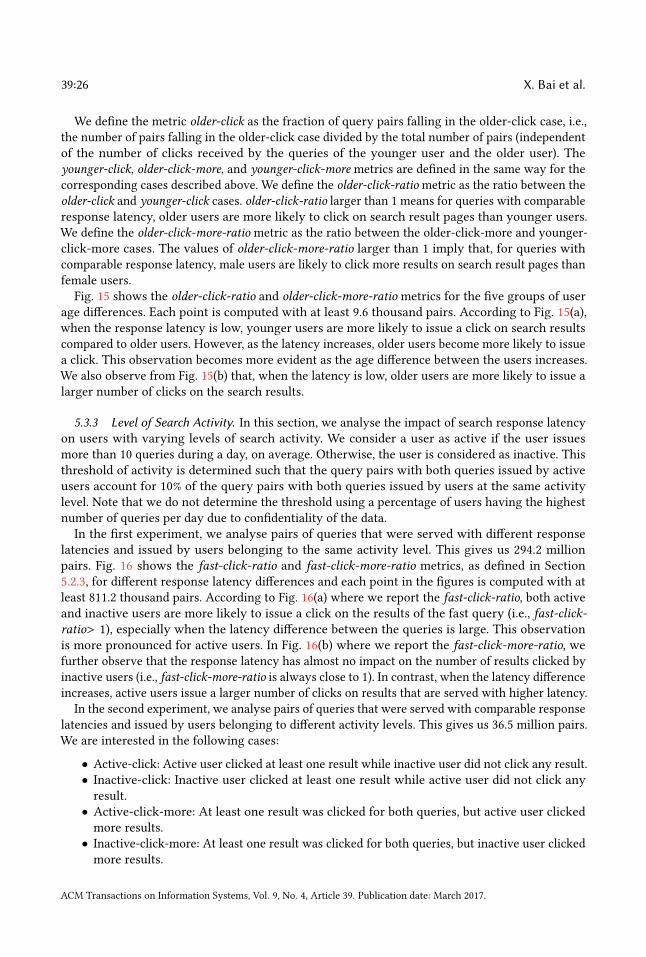
39:26 X. Bai et al.
We define the metric older-click as the fraction of query pairs falling in the older-click case, i.e.,the number of pairs falling in the older-click case divided by the total number of pairs (independentof the number of clicks received by the queries of the younger user and the older user). Theyounger-click, older-click-more, and younger-click-more metrics are defined in the same way for thecorresponding cases described above. We define the older-click-ratiometric as the ratio between theolder-click and younger-click cases. older-click-ratio larger than 1 means for queries with comparableresponse latency, older users are more likely to click on search result pages than younger users.We define the older-click-more-ratio metric as the ratio between the older-click-more and younger-click-more cases. The values of older-click-more-ratio larger than 1 imply that, for queries withcomparable response latency, male users are likely to click more results on search result pages thanfemale users.Fig. 15 shows the older-click-ratio and older-click-more-ratio metrics for the five groups of user
age differences. Each point is computed with at least 9.6 thousand pairs. According to Fig. 15(a),when the response latency is low, younger users are more likely to issue a click on search resultscompared to older users. However, as the latency increases, older users become more likely to issuea click. This observation becomes more evident as the age difference between the users increases.We also observe from Fig. 15(b) that, when the latency is low, older users are more likely to issue alarger number of clicks on the search results.
5.3.3 Level of Search Activity. In this section, we analyse the impact of search response latencyon users with varying levels of search activity. We consider a user as active if the user issuesmore than 10 queries during a day, on average. Otherwise, the user is considered as inactive. Thisthreshold of activity is determined such that the query pairs with both queries issued by activeusers account for 10% of the query pairs with both queries issued by users at the same activitylevel. Note that we do not determine the threshold using a percentage of users having the highestnumber of queries per day due to confidentiality of the data.In the first experiment, we analyse pairs of queries that were served with different response
latencies and issued by users belonging to the same activity level. This gives us 294.2 millionpairs. Fig. 16 shows the fast-click-ratio and fast-click-more-ratio metrics, as defined in Section5.2.3, for different response latency differences and each point in the figures is computed with atleast 811.2 thousand pairs. According to Fig. 16(a) where we report the fast-click-ratio, both activeand inactive users are more likely to issue a click on the results of the fast query (i.e., fast-click-ratio> 1), especially when the latency difference between the queries is large. This observationis more pronounced for active users. In Fig. 16(b) where we report the fast-click-more-ratio, wefurther observe that the response latency has almost no impact on the number of results clicked byinactive users (i.e., fast-click-more-ratio is always close to 1). In contrast, when the latency differenceincreases, active users issue a larger number of clicks on results that are served with higher latency.
In the second experiment, we analyse pairs of queries that were served with comparable responselatencies and issued by users belonging to different activity levels. This gives us 36.5 million pairs.We are interested in the following cases:
• Active-click: Active user clicked at least one result while inactive user did not click any result.• Inactive-click: Inactive user clicked at least one result while active user did not click anyresult.• Active-click-more: At least one result was clicked for both queries, but active user clickedmore results.• Inactive-click-more: At least one result was clicked for both queries, but inactive user clickedmore results.
ACM Transactions on Information Systems, Vol. 9, No. 4, Article 39. Publication date: March 2017.
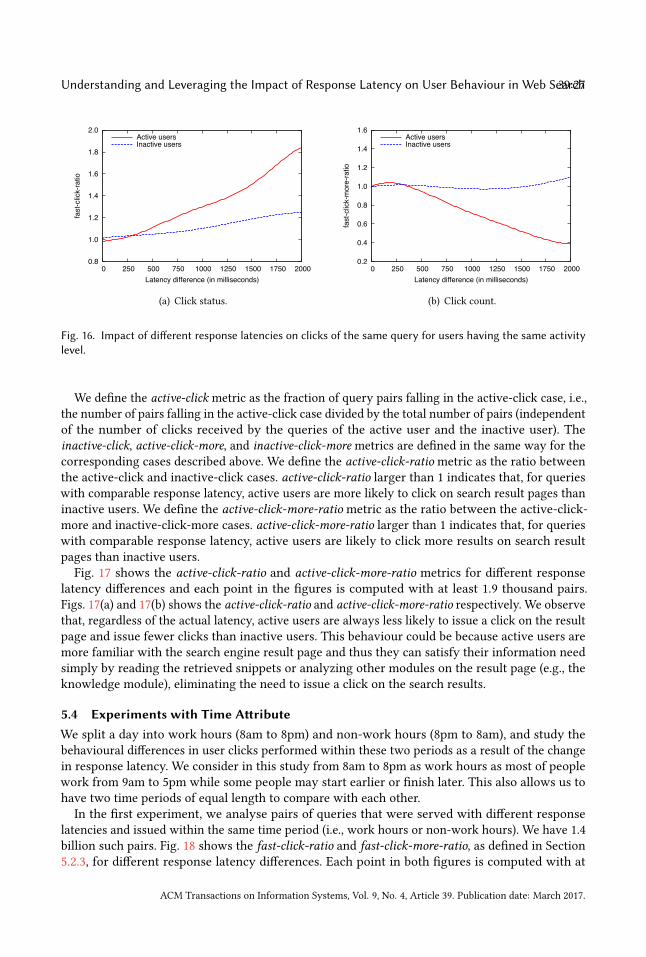
Understanding and Leveraging the Impact of Response Latency on User Behaviour in Web Search39:27
0.8
1.0
1.2
1.4
1.6
1.8
2.0
0 250 500 750 1000 1250 1500 1750 2000
fast
-clic
k-ra
tio
Latency difference (in milliseconds)
Active usersInactive users
(a) Click status.
0.2
0.4
0.6
0.8
1.0
1.2
1.4
1.6
0 250 500 750 1000 1250 1500 1750 2000
fast
-clic
k-m
ore-
ratio
Latency difference (in milliseconds)
Active usersInactive users
(b) Click count.
Fig. 16. Impact of different response latencies on clicks of the same query for users having the same activitylevel.
We define the active-click metric as the fraction of query pairs falling in the active-click case, i.e.,the number of pairs falling in the active-click case divided by the total number of pairs (independentof the number of clicks received by the queries of the active user and the inactive user). Theinactive-click, active-click-more, and inactive-click-more metrics are defined in the same way for thecorresponding cases described above. We define the active-click-ratio metric as the ratio betweenthe active-click and inactive-click cases. active-click-ratio larger than 1 indicates that, for querieswith comparable response latency, active users are more likely to click on search result pages thaninactive users. We define the active-click-more-ratio metric as the ratio between the active-click-more and inactive-click-more cases. active-click-more-ratio larger than 1 indicates that, for querieswith comparable response latency, active users are likely to click more results on search resultpages than inactive users.Fig. 17 shows the active-click-ratio and active-click-more-ratio metrics for different response
latency differences and each point in the figures is computed with at least 1.9 thousand pairs.Figs. 17(a) and 17(b) shows the active-click-ratio and active-click-more-ratio respectively. We observethat, regardless of the actual latency, active users are always less likely to issue a click on the resultpage and issue fewer clicks than inactive users. This behaviour could be because active users aremore familiar with the search engine result page and thus they can satisfy their information needsimply by reading the retrieved snippets or analyzing other modules on the result page (e.g., theknowledge module), eliminating the need to issue a click on the search results.
5.4 Experiments with Time AttributeWe split a day into work hours (8am to 8pm) and non-work hours (8pm to 8am), and study thebehavioural differences in user clicks performed within these two periods as a result of the changein response latency. We consider in this study from 8am to 8pm as work hours as most of peoplework from 9am to 5pm while some people may start earlier or finish later. This also allows us tohave two time periods of equal length to compare with each other.In the first experiment, we analyse pairs of queries that were served with different response
latencies and issued within the same time period (i.e., work hours or non-work hours). We have 1.4billion such pairs. Fig. 18 shows the fast-click-ratio and fast-click-more-ratio, as defined in Section5.2.3, for different response latency differences. Each point in both figures is computed with at
ACM Transactions on Information Systems, Vol. 9, No. 4, Article 39. Publication date: March 2017.
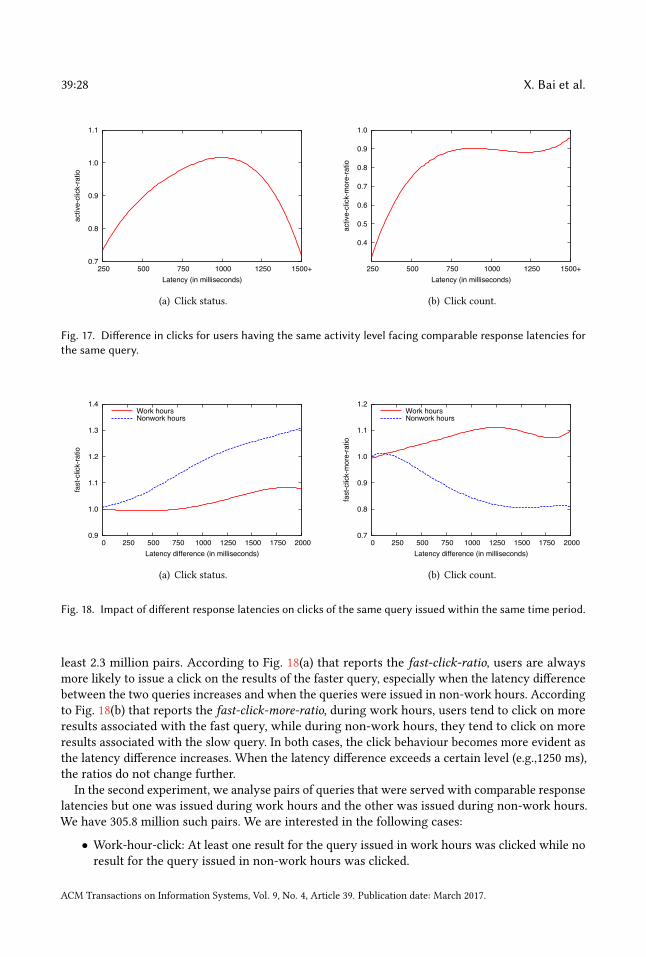
39:28 X. Bai et al.
0.7
0.8
0.9
1.0
1.1
250 500 750 1000 1250 1500+
activ
e-cl
ick-
ratio
Latency (in milliseconds)
(a) Click status.
0.4
0.5
0.6
0.7
0.8
0.9
1.0
250 500 750 1000 1250 1500+
activ
e-cl
ick-
mor
e-ra
tio
Latency (in milliseconds)
(b) Click count.
Fig. 17. Difference in clicks for users having the same activity level facing comparable response latencies forthe same query.
0.9
1.0
1.1
1.2
1.3
1.4
0 250 500 750 1000 1250 1500 1750 2000
fast
-clic
k-ra
tio
Latency difference (in milliseconds)
Work hoursNonwork hours
(a) Click status.
0.7
0.8
0.9
1.0
1.1
1.2
0 250 500 750 1000 1250 1500 1750 2000
fast
-clic
k-m
ore-
ratio
Latency difference (in milliseconds)
Work hoursNonwork hours
(b) Click count.
Fig. 18. Impact of different response latencies on clicks of the same query issued within the same time period.
least 2.3 million pairs. According to Fig. 18(a) that reports the fast-click-ratio, users are alwaysmore likely to issue a click on the results of the faster query, especially when the latency differencebetween the two queries increases and when the queries were issued in non-work hours. Accordingto Fig. 18(b) that reports the fast-click-more-ratio, during work hours, users tend to click on moreresults associated with the fast query, while during non-work hours, they tend to click on moreresults associated with the slow query. In both cases, the click behaviour becomes more evident asthe latency difference increases. When the latency difference exceeds a certain level (e.g.,1250 ms),the ratios do not change further.
In the second experiment, we analyse pairs of queries that were served with comparable responselatencies but one was issued during work hours and the other was issued during non-work hours.We have 305.8 million such pairs. We are interested in the following cases:
• Work-hour-click: At least one result for the query issued in work hours was clicked while noresult for the query issued in non-work hours was clicked.
ACM Transactions on Information Systems, Vol. 9, No. 4, Article 39. Publication date: March 2017.
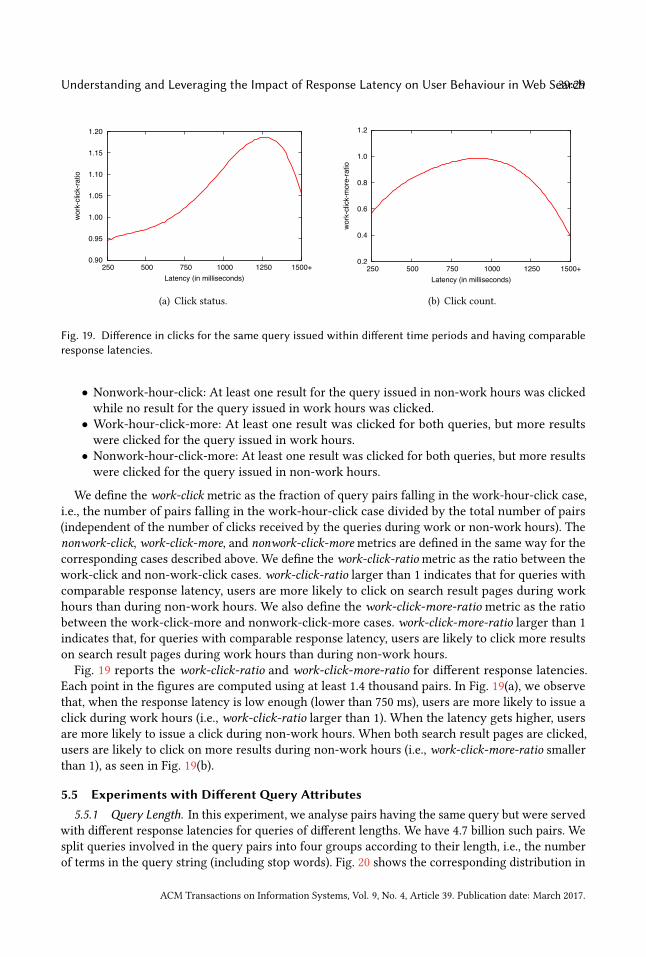
Understanding and Leveraging the Impact of Response Latency on User Behaviour in Web Search39:29
0.90
0.95
1.00
1.05
1.10
1.15
1.20
250 500 750 1000 1250 1500+
wor
k-cl
ick-
ratio
Latency (in milliseconds)
(a) Click status.
0.2
0.4
0.6
0.8
1.0
1.2
250 500 750 1000 1250 1500+
wor
k-cl
ick-
mor
e-ra
tio
Latency (in milliseconds)
(b) Click count.
Fig. 19. Difference in clicks for the same query issued within different time periods and having comparableresponse latencies.
• Nonwork-hour-click: At least one result for the query issued in non-work hours was clickedwhile no result for the query issued in work hours was clicked.• Work-hour-click-more: At least one result was clicked for both queries, but more resultswere clicked for the query issued in work hours.• Nonwork-hour-click-more: At least one result was clicked for both queries, but more resultswere clicked for the query issued in non-work hours.
We define the work-click metric as the fraction of query pairs falling in the work-hour-click case,i.e., the number of pairs falling in the work-hour-click case divided by the total number of pairs(independent of the number of clicks received by the queries during work or non-work hours). Thenonwork-click, work-click-more, and nonwork-click-moremetrics are defined in the same way for thecorresponding cases described above. We define the work-click-ratiometric as the ratio between thework-click and non-work-click cases. work-click-ratio larger than 1 indicates that for queries withcomparable response latency, users are more likely to click on search result pages during workhours than during non-work hours. We also define the work-click-more-ratio metric as the ratiobetween the work-click-more and nonwork-click-more cases. work-click-more-ratio larger than 1indicates that, for queries with comparable response latency, users are likely to click more resultson search result pages during work hours than during non-work hours.Fig. 19 reports the work-click-ratio and work-click-more-ratio for different response latencies.
Each point in the figures are computed using at least 1.4 thousand pairs. In Fig. 19(a), we observethat, when the response latency is low enough (lower than 750 ms), users are more likely to issue aclick during work hours (i.e., work-click-ratio larger than 1). When the latency gets higher, usersare more likely to issue a click during non-work hours. When both search result pages are clicked,users are likely to click on more results during non-work hours (i.e., work-click-more-ratio smallerthan 1), as seen in Fig. 19(b).
5.5 Experiments with DifferentQuery Attributes5.5.1 Query Length. In this experiment, we analyse pairs having the same query but were served
with different response latencies for queries of different lengths. We have 4.7 billion such pairs. Wesplit queries involved in the query pairs into four groups according to their length, i.e., the numberof terms in the query string (including stop words). Fig. 20 shows the corresponding distribution in
ACM Transactions on Information Systems, Vol. 9, No. 4, Article 39. Publication date: March 2017.

39:30 X. Bai et al.
0.21
0.22
0.23
0.24
0.25
0.26
0.27
0.28
0.29
1 2 3 4+
Frac
tion
of q
uerie
s
Query length
Fig. 20. Distribution of query length.
0.5
1.0
1.5
2.0
2.5
3.0
3.5
4.0
0 250 500 750 1000 1250 1500 1750 2000
fast
-clic
k-ra
tio
Latency difference (in milliseconds)
qLength: 1qLength: 2qLength: 3qLength: 4+
(a) Click status.
0.5
1.0
1.5
2.0
2.5
0 250 500 750 1000 1250 1500 1750 2000
fast
-clic
k-m
ore-
ratio
Latency difference (in milliseconds)
qLength: 1qLength: 2qLength: 3qLength: 4+
(b) Click count.
Fig. 21. Impact of different response latencies on clicks for queries with same lengths.
our sample. Fig. 21 reports the fast-click-ratio and fast-click-more-ratio, as defined in Section 5.2.3,respectively. Each point in the figures is computed using at least 2.5 million pairs. According toFig. 21(a), when the query contains only one term or more than four terms, users are more likely toissue a click on search results returned with low latency. For queries with two or three terms andthe latency differences below 1250 ms, users do not show a clear preference towards any of thequeries in the pair. When the latency difference increases, users are more likely to issue a clickon the results of the fast query if the query has two terms, and on the results of the slow query ifthe query has three terms. According to Fig. 21(b), for queries with one term, when the latencydifference increases, users are likely to issue more clicks on the results of the slow query. For longerqueries, users tend to issue more clicks on the results of the fast query.
5.5.2 Query Frequency. In this experiment, we analyse pairs having the same query but wereserved with different response latencies for queries of different frequency. We have 4.7 billion suchpairs. Fig. 22 shows the distribution of query frequency for the queries involved in the analysis.We split queries into three groups according to their frequency: queries that occurred at least twotimes but less than five times, queries that occurred at least five times but less than 100 times, andqueries that occurred more than 100 times. We note that we did not consider queries that wereissued only once since such singleton queries could not be paired with any other query.
ACM Transactions on Information Systems, Vol. 9, No. 4, Article 39. Publication date: March 2017.
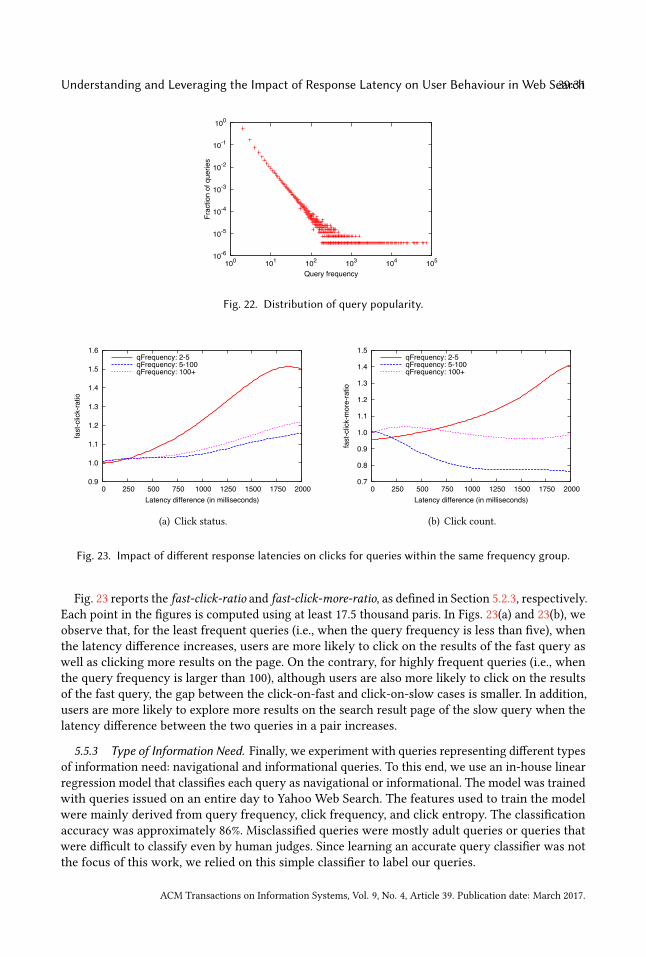
Understanding and Leveraging the Impact of Response Latency on User Behaviour in Web Search39:31
10-6
10-5
10-4
10-3
10-2
10-1
100
100 101 102 103 104 105
Frac
tion
of q
uerie
s
Query frequency
Fig. 22. Distribution of query popularity.
0.9
1.0
1.1
1.2
1.3
1.4
1.5
1.6
0 250 500 750 1000 1250 1500 1750 2000
fast
-clic
k-ra
tio
Latency difference (in milliseconds)
qFrequency: 2-5qFrequency: 5-100qFrequency: 100+
(a) Click status.
0.7
0.8
0.9
1.0
1.1
1.2
1.3
1.4
1.5
0 250 500 750 1000 1250 1500 1750 2000
fast
-clic
k-m
ore-
ratio
Latency difference (in milliseconds)
qFrequency: 2-5qFrequency: 5-100qFrequency: 100+
(b) Click count.
Fig. 23. Impact of different response latencies on clicks for queries within the same frequency group.
Fig. 23 reports the fast-click-ratio and fast-click-more-ratio, as defined in Section 5.2.3, respectively.Each point in the figures is computed using at least 17.5 thousand paris. In Figs. 23(a) and 23(b), weobserve that, for the least frequent queries (i.e., when the query frequency is less than five), whenthe latency difference increases, users are more likely to click on the results of the fast query aswell as clicking more results on the page. On the contrary, for highly frequent queries (i.e., whenthe query frequency is larger than 100), although users are also more likely to click on the resultsof the fast query, the gap between the click-on-fast and click-on-slow cases is smaller. In addition,users are more likely to explore more results on the search result page of the slow query when thelatency difference between the two queries in a pair increases.
5.5.3 Type of Information Need. Finally, we experiment with queries representing different typesof information need: navigational and informational queries. To this end, we use an in-house linearregression model that classifies each query as navigational or informational. The model was trainedwith queries issued on an entire day to Yahoo Web Search. The features used to train the modelwere mainly derived from query frequency, click frequency, and click entropy. The classificationaccuracy was approximately 86%. Misclassified queries were mostly adult queries or queries thatwere difficult to classify even by human judges. Since learning an accurate query classifier was notthe focus of this work, we relied on this simple classifier to label our queries.
ACM Transactions on Information Systems, Vol. 9, No. 4, Article 39. Publication date: March 2017.
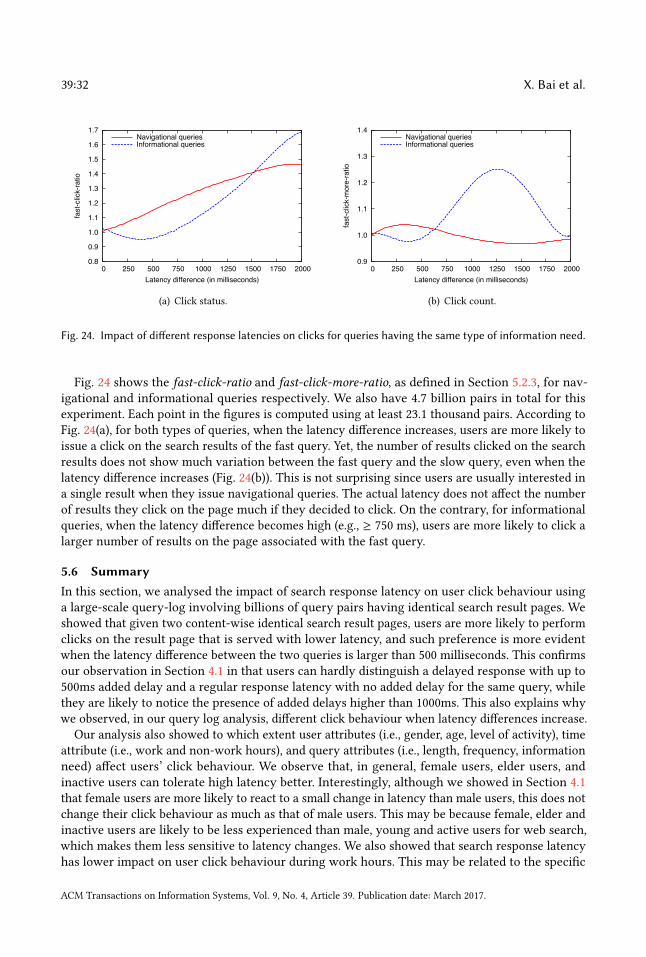
39:32 X. Bai et al.
0.8
0.9
1.0
1.1
1.2
1.3
1.4
1.5
1.6
1.7
0 250 500 750 1000 1250 1500 1750 2000
fast
-clic
k-ra
tio
Latency difference (in milliseconds)
Navigational queriesInformational queries
(a) Click status.
0.9
1.0
1.1
1.2
1.3
1.4
0 250 500 750 1000 1250 1500 1750 2000
fast
-clic
k-m
ore-
ratio
Latency difference (in milliseconds)
Navigational queriesInformational queries
(b) Click count.
Fig. 24. Impact of different response latencies on clicks for queries having the same type of information need.
Fig. 24 shows the fast-click-ratio and fast-click-more-ratio, as defined in Section 5.2.3, for nav-igational and informational queries respectively. We also have 4.7 billion pairs in total for thisexperiment. Each point in the figures is computed using at least 23.1 thousand pairs. According toFig. 24(a), for both types of queries, when the latency difference increases, users are more likely toissue a click on the search results of the fast query. Yet, the number of results clicked on the searchresults does not show much variation between the fast query and the slow query, even when thelatency difference increases (Fig. 24(b)). This is not surprising since users are usually interested ina single result when they issue navigational queries. The actual latency does not affect the numberof results they click on the page much if they decided to click. On the contrary, for informationalqueries, when the latency difference becomes high (e.g., ≥ 750 ms), users are more likely to click alarger number of results on the page associated with the fast query.
5.6 SummaryIn this section, we analysed the impact of search response latency on user click behaviour usinga large-scale query-log involving billions of query pairs having identical search result pages. Weshowed that given two content-wise identical search result pages, users are more likely to performclicks on the result page that is served with lower latency, and such preference is more evidentwhen the latency difference between the two queries is larger than 500 milliseconds. This confirmsour observation in Section 4.1 in that users can hardly distinguish a delayed response with up to500ms added delay and a regular response latency with no added delay for the same query, whilethey are likely to notice the presence of added delays higher than 1000ms. This also explains whywe observed, in our query log analysis, different click behaviour when latency differences increase.
Our analysis also showed to which extent user attributes (i.e., gender, age, level of activity), timeattribute (i.e., work and non-work hours), and query attributes (i.e., length, frequency, informationneed) affect users’ click behaviour. We observe that, in general, female users, elder users, andinactive users can tolerate high latency better. Interestingly, although we showed in Section 4.1that female users are more likely to react to a small change in latency than male users, this does notchange their click behaviour as much as that of male users. This may be because female, elder andinactive users are likely to be less experienced than male, young and active users for web search,which makes them less sensitive to latency changes. We also showed that search response latencyhas lower impact on user click behaviour during work hours. This may be related to the specific
ACM Transactions on Information Systems, Vol. 9, No. 4, Article 39. Publication date: March 2017.
Understanding and Leveraging the Impact of Response Latency on User Behaviour in Web Search39:33
tasks users need to accomplish for their work with certain time constraints while during non-workhours they have more freedom to abandon a search session if the search result page is returnedunder high latency, or explore deeper in the search result page when it contains relevant resultseven if it is slower. Finally, we observe that users have better tolerance on response latency forlong queries, infrequent queries and, informational queries. This may be because such queries areusually more difficult to answer. Therefore, most users are still willing to spend time and issueclicks to receive relevant information even if their search results are returned with higher latency.
Our query log analysis investigated the effect of response latency on the click behaviour of usersin the short term, while [42] reported results about the change in query volume in the long term.Hence, the results of the two works are not directly comparable. [46] reported a decrease in thelikelihood that the users will tend to click less on a search result as response latency increases. Inthis respect, the main finding of our query log analysis is consistent with [46]. However, unlike [46],we observed that, if the response latency increases too much, the users will tend to click more onthe result pages because they prefer to submit new queries to the search engine. In the next section,we show how the findings in this section can be leveraged to help predicting user click behaviourin web search.
6 LEVERAGING RESPONSE LATENCY TO PREDICT CLICK BEHAVIOURAs we have demonstrated in previous sections, users exhibit a high variation in the way theyperceive the response latency of a web search engine, depending on user attributes, temporalcontext, query attributes, and potentially various other parameters. In this section, we devise amachine learning framework that exploits such attributes, together with certain latency features,to predict whether a user will issue any click on the retrieved web search results or not. We notethat our objective here is not to create a full-fledged click prediction framework using an extensiveset of features, but rather to provide evidence on the utility of response latency in predicting userclick behaviour in web search.
6.1 Experimental SettingWe pose the click prediction problem as a binary classification problem where the classificationtarget is whether the user will issue a click on the retrieved web search results (isClicked) or not(isNotClicked), when exposed to a certain search response latency. To this end, we use a large,random sample of queries obtained from Yahoo Web Search. We place each query in a latencybin according to its latency value. The latency bins are created in increments of 250 ms (we alsomaintain a bin that contains all queries). We opt for this design because we anticipate a variationin user click behaviour depending on the experienced search response latency, as demonstrated byour earlier analyses in Sections 4 and 5. By modelling the click behaviour for different responselatency ranges, we aim to improve our models’ accuracy. Table 7 shows the distribution of isClickedand isNotClicked classes, for different response latency bins. The class sizes exhibit an imbalanceof approximately 70%–30%, isClicked being the larger class.For our predictive modelling task, we train a Random Forest classifier5 for each latency bin
using the features shown in Table 8. Prior to that, we perform feature selection using a wrappermethod that evaluates multiple models using procedures that add and remove features, until findingan optimal combination that maximises the model’s performance. More specifically, we use arecursive feature elimination algorithm6 that fits all predictors, ranks each predictor accordingto its importance, and, finally, retains the top-ranked predictors which are refitted to the model
5https://cran.r-project.org/web/packages/randomForest/index.html6https://cran.r-project.org/package=caret
ACM Transactions on Information Systems, Vol. 9, No. 4, Article 39. Publication date: March 2017.
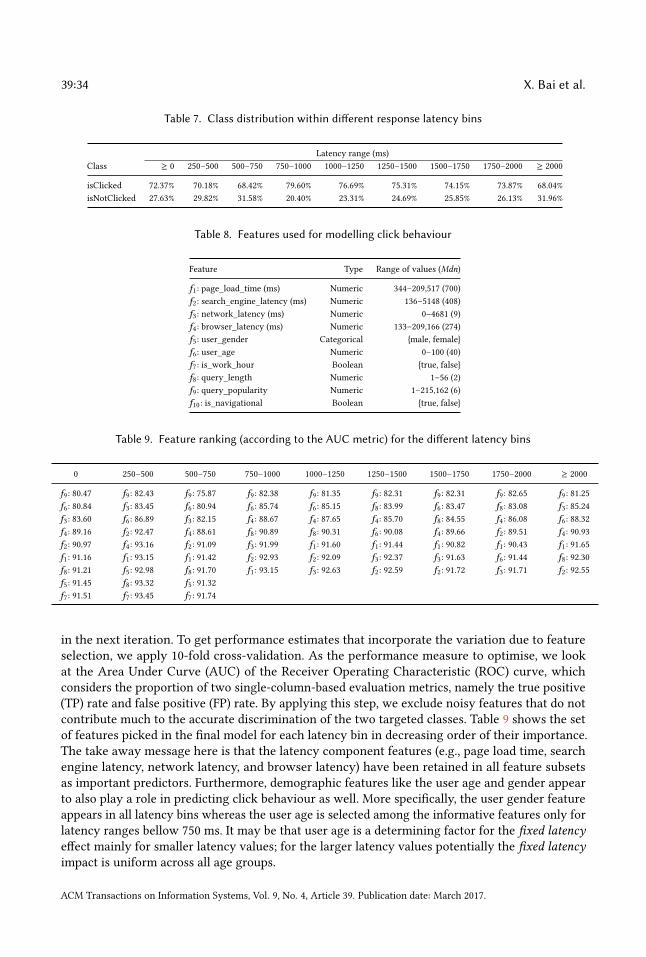
39:34 X. Bai et al.
Table 7. Class distribution within different response latency bins
Latency range (ms)Class ≥ 0 250–500 500–750 750–1000 1000–1250 1250–1500 1500–1750 1750–2000 ≥ 2000
isClicked 72.37% 70.18% 68.42% 79.60% 76.69% 75.31% 74.15% 73.87% 68.04%isNotClicked 27.63% 29.82% 31.58% 20.40% 23.31% 24.69% 25.85% 26.13% 31.96%
Table 8. Features used for modelling click behaviour
Feature Type Range of values (Mdn)
f1 : page_load_time (ms) Numeric 344–209,517 (700)f2 : search_engine_latency (ms) Numeric 136–5148 (408)f3 : network_latency (ms) Numeric 0–4681 (9)f4 : browser_latency (ms) Numeric 133–209,166 (274)f5 : user_gender Categorical {male, female}f6 : user_age Numeric 0–100 (40)f7 : is_work_hour Boolean {true, false}f8 : query_length Numeric 1–56 (2)f9 : query_popularity Numeric 1–215,162 (6)f10 : is_navigational Boolean {true, false}
Table 9. Feature ranking (according to the AUC metric) for the different latency bins
0 250–500 500–750 750–1000 1000–1250 1250–1500 1500–1750 1750–2000 ≥ 2000
f9 : 80.47 f9 : 82.43 f9 : 75.87 f9 : 82.38 f9 : 81.35 f9 : 82.31 f9 : 82.31 f9 : 82.65 f9 : 81.25f6 : 80.84 f3 : 83.45 f6 : 80.94 f6 : 85.74 f6 : 85.15 f8 : 83.99 f6 : 83.47 f8 : 83.08 f3 : 85.24f3 : 83.60 f6 : 86.89 f3 : 82.15 f4 : 88.67 f4 : 87.65 f4 : 85.70 f8 : 84.55 f4 : 86.08 f6 : 88.32f4 : 89.16 f2 : 92.47 f4 : 88.61 f8 : 90.89 f8 : 90.31 f6 : 90.08 f4 : 89.66 f2 : 89.51 f4 : 90.93f2 : 90.97 f4 : 93.16 f2 : 91.09 f3 : 91.99 f1 : 91.60 f1 : 91.44 f1 : 90.82 f1 : 90.43 f1 : 91.65f1 : 91.16 f1 : 93.15 f1 : 91.42 f2 : 92.93 f2 : 92.09 f3 : 92.37 f3 : 91.63 f6 : 91.44 f8 : 92.30f8 : 91.21 f5 : 92.98 f8 : 91.70 f1 : 93.15 f3 : 92.63 f2 : 92.59 f2 : 91.72 f3 : 91.71 f2 : 92.55f5 : 91.45 f8 : 93.32 f5 : 91.32f7 : 91.51 f7 : 93.45 f7 : 91.74
in the next iteration. To get performance estimates that incorporate the variation due to featureselection, we apply 10-fold cross-validation. As the performance measure to optimise, we lookat the Area Under Curve (AUC) of the Receiver Operating Characteristic (ROC) curve, whichconsiders the proportion of two single-column-based evaluation metrics, namely the true positive(TP) rate and false positive (FP) rate. By applying this step, we exclude noisy features that do notcontribute much to the accurate discrimination of the two targeted classes. Table 9 shows the setof features picked in the final model for each latency bin in decreasing order of their importance.The take away message here is that the latency component features (e.g., page load time, searchengine latency, network latency, and browser latency) have been retained in all feature subsetsas important predictors. Furthermore, demographic features like the user age and gender appearto also play a role in predicting click behaviour as well. More specifically, the user gender featureappears in all latency bins whereas the user age is selected among the informative features only forlatency ranges bellow 750 ms. It may be that user age is a determining factor for the fixed latencyeffect mainly for smaller latency values; for the larger latency values potentially the fixed latencyimpact is uniform across all age groups.
ACM Transactions on Information Systems, Vol. 9, No. 4, Article 39. Publication date: March 2017.
Understanding and Leveraging the Impact of Response Latency on User Behaviour in Web Search39:35
We perform 10-fold cross-validation, using stratified sampling, to create balanced splits of the datathat preserve the overall class distribution. In each fold, we retain 90% of our data for training and10% for testing. We also held out a small subset of our training data for fine-tuning the classifier’shyper-parameters (e.g., ϵ-threshold, number of trees, minimum size of terminal nodes, maximumnumber of terminal nodes) and apply the optimal parameter values to our final model. To deal withimbalanced training sets using the random forest algorithm, several approaches are possible like theBalanced Random Forest (BRF), Weighted Random Forest (WRF), One-side Sampling, SHRINK, andSMOTE. We opt for the synthetic minority oversampling technique (SMOTE), which is a powerfulmethod that has proven successful in various applications [12].The SMOTE algorithm creates artificial data based on the feature space similarities between
existing minority examples. More specifically, for subset Smin ∈ S , we consider the K-nearestneighbours for each example xi ∈ Smin . The K-nearest neighbours are defined as the K elementsof Smin whose euclidian distance between itself and xi exhibits the smallest magnitude along then-dimensions of the feature space X . To generate a synthetic sample, the algorithm selects inrandom one of the K-nearest neighbours and multiplies the corresponding feature vector differencewith a random number between [0,1], and, finally, adds this vector to xi
xnew = xi + (x̂i − xi ) × δ (1)
where xi ∈ Smin is the minority instance under consideration, x̂i is one of the K-nearestneighbours for xi : x̂i ∈ Smin , and δ ∈ [0, 1] is a random number. As a result, the synthetic instanceaccording to 1 is a point along the line segment joining xi under consideration and the randomlyselected K-nearest neighbour x̂i . In our case, we set the number of K-nearest neighbours to K = 5.In addition to oversampling the minority class, we downsample the majority class using randomselection.Finally, we assess the performance of our final model against the test set in each fold. We note
that we do not manipulate the class instances of the test set, which retains the original classdistribution. For our evaluation we consider the standard IR metrics of Precision, Recall, andAccuracy. Traditionally, the most frequently used metrics are Accuracy and Error Rate. However,metrics such as Accuracy can be deceiving in certain situations and are highly sensitive to changesin data. Therefore, we also compute the F-Measure, which combines Precision and Recall as ameasure of the effectiveness of classification in terms of a ratio of the weighted importance oneither Recall or Precision, as determined by the β coefficient. Finally, we compute the AUC metric.
6.2 Experimental ResultsTable 10 provides a detailed overview of our model’s micro-average performance over the ten folds,with respect to the selected metrics, and across the different response latency bins. The first set ofrows shows the Precision, Recall and F-Measure for the positive class (majority class), the secondset of rows shows the same metrics for the negative class (minority class), and the last set of rowsshows the the weighted average version of them. In the last row, the table shows the AUC whichwe choose as our primary performance indicator since it is more suitable for data with imbalancedclasses. Moreover, the AUC is not a function of the cutoff score used by the model; it is rather anevaluation of its performance as the cutoff score varies over all possible values.
We compare our model against a Baseline (shown in Table 11) that always predicts the majorityclass. We apply the Mann Witney U test for stochastic dominance to determine the cases where ourmodel performs significantly better than the Baseline (indicated with ∗ in Table 10) and providethe correspondingU statistic. To this end, we apply a post-hoc analysis involving multiple pairwise
ACM Transactions on Information Systems, Vol. 9, No. 4, Article 39. Publication date: March 2017.
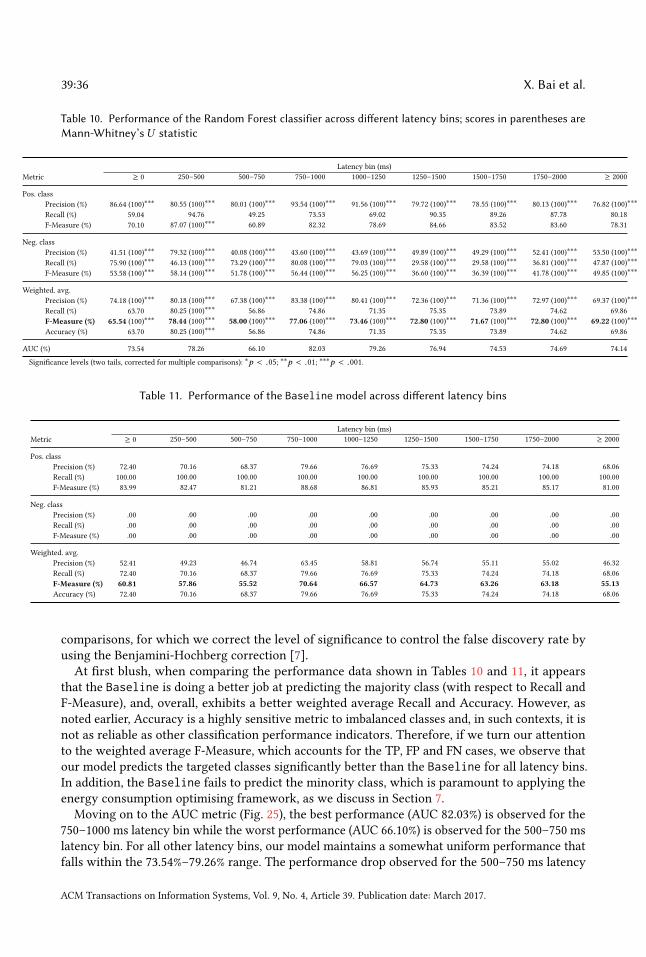
39:36 X. Bai et al.
Table 10. Performance of the Random Forest classifier across different latency bins; scores in parentheses areMann-Whitney’sU statistic
Latency bin (ms)Metric ≥ 0 250–500 500–750 750–1000 1000–1250 1250–1500 1500–1750 1750–2000 ≥ 2000
Pos. classPrecision (%) 86.64 (100)∗∗∗ 80.55 (100)∗∗∗ 80.01 (100)∗∗∗ 93.54 (100)∗∗∗ 91.56 (100)∗∗∗ 79.72 (100)∗∗∗ 78.55 (100)∗∗∗ 80.13 (100)∗∗∗ 76.82 (100)∗∗∗
Recall (%) 59.04 94.76 49.25 73.53 69.02 90.35 89.26 87.78 80.18F-Measure (%) 70.10 87.07 (100)∗∗∗ 60.89 82.32 78.69 84.66 83.52 83.60 78.31
Neg. classPrecision (%) 41.51 (100)∗∗∗ 79.32 (100)∗∗∗ 40.08 (100)∗∗∗ 43.60 (100)∗∗∗ 43.69 (100)∗∗∗ 49.89 (100)∗∗∗ 49.29 (100)∗∗∗ 52.41 (100)∗∗∗ 53.50 (100)∗∗∗
Recall (%) 75.90 (100)∗∗∗ 46.13 (100)∗∗∗ 73.29 (100)∗∗∗ 80.08 (100)∗∗∗ 79.03 (100)∗∗∗ 29.58 (100)∗∗∗ 29.58 (100)∗∗∗ 36.81 (100)∗∗∗ 47.87 (100)∗∗∗
F-Measure (%) 53.58 (100)∗∗∗ 58.14 (100)∗∗∗ 51.78 (100)∗∗∗ 56.44 (100)∗∗∗ 56.25 (100)∗∗∗ 36.60 (100)∗∗∗ 36.39 (100)∗∗∗ 41.78 (100)∗∗∗ 49.85 (100)∗∗∗
Weighted. avg.Precision (%) 74.18 (100)∗∗∗ 80.18 (100)∗∗∗ 67.38 (100)∗∗∗ 83.38 (100)∗∗∗ 80.41 (100)∗∗∗ 72.36 (100)∗∗∗ 71.36 (100)∗∗∗ 72.97 (100)∗∗∗ 69.37 (100)∗∗∗
Recall (%) 63.70 80.25 (100)∗∗∗ 56.86 74.86 71.35 75.35 73.89 74.62 69.86F-Measure (%) 65.54 (100)∗∗∗ 78.44 (100)∗∗∗ 58.00 (100)∗∗∗ 77.06 (100)∗∗∗ 73.46 (100)∗∗∗ 72.80 (100)∗∗∗ 71.67 (100)∗∗∗ 72.80 (100)∗∗∗ 69.22 (100)∗∗∗
Accuracy (%) 63.70 80.25 (100)∗∗∗ 56.86 74.86 71.35 75.35 73.89 74.62 69.86
AUC (%) 73.54 78.26 66.10 82.03 79.26 76.94 74.53 74.69 74.14
Significance levels (two tails, corrected for multiple comparisons): ∗p < .05; ∗∗p < .01; ∗∗∗p < .001.
Table 11. Performance of the Baseline model across different latency bins
Latency bin (ms)Metric ≥ 0 250–500 500–750 750–1000 1000–1250 1250–1500 1500–1750 1750–2000 ≥ 2000
Pos. classPrecision (%) 72.40 70.16 68.37 79.66 76.69 75.33 74.24 74.18 68.06Recall (%) 100.00 100.00 100.00 100.00 100.00 100.00 100.00 100.00 100.00F-Measure (%) 83.99 82.47 81.21 88.68 86.81 85.93 85.21 85.17 81.00
Neg. classPrecision (%) .00 .00 .00 .00 .00 .00 .00 .00 .00Recall (%) .00 .00 .00 .00 .00 .00 .00 .00 .00F-Measure (%) .00 .00 .00 .00 .00 .00 .00 .00 .00
Weighted. avg.Precision (%) 52.41 49.23 46.74 63.45 58.81 56.74 55.11 55.02 46.32Recall (%) 72.40 70.16 68.37 79.66 76.69 75.33 74.24 74.18 68.06F-Measure (%) 60.81 57.86 55.52 70.64 66.57 64.73 63.26 63.18 55.13Accuracy (%) 72.40 70.16 68.37 79.66 76.69 75.33 74.24 74.18 68.06
comparisons, for which we correct the level of significance to control the false discovery rate byusing the Benjamini-Hochberg correction [7].At first blush, when comparing the performance data shown in Tables 10 and 11, it appears
that the Baseline is doing a better job at predicting the majority class (with respect to Recall andF-Measure), and, overall, exhibits a better weighted average Recall and Accuracy. However, asnoted earlier, Accuracy is a highly sensitive metric to imbalanced classes and, in such contexts, it isnot as reliable as other classification performance indicators. Therefore, if we turn our attentionto the weighted average F-Measure, which accounts for the TP, FP and FN cases, we observe thatour model predicts the targeted classes significantly better than the Baseline for all latency bins.In addition, the Baseline fails to predict the minority class, which is paramount to applying theenergy consumption optimising framework, as we discuss in Section 7.Moving on to the AUC metric (Fig. 25), the best performance (AUC 82.03%) is observed for the
750–1000 ms latency bin while the worst performance (AUC 66.10%) is observed for the 500–750 mslatency bin. For all other latency bins, our model maintains a somewhat uniform performance thatfalls within the 73.54%–79.26% range. The performance drop observed for the 500–750 ms latency
ACM Transactions on Information Systems, Vol. 9, No. 4, Article 39. Publication date: March 2017.
Understanding and Leveraging the Impact of Response Latency on User Behaviour in Web Search39:37
bin may be due to the inherent noise of the respective data. As our analysis has indicated, usersare highly likely to notice (and be affected by) the presence of delays when the delays are largerthan 1000 ms, whereas delays under 500 ms are not easily perceivable (see Section 4). This suggeststhat there is a latency window between 500 ms and 1000 ms, where the response latency becomesgradually noticeable, but it is also subject to the large variation in users’ ability to perceive it (Figs. 8and 9). As a consequence, the prediction of users’ click behaviour becomes even more challengingfor the particular latency bin.
Another interesting finding is that our prediction accuracy improves when we trained our modelsusing individual latency bins rather than the whole query sample (the ≥ 0 ms bin). We note that,for the ≥ 0 ms bin, our model achieves an AUC value of 73.54%, which is not a truly representativeperformance given that AUC values observed for all other response latency bins exhibit a largevariation (values are in the 66%–82% range). By allocating queries into relatively homogeneous bins(analogous to strata in stratified sampling), we reduce the noise and compute more reliable estimatesof our models’ performance. We argue that the observed variation indicates an interaction betweenthe range of response latency and click behaviour, which we are able to learn more accuratelythrough our design. Furthermore, we observe that our models perform best for the response latencybins of 250–500 ms and 750–1500 ms. These bins are of particular interest since they represent theearly- and mid-stage latencies encountered in today’s web search engines. This can be exploitedto determine which query processing mechanism to apply and towards which goal (e.g., usingless hardware resources, prioritising time-critical queries, etc.). Finally, considering the existingconventions for interpreting AUC values, the reported models performances suggest that we canexploit prior knowledge about the user-perceived response latency to infer users’ click behaviour(RQ6), despite the somewhat simple feature set we used and the challenging nature of the clickprediction problem.The framework we introduced in this section for click prediction may be useful in different
scenarios related to search efficiency. For example, if we can accurately predict beyond what pointa user is not likely to click on a search result, we can schedule execution of queries [34] in sucha way that queries issued by users whose search experience is more likely to be affected by highlatency are processed earlier than the others. As another example, we may terminate processing ofqueries as soon as we predict that the user will not issue any click on the search results due to highresponse latency. Such an optimisation may lead to energy savings for the search engine as in theuse case we will demonstrate in the next section.
7 USE CASE: REDUCING THE ENERGY CONSUMPTION OFWEB SEARCH ENGINES7.1 MotivationIn this section, we address the research question RQ7 by presenting a use case where the clickprediction model introduced in the previous section is leveraged to reduce the energy consumptionof a web search engine. The basic idea behind this optimisation is to terminate the processing ofa query early and present the user some partially computed search results, instead of the fullycomputed results, if the computational of the query takes too much time and the user engagementis predicted to be affected due to high response latency.7 That is, in this technique, the search engineprefers serving lower quality results with reasonable latency to serving its best quality results withintolerable latency (i.e., when the user-perceived latency is expected to have an impact on userengagement).
7We assume that the quality of the search results are improved in an incremental fashion as more postings are processedand relevance scores are computed for more documents. We also assume that the clicks on search results positively correlatewith user engagement.
ACM Transactions on Information Systems, Vol. 9, No. 4, Article 39. Publication date: March 2017.
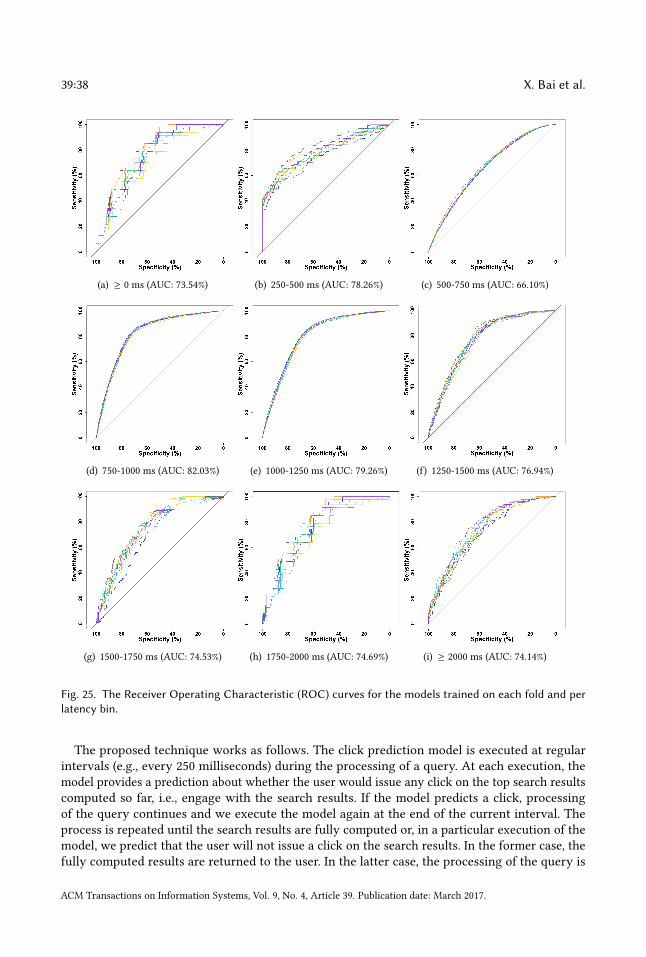
39:38 X. Bai et al.
(a) ≥ 0 ms (AUC: 73.54%) (b) 250-500 ms (AUC: 78.26%) (c) 500-750 ms (AUC: 66.10%)
(d) 750-1000 ms (AUC: 82.03%) (e) 1000-1250 ms (AUC: 79.26%) (f) 1250-1500 ms (AUC: 76.94%)
(g) 1500-1750 ms (AUC: 74.53%) (h) 1750-2000 ms (AUC: 74.69%) (i) ≥ 2000 ms (AUC: 74.14%)
Fig. 25. The Receiver Operating Characteristic (ROC) curves for the models trained on each fold and perlatency bin.
The proposed technique works as follows. The click prediction model is executed at regularintervals (e.g., every 250 milliseconds) during the processing of a query. At each execution, themodel provides a prediction about whether the user would issue any click on the top search resultscomputed so far, i.e., engage with the search results. If the model predicts a click, processingof the query continues and we execute the model again at the end of the current interval. Theprocess is repeated until the search results are fully computed or, in a particular execution of themodel, we predict that the user will not issue a click on the search results. In the former case, thefully computed results are returned to the user. In the latter case, the processing of the query is
ACM Transactions on Information Systems, Vol. 9, No. 4, Article 39. Publication date: March 2017.
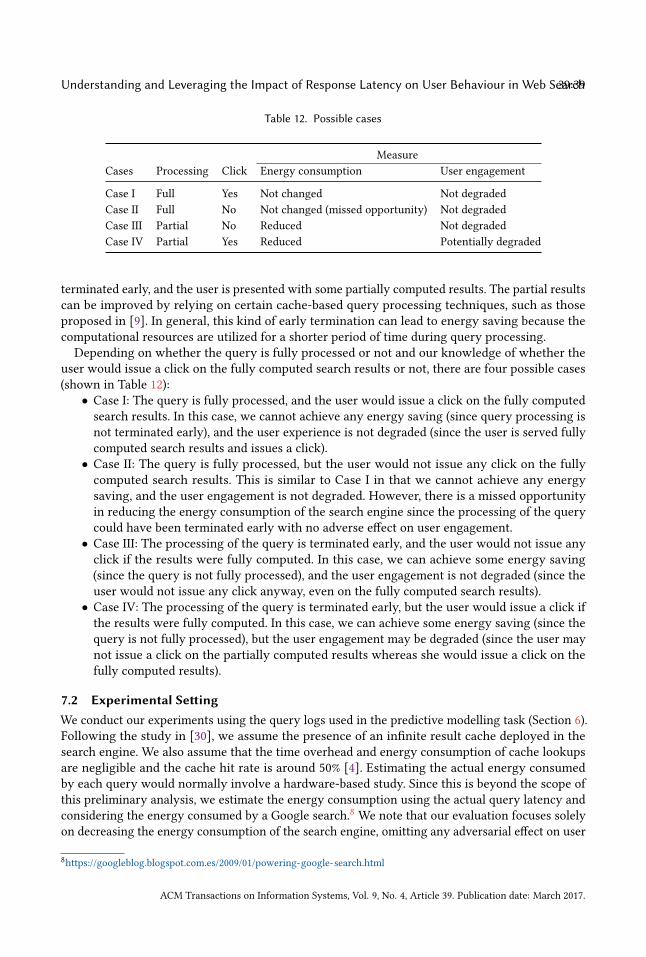
Understanding and Leveraging the Impact of Response Latency on User Behaviour in Web Search39:39
Table 12. Possible cases
MeasureCases Processing Click Energy consumption User engagement
Case I Full Yes Not changed Not degradedCase II Full No Not changed (missed opportunity) Not degradedCase III Partial No Reduced Not degradedCase IV Partial Yes Reduced Potentially degraded
terminated early, and the user is presented with some partially computed results. The partial resultscan be improved by relying on certain cache-based query processing techniques, such as thoseproposed in [9]. In general, this kind of early termination can lead to energy saving because thecomputational resources are utilized for a shorter period of time during query processing.Depending on whether the query is fully processed or not and our knowledge of whether the
user would issue a click on the fully computed search results or not, there are four possible cases(shown in Table 12):• Case I: The query is fully processed, and the user would issue a click on the fully computedsearch results. In this case, we cannot achieve any energy saving (since query processing isnot terminated early), and the user experience is not degraded (since the user is served fullycomputed search results and issues a click).• Case II: The query is fully processed, but the user would not issue any click on the fullycomputed search results. This is similar to Case I in that we cannot achieve any energysaving, and the user engagement is not degraded. However, there is a missed opportunityin reducing the energy consumption of the search engine since the processing of the querycould have been terminated early with no adverse effect on user engagement.• Case III: The processing of the query is terminated early, and the user would not issue anyclick if the results were fully computed. In this case, we can achieve some energy saving(since the query is not fully processed), and the user engagement is not degraded (since theuser would not issue any click anyway, even on the fully computed search results).• Case IV: The processing of the query is terminated early, but the user would issue a click ifthe results were fully computed. In this case, we can achieve some energy saving (since thequery is not fully processed), but the user engagement may be degraded (since the user maynot issue a click on the partially computed results whereas she would issue a click on thefully computed results).
7.2 Experimental SettingWe conduct our experiments using the query logs used in the predictive modelling task (Section 6).Following the study in [30], we assume the presence of an infinite result cache deployed in thesearch engine. We also assume that the time overhead and energy consumption of cache lookupsare negligible and the cache hit rate is around 50% [4]. Estimating the actual energy consumedby each query would normally involve a hardware-based study. Since this is beyond the scope ofthis preliminary analysis, we estimate the energy consumption using the actual query latency andconsidering the energy consumed by a Google search.8 We note that our evaluation focuses solelyon decreasing the energy consumption of the search engine, omitting any adversarial effect on user
8https://googleblog.blogspot.com.es/2009/01/powering-google-search.html
ACM Transactions on Information Systems, Vol. 9, No. 4, Article 39. Publication date: March 2017.
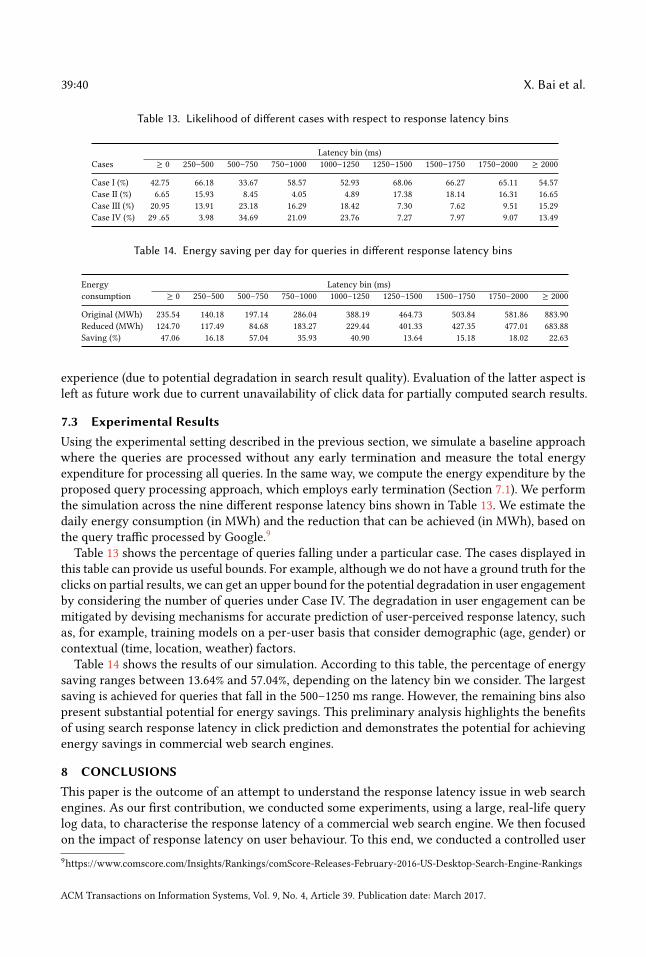
39:40 X. Bai et al.
Table 13. Likelihood of different cases with respect to response latency bins
Latency bin (ms)Cases ≥ 0 250–500 500–750 750–1000 1000–1250 1250–1500 1500–1750 1750–2000 ≥ 2000
Case I (%) 42.75 66.18 33.67 58.57 52.93 68.06 66.27 65.11 54.57Case II (%) 6.65 15.93 8.45 4.05 4.89 17.38 18.14 16.31 16.65Case III (%) 20.95 13.91 23.18 16.29 18.42 7.30 7.62 9.51 15.29Case IV (%) 29 .65 3.98 34.69 21.09 23.76 7.27 7.97 9.07 13.49
Table 14. Energy saving per day for queries in different response latency bins
Energy Latency bin (ms)consumption ≥ 0 250–500 500–750 750–1000 1000–1250 1250–1500 1500–1750 1750–2000 ≥ 2000
Original (MWh) 235.54 140.18 197.14 286.04 388.19 464.73 503.84 581.86 883.90Reduced (MWh) 124.70 117.49 84.68 183.27 229.44 401.33 427.35 477.01 683.88Saving (%) 47.06 16.18 57.04 35.93 40.90 13.64 15.18 18.02 22.63
experience (due to potential degradation in search result quality). Evaluation of the latter aspect isleft as future work due to current unavailability of click data for partially computed search results.
7.3 Experimental ResultsUsing the experimental setting described in the previous section, we simulate a baseline approachwhere the queries are processed without any early termination and measure the total energyexpenditure for processing all queries. In the same way, we compute the energy expenditure by theproposed query processing approach, which employs early termination (Section 7.1). We performthe simulation across the nine different response latency bins shown in Table 13. We estimate thedaily energy consumption (in MWh) and the reduction that can be achieved (in MWh), based onthe query traffic processed by Google.9
Table 13 shows the percentage of queries falling under a particular case. The cases displayed inthis table can provide us useful bounds. For example, although we do not have a ground truth for theclicks on partial results, we can get an upper bound for the potential degradation in user engagementby considering the number of queries under Case IV. The degradation in user engagement can bemitigated by devising mechanisms for accurate prediction of user-perceived response latency, suchas, for example, training models on a per-user basis that consider demographic (age, gender) orcontextual (time, location, weather) factors.Table 14 shows the results of our simulation. According to this table, the percentage of energy
saving ranges between 13.64% and 57.04%, depending on the latency bin we consider. The largestsaving is achieved for queries that fall in the 500–1250 ms range. However, the remaining bins alsopresent substantial potential for energy savings. This preliminary analysis highlights the benefitsof using search response latency in click prediction and demonstrates the potential for achievingenergy savings in commercial web search engines.
8 CONCLUSIONSThis paper is the outcome of an attempt to understand the response latency issue in web searchengines. As our first contribution, we conducted some experiments, using a large, real-life querylog data, to characterise the response latency of a commercial web search engine. We then focusedon the impact of response latency on user behaviour. To this end, we conducted a controlled user9https://www.comscore.com/Insights/Rankings/comScore-Releases-February-2016-US-Desktop-Search-Engine-Rankings
ACM Transactions on Information Systems, Vol. 9, No. 4, Article 39. Publication date: March 2017.
Understanding and Leveraging the Impact of Response Latency on User Behaviour in Web Search39:41
study and also performed a large-scale query log analysis. The user study revealed that up to acertain point (500ms) the added response time delays are not noticeable by the users. However,after a certain point (1000ms), the users could feel the added delays with very high likelihood.The query log analysis also revealed interesting findings about the change in user behaviour aslatency increases. In particular, given two content-wise identical search result pages, we showedthat the users are more likely to perform clicks on the result page that is served with lower latency.Moreover, additional analyses indicated that the degree to which response latency affects the clickbehaviour varies with the user, query, and context attributes. Finally, we presented a machinelearning framework that leverages the latency information in a click prediction task. Throughcarefully conducted experiments, we demonstrated the predictive power of this model and appliedit to a use case about achieving energy savings in web search engines.We believe that the subjective nature of perceived latency creates an opportunity for search
engines. Search results can be served to each user at custom latencies depending on the estimatedbehavioural impact on the user. For example, if no negative impact is estimated on the userexperience, search results may be served with high latencies by computing them using less resources.Serving results at right latencies may bring further financial benefits to search engines in the formof decreased hardware investments and reduced energy consumption. The machine learningframework we devised in this work and alike can be useful in such tasks. As a separate researchproblem, the existing prediction models for query processing latency can be extended to predictthe end-to-end, user-perceived latency values. Such models can find better use in practical searchsystems.
REFERENCES[1] Ioannis Arapakis, Xiao Bai, and B. Barla Cambazoglu. 2014. Impact of Response Latency on User Behavior in Web
Search. In Proceedings of the 37th International ACM SIGIR Conference on Research and Development in InformationRetrieval (SIGIR ’14). 103–112.
[2] Leif Azzopardi. 2011. The economics in interactive information retrieval. In Proc. 34th Int’l ACM SIGIR Conf. Researchand Development in Information Retrieval. 15–24.
[3] Leif Azzopardi, Diane Kelly, and Kathy Brennan. 2013. How query cost affects search behavior. In Proc. 36th Int’l ACMSIGIR Conf. Research and Development in Information Retrieval. 23–32.
[4] Ricardo Baeza-Yates, Aristides Gionis, Flavio Junqueira, Vanessa Murdock, Vassilis Plachouras, and Fabrizio Silvestri.2007. The Impact of Caching on Search Engines. In Proceedings of the 30th Annual International ACM SIGIR Conferenceon Research and Development in Information Retrieval (SIGIR ’07). ACM, New York, NY, USA, 183–190.
[5] Miguel Barreda-Ángeles, Ioannis Arapakis, Xiao Bai, B. Barla Cambazoglu, and Alexandre Pereda-Baños. 2015. Uncon-scious physiological effects of search latency on users and their click behaviour. In Proc. 38th Int’l ACM SIGIR Conf.Research and Development in Information Retrieval. 203–212.
[6] Feza Baskaya, Heikki Keskustalo, and Kalervo Järvelin. 2012. Time drives interaction: Simulating sessions in diversesearching environments. In Proc. 35th Int’l ACM SIGIR Conf. Research and Development in Information Retrieval. 105–114.
[7] Y. Benjamini and Y. Hochberg. 1995. Controlling the false discovery rate - a practical and powerful approach tomultiple testing. Journal of the Royal Statistical Society, Series B 57, 1 (1995), 289–300.
[8] Jake D. Brutlag, Hilary Hutchinson, and Maria Stone. 2008. User preference and search engine latency. In Proceedingsof the ASA Joint Statistical Meetings.
[9] B. Barla Cambazoglu, Ismail Sengor Altingovde, Rifat Ozcan, and Özgür Ulusoy. 2012. Cache-Based Query Processingfor Search Engines. ACM Trans. Web 6, 4, Article 14 (Nov. 2012), 24 pages.
[10] B. Barla Cambazoglu and Ricardo A. Baeza-Yates. 2015. Scalability Challenges in Web Search Engines. Morgan &Claypool Publishers.
[11] Matteo Catena, Craig Macdonald, and Nicola Tonellotto. 2015. Load-sensitive CPU Power Management for Web SearchEngines. In Proceedings of the 38th International ACM SIGIR Conference on Research and Development in InformationRetrieval (SIGIR ’15). ACM, New York, NY, USA, 751–754.
[12] N. V. Chawla, K. W. Bowyer, L. O. Hall, and W. P. Kegelmeyer. 2002. SMOTE: Synthetic Minority Over-SamplingTechnique. Journal of Artificial Intelligence Research 16, 321-357 (2002).
ACM Transactions on Information Systems, Vol. 9, No. 4, Article 39. Publication date: March 2017.
39:42 X. Bai et al.
[13] Haibin Cheng and Erick Cantú-Paz. 2010. Personalized Click Prediction in Sponsored Search. In Proceedings of theThird ACM International Conference on Web Search and Data Mining (WSDM ’10). ACM, New York, NY, USA, 351–360.
[14] Gobinda Chowdhury. 2012. An agenda for green information retrieval research. Inf. Process. Manage. 48, 6 (2012),1067–1077.
[15] Jim Dabrowski and Ethan V. Munson. 2011. 40 years of searching for the best computer system response rime. Interact.Comput. 23, 5 (2011), 555–564.
[16] Erica S. Davis and Donald A. Hantula. 2001. The effects of download delay on performance and end-user satisfactionin an Internet tutorial. Computers in Human Behavior 17, 3 (2001), 249–268.
[17] B. G. C. Dellaert and B. E. Kahn. 1999. How tolerable is delay: Consumers’ evaluations of Internet web sites afterwaiting. Journal of Interactive Marketing 13, 1 (1999), 41–54.
[18] Alan R. Dennis and Nolan J. Taylor. 2006. Information foraging on the Web: The effects of “acceptable” Internet delayson multi-page information search behavior. Decision Support Systems 42, 2 (2006), 810–824.
[19] Ana Freire, Craig Macdonald, Nicola Tonellotto, Iadh Ounis, and Fidel Cacheda. 2014. A Self-adapting Latency/PowerTradeoff Model for Replicated Search Engines. In Proceedings of the 7th ACM International Conference on Web Searchand Data Mining (WSDM ’14). ACM, New York, NY, USA, 13–22.
[20] Ana Freire, Craig Macdonald, Nicola Tonellotto, Iadh Ounis, and Fidel Cacheda. 2015. Queuing Theory-based La-tency/Power Tradeoff Models for Replicated Search Engines. 21, 13 (dec 2015), 1790–1809.
[21] Dennis F. Galletta, Raymond Henry, Scott McCoy, and Peter Polak. 2003. Web site delays: How tolerant are users?Journal of the Association for Information Systems 5 (2003), 1–28.
[22] J. Gwizdka and I. Lopatovska. 2009. The role of subjective factors in the information search process. Journal of theAmerican Society for Information Science and Technology 60, 12 (2009), 2452–2464.
[23] Marc Hassenzahl. 2004. Funology. In The Thing and I: Understanding the Relationship Between User and Product, Mark A.Blythe, Kees Overbeeke, Andrew F. Monk, and Peter C. Wright (Eds.). Kluwer Academic Publishers, 31–42.
[24] Xinran He, Junfeng Pan, Ou Jin, Tianbing Xu, Bo Liu, Tao Xu, Yanxin Shi, Antoine Atallah, Ralf Herbrich, StuartBowers, and Joaquin Quiñonero Candela. 2014. Practical Lessons from Predicting Clicks on Ads at Facebook. InProceedings of the Eighth International Workshop on Data Mining for Online Advertising (ADKDD’14). ACM, New York,NY, USA, Article 5, 9 pages.
[25] Seung-Won Hwang, Saehoon Kim, Yuxiong He, Sameh Elnikety, and Seungjin Choi. 2016. Prediction and Predictabilityfor Search Query Acceleration. ACM Transactions on the Web (TWEB) 10, 3 (2016), 19.
[26] Julie A. Jacko, Andrew Sears, and Michael S. Borella. 2000. The effect of network delay and media on user perceptionsof web resources. Behaviour & Information Technology 19, 6 (2000), 427–439.
[27] Vidit Jain and Manik Varma. 2011. Learning to Re-rank: Query-dependent Image Re-ranking Using Click Data. InProceedings of the 20th International Conference on World Wide Web (WWW ’11). ACM, New York, NY, USA, 277–286.
[28] Kalervo Järvelin and Jaana Kekäläinen. 2002. Cumulated gain-based evaluation of IR techniques. ACM Trans. Inf. Syst.20, 4 (2002), 422–446.
[29] Myeongjae Jeon, Saehoon Kim, Seung-won Hwang, Yuxiong He, Sameh Elnikety, Alan L. Cox, and Scott Rixner. 2014.Predictive parallelization: taming tail latencies in web search. In Proceedings of the 37th International ACM SIGIRConference on Research & Development in Information Retrieval. 253–262.
[30] Enver Kayaaslan, B. Barla Cambazoglu, Roi Blanco, Flavio P. Junqueira, and Cevdet Aykanat. 2011. Energy-price-drivenQuery Processing in Multi-center Web Search Engines. In Proceedings of the 34th International ACM SIGIR Conferenceon Research and Development in Information Retrieval (SIGIR ’11). ACM, New York, NY, USA, 983–992.
[31] Saehoon Kim, Yuxiong He, Seung-won Hwang, Sameh Elnikety, and Seungjin Choi. 2015. Delayed-dynamic-selective(DDS) prediction for reducing extreme tail latency in web search. In Proceedings of the Eighth ACM InternationalConference on Web Search and Data Mining. 7–16.
[32] James R. Lewis. 1995. IBM Computer Usability Satisfaction Questionnaires: Psychometric Evaluation and Instructionsfor Use. International Journal of Human-Computer Interaction 7, 1 (1995), 57–78.
[33] Irene Lopatovska. 2009. Searching for good mood: examining relationships between search task and mood. Proceedingsof the American Society for Information Science and Technology 46, 1 (2009), 1–13.
[34] Craig Macdonald, Nicola Tonellotto, and Iadh Ounis. 2012. Learning to predict response times for online queryscheduling. In Proceedings of the 35th International ACM SIGIR Conference on Research and Development in InformationRetrieval. 621–630.
[35] David Maxwell and Leif Azzopardi. 2014. Stuck in traffic: How temporal delays affect search behaviour. In Proceedingsof the 5th Information Interaction in Context Symposium (IIiX ’14). ACM, New York, NY, USA, 155–164.
[36] Lori McCay-Peet, Mounia Lalmas, and Vidhya Navalpakkam. 2012. On Saliency, Affect and Focused Attention. InACM SIGCHI Conference on Human Factors in Computing Systems (CHI ’12). ACM, New York, NY, USA, 541–550.
ACM Transactions on Information Systems, Vol. 9, No. 4, Article 39. Publication date: March 2017.
Understanding and Leveraging the Impact of Response Latency on User Behaviour in Web Search39:43
[37] H. Brendan McMahan, Gary Holt, D. Sculley, Michael Young, Dietmar Ebner, Julian Grady, Lan Nie, Todd Phillips,Eugene Davydov, Daniel Golovin, Sharat Chikkerur, Dan Liu, Martin Wattenberg, Arnar Mar Hrafnkelsson, TomBoulos, and Jeremy Kubica. 2013. Ad Click Prediction: A View from the Trenches. In Proceedings of the 19th ACMSIGKDD International Conference on Knowledge Discovery and Data Mining (KDD ’13). ACM, New York, NY, USA,1222–1230.
[38] Alistair Moffat and Justin Zobel. 2008. Rank-biased precision for measurement of retrieval effectiveness. ACM Trans.Inf. Syst. 27, 1 (2008), 2:1–2:27.
[39] Fiona Fui-Hoon Nah. 2004. A study on tolerable waiting time: how long are Web users willing to wait? Behaviour andInformation Technology 23, 3 (2004), 153–163.
[40] Heather L. O’Brien and Elaine G. Toms. 2010. The development and evaluation of a survey to measure user engagement.Journal of the American Society for Information Science and Technology 61, 1 (January 2010), 50–69.
[41] Judith Ramsay, Alessandro Barbesi, and Jenny Preece. 1998. A psychological investigation oflong retrieval times on the World Wide Web. Interacting with Computers 10, 1 (1998), 77–86.arXiv:http://iwc.oxfordjournals.org/content/10/1/77.full.pdf+html
[42] E. Schurman and J. Brutlag. 2009. Performance related changes and their user impact. In Velocity – Web Performanceand Operations Conf.
[43] M. D. Smucker. 2009. Towards timed predictions of human performance for interactive information retrieval evaluation.In Proc. Symp. Human-Computer Information Retrieval.
[44] Mark D. Smucker and Charles L.A. Clarke. 2012. Time-based calibration of effectiveness measures. In Proc. 35th Int’lACM SIGIR Conf. Research and Development in Information Retrieval. 95–104.
[45] Nolan J. Taylor, Alan R. Dennis, and Jeff W. Cummings. 2013. Situation normality and the shape of search: The effectsof time delays and information presentation on search behavior. Journal of the American Society for Information Scienceand Technology 64, 5 (2013), 909–928.
[46] Jaime Teevan, Kevyn Collins-Thompson, Ryen W. White, Susan T. Dumais, and Yubin Kim. 2013. Slow search:Information retrieval without time constraints. In Proceedings of the Symposium on Human-Computer Interaction andInformation Retrieval (HCIR ’13). ACM, New York, NY, USA, Article 1, 10 pages.
[47] Edmund R. Thompson. 2007. Development and Validation of an Internationally Reliable Short-Form of the Positiveand Negative Affect Schedule (PANAS). Journal of Cross-Cultural Psychology 38, 2 (2007), 227–242.
Received November 2016; revised December 2016; revised May 2017; accepted June 2017
ACM Transactions on Information Systems, Vol. 9, No. 4, Article 39. Publication date: March 2017.