Embed Size (px)
Citation preview

Understanding and Improving Health :
Lessons from Appalachia and America’s Poorest State
Randy Wykoff, MD, MPH & TM
Professor and Dean,
ETSU College of Public Health

Estimated Average Life Expectancy in 2014:
79.56 Years
Life Expectancy
CIA Factbook 2014

0
10
20
30
40
50
60
70
80
1900 1950 2000
30 years
Life Expectancy Change in the 20th Century

0
50
100
150
200
250
300
Cause of Deaths—United States 1909

0
50
100
150
200
250
300
Cause of Deaths—United States 2005
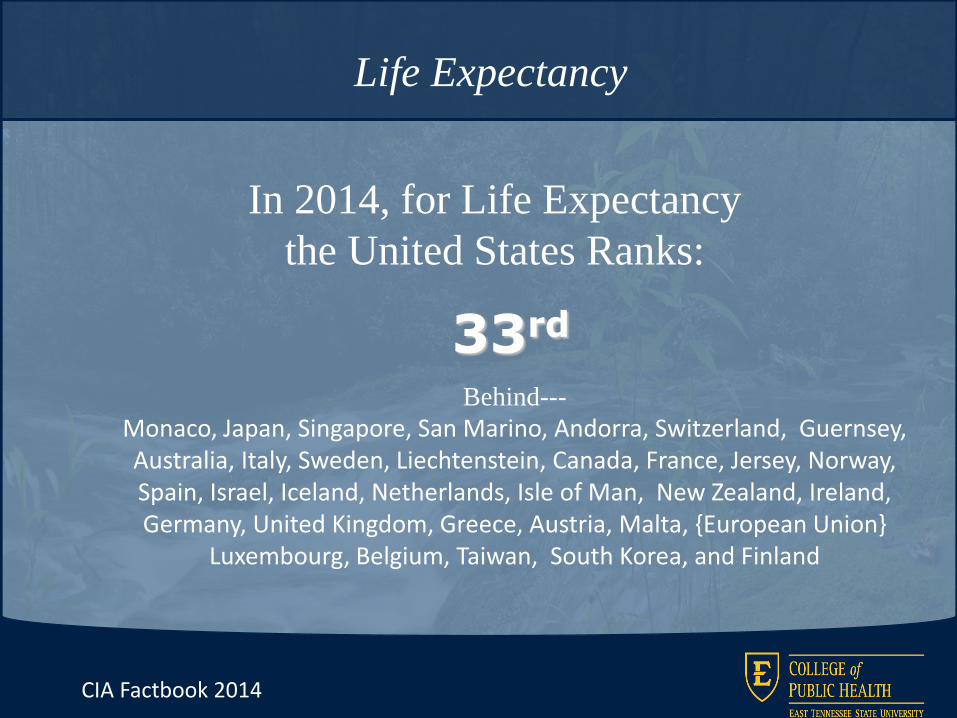
In 2014, for Life Expectancy
the United States Ranks:
33rd
Behind---
Monaco, Japan, Singapore, San Marino, Andorra, Switzerland, Guernsey, Australia, Italy, Sweden, Liechtenstein, Canada, France, Jersey, Norway, Spain, Israel, Iceland, Netherlands, Isle of Man, New Zealand, Ireland, Germany, United Kingdom, Greece, Austria, Malta, {European Union}
Luxembourg, Belgium, Taiwan, South Korea, and Finland
Life Expectancy
CIA Factbook 2014
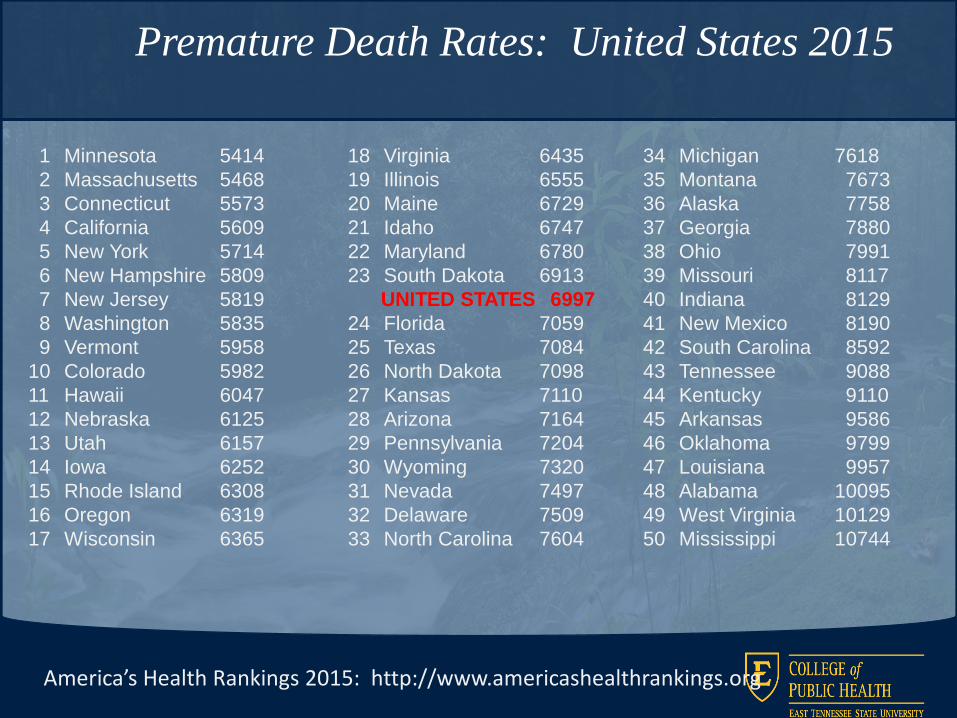
1 Minnesota 5414
2 Massachusetts 5468
3 Connecticut 5573
4 California 5609
5 New York 5714
6 New Hampshire 5809
7 New Jersey 5819
8 Washington 5835
9 Vermont 5958
10 Colorado 5982
11 Hawaii 6047
12 Nebraska 6125
13 Utah 6157
14 Iowa 6252
15 Rhode Island 6308
16 Oregon 6319
17 Wisconsin 6365
18 Virginia 6435
19 Illinois 6555
20 Maine 6729
21 Idaho 6747
22 Maryland 6780
23 South Dakota 6913
UNITED STATES 6997
24 Florida 7059
25 Texas 7084
26 North Dakota 7098
27 Kansas 7110
28 Arizona 7164
29 Pennsylvania 7204
30 Wyoming 7320
31 Nevada 7497
32 Delaware 7509
33 North Carolina 7604
34 Michigan 7618
35 Montana 7673
36 Alaska 7758
37 Georgia 7880
38 Ohio 7991
39 Missouri 8117
40 Indiana 8129
41 New Mexico 8190
42 South Carolina 8592
43 Tennessee 9088
44 Kentucky 9110
45 Arkansas 9586
46 Oklahoma 9799
47 Louisiana 9957
48 Alabama 10095
49 West Virginia 10129
50 Mississippi 10744
America’s Health Rankings 2015: http://www.americashealthrankings.org
Premature Death Rates: United States 2015

0
2000
4000
6000
8000
10000
12000
14000
16000
18000
1stPercentile
10thPercentile
20thPercentile
30thPercentile
40thPercentile
50thPercentile
60thPercentile
70thPercentile
80thPercentile
90thPercentile
99thPercentile
All US
Premature Mortality (YPLL):All Counties in the United States
2016 County Health Rankings: http://www.countyhealthrankings.org/
7702

0
2000
4000
6000
8000
10000
12000
14000
16000
18000
1stPercentile
10thPercentile
20thPercentile
30thPercentile
40thPercentile
50thPercentile
60thPercentile
70thPercentile
80thPercentile
90thPercentile
99thPercentile
Central Appalachia
All US
Premature Mortality (YPLL):All 2989 Counties in US vs 238 Counties in Central Appalachia
2016 County Health Rankings: http://www.countyhealthrankings.org/
29%84%

Genetics30%
Social Circumstances
15%
Environmental Exposures 5%
10%
Health Care
We Can Do Better: Improving the Health of the American PeopleSchroeder SA. New England Journal of Medicine 357: 1221-1228http://content.nejm.org/cgi/content/full/357/12/1221
40%
Behavioral Factors
Factors Contributing to Premature Death

• Tobacco 18.1% of all deaths
• Diet/activity patterns 15.2% of all deaths
• Alcohol 3.5% of all deaths
• Microbial agents 3.1% of all deaths
• Toxic agents 2.3% of all deaths
• Motor vehicles 1.8% of all deaths
• Firearms 1.1% of all deaths
• Sexual behavior 0.8% of all deaths
• Illicit Drug Use 0.7% of all deaths
Actual Leading Causes of Death
Actual Causes of Death in the United States, 2000 Mokdad et alJAMA 291: 1238-1245http://jama.ama-assn.org/cgi/content/abstract/291/10/1238 and erratum:
http://jama.ama-assn.org/cgi/content/full/293/3/298

1 Utah 9.7
2 California 12.8
3 Hawaii 14.1
4 New York 14.4
5 Texas 14.5
6 Maryland 14.6
7 Massachusetts 14.7
8 New Jersey 15.1
9 Washington 15.3
10 Connecticut 15.4
11 Colorado 15.7
12 Idaho 15.9
13=Minnesota 16.3
13=Rhode Island 16.3
15 Vermont 16.4
16=Arizona 16.5
16=Illinois 16.5
18=Nevada 17.0
18=Oregon 17.0
20 Nebraska 17.3
21=Georgia 17.4
21=Wisconsin 17.4
23 New Hampshire 17.5
24 Florida 17.6
UNITED STATES 18.1
25 Kansas 18.1
26 Iowa 18.5
27 South Dakota 18.6
28=New Mexico 19.1
28=North Carolina 19.1
30 Maine 19.3
31=Virginia 19.5
31=Wyoming 19.5
33=Alaska 19.9
33=Delaware 19.9
33=Montana 19.9
33=North Dakota 19.9
33=Pennsylvania 19.9
38 Missouri 20.6
39 Ohio 21.0
40=Alabama 21.1
40=Oklahoma 21.1
42 Michigan 21.2
43 South Carolina 21.5
44 Indiana 22.9
45 Mississippi 23.0
46 Louisiana 24.0
47 Tennessee 24.2
48 Arkansas 24.7
49 Kentucky 26.2
50 West Virginia 26.7
America’s Health Rankings 2015: http://www.americashealthrankings.org
Prevalence of Smoking: Adults

0
5
10
15
20
25
30
35
1stPercentile
10thPercentile
20thPercentile
30thPercentile
40thPercentile
50thPercentile
60thPercentile
70thPercentile
80thPercentile
90thPercentile
99thPercentile
Central Appalachia
All US
Adult Smoking: All 3140 Counties in US vs 238 Counties in Central Appalachia
2016 County Health Rankings: http://www.countyhealthrankings.org/
30%94%

1 Colorado 21.3
2 Hawaii 22.1
3 Massachusetts 23.3
4 California 24.7
5 Vermont 24.8
6 Utah 25.7
7 Florida 26.2
8 Connecticut 26.3
9 Montana 26.4
10 New Jersey 26.9
11= New York 27.0
11= Rhode Island 27.0
13 Washington 27.3
14 New Hampshire 27.4
15 Minnesota 27.6
16 Nevada 27.7
17 Oregon 27.9
18 Maine 28.2
19 New Mexico 28.4
20 Virginia 28.5
21=Arizona 28.9
21=Idaho 28.9
23 Illinois 29.3
24 Wyoming 29.5
UNITED STATES 29.6
25 Maryland 29.6
26=Alaska 29.7
26=North Carolina 29.7
28 South Dakota 29.8
29=Missouri 30.2
29=Nebraska 30.2
29=Pennsylvania 30.2
32 Georgia 30.5
33=Delaware 30.7
33=Michigan 30.7
35 Iowa 30.9
36=Tennessee 31.2
36=Wisconsin 31.2
38 Kansas 31.3
39 Kentucky 31.6
40 Texas 31.9
41 South Carolina 32.1
42 North Dakota 32.2
43 Ohio 32.6
44 Indiana 32.7
45 Oklahoma 33.0
46 Alabama 33.5
47 Louisiana 34.9
48 Mississippi 35.5
49 West Virginia 35.7
50 Arkansas 35.9
America’s Health Rankings 2015: http://www.americashealthrankings.org
Prevalence of Obesity: Adults

2016 County Health Rankings: http://www.countyhealthrankings.org/
0
5
10
15
20
25
30
35
40
45
1stPercentile
10thPercentile
20thPercentile
30thPercentile
40thPercentile
50thPercentile
60thPercentile
70thPercentile
80thPercentile
90thPercentile
99thPercentile
Central Appalachia
All US
Adult Obesity: All 3141 Counties in US vs 238 Counties in Central Appalachia
6.4% (33.2 vs 31.2)66%

Robert Wood Johnson:Commission to Build aHealthier America
Behavior
Early LifeExperiences
Education
Income
Work
Housing
Community
Race and Ethnicity
Economy
Access
Genetics
The Social Determinants of Health

1 Wyoming 10.6
2 New Hampshire 11.1
3 Virginia 11.3
4 Vermont 11.5
5 Minnesota 11.9
6=North Dakota 12.0
6=Utah 12.0
8 Connecticut 12.3
9 Maryland 13.4
10 Missouri 14.2
11 Iowa 14.3
12 Idaho 14.6
13 Alaska 15.6
14 New Jersey 16.1
15 Wisconsin 16.2
16=Delaware 16.6
16=Kansas 16.6
18=Montana 16.8
18=Washington 16.8
20 Hawaii 16.9
21 Colorado 17.2
22 Massachusetts 17.6
23=Rhode Island 17.7
23=South Dakota 17.7
25 Nebraska 18.3
26 Oregon 18.8
27 New York 19.1
28 Pennsylvania 19.4
29 Illinois 20.5
30=Maine 20.8
30=Michigan 20.8
UNITED STATES 21.1
32 Ohio 22.1
33 South Carolina 22.5
34 California 22.9
35 Indiana 23.3
36 Texas 23.8
37 Nevada 23.9
38 Florida 24.2
39 North Carolina 24.4
40 Oklahoma 25.0
41 Alabama 25.2
42 Georgia 25.6
43=New Mexico 25.7
43=West Virginia 25.7
45 Tennessee 26.2
46 Arizona 28.5
47 Mississippi 29.4
48 Arkansas 29.7
49 Kentucky 30.3
50 Louisiana 33.7
America’s Health Rankings 2015: http://www.americashealthrankings.org
Children Living in Poverty

2016 County Health Rankings: http://www.countyhealthrankings.org/
0
10
20
30
40
50
60
1st Percentile 10thPercentile
20thPercentile
30thPercentile
40thPercentile
50thPercentile
60thPercentile
70thPercentile
80thPercentile
90thPercentile
99thPercentile
Central Appalachia
All US
Children Living in Poverty: All 3139 Counties in US vs 238 Counties in Central Appalachia
27%83%

Relative Risk of Dying Before the Age of 65
By Income: United States
Reaching for a Healthier Life: Facts on Socioeconomic Status and Health in the United States
0
0.5
1
1.5
2
2.5
3
3.5
0
20000
40000
60000
80000
100000
120000
140000
160000
180000
200000
PoorestFifth
2ndPoorest
Fifth
MiddleFifth
2ndRichest
Fifth
RichestFifth
1973
1983
1993
2003
2013
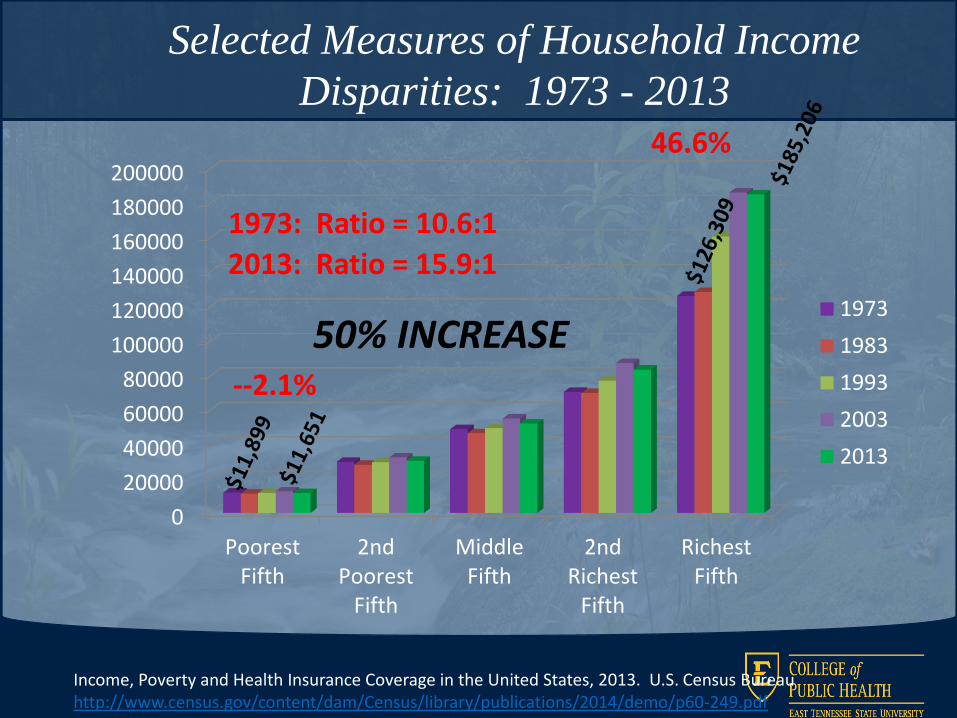
Selected Measures of Household Income
Disparities: 1973 - 2013
Income, Poverty and Health Insurance Coverage in the United States, 2013. U.S. Census Bureau http://www.census.gov/content/dam/Census/library/publications/2014/demo/p60-249.pdf
1973: Ratio = 10.6:1
2013: Ratio = 15.9:1
--2.1%
46.6%
50% INCREASE

2016 County Health Rankings: http://www.countyhealthrankings.org/
0
10
20
30
40
50
60
70
80
90
1st Percentile 10thPercentile
20thPercentile
30thPercentile
40thPercentile
50thPercentile
60thPercentile
70thPercentile
80thPercentile
90thPercentile
99thPercentile
Central Appalachia
All US
Adults with Some College: All 3140 Counties in US vs 238 Counties in Central Appalachia
-16%83%
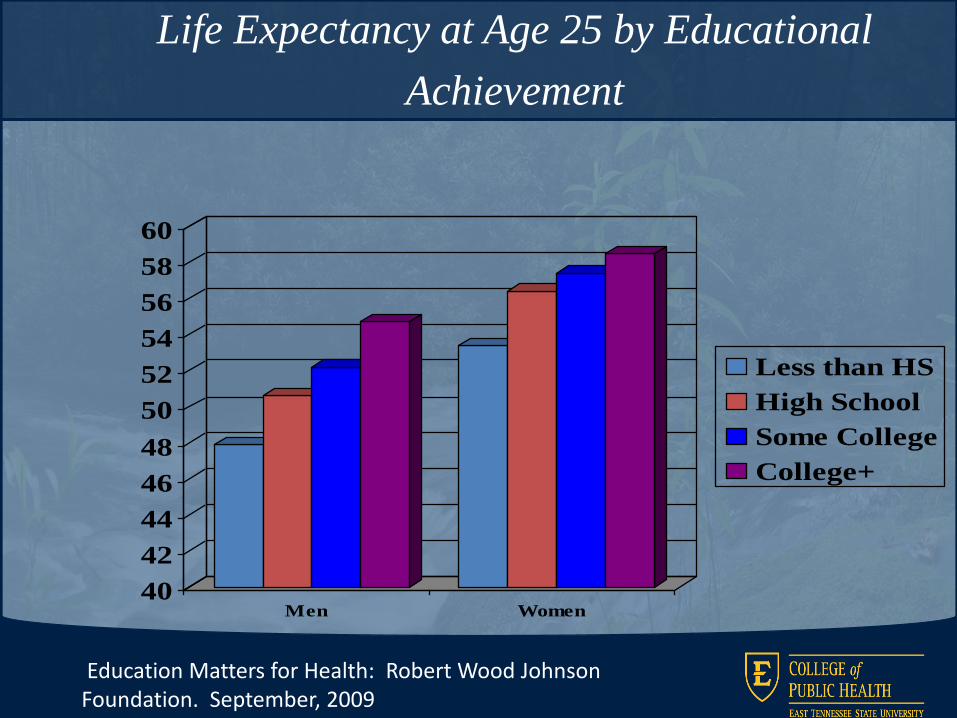
40
42
44
46
48
50
52
54
56
58
60
Men Women
Less than HS
High School
Some College
College+
Life Expectancy at Age 25 by Educational
Achievement
Education Matters for Health: Robert Wood Johnson Foundation. September, 2009
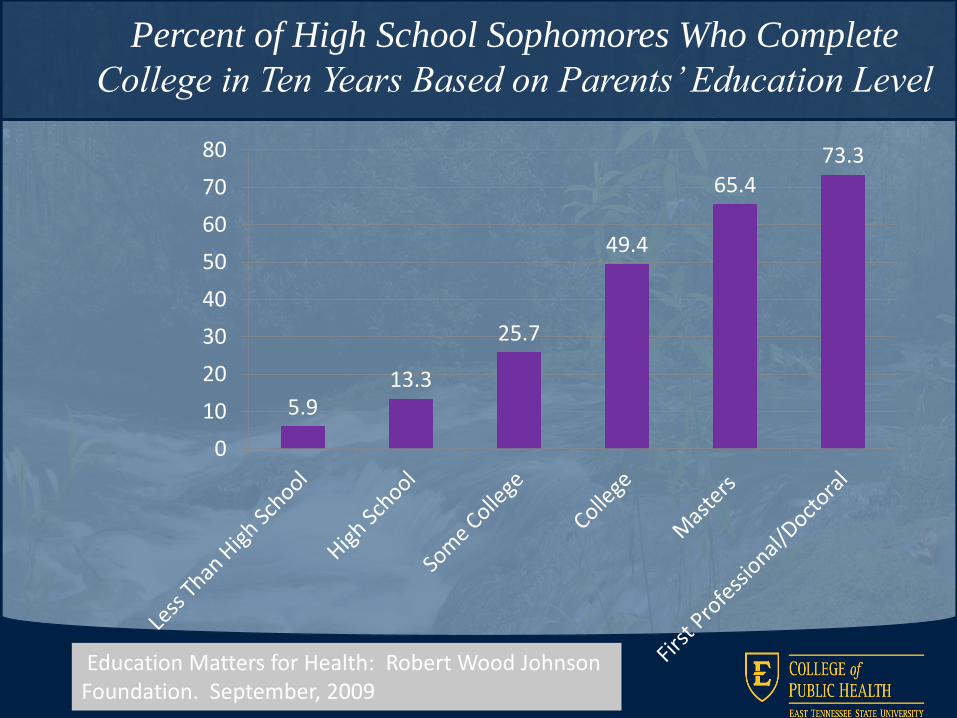
Percent of High School Sophomores Who Complete
College in Ten Years Based on Parents’ Education Level
Education Matters for Health: Robert Wood Johnson Foundation. September, 2009
5.913.3
25.7
49.4
65.473.3
0
10
20
30
40
50
60
70
80

HealthCare
Jobs andEducation
Behavior Change
What Can We Do To Improve Health
in the United States?

We need to work together to enhance economic
opportunity and improve educational achievement;
We need to work together to encourage healthier
behaviors;
We need to work together to assure access to health
care, especially preventive services;
What Can We Do To Improve Health
in the United States?