Embed Size (px)
DESCRIPTION
Â
Citation preview
Underrepresented populations in nursing:
Perspectives on doctoral education
2016 Annual Conference National Forum of State Nursing Workforce Centers
Rebecca Wheeler, PhD, MA, RN
Objectives
1. Describe how underrepresented populations were affected by their initial nursing education
2. Describe factors involved in their plans to pursue (or not) doctoral education
Thanks to the Robert Wood Johnson Foundation (and Pat Farmer!) for their financial and technical assistance
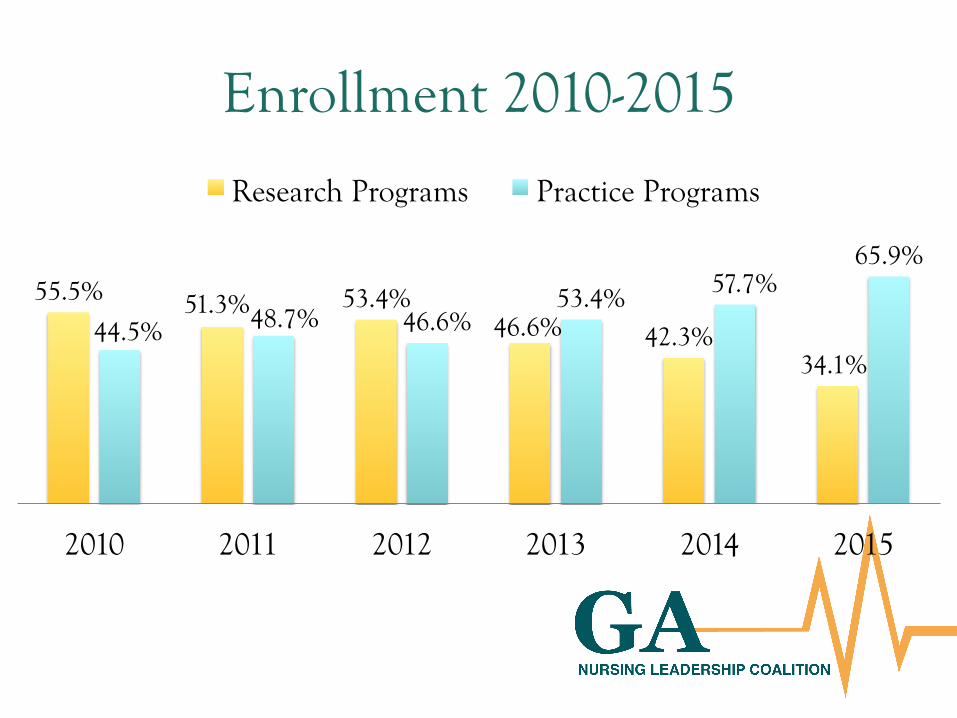
Enrollment 2010-2015
55.5% 51.3% 53.4% 46.6% 42.3%
34.1% 44.5% 48.7% 46.6%
53.4% 57.7% 65.9%
2010 2011 2012 2013 2014 2015
Research Programs Practice Programs
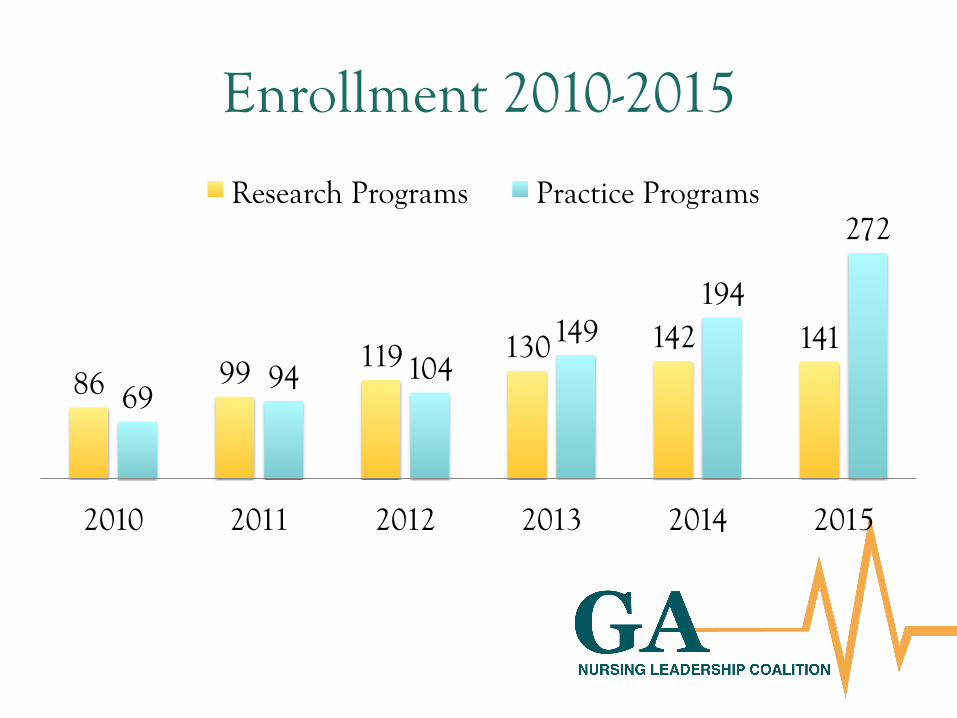
Enrollment 2010-2015
86 99 119 130 142 141
69 94 104
149 194
272
2010 2011 2012 2013 2014 2015
Research Programs Practice Programs
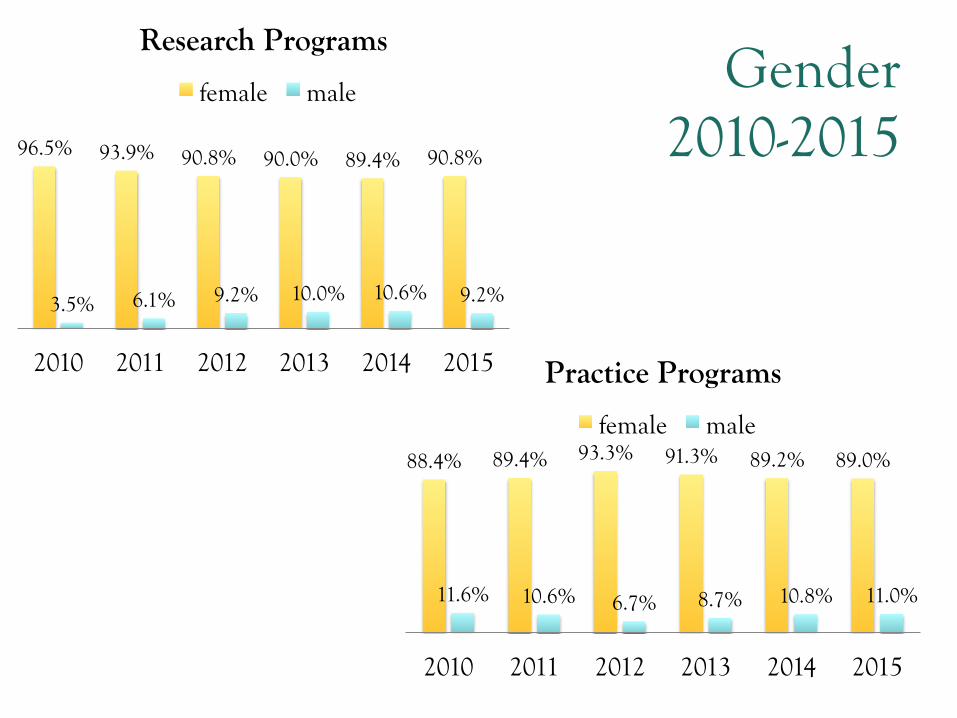
Gender 2010-2015 96.5% 93.9% 90.8% 90.0% 89.4% 90.8%
3.5% 6.1% 9.2% 10.0% 10.6% 9.2%
2010 2011 2012 2013 2014 2015
Research Programs
female male
88.4% 89.4% 93.3% 91.3% 89.2% 89.0%
11.6% 10.6% 6.7% 8.7% 10.8% 11.0%
2010 2011 2012 2013 2014 2015
Practice Programs
female male
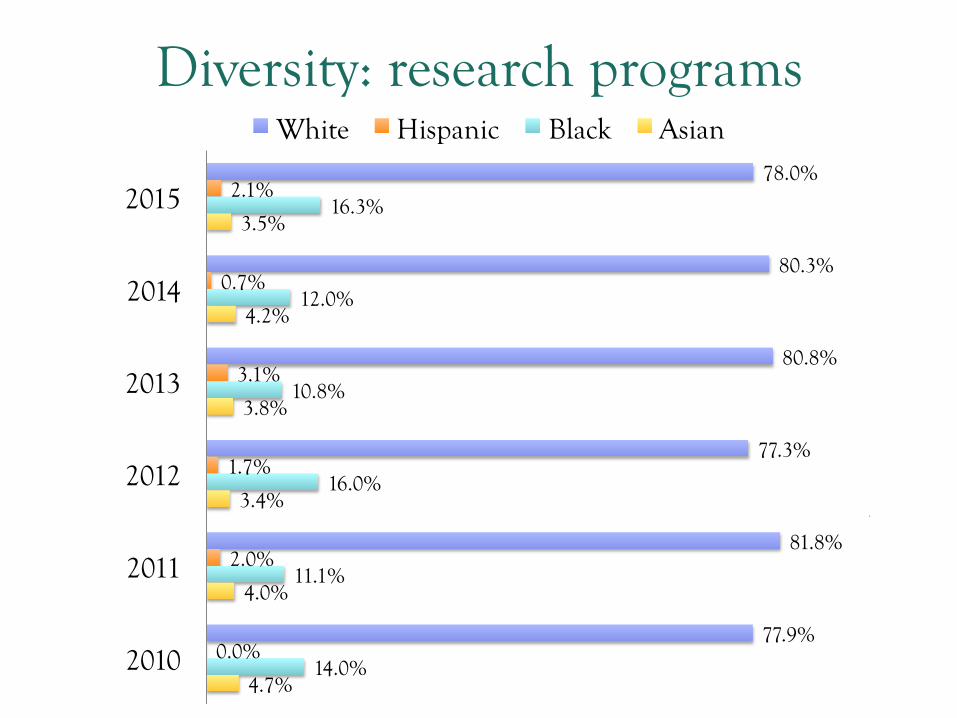
Diversity: research programs
4.7%
4.0%
3.4%
3.8%
4.2%
3.5%
14.0%
11.1%
16.0%
10.8%
12.0%
16.3%
0.0%
2.0%
1.7%
3.1%
0.7%
2.1%
77.9%
81.8%
77.3%
80.8%
80.3%
78.0%
2010
2011
2012
2013
2014
2015
White Hispanic Black Asian
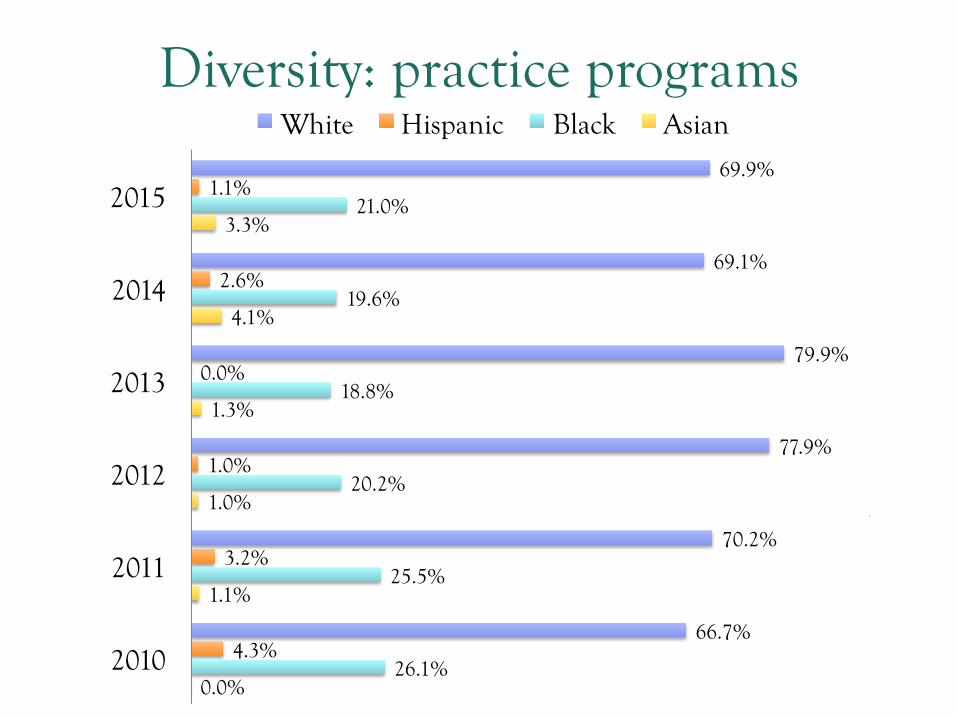
Diversity: practice programs
0.0%
1.1%
1.0%
1.3%
4.1%
3.3%
26.1%
25.5%
20.2%
18.8%
19.6%
21.0%
4.3%
3.2%
1.0%
0.0%
2.6%
1.1%
66.7%
70.2%
77.9%
79.9%
69.1%
69.9%
2010
2011
2012
2013
2014
2015
White Hispanic Black Asian
So?
• Percent enrollment in research doctorate programs and practice doctorate programs has switched
• Gender diversity is similar in both program types – But has increased in research programs
• Racial and ethnic diversity has decreased overall
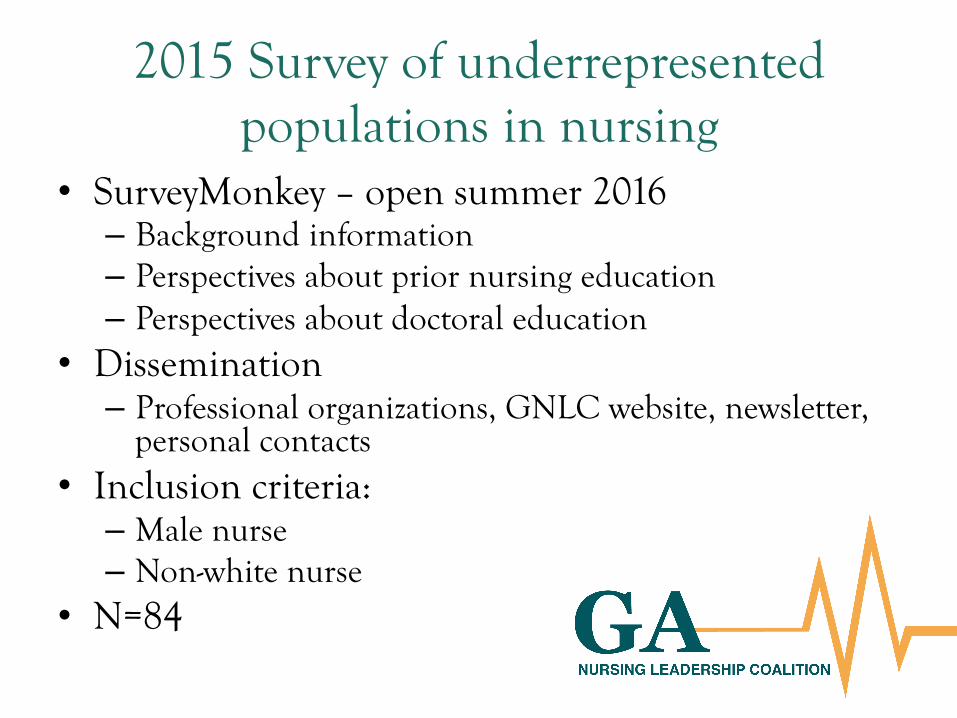
2015 Survey of underrepresented populations in nursing
• SurveyMonkey – open summer 2016 – Background information – Perspectives about prior nursing education – Perspectives about doctoral education
• Dissemination – Professional organizations, GNLC website, newsletter,
personal contacts • Inclusion criteria: – Male nurse – Non-white nurse
• N=84
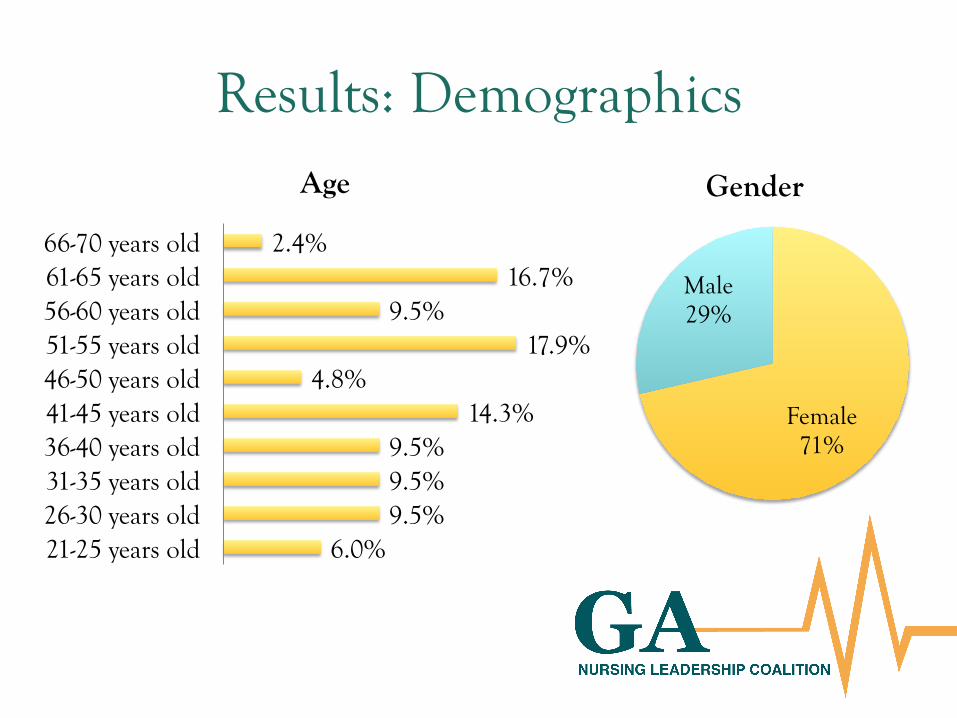
Results: Demographics
Female 71%
Male 29%
Gender
6.0% 9.5% 9.5% 9.5%
14.3% 4.8%
17.9% 9.5%
16.7% 2.4%
21-25 years old 26-30 years old 31-35 years old 36-40 years old 41-45 years old 46-50 years old 51-55 years old 56-60 years old 61-65 years old 66-70 years old
Age
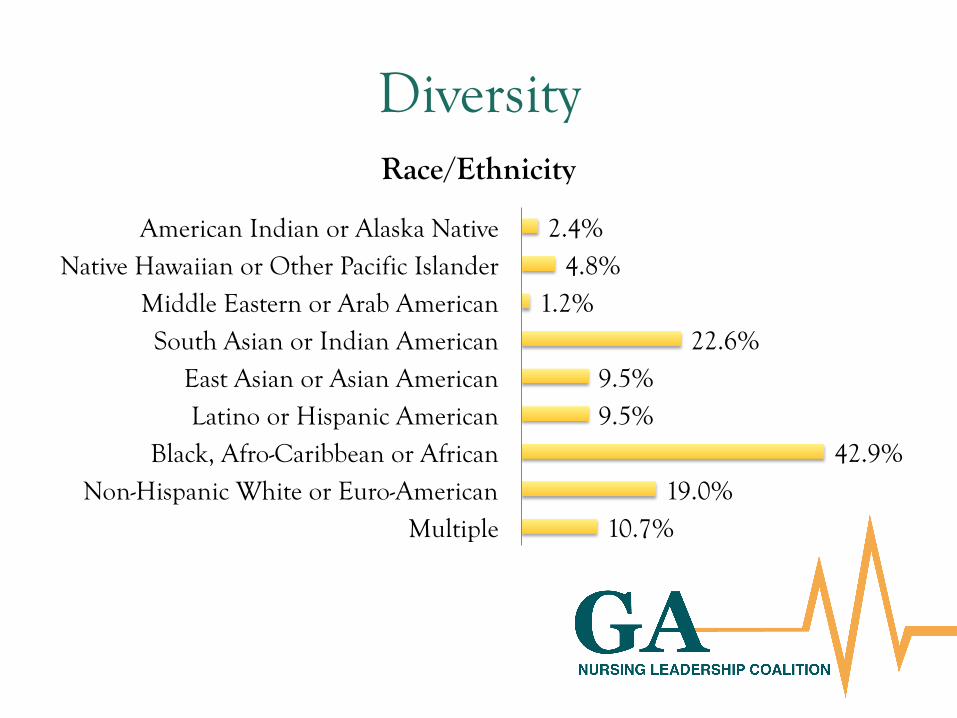
Diversity
10.7% 19.0%
42.9% 9.5% 9.5%
22.6% 1.2%
4.8% 2.4%
Multiple Non-Hispanic White or Euro-American
Black, Afro-Caribbean or African Latino or Hispanic American
East Asian or Asian American South Asian or Indian American
Middle Eastern or Arab American Native Hawaiian or Other Pacific Islander
American Indian or Alaska Native
Race/Ethnicity
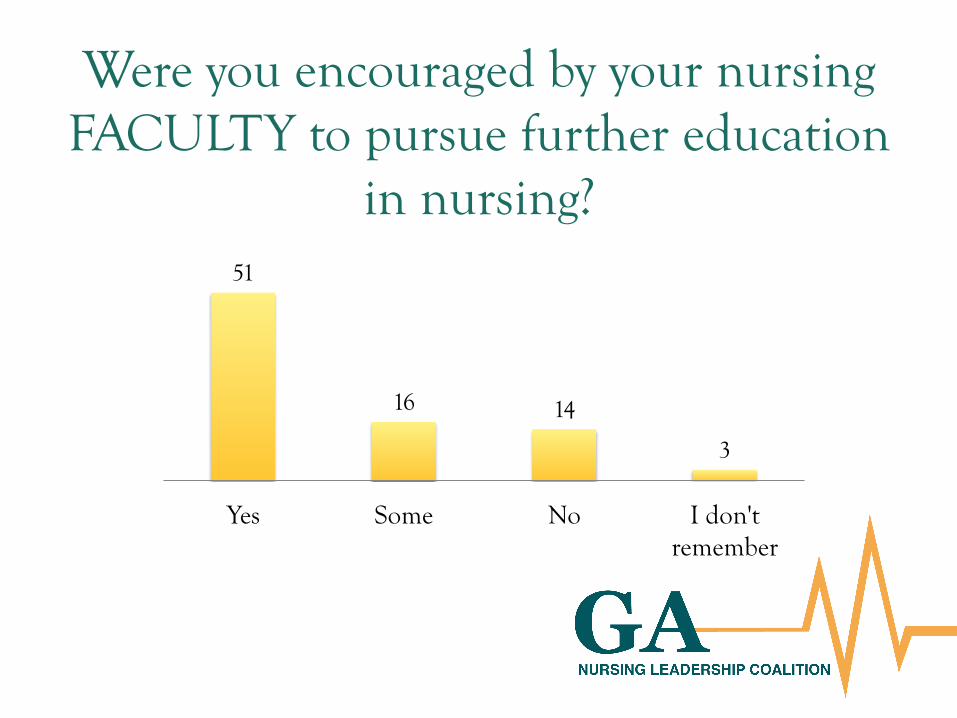
Were you encouraged by your nursing FACULTY to pursue further education
in nursing? 51
16 14
3
Yes Some No I don't remember
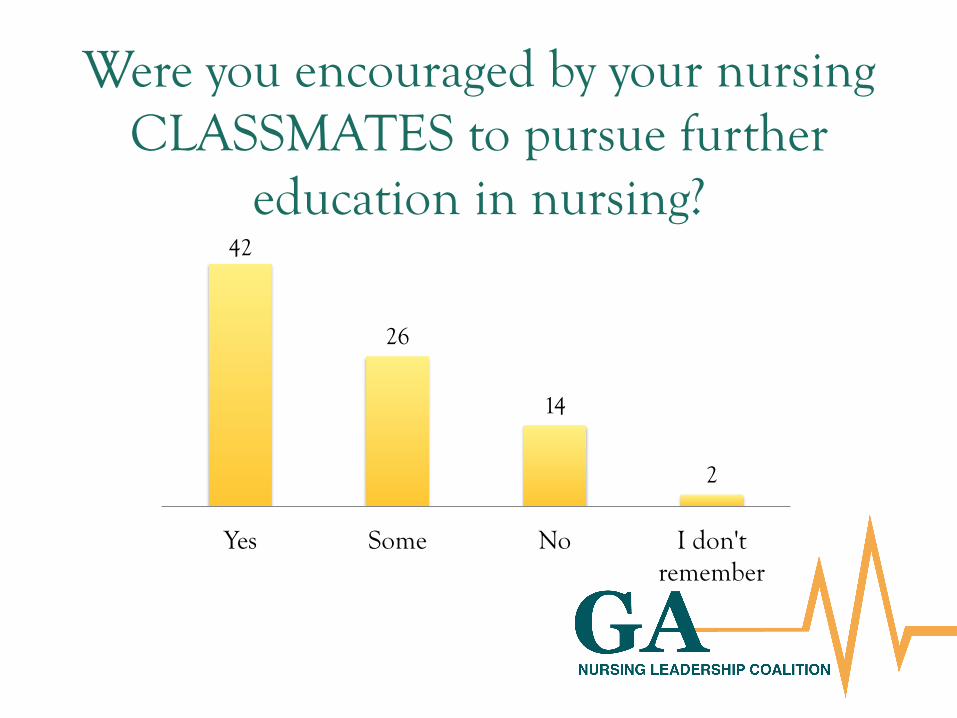
Were you encouraged by your nursing CLASSMATES to pursue further
education in nursing? 42
26
14
2
Yes Some No I don't remember
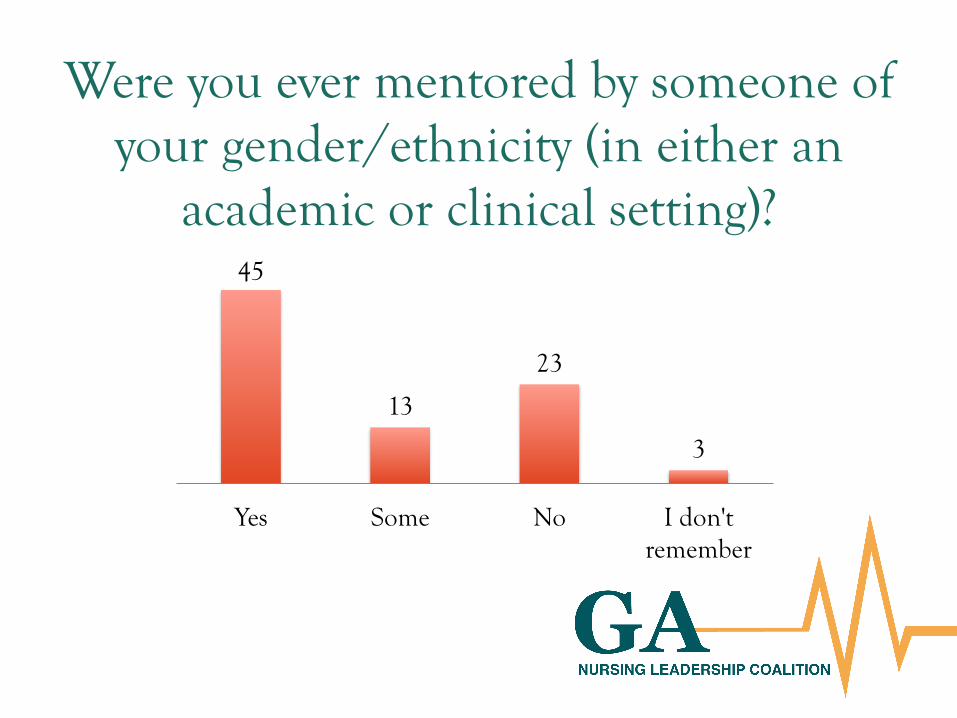
Were you ever mentored by someone of your gender/ethnicity (in either an
academic or clinical setting)? 45
13
23
3
Yes Some No I don't remember
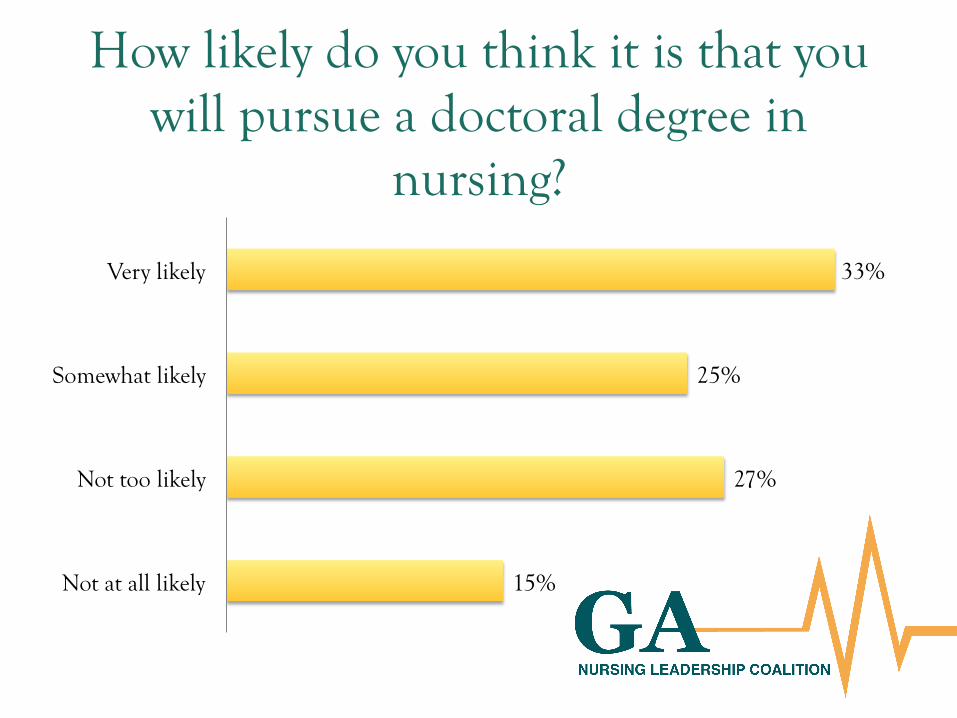
How likely do you think it is that you will pursue a doctoral degree in
nursing?
15%
27%
25%
33%
Not at all likely
Not too likely
Somewhat likely
Very likely
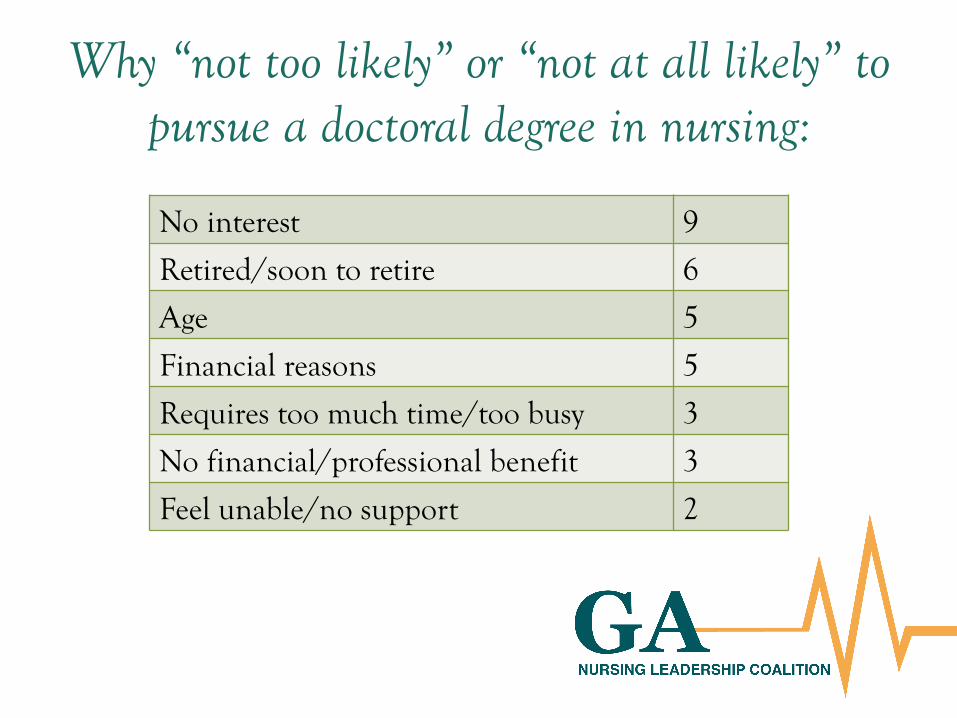
Why “not too likely” or “not at all likely” to pursue a doctoral degree in nursing:
No interest 9
Retired/soon to retire 6
Age 5
Financial reasons 5
Requires too much time/too busy 3
No financial/professional benefit 3
Feel unable/no support 2
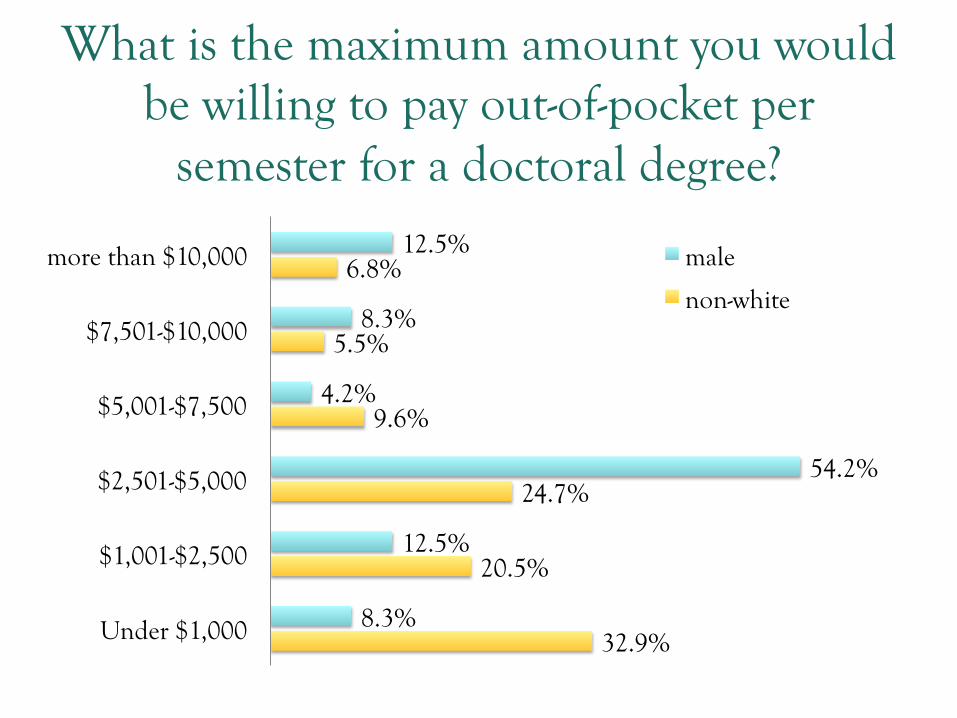
What is the maximum amount you would be willing to pay out-of-pocket per
semester for a doctoral degree?
32.9%
20.5%
24.7%
9.6%
5.5%
6.8%
8.3%
12.5%
54.2%
4.2%
8.3%
12.5%
Under $1,000
$1,001-$2,500
$2,501-$5,000
$5,001-$7,500
$7,501-$10,000
more than $10,000 male
non-white
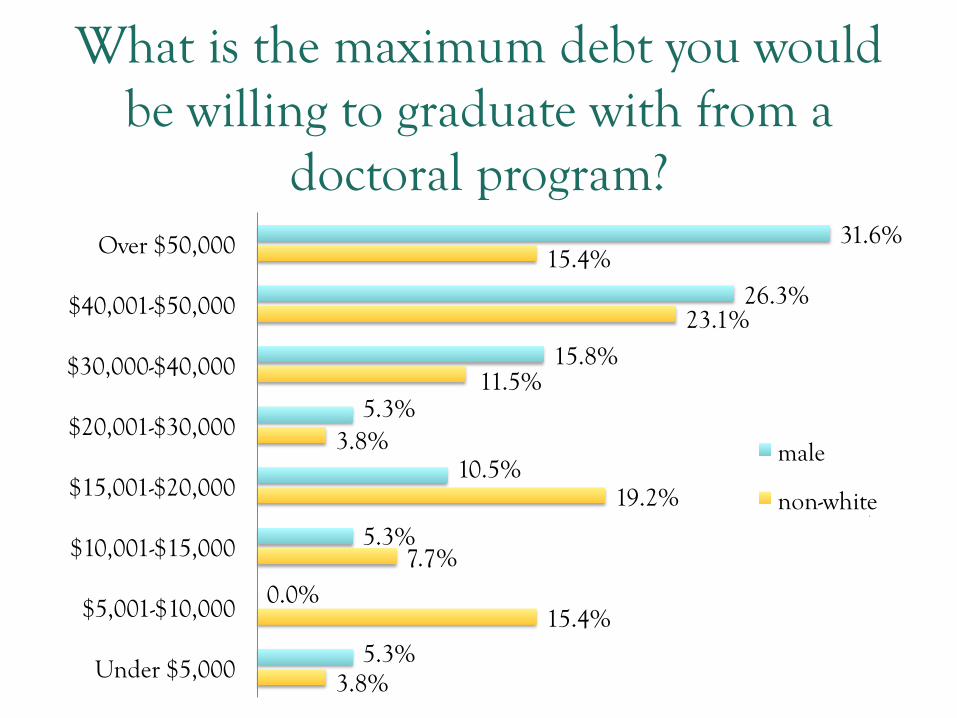
What is the maximum debt you would be willing to graduate with from a
doctoral program?
3.8%
15.4%
7.7%
19.2%
3.8%
11.5%
23.1%
15.4%
5.3%
0.0%
5.3%
10.5%
5.3%
15.8%
26.3%
31.6%
Under $5,000
$5,001-$10,000
$10,001-$15,000
$15,001-$20,000
$20,001-$30,000
$30,000-$40,000
$40,001-$50,000
Over $50,000
male
non-white
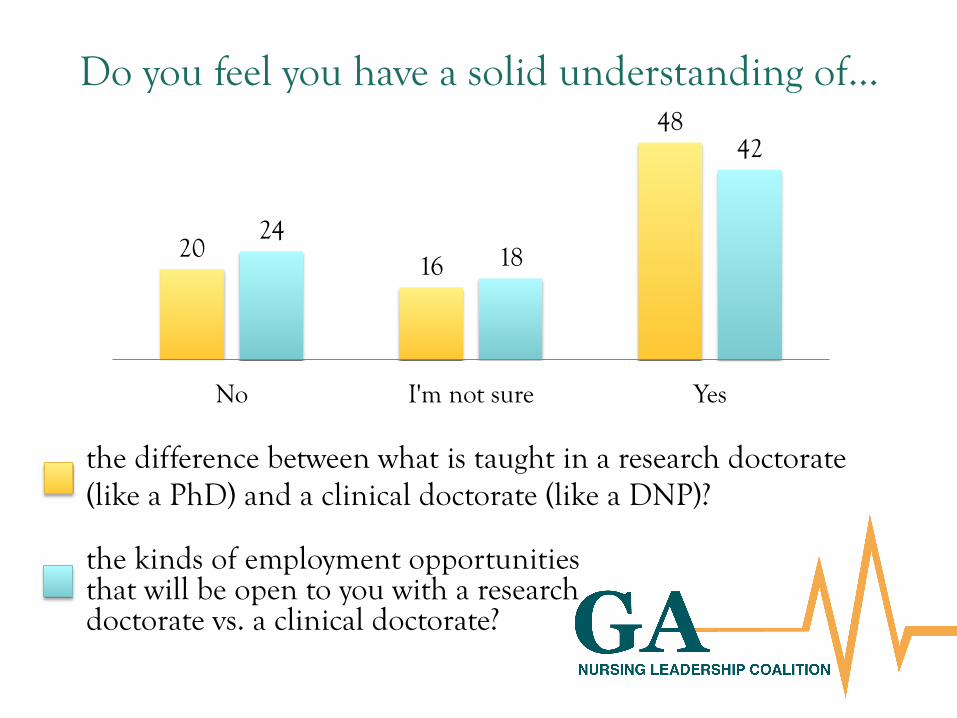
Do you feel you have a solid understanding of…
the difference between what is taught in a research doctorate (like a PhD) and a clinical doctorate (like a DNP)?
the kinds of employment opportunities that will be open to you with a research doctorate vs. a clinical doctorate?
20 16
48
24 18
42
No I'm not sure Yes
So? • Faculty and mentors have a strong impact • More than half may pursue doctoral education in
the next 5y • The majority are not willing to go into debt,
however: – Of those willing, 77% willing to assume > $15,000 of
debt – Males are willing to spend more and assume more debt
• Half do not feel they understand the difference in practice of a nurse with a practice doctorate or a research doctorate