Embed Size (px)
Citation preview

Harcourt Petroleum N.L. Underground Water Impact Report
ATP 602

Harcourt Petroleum N.L. Underground Water Impact Report
ATP 602
17 June 2016
CDM Smith Australia Pty Ltd ABN 88 152 082 936 21 McLachlan St Fortitude Valley QLD 4006 Tel: +61 7 3828 6900 Fax: +61 7 3828 6999

Table of Contents
Section 1 Introduction ................................................................................................................................................. 1-1 1.1 Project area ...................................................................................................................................................... 1-1 1.2 Legislative requirements............................................................................................................................ 1-3 1.3 Petroleum Act 1923 (QLD) ........................................................................................................................ 1-3 1.4 Water Act 2000 (QLD) ................................................................................................................................. 1-3 1.5 Summary of methods ................................................................................................................................... 1-4
Section 2 Water Production Schedule (Part A) ................................................................................................... 2-1 2.1 Summary of historically produced water ........................................................................................... 2-1 2.2 Summary of gas production wells .......................................................................................................... 2-2 2.3 Summary of water to be produced in the next three years ........................................................ 2-2
Section 3 Existing Geological and Hydrogeological Regime (Part B) ......................................................... 3-1 3.1 Regional geology ............................................................................................................................................ 3-1 3.2 Hydrogeology .................................................................................................................................................. 3-5
3.2.1 Quaternary alluvial aquifers and Tertiary Volcanics ............................................................... 3-5 3.2.2 Triassic sedimentary aquifers ........................................................................................................... 3-5 3.2.3 Permian Coal Measures ........................................................................................................................ 3-6 3.2.4 Hydrogeological properties ................................................................................................................ 3-6
3.3 Conceptual hydrogeological model ....................................................................................................... 3-7 3.3.1 Groundwater levels and flow ............................................................................................................. 3-7 3.3.2 Aquifer recharge and discharge ..................................................................................................... 3-13 3.3.3 Historical groundwater level trend analysis ............................................................................ 3-13 3.3.4 Groundwater quality ........................................................................................................................... 3-16 3.3.5 Aquifer connectivity ............................................................................................................................ 3-20 3.3.6 Groundwater use .................................................................................................................................. 3-20 3.3.7 Summary .................................................................................................................................................. 3-20
Section 4 Impacts to Groundwater System (Part C) .......................................................................................... 4-1 Section 5 Water Monitoring Strategy (Part D) .................................................................................................... 5-1
5.1 Rationale ............................................................................................................................................................ 5-1 5.1.1 Monitoring threshold criteria ............................................................................................................ 5-1
5.2 Monitoring strategy and timetable ........................................................................................................ 5-1 5.2.1 Extracted underground water ........................................................................................................... 5-2 5.2.2 Field locations ........................................................................................................................................... 5-2 5.2.3 Water level monitoring ......................................................................................................................... 5-2 5.2.4 Water quality monitoring .................................................................................................................... 5-2
5.3 Reporting program ....................................................................................................................................... 5-3 Section 6 Spring Impact Management (Part E) ................................................................................................... 6-1
6.1 Spring inventory ............................................................................................................................................ 6-1 Section 7 Conclusion ..................................................................................................................................................... 7-1 Section 8 References ..................................................................................................................................................... 8-1
List of Figures
Figure 1-1 Location map .................................................................................................................................. 1-2 Figure 2-1 Gas well historical test pumping ..................................................................................................... 2-2
Underground Water Impact Report - ATP 602 iii

Underground Water Impact Report - ATP 602 • Harcourt Petroleum N.L.
Figure 2-2 Estimated location of future production well ................................................................................. 2-3 Figure 3-1 Regional geology map ..................................................................................................................... 3-2 Figure 3-2 Schematic West to East cross section through ATP602 .................................................................. 3-4 Figure 3-3 Interpreted water level contours in the alluvium and basalt ......................................................... 3-8 Figure 3-4 Interpreted groundwater contours in the Clematis Group and the Moolayember Formation .... 3-10 Figure 3-5 Interpreted contour maps for Baralaba Coal Measures ............................................................... 3-12 Figure 3-6 Hydrographs for selected bores installed in the Dawson River alluvium ..................................... 3-14 Figure 3-7 Hydrographs for bores installed in Castle Creek alluvium ............................................................ 3-14 Figure 3-8 Hydrographs for bores installed in the Moolayember Formation ................................................ 3-15 Figure 3-9 Hydrographs for bores installed in the Rewan Group .................................................................. 3-15 Figure 3-10 Sampled Groundwater Bores - January 2013 ............................................................................. 3-19 Figure 6-1 Watercourses and registered springs proximal to ATP 602 ............................................................ 6-2 Figure 8-1 Groundwater Model Domain ............................................................................................................. 2 Figure 8-2 3D model of the ground surface and 6 model layers (base of all layers are presented, the alluvium is directly under the ground surface) .................................................................................................................. 3 Figure 8-3 Down dip cross section through modelling area (cross section A-B) ................................................. 4 Figure 8-4 East - West model cross section showing the stratigraphy of row 45 (Northing ~7287800m) ......... 4 Figure 8-5 Model boundary conditions on Layer 1 ............................................................................................. 6 Figure 8-6 Calibration scatterplot of simulated hydraulic head versus observed hydraulic head [m] for steady-state model. ............................................................................................................................................ 8 Figure 8-7 Simulated water table at end of 2012. .............................................................................................. 9 Figure 8-8 Simulated drawdown in the Baralaba Coal Measures at the end of 3 years CSG pumping. ........... 12
List of Tables
Table 1-1 Summary of UWIR requirements and sections where this is addressed in the report .................... 1-5 Table 2-1 Summary of historical production testing ........................................................................................ 2-1 Table 2-2 Summary of water to be produced over the next five years ........................................................... 2-2 Table 3-1 Regional stratigraphy of the Bowen Basin ....................................................................................... 3-3 Table 3-2 Summary of hydrogeological properties for major HSUs in the Bowen Basin. ................................ 3-7 Table 3-3 Summary of registered bores in the Clematis Group and the Moolayember Formation ................ 3-9 Table 3-4 Summary of registered bores installed in the Baralaba Coal Measures ........................................ 3-11 Table 3-5 Summary of water levels as recorded during field sampling in January 2013 ............................... 3-16 Table 3-6 Summary of water levels as recorded during field sampling in September 2013 ......................... 3-17 Table 3-7 Summary of field parameters recorded during field investigation ................................................ 3-17 Table 3-8 Summary of water quality from production wells in Baralaba Coal Measures.............................. 3-18 Table 5-1 Groundwater analytical suite ........................................................................................................... 5-3 Table 8-1 Model Layers and Stratigraphy ........................................................................................................... 4 Table 8-2 Calibrated model hydraulic properties. .............................................................................................. 7 Table 8-3 ATP 602 predicted water production schedule................................................................................. 10 Table 8-4 ATP564P predicted water production schedule ............................................................................... 10
Appendices
Appendix A - Summary of registered bores installed in alluvium Appendix B - Summary of laboratory results for registered bores sampled in Jan 2013 Appendix C – Groundwater impact assessment undertaken for 2013 UWIR
Underground Water Impact Report - ATP 602 iv

Underground Water Impact Report - ATP 602 • Harcourt Petroleum N.L.
Appendix D - UWIR Groundwater Monitoring Checklist Appendix E - Submissions Report for UWIR for ATP 602 Appendix F - Disclaimer and Limitations
Underground Water Impact Report - ATP 602 v

Underground Water Impact Report - ATP 602 • Harcourt Petroleum N.L.
Document History and Status
Revision Date Issued Reviewed By Approved By Date Approved Revision Type
Draft 16/04/2013 Rikito Gresswell Lloyd Townley 16/04/2013 A Final 18/04/2013 John Leyland Lloyd Townley 18/04/2013 B Update-REV0 07/06/2016 Rikito Gresswell Dougal Currie 07/06/2016 Draft Update-REV1 17/06/2016 Harcourt Dougal Currie 17/06/2016 Final
Distribution of Copies
Version Date Issued Quantity Electronic Issued To Draft 16/04/2013 1 Yes Harcourt Final 18/04/2013 1 Yes Harcourt Final 14/06/2013 1 Yes EHP Update -Draft 07/06/2016 1 Yes Harcourt Update- Final 17/06/2016 1 Yes Harcourt
Printed: 17 June 2016
Last Saved: 17 June 2016 11:30 AM
File Name: BWS160008-01-RPT-Harcourt_UWIR_ATP602-REV1.docx
Author: Katarina David/Andrew Brooker/Mauricio Taulis/Dougal Currie
Project Manager: Dougal Currie
Client: Harcourt Petroleum N.L. Document Title: Underground Water Impact Report - ATP 602
Document Version: Update – REV1
Project Number: BWS160008.01
Underground Water Impact Report - ATP 602 vi
Underground Water Impact Report - ATP 602 • Harcourt Petroleum N.L.
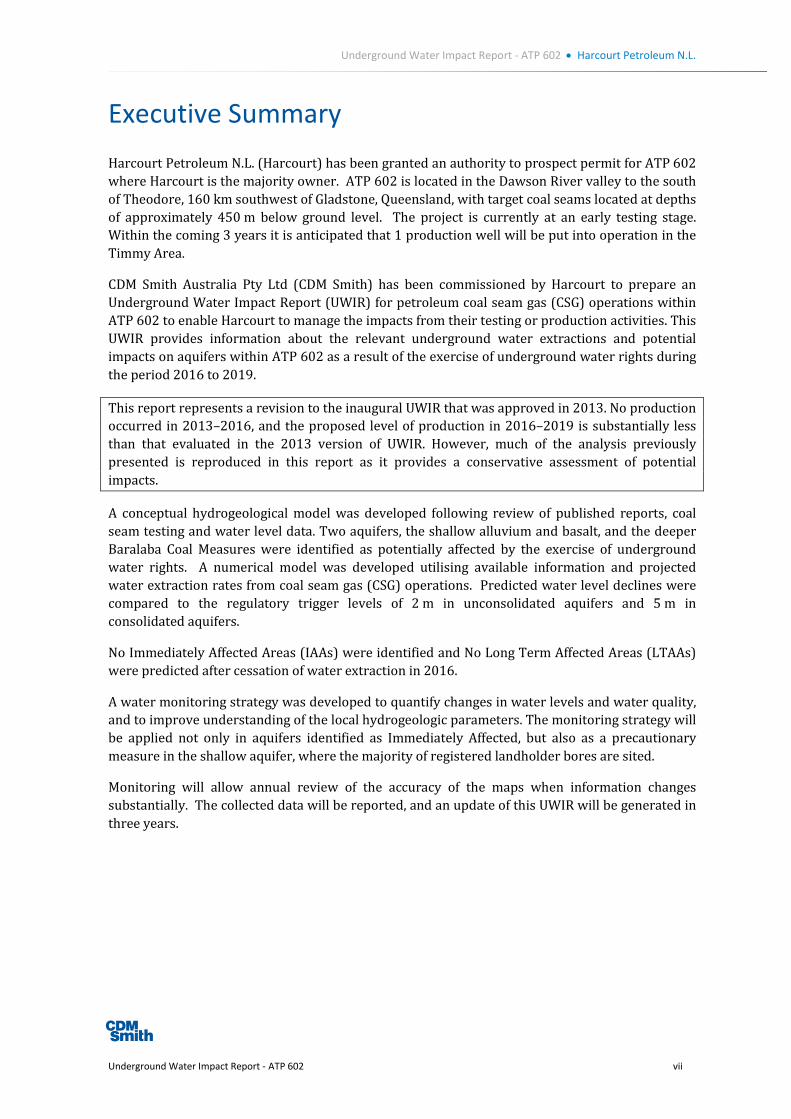
Executive Summary Harcourt Petroleum N.L. (Harcourt) has been granted an authority to prospect permit for ATP 602 where Harcourt is the majority owner. ATP 602 is located in the Dawson River valley to the south of Theodore, 160 km southwest of Gladstone, Queensland, with target coal seams located at depths of approximately 450 m below ground level. The project is currently at an early testing stage. Within the coming 3 years it is anticipated that 1 production well will be put into operation in the Timmy Area.
CDM Smith Australia Pty Ltd (CDM Smith) has been commissioned by Harcourt to prepare an Underground Water Impact Report (UWIR) for petroleum coal seam gas (CSG) operations within ATP 602 to enable Harcourt to manage the impacts from their testing or production activities. This UWIR provides information about the relevant underground water extractions and potential impacts on aquifers within ATP 602 as a result of the exercise of underground water rights during the period 2016 to 2019.
This report represents a revision to the inaugural UWIR that was approved in 2013. No production occurred in 2013–2016, and the proposed level of production in 2016–2019 is substantially less than that evaluated in the 2013 version of UWIR. However, much of the analysis previously presented is reproduced in this report as it provides a conservative assessment of potential impacts.
A conceptual hydrogeological model was developed following review of published reports, coal seam testing and water level data. Two aquifers, the shallow alluvium and basalt, and the deeper Baralaba Coal Measures were identified as potentially affected by the exercise of underground water rights. A numerical model was developed utilising available information and projected water extraction rates from coal seam gas (CSG) operations. Predicted water level declines were compared to the regulatory trigger levels of 2 m in unconsolidated aquifers and 5 m in consolidated aquifers.
No Immediately Affected Areas (IAAs) were identified and No Long Term Affected Areas (LTAAs) were predicted after cessation of water extraction in 2016.
A water monitoring strategy was developed to quantify changes in water levels and water quality, and to improve understanding of the local hydrogeologic parameters. The monitoring strategy will be applied not only in aquifers identified as Immediately Affected, but also as a precautionary measure in the shallow aquifer, where the majority of registered landholder bores are sited.
Monitoring will allow annual review of the accuracy of the maps when information changes substantially. The collected data will be reported, and an update of this UWIR will be generated in three years.
Underground Water Impact Report - ATP 602 vii

Section 1 Introduction CDM Smith Australia Pty Ltd (CDM Smith) has been engaged by Harcourt Petroleum N.L. (Harcourt) to prepare this Underground Water Impact Report (UWIR) to meet requirements for the operation of Authority to Prospect (ATP) 602. These requirements are set out within the Level 2 Environmental Authority (EA PEN200009007) issued by the Queensland Government Department of Environment and Resource Management (DERM) now administered by the Department of Environment and Heritage Protection (EHP). Harcourt is the majority owner and operator of ATP 602.
This report has been prepared in accordance with Underground Water Impact Report (UWIR) guidelines and its purpose is to address Chapter 3 and in particular section 376 of the Water Act (Qld) 2000 which stipulates that a UWIR must include:
the quantity of water produced or taken from the area as a result of previous gas exploration or production activities;
an estimate of quantity of water to be produced or taken as a result of gas exploration or production for a 3-year period starting on the consultation day for the report;
information about aquifers affected, or likely to be affected;
maps showing the area of the affected aquifer(s) where underground water levels are expected to decline;
a water monitoring strategy; and
a spring impact management strategy.
This UWIR provides information about the relevant underground water extractions and the potential impacts on aquifers within ATP 602 as a result of dewatering during production testing.
This report represents a revision to the inaugural UWIR that was approved in 2013. No production occurred in 2013–2016, and the proposed level of production in 2016–2019 is substantially less than that evaluated in the 2013 version of UWIR. However, much of the analysis previously presented is reproduced in this report as it provides a conservative assessment of potential impacts.
1.1 Project area The Project Area is located approximately 160 km southwest of Gladstone, in central Queensland. ATP 602 comprises a single area 220 km2 in area to the south of Theodore in the Dawson River Valley (Figure 1-1). Test wells in the Timmy area were drilled in 1997. The installation involved drilling of vertical wells and laterals, coring, geophysical logging and testing for permeability.
Underground Water Impact Report - ATP 602 1-1

Underground Water Impact Report - ATP 602 • Harcourt Petroleum N.L.
Figure 1-1 Location map
Underground Water Impact Report - ATP 602 1-2

Underground Water Impact Report - ATP 602 • Harcourt Petroleum N.L.
1.2 Legislative requirements The primary legislative requirements for the management of groundwater with respect to coal seam gas activities for ATP 602 are summarised below.
1.3 Petroleum Act 1923 (QLD) ATP 602was granted under the Petroleum Act 1923 (Qld). Under the Petroleum Act 1923 (Qld), the petroleum tenure holder may take or interfere with groundwater to the extent that it is necessary and unavoidable during the course of an activity authorised under the petroleum tenure. The Act requires tenure holders to comply with underground water obligations specified in the Water Act 2000 (Qld).
1.4 Water Act 2000 (QLD) The Water Act 2000 (Qld):
Provides a comprehensive regime for the planning and management of all water resources (including vesting to the State the rights over the use, flow and control of all surface water, groundwater, rivers and springs) in Queensland.
Regulates water use and the obligations of coal seam gas producers in relation to groundwater monitoring, reporting, impact assessment and management of impacts on other water users.
Provides a framework and conditions for preparing a Baseline Assessment Plan and outlines the requirements of bore owners to provide information that the petroleum holder reasonably requires to undertake a baseline assessment of any bore.
Sets out the process for applying for a Water Licence (where water is utilised outside of a petroleum lease or not on adjacent land owned by the same person).
Sets out the process for assessing, reporting, monitoring, and negotiating with other water users regarding the impact of coal seam gas production on aquifers.
The management of impacts on groundwater caused by the exercise of groundwater right by petroleum tenement holders is achieved primarily by:
Providing a regulatory framework that:
- Requires petroleum tenure holders to monitor and assess the impact of the exercise of underground water rights on water bores and to enter into “make good” agreements with the owners of the bores;
- Requires the preparation of UWIRs that establish underground water obligations, including obligations to monitor and manage impacts on aquifers and springs;
Giving the Queensland Water Commission functions and powers for managing underground water in declared cumulative impact areas.
If a water bore has an impaired capacity as a result of CSG activities, an agreement is required to be negotiated with the owner of the bore about the following:
The reason for the bore’s impaired capacity
Underground Water Impact Report - ATP 602 1-3
Underground Water Impact Report - ATP 602 • Harcourt Petroleum N.L.
The measures the petroleum tenement holder will take to ensure the bore owner has access to a reasonable quantity and quality of water for the authorised uses and purpose of the bore;
Any monetary or non-monetary compensation payable to the bore owner for impact on the bore.
If an agreement relating to a water bore is made the agreement is taken to be a “make good” agreement for the bore. An UWIR will identify whether an Immediately Affected Area will result from CSG activities. An Immediately Affected Area is defined as an area where the predicted decline in water levels within 3 years is above the trigger threshold:
›5 m for a consolidated aquifer
2 m for an unconsolidated aquifer
0.2 m for a spring.
UWIRs are published to enable the community, including bore owners and other stakeholders, within the area of testing, to make comments. Submissions made by stakeholders will be reviewed and summarised, addressed as appropriate and provided to the Department of Environment and Heritage Protection (EHP) together with the UWIR. UWIRs are submitted for approval by EHP.
1.5 Summary of methods An assessment of impacts on underground water from the pilot testing activities within ATP 602 has been undertaken by referencing available relevant data and reports, including available geological and hydrogeological reports, records obtained from DERM and the Australian Bureau of Meteorology.
A desktop review of these data was undertaken to provide develop a conceptual hydrogeological model for this part of the Bowen Basin. The potential impacts of the current coal seam gas activities outside but in the vicinity of the ATP 602 were not incorporated in this assessment due to the limited knowledge of these activities. From this conceptual hydrogeological understanding a computer based numerical groundwater model was developed. This model was then used to predict the potential for impacts to groundwater levels. The model underpins the development of management strategies for this and any future flow testing programs.
A summary of the UWIR requirements under the Water Act and the relevant sections of this report in which they have been addressed is included in Table 1-1.
It should be noted that a requirement of the UWIR is to predict the magnitude of water level declines for affected aquifers. To this end, the UWIR must include maps showing the area of the aquifer where groundwater level is predicted to decline by more than the applicable trigger value as a result of the activities assessed. These maps must present the results of predictions of groundwater levels within 3 years following the report consultation day (this area is defined as the Immediately Affected Area); and
at any time (this area is defined as the Long Term Affected Area).
Trigger threshold values, as defined by the Water Act, are 5 m declines in water level within consolidated rock (e.g. sandstone) aquifers, 2 m declines in unconsolidated aquifers, and 0.2 m declines in water level for aquifers related to springs.
Underground Water Impact Report - ATP 602 1-4

Underground Water Impact Report - ATP 602 • Harcourt Petroleum N.L.
Water level declines have been predicted through application of a numerical hydrogeological model (refer to Section 5).
Table 1-1 Summary of UWIR requirements and sections where this is addressed in the report
Part Section UWIR
Underground water extractions 2.0 Information about affected aquifers 3.0 Maps showing the areas of affected aquifer 4.0 Water monitoring strategy 5.0 Spring impact management strategy 6.0
Underground Water Impact Report - ATP 602 1-5

Section 2 Water Production Schedule (Part A)
2.1 Summary of historically produced water Between 1995 and 2007 production testing of coal seam gas wells installed within the Baralaba Coal Measures was conducted in various well fields within ATP 602 petroleum tenure. This testing was conducted prior to the commencement of the Water Act 2000 amendments on 1 December 2010. No testing was occurring at the time of or since the enactment of these amendments. No further testing of these wells is anticipated. The wells installed as part of the earlier program were subsequently abandoned. A summary of production testing undertaken to date is included in Table 2-1 below.
Table 2-1 Summary of historical production testing
Well Permit Area Pump On Pump Off Volume KL Isla-1 602 Timmy 21/12/1995 3/10/1996 213
Tim Shay Creek-1 602 Timmy 5/02/1997 8/05/1997 87 Timmy 1 602 Timmy 27/03/2003 23/10/2007 3083
Detailed daily water production was available for Timmy 1, Tim Shay Creek 1 and Isla 1 test wells. These data is presented in Figure 2-1 below. The extraction volumes were measured using the flow meter on the pump.
Underground Water Impact Report - ATP 602 2-1

Underground Water Impact Report - ATP 602 • Harcourt Petroleum N.L.
Figure 2-1 Gas well historical test pumping
2.2 Summary of gas production wells Harcourt is proposing to undertake a single well program within the tenement which will most likely consist of a vertical fracture stimulation well. The thicker seams will be targeted for stimulation including Seam 2, 4, 5 and 6 of the Baralaba Coal Measures.
The development of the Timmy field is still to be determined and will be guided by the results from the proposed program.
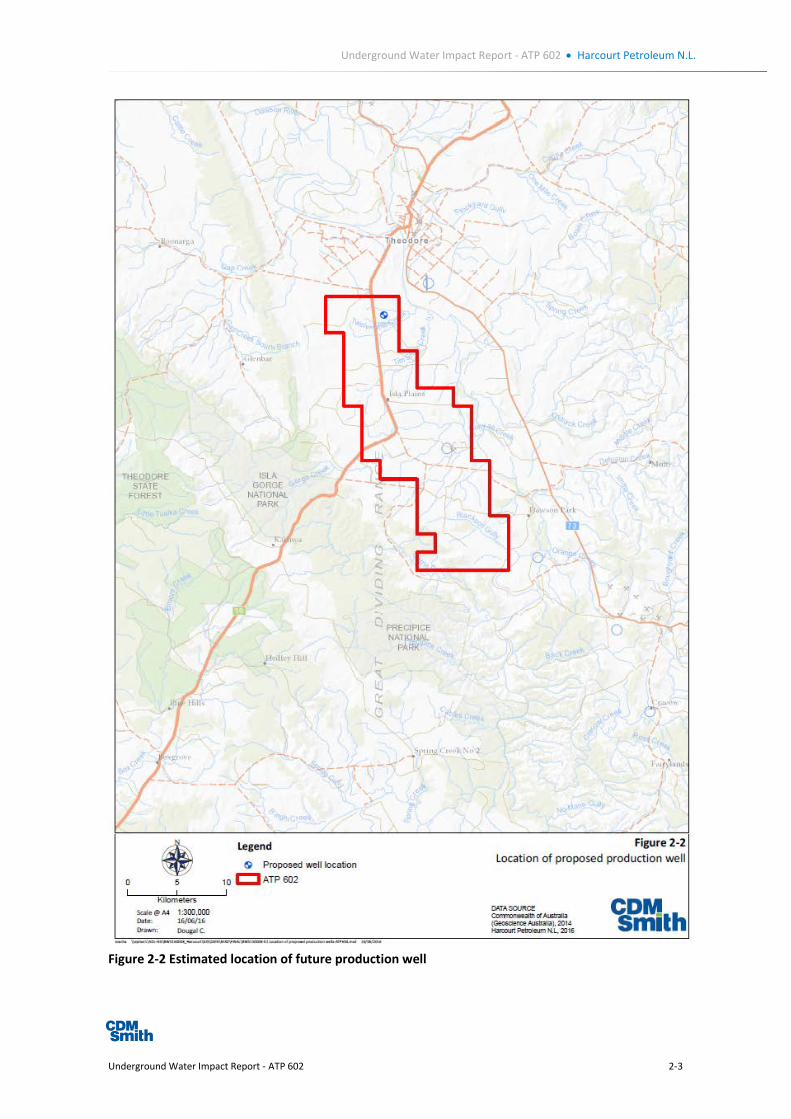
2.3 Summary of water to be produced in the next three years One well is proposed to be installed and operational over the next 3 years. The approximate location of the proposed wells is given in Figure 2-2. Estimated total water production (based on historical records) has been used to predict water abstractions as outlined in Table 2-2.
Table 2-2 Summary of water to be produced over the next five years
Number of Wells Year Average abstraction rate per well (kL/day) Total abstraction rate (kL/day)
0 1 - 0
1 2 1.7 1.7 0 3 - 0
Underground Water Impact Report - ATP 602 2-2
Underground Water Impact Report - ATP 602 • Harcourt Petroleum N.L.
Figure 2-2 Estimated location of future production well
Underground Water Impact Report - ATP 602 2-3

Section 3 Existing Geological and Hydrogeological Regime (Part B)
3.1 Regional geology The Bowen Basin is one of the major coal basins in the world and covers an area over 60,000 km2 from Collinsville to Theodore within Central Queensland. The Project area covers part of the Permo-Triassic, back-arc extensional to foreland basin that is made up of north-northwest to south-southeast trending shelves, separated by sedimentary troughs (Baker 1993; Fielding 1993). The two major troughs in the basin are the Taroom Trough and the Denison Trough. The Project area lies to the east of the Taroom Trough a north-south trending slightly asymmetric syncline, in the central part of the Bowen Basin (Figure 3-1) the Mimosa Syncline is a structural feature developed over the southern Taroom Trough and west of the Project area.
Underground Water Impact Report - ATP 602 3-1

Underground Water Impact Report - ATP 602 • Harcourt Petroleum N.L.
Figure 3-1 Regional geology map
Underground Water Impact Report - ATP 602 3-2

Underground Water Impact Report - ATP 602 • Harcourt Petroleum N.L.
The sedimentary deposition within the Basin comprises Permian, Triassic, and young Tertiary and Quaternary sediments. Most of the sedimentation in the Project area occurred in the non-marine shallow waters (Olgers, 1966). The oldest outcropping rocks (in the east of the Project area) are part of the upper Permian Gyranda Subgroup which is conformably overlain by the Rangal and Baralaba Coal Measures. Rewan Group sandstones and siltstones are the lowermost of the Triassic sequence and are overlain by the Clematis Group and the Moolayember Formation. The Rewan Group, Clematis Group and the Moolayember Formation outcrop to the west of the project area and the central area is covered by younger Tertiary and Quaternary sediments.
The fold and fault axis in this area generally trend north-northwest, which is parallel to the regional Bowen Basin trend and axis of the Mimosa Syncline to the west. The east of the Project area is bound by the Banana Fault, the east dipping thrust zone at about 8 degrees.
The schematic geological cross section (Figure 3-2) prepared by CDM Smith indicates the dipping of the layers (and the whole sedimentary sequence) to the west at around 6 to 8 degrees and the presence of faults in the area.
A summary of the regional stratigraphy of the Bowen Basin is given in Table 3-1.
Table 3-1 Regional stratigraphy of the Bowen Basin
Period Group West East
Triassic Moolayember Formation Moolayember Formation Clematis Group Clematis Group Rewan Group Rewan Group
Upper Permian Blackwater Group Bandanna Formation Baralaba Coal- Rangal Coal Measures
Back Creek Group Gyranda Subgroup Flat Top Formation Barfield Formation Oxtrack Formation
Lower Permian Back Creek Group Catherine Sandstone Ingelara Formation
Rennes Beds
Source: Dear et al, 1971 and Olgers, F.1966
Underground Water Impact Report - ATP 602 3-3

Underground Water Impact Report - ATP 602 • Harcourt Petroleum N.L.
Figure 3-2 Schematic West to East cross section through ATP602
Underground Water Impact Report - ATP 602 3-4

Underground Water Impact Report - ATP 602 • Harcourt Petroleum N.L.
3.2 Hydrogeology On a regional scale the Triassic and Permian sediments are generally not regarded as significant groundwater resource, however fractured sandstone interbeds and coal seams have generally higher permeability than the interburden material. The most productive aquifers locally are Quaternary alluvium and Tertiary basalt.
Conceptually the area consists of five distinct hydrostratagraphic units (HSUs) (Table 3-2) (from youngest to oldest):
Tertiary basalt and Quaternary alluvium;
Clematis Group;
Rewan Group;
Baralaba Coal Measures; and
Gyranda Subgroup.
3.2.1 Quaternary alluvial aquifers and Tertiary Volcanics
The alluvium is generally a highly transmissive unit comprised of layers of gravel, sand, and clays. It is classed as porous medium since groundwater occurs within voids between grain particles. In the Project area alluvial aquifers are associated with Lonesome, Kianga and Castle Creek, and surface water and groundwater interaction is likely. Monitoring data suggest that the alluvial aquifer is unconfined and in connection with surface water features such as streams and rivers. The primary source of recharge to the aquifer is rainfall and to a minor extent interaction with surface water. The alluvial system loses water via baseflow (contribution to surface water), evapotranspiration and flow to other connected aquifers. The thickness of this unit is around 20 m and the yield is up to 35 L/s (DNRM groundwater database).
Basalt outcrops over a very small area of the tenement, however a number of groundwater bores within the ATP 602 have been installed in this unit. Flow through volcanics occurs mostly via fractures with the yields of up to 5.6 L/s (DEHP groundwater database) within this region.
Both local aquifers in alluvium and basalt volcanics provide the most reliable water supply within the Project area.
3.2.2 Triassic sedimentary aquifers
Triassic sedimentary units within the Project area include the Rewan Group and the Clematis Group further to the west. The Rewan Group outcrops within the western area of the project, while Clematis Group outcrops further to the west and outside of the Project boundary.
The Lower to Middle Triassic Clematis sediments are primarily represented by quartz sandstone with minor siltstone and mudstone. They form a major aquifer within the Great Artesian Basin, however locally this formation is a less reliable source of water due to increasing depth of cover and small outcrop area. Flow via primary porosity is limited, with the vast majority of flow through the system via secondary porosity (fractures). For the purposes of this project an average horizontal and vertical conductivity is considered suitable. The average porosity of the sandstone is reported (Gray, 1968) to be 21%, hydraulic conductivity is reported in the range from 0.4 to
Underground Water Impact Report - ATP 602 3-5
Underground Water Impact Report - ATP 602 • Harcourt Petroleum N.L.
37 m/d, with an average of 8.5 m/d. The thickness of this unit is approximately 150 m in the eastern edge of Bowen basin and is largely uniform.
Recharge to this unit occurs via direct rainfall where the strata outcrops, but also via leakage from overlaying alluvium (where present). Discharge occurs either via lateral down-gradient flow or evapotranspiration.
The Lower Triassic Rewan Group is represented by argillaceous mudstone, siltstone and labile sandstone and is generally regarded as the low permeability strata. Within the Project area this formation is around 410 m thick. Gray (1968) states that the average porosity of the sandstone in the Rewan Group is 16 to 17%, and hydraulic conductivity varies from negligible in the lower Rewan to 1.25x10⁻³ m/d in the upper Rewan Group.
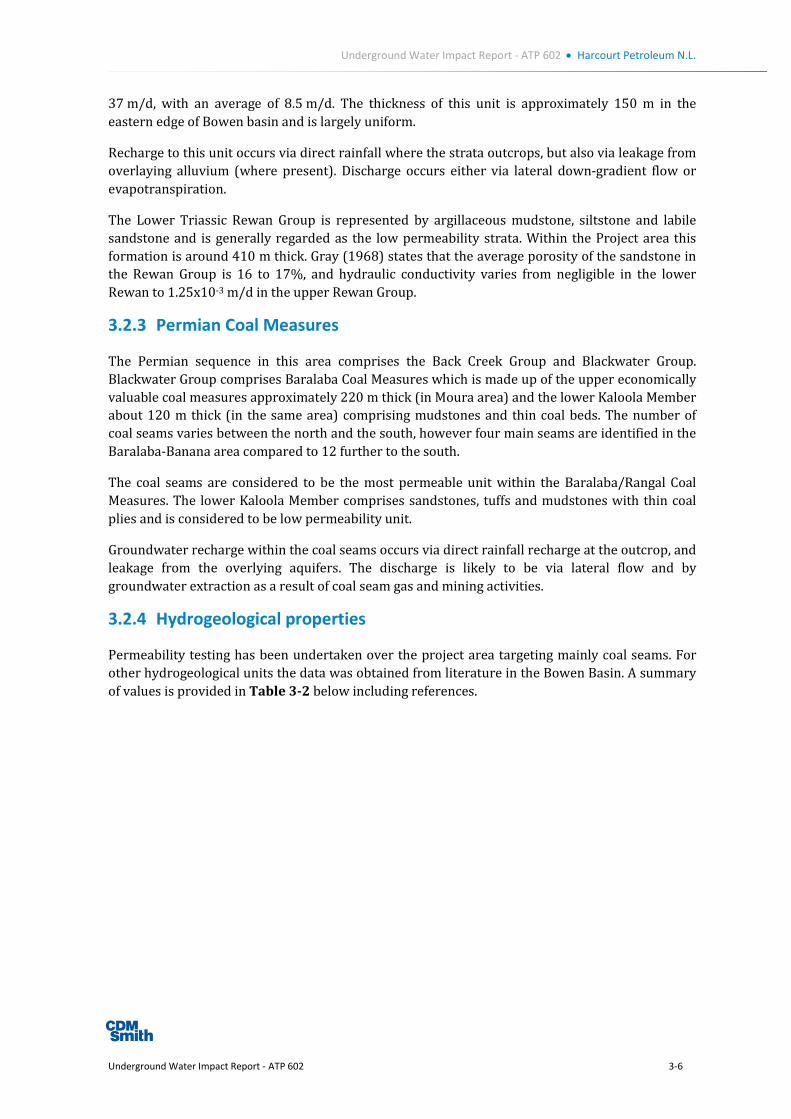
3.2.3 Permian Coal Measures
The Permian sequence in this area comprises the Back Creek Group and Blackwater Group. Blackwater Group comprises Baralaba Coal Measures which is made up of the upper economically valuable coal measures approximately 220 m thick (in Moura area) and the lower Kaloola Member about 120 m thick (in the same area) comprising mudstones and thin coal beds. The number of coal seams varies between the north and the south, however four main seams are identified in the Baralaba-Banana area compared to 12 further to the south.
The coal seams are considered to be the most permeable unit within the Baralaba/Rangal Coal Measures. The lower Kaloola Member comprises sandstones, tuffs and mudstones with thin coal plies and is considered to be low permeability unit.
Groundwater recharge within the coal seams occurs via direct rainfall recharge at the outcrop, and leakage from the overlying aquifers. The discharge is likely to be via lateral flow and by groundwater extraction as a result of coal seam gas and mining activities.
3.2.4 Hydrogeological properties
Permeability testing has been undertaken over the project area targeting mainly coal seams. For other hydrogeological units the data was obtained from literature in the Bowen Basin. A summary of values is provided in Table 3-2 below including references.
Underground Water Impact Report - ATP 602 3-6

Underground Water Impact Report - ATP 602 • Harcourt Petroleum N.L.
Table 3-2 Summary of hydrogeological properties for major HSUs in the Bowen Basin.
Formation Type Kh [m/d] Kv [m/d] T [m2/d] Sy [-] Ss [1/m] Source
Quaternary Alluvium Aquifer
1 to 40 0.2-2 0.05-0.18 0.0005 2
100 10 0.25 0.001 1
0.7-1.5 6 to 15 3
10 1 0.2 0.0001 7
0.088-0.38 5
Tertiary Basalt Aquifer 0.005-0.19 5
0.05 0.005 0.05 0.00005 2
Clematis Group Aquifer 0.0025 -2.5 0.2 8
Rewan Group Aquiclude
0.00001-0.0001
0.000001-0.00001 0.005 0.000001 1
0.00075 0.0000001 0.05 0.00005 2
0.1 0.05 0.000005 6
Rangal and Baralaba Coal Measures
Coal Seams, Aquifers
0.0028-0.47 0.008-1.9 4
0.3-178.6 3
0.000001-1 0.000001-1 0.01 0.000001 1 0.000041-
0.16 0.0000083-
0.082 0.01 0.0000002 2
0.111-0.9 0.08 0.0004 7
5 0.05 0.000005 6
0.001-20 0.01-0.05 10
Interburden, Aquicludes
0.0001 0.00000007 0.05 0.00001 2
0.1 0.05 0.000005 6
Back Creek Group Aquitard/ Basement 0.01-0.001 0.001-
0.00001 0.03--0.18 5E-4 - 5E-6 9
Source of data is 1: AGE (2006), 2: Ausenco-Norwest (2012), 3: JBT (2012), 4: Parsons Brinckerhoff (2011), 5: URS (2009), 6: BHP Billiton Mitsubishi Alliance (2009), 8: Gray (1968), 9: URS (2012), 10; Simeone, S.F. and Corbett, B.J. (2003)
3.3 Conceptual hydrogeological model
3.3.1 Groundwater levels and flow
The primary source of groundwater data was the Department of Natural Resources and Mines (DNRM) groundwater database, field survey of registered bores and historical testing of wells for coal seam gas purposes. Within the Project area water level data is available for alluvium associated with creeks and rivers, Tertiary basalts, the Clematis Group and the Moolayember Formation and the Rewan Group, the Baralaba Coal Measures and the Gyranda Subgroup. However, not all bores have recorded water levels.
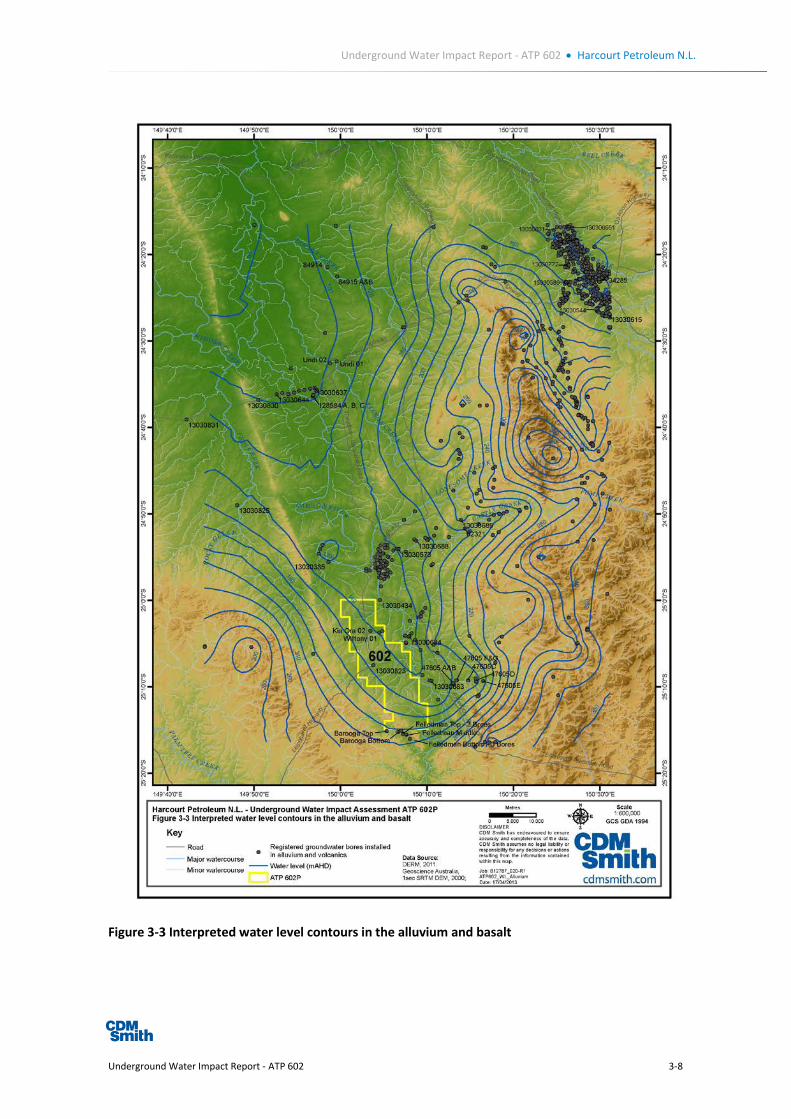
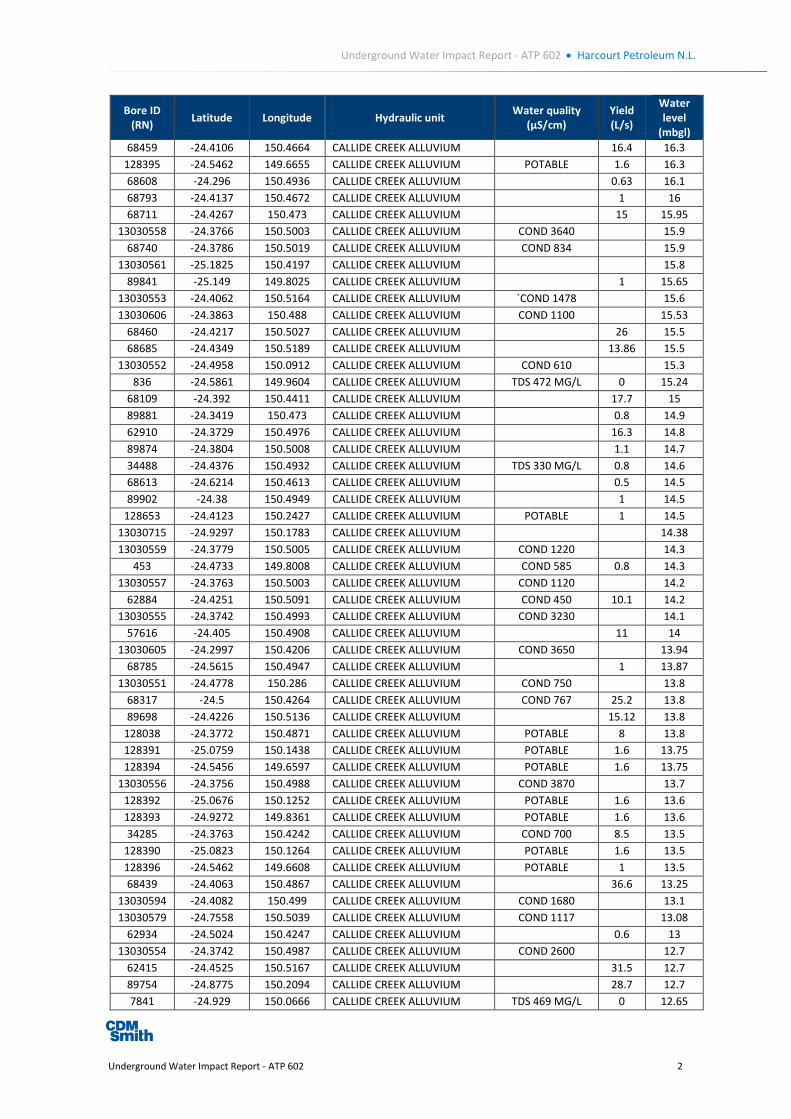
This dataset includes 140 bores within a 10 km perimeter of the ATP 602 boundary. Groundwater levels in the shallow alluvium vary from 0.5 to 20m below ground. Figure 3-3 shows the interpreted groundwater level contours within the alluvium and Tertiary basalt using the full dataset of 855 bores within a 17,600 km2 area around ATP 602 that was obtained from the groundwater database. Groundwater flow within these shallow aquifers tends to follow the topography and is generally toward local rivers and creeks. The list of bores used is given in Appendix A. The yield in those bores averages 9 L/s with the maximum recorded 65 L/s for a bore in Krombit Creek alluvium (DNRM groundwater database). Over two thirds of the bores have stated yields less than 2 L/s (DNRM groundwater database).
Underground Water Impact Report - ATP 602 3-7
Underground Water Impact Report - ATP 602 • Harcourt Petroleum N.L.
Figure 3-3 Interpreted water level contours in the alluvium and basalt
Underground Water Impact Report - ATP 602 3-8

Underground Water Impact Report - ATP 602 • Harcourt Petroleum N.L.
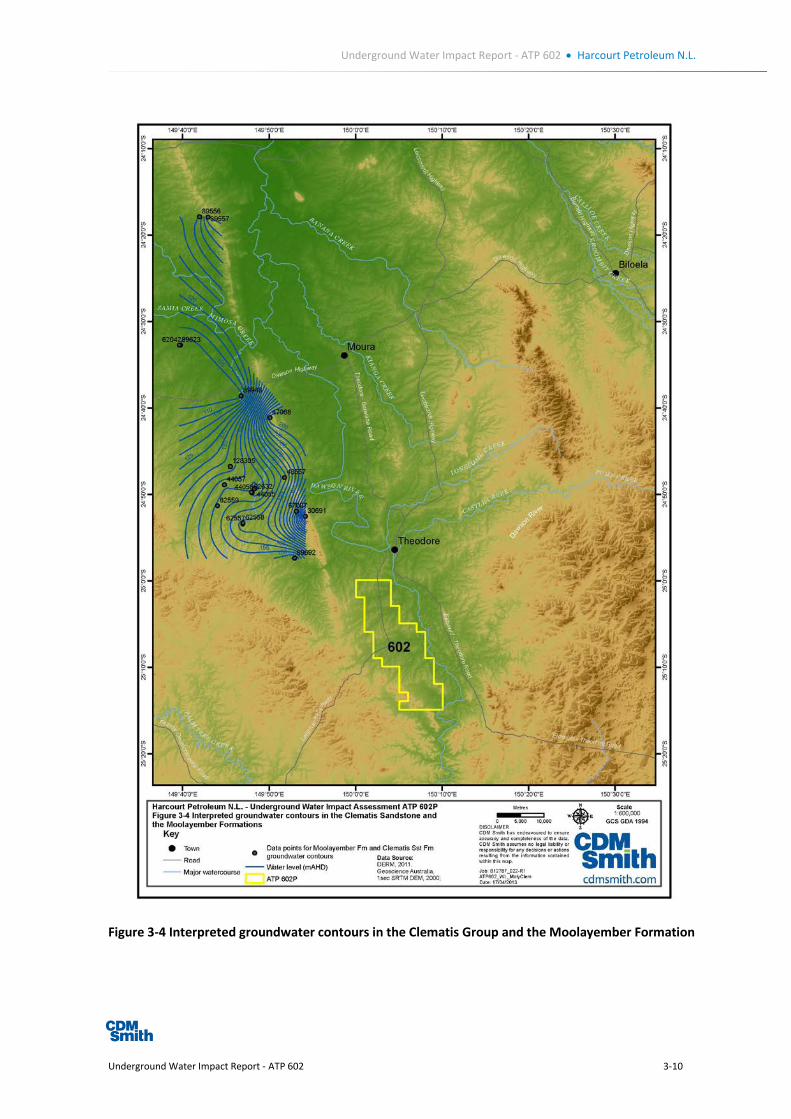
The database holds records for 18 DNRM registered bores installed in the Clematis Group and the Moolayember Formation with recorded water levels; these are listed in Table 3-3 below. The water strike (during drilling) in these two hydrostratagraphic units varied from 5.6 mbgl to 33.8 mbgl, however this information was recorded when the bores were installed and may not be representative of current conditions. It is also noted that these bores are located in the area where these units outcrop and therefore represent the shallow and unconfined part of the aquifer. Water yield is low, generally below 1 L/s Figure 3-4 shows the interpreted groundwater contours for the Clematis Group and the Moolayember Formation based on the available groundwater levels within the registered bores. The interpreted groundwater flow (based on data available for the area to the west of the Project) is to the west and follows the overall dip of the sedimentary sequence.
Table 3-3 Summary of registered bores in the Clematis Group and the Moolayember Formation
Bore ID (RN) Latitude Longitude Aquifer Water quality (µS/cm) Yield (L/s)
Standing water level
(mbgl)
30691 -24.9414 150.0748 Moolayember Formation
NA 0.22 33.8
62042 -24.3239 150.4521 Moolayember Formation
Brackish 0.63 21.3
89556 -24.554 150.3769 Moolayember Formation
Salty 0.5 20
89623 -24.3505 150.4383 Moolayember Formation
NA 0.4 18.3
89692 -24.418 150.4254 Moolayember Formation
Brackish 0.78 17.7
128305 -24.8742 150.1597 Moolayember Formation
Potable/Brackish
0.78 16.5
44057 -24.4001 150.4814 Moolayember Formation
6900 0.5 15.9
62557 -25.2709 149.6703 Moolayember Formation
6600 0.25 15.2
62558 -24.374 150.5113 Moolayember Formation
2700 0.76 15
89948 -24.3331 150.4252 Moolayember Formation
4800 1.4 14.17
44055 -24.3057 150.4547 Moolayember Formation
6150 0.76 12
62632 -24.427 150.5041 Moolayember Formation
2720 0.63 9.3
44056 -24.3409 150.4523 Moolayember Formation
1555 0.95 8.6
67007 -24.3651 150.4523 Clematis Group
990 1.89 18.29
89557 -24.5701 150.3711 Clematis Group
Potable 1.9 8
43557 -24.3815 150.4996 Clematis Group
NA NA NA
47008 -24.3046 150.4258 Clematis Group
900 0.08 5.6
43557 -24.3815 150.4996 Clematis Group
570 0.39 27.58
Note: Information from the DNRM groundwater database NA –information not available
Underground Water Impact Report - ATP 602 3-9
Underground Water Impact Report - ATP 602 • Harcourt Petroleum N.L.
Figure 3-4 Interpreted groundwater contours in the Clematis Group and the Moolayember Formation
Underground Water Impact Report - ATP 602 3-10

Underground Water Impact Report - ATP 602 • Harcourt Petroleum N.L.
Water level information is available for five bores installed in Baralaba Coal Measures, summary is provided in Table 3-4.
Table 3-4 Summary of registered bores installed in the Baralaba Coal Measures
Bore name (RN) Latitude Longitude Aquifer
Electrical Conductivity
(µS/cm) Yield (L/s)
Standing water level
(mbgl)
84909 -24.3865 150.4352 Baralaba Coal Measures
Brackish 0.5 33.1
84912 -24.3163 150.4192 Baralaba Coal Measures
8600 1.33 20.5
84913 -24.3572 150.5054 Baralaba Coal Measures
4600 0.52 20
128169 -24.3175 150.4638 Baralaba Coal Measures
NA 1.4 13
128045 -24.424 150.5189 Baralaba Coal Measures
870 1.5 11
Note: NA –not available Groundwater levels in Baralaba Coal Measures range from 11 mbgl to 33.1mbgl, and reflect the status in the shallow unconfined part of the aquifer. The recorded yield is relatively low with a maximum recorded 1.5 L/s. The available water levels were used in preparation of the groundwater contour map Figure 3-5 shows the interpreted groundwater contours in the central area only, due to the location of registered bores and therefore available data. The interpreted groundwater based on this limited data set is to the north. However, it is considered likely that the groundwater gradient in this unit is to the north west and is influenced by the dip of the coal measures to some degree.
Underground Water Impact Report - ATP 602 3-11

Underground Water Impact Report - ATP 602 • Harcourt Petroleum N.L.
Figure 3-5 Interpreted contour maps for Baralaba Coal Measures
Underground Water Impact Report - ATP 602 3-12

Underground Water Impact Report - ATP 602 • Harcourt Petroleum N.L.
3.3.2 Aquifer recharge and discharge
Recharge to shallow alluvium and basalt occurs directly via rainfall recharge, with small volumes of leakage from the losing/ephemeral stream systems. Some connectivity between groundwater and the surface water system is evident and it is likely that some contribution to deeper aquifers is made by flow from the overlying volcanic system.
Groundwater recharge to Triassic and Permian units also occurs via direct recharge to the rock outcrop. Where these are covered by younger basalt flows and Tertiary units, vertical leakage is possible.
The cumulative deviation from mean (CDFM) method is often used to identify whether observed water level fluctuations are due to rainfall recharge or other processes. CDFM is the accumulated difference between the actual rainfall recorded (e.g. in a month or a year) and the long term mean. If there is poor correlation between groundwater level hydrographs and the CDFM, it may be concluded that rainfall recharge is not significant, or that some other recharge processes are dominant (e.g. regional inflow, upward leakage from the deeper aquifer systems etc.).
The closest Bureau of Meteorology (BoM) rainfall station (Station number 039071) is located at Moura. The data from this station was used in the CDFM analysis, along with long term groundwater level data from bores installed in the alluvium and the Rewan Group. The hydrographs and data are further discussed in the next section.
3.3.3 Historical groundwater level trend analysis
DNRM have a number of long term monitoring bores within the Project area1, most of which are installed in alluvium, namely Castle Creek Alluvium and Dawson River Alluvium. The data ranges for a period from 1968 to present. A small number of bores installed in the Moolayember Formation and Rewan Group have also been monitored on a continual basis since 2001.
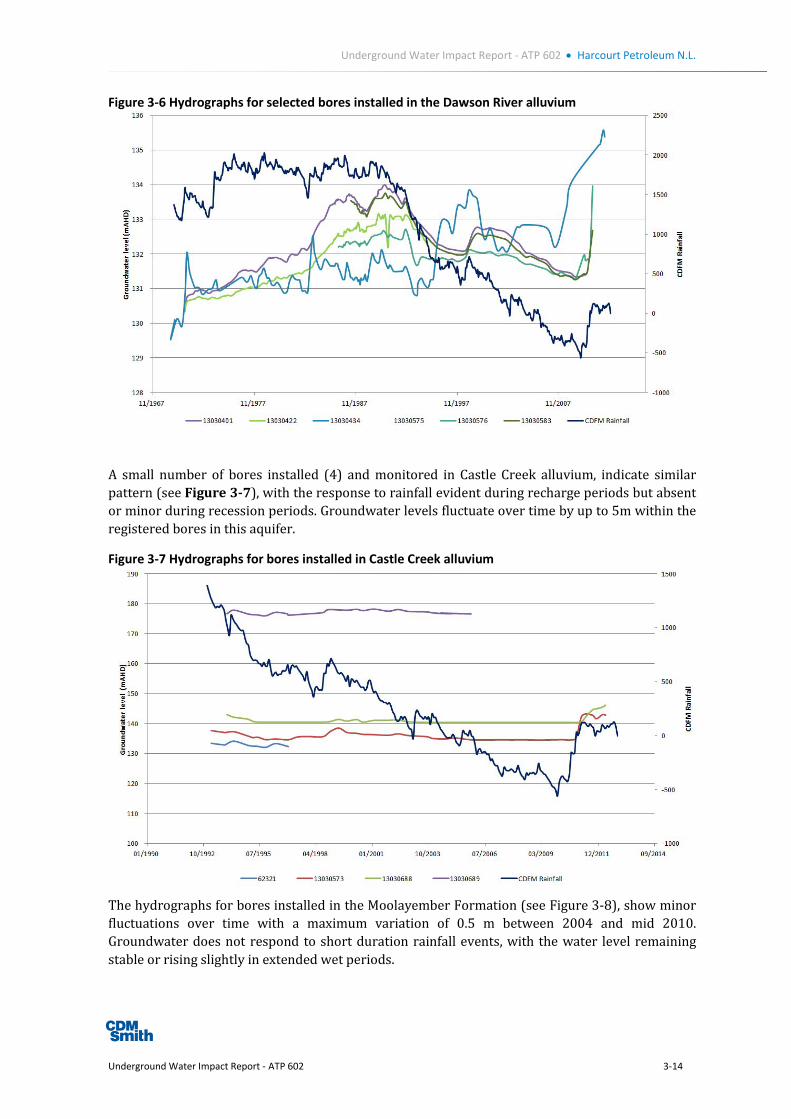
Figure 3-6 shows hydrographs for bores installed in shallow Dawson River alluvium, which are superposed on the long term rainfall data presented as CDFM.
Selected hydrographs for the Dawson River alluvium are plotted in Figure 3-6 these generally indicate that groundwater level reacts to rainfall recharge events; however the response is subdued during recession periods and pronounced during recovery periods. This may indicate that there is a good connection between this aquifer and surface water which most likely provides recharge to the aquifer during low rainfall periods. The observed groundwater levels fluctuate by up to 5m during the monitored period.
1 The water level data presented is the most recent available, based on the DNRM groundwater database dated 13/04/16
Underground Water Impact Report - ATP 602 3-13
Underground Water Impact Report - ATP 602 • Harcourt Petroleum N.L.
Figure 3-6 Hydrographs for selected bores installed in the Dawson River alluvium
A small number of bores installed (4) and monitored in Castle Creek alluvium, indicate similar pattern (see Figure 3-7), with the response to rainfall evident during recharge periods but absent or minor during recession periods. Groundwater levels fluctuate over time by up to 5m within the registered bores in this aquifer.
Figure 3-7 Hydrographs for bores installed in Castle Creek alluvium
The hydrographs for bores installed in the Moolayember Formation (see Figure 3-8), show minor fluctuations over time with a maximum variation of 0.5 m between 2004 and mid 2010. Groundwater does not respond to short duration rainfall events, with the water level remaining stable or rising slightly in extended wet periods.
Underground Water Impact Report - ATP 602 3-14

Underground Water Impact Report - ATP 602 • Harcourt Petroleum N.L.
Figure 3-8 Hydrographs for bores installed in the Moolayember Formation
Hydrographs for two bores installed in the Rewan Group (see Figure 3-9) indicate that this HSU is not actively recharged by rainfall. The maximum water level fluctuation is up to 0.8 m between 2004 and 2010. The water level remains stable over time, with a slight rise unlikely to be associated with specific recharge events.
Figure 3-9 Hydrographs for bores installed in the Rewan Group
Underground Water Impact Report - ATP 602 3-15

Underground Water Impact Report - ATP 602 • Harcourt Petroleum N.L.
3.3.4 Groundwater quality
Groundwater quality data was obtained from the DNRM database and from field investigations undertaken as part of this UWIR.
The information available from the database indicates that groundwater within alluvium and Tertiary basalt is fresh to saline, with salinity up to 5000 µS/cm in the Callide Creek alluvium, 1050 µS/cm in the Castle Creek alluvium, up to 10000 µS/cm in the Dawson River alluvium, 7800 µS/cm in the Kroombit River alluvium and 6750 µS/cm in the Prospect Creek alluvium.
The groundwater quality of the Moolayember Formation is typically brackish to saline, with the recorded salinity ranging from 1555µS/cm to 6900µS/cm (Table 3-3). Within the Clematis Group the water quality is less saline and described as “potable” with the maximum reported salinity being 990 µS/cm.
Water quality recorded in the DNRM database for Baralaba Coal Measures, indicates that the groundwater is brackish with maximum recorded salinity being 8600 µS/cm (Table 3-4).
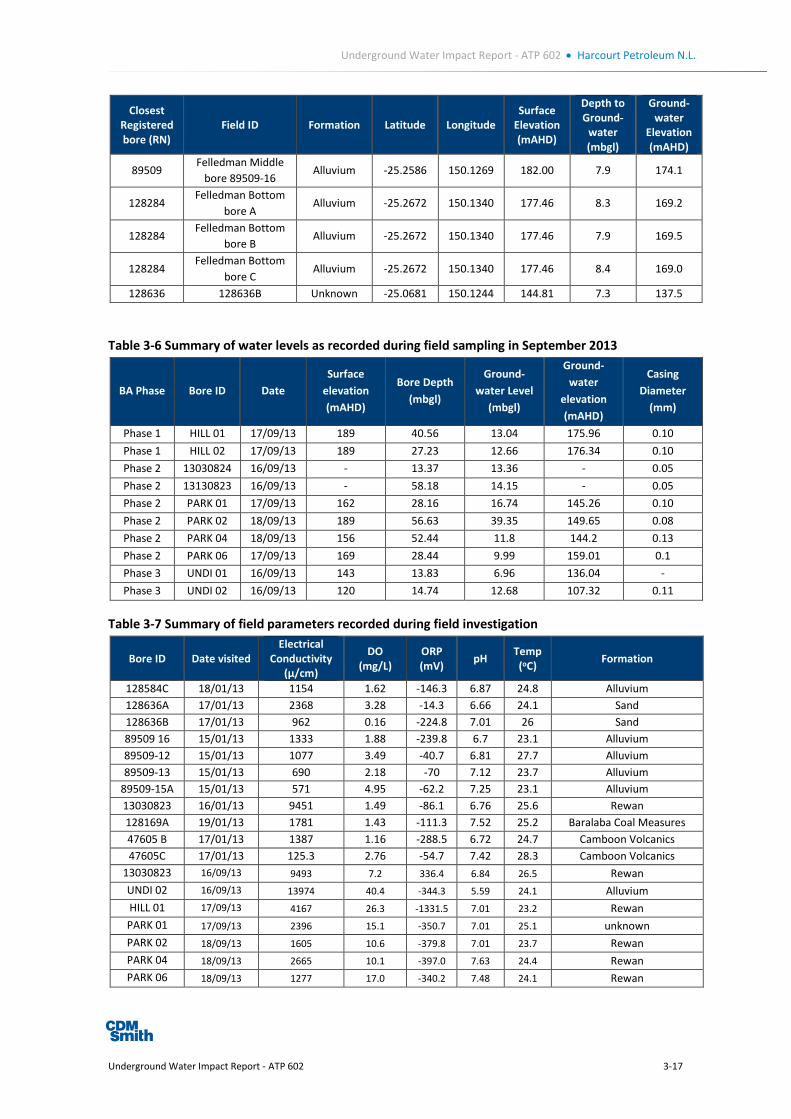
In addition to a review of the groundwater database fieldwork was undertaken in January and September 2013. Field work involved gauging of groundwater levels, purging and sampling of selected groundwater bores where possible. Sampled bores are included in Figure 3-10. The water levels are provided in Table 3-5 and Table 3-6 and water quality in Table 3-7. Some of the bores where water level was measured were not available for water quality sampling.
Table 3-5 Summary of water levels as recorded during field sampling in January 2013
Closest Registered bore (RN)
Field ID Formation Latitude Longitude Surface
Elevation (mAHD)
Depth to Ground-
water (mbgl)
Ground-water
Elevation (mAHD)
128169 Kia Ora 01 Baralaba
Coal Measures
-25.0588 150.0809 150.52 6.2 144.2
128169 Willtony 01 Alluvium -25.0618 150.0747 152.75 8.1 144.6 13030823 13030823 Rewan -25.1247 150.0632 170.82 13.8 156.9 13030824 13030824 Quaternary -25.1247 150.0632 170.82 13.1 157.8 13030684 13030684 -25.0684 150.1328 148.34 7.8 140.6
47605 47605A Camboon Volcanics
-25.1610 150.2182 163.97 5.8 158.2
47605 47605B Camboon Volcanics
-25.1610 150.2182 163.97 5.5 158.4
47605 47605C Camboon Volcanics
-25.1543 150.2461 176.29 7.7 168.5
47605 47605D Camboon Volcanics
-25.1503 150.2605 182.53 9.3 173.2
47605 47605E Camboon Volcanics
-25.1554 150.2750 186.33 6.9 179.4
47605 47605F Camboon Volcanics
-25.1538 150.2241 167.40 8.4 159.0
89509 Barooga bottom bore 89509-13
Alluvium -25.2532 150.1115 193.00 4.9 188.0
89509 Felledman Top Bore
pvc Alluvium -25.2570 150.1207 184.13 6.3 177.8
89509 Felledman Top Bore
(old steel) 89509-15B
Alluvium -25.2570 150.1207 184.13 6.1 178.0
Underground Water Impact Report - ATP 602 3-16
Underground Water Impact Report - ATP 602 • Harcourt Petroleum N.L.
Closest Registered bore (RN)
Field ID Formation Latitude Longitude Surface
Elevation (mAHD)
Depth to Ground-
water (mbgl)
Ground-water
Elevation (mAHD)
89509 Felledman Middle
bore 89509-16 Alluvium -25.2586 150.1269 182.00 7.9 174.1
128284 Felledman Bottom
bore A Alluvium -25.2672 150.1340 177.46 8.3 169.2
128284 Felledman Bottom
bore B Alluvium -25.2672 150.1340 177.46 7.9 169.5
128284 Felledman Bottom
bore C Alluvium -25.2672 150.1340 177.46 8.4 169.0
128636 128636B Unknown -25.0681 150.1244 144.81 7.3 137.5
Table 3-6 Summary of water levels as recorded during field sampling in September 2013
BA Phase Bore ID Date Surface
elevation (mAHD)
Bore Depth (mbgl)
Ground-water Level
(mbgl)
Ground-water
elevation (mAHD)
Casing Diameter
(mm)
Phase 1 HILL 01 17/09/13 189 40.56 13.04 175.96 0.10 Phase 1 HILL 02 17/09/13 189 27.23 12.66 176.34 0.10 Phase 2 13030824 16/09/13 - 13.37 13.36 - 0.05 Phase 2 13130823 16/09/13 - 58.18 14.15 - 0.05 Phase 2 PARK 01 17/09/13 162 28.16 16.74 145.26 0.10 Phase 2 PARK 02 18/09/13 189 56.63 39.35 149.65 0.08 Phase 2 PARK 04 18/09/13 156 52.44 11.8 144.2 0.13 Phase 2 PARK 06 17/09/13 169 28.44 9.99 159.01 0.1 Phase 3 UNDI 01 16/09/13 143 13.83 6.96 136.04 - Phase 3 UNDI 02 16/09/13 120 14.74 12.68 107.32 0.11
Table 3-7 Summary of field parameters recorded during field investigation
Bore ID Date visited Electrical
Conductivity (µ/cm)
DO (mg/L)
ORP (mV) pH Temp
(oC) Formation
128584C 18/01/13 1154 1.62 -146.3 6.87 24.8 Alluvium 128636A 17/01/13 2368 3.28 -14.3 6.66 24.1 Sand 128636B 17/01/13 962 0.16 -224.8 7.01 26 Sand 89509 16 15/01/13 1333 1.88 -239.8 6.7 23.1 Alluvium 89509-12 15/01/13 1077 3.49 -40.7 6.81 27.7 Alluvium 89509-13 15/01/13 690 2.18 -70 7.12 23.7 Alluvium
89509-15A 15/01/13 571 4.95 -62.2 7.25 23.1 Alluvium 13030823 16/01/13 9451 1.49 -86.1 6.76 25.6 Rewan 128169A 19/01/13 1781 1.43 -111.3 7.52 25.2 Baralaba Coal Measures 47605 B 17/01/13 1387 1.16 -288.5 6.72 24.7 Camboon Volcanics 47605C 17/01/13 125.3 2.76 -54.7 7.42 28.3 Camboon Volcanics
13030823 16/09/13 9493 7.2 336.4 6.84 26.5 Rewan UNDI 02 16/09/13 13974 40.4 -344.3 5.59 24.1 Alluvium HILL 01 17/09/13 4167 26.3 -1331.5 7.01 23.2 Rewan PARK 01 17/09/13 2396 15.1 -350.7 7.01 25.1 unknown PARK 02 18/09/13 1605 10.6 -379.8 7.01 23.7 Rewan PARK 04 18/09/13 2665 10.1 -397.0 7.63 24.4 Rewan PARK 06 18/09/13 1277 17.0 -340.2 7.48 24.1 Rewan
Underground Water Impact Report - ATP 602 3-17

Underground Water Impact Report - ATP 602 • Harcourt Petroleum N.L.
The groundwater field data indicate that groundwater in the shallow alluvium is of relatively good quality (fresh to brackish) with maximum electrical conductivity (EC) value of 2638µS/cm, while the water quality in the stratigraphically lower Rewan Group is poor (saline). The water quality of the samples taken from the Baralaba Coal Measures (BCM) is relatively brackish with EC up to 1781µS/cm, however it should be noted that although the DNRM groundwater database lists this bore (RN128169) as being installed in the Baralaba Coal Measures anecdotal evidence and the measured total depth of this bore suggests that it is actually installed in an overlying unit..
The water quality data collected in the field aligns well with overall water quality given in the DNRM groundwater database.
Full laboratory analysis of samples taken during January and September 2013 fieldwork is provided in Appendix B.
Water quality from the Baralaba Coal Measures was obtained from limited sampling undertaken in 2009 and 2010. The results are summarised in Table 3-8.
Table 3-8 Summary of water quality from production wells in Baralaba Coal Measures
Parameter Average value
pH 8.4
Electrical Conductivity (µS/cm) 10582
Underground Water Impact Report - ATP 602 3-18

Underground Water Impact Report - ATP 602 • Harcourt Petroleum N.L.
Figure 3-10 Sampled Groundwater Bores - January 2013
Underground Water Impact Report - ATP 602 3-19

Underground Water Impact Report - ATP 602 • Harcourt Petroleum N.L.
3.3.5 Aquifer connectivity
Regionally within the Bowen Basin, northwest to southeast trending faults run through the project area. This faulting is as a result of tectonic activity following the Early Permian (Silwa et al. 2008). These faults exhibit significant throw and are believed to act as groundwater barriers to underground water flow east-west across the faults. Numerous minor fault zones are present within the project area, and within the central area a reverse fault with mapped with vertical throw of over 60 m. Geological interpretation of aerial photographs and cores suggest that a local set of faults trends east-west , the strata being downthrown on the south (Chong, 1971). A review of groundwater levels in monitoring water bores relative to the faults in the project area was inconclusive in determining whether the faults truly are sealing, as insufficient data exists.
Connectivity between underlying and overlying aquifers has not been assessed through pumping tests, however long term monitoring and water quality analysis provides some information on the aquifer connectivity. Generally, the superficial alluvial aquifer is separated from the Baralaba Coal Measures by low conductivity interburden and the low conductivity Triassic Rewan Group. Review of long term alluvial trend analysis indicates that the fluctuation in shallow aquifer are the result of rainfall recharge condition and are not impacted by numerous gas testing that were historically undertaken in the vicinity of the project area. In addition, the water quality data suggests that there is limited vertical connectivity between the alluvium and the underlying aquifers based on the generally better water quality within the alluvium compared to the Clematis Group and the Baralaba Coal Measures.
3.3.6 Groundwater use
A review of DNRM database was undertaken to identify the registered water bores use within the ATP 602 area. No information was found which indicates the bore use, however during the field assessment it was found that the bore use in this area is predominantly for stock watering with some bores in isolated areas used for domestic supply.
3.3.7 Summary
The hydrogeological characterisation for ATP 602 can be summarised by the following key points, with reference to Figure 3-1 to Figure 3-9:
The sedimentary sequence comprises four hydraulic units (superficial Quaternary/Tertiary, Triassic, Permian coal seam groups, and lower Permian) with various hydraulic conductivities. The older Permian units outcrop over the central and eastern part of the project, while the Triassic units occur to the west. The presence of the Mimosa Syncline to the west of ATP 602 results in the whole sedimentary sequence dipping relatively steeply towards the syncline axis at about 10 to 40 degrees;
The project area is bound to the east by the Banana Fault which extends in a north south direction (similar to other structures in the Bowen Basin), and to the south by granite intrusions. To the west, the axis of the Mimosa Syncline represents the barrier to flow;
Groundwater flow in the low permeability Triassic and Permian strata is relatively slow and has long residence times; therefore the groundwater quality is generally poor as the water slowly flows through the rock dissolving soluble salts. Available groundwater data indicate that the groundwater in the Permian and Triassic strata is saline;
Groundwater flow in the shallow basalt and alluvium follows the topography. The flow in the Clematis Group is in an easterly direction and follows the dip of the strata. The assessment of
Underground Water Impact Report - ATP 602 3-20

Underground Water Impact Report - ATP 602 • Harcourt Petroleum N.L.
flow in the Baralaba Coal Measures (to the northwest) is limited to bores located along the structural lineament extending north-south. This interpretation is based on data collected over different time periods and within the outcrop zone only, and may not be entirely accurate;
Water level contouring of the heads in alluvium and basalt demonstrates that heads correlate with topography, indicating recharge at higher outcrop areas and discharge at low-lying areas. The rainfall represents important source of recharge to alluvial aquifers and water level fluctuation of 5m reflects this finding;
In areas where the Permian strata outcrops and is not overlain by alluvium or basalt, the aquifer is unconfined to semi-confined. With depth, underlying units such as the Rewan Group and the Baralaba Coal Measures become confined;
The shallow aquifer system is recharged mainly through rainfall infiltration. Groundwater recharge occurs in areas of high relief where strata outcrops, as well as through better drained soils in the mid and lower slopes and in the valley where Permian rocks subcrop. Deeper hydrostratagraphic units are recharged at the outcrop;
Where the water table is shallow, evapotranspiration can become an aquifer discharge process; and
Historical water level trend and water quality data analysis indicates that there is limited connectivity between the shallow alluvial aquifers and the deeper Baralaba Coal Measures. Connectivity is further limited by the presence of the low permeability Rewan Group.
Underground Water Impact Report - ATP 602 3-21
Section 4 Impacts to Groundwater System (Part C) The 2013 UWIR undertook an impact analysis using a numerical groundwater model (see Appendix C). This analysis is no longer entirely relevant because the production and water abstraction rates modelled substantially exceeded that which is proposed for ATP 602 over the next few years.
The modelling did, however, show that under these higher than proposed abstractions there were no Immediate or Long Term Affected Areas predicted at ATP 602 in the coal seams where extraction takes place or in the overlying Alluvium aquifer. Therefore, significant drawdown impacts are considered very unlikely under the much lower planned abstraction rates over the next three years.
Underground Water Impact Report - ATP 602 4-1

Section 5 Water Monitoring Strategy (Part D)
5.1 Rationale The underground water monitoring strategy has been developed to address the findings of this UWIR, and to keep track of water level and water quality changes caused by the exercise of underground water rights at ATP 602. Although no Immediately Affected Areas or Long Term Affected Areas were identified, the water monitoring strategy proposed has been developed as a precautionary measure to improve the knowledge of groundwater resources in the area.
Local registered bores are primarily drawing a water supply from the shallow Quaternary alluvial and Tertiary basalt aquifers. These superficial aquifers are separated from the perforated and exposed intervals of the coal seam production wells by lower permeability interburden and Rewan Groups. In addition, the production wellbores are cemented and cased to best practice to avoid aquifer cross-contamination. Modelling results show no anticipated impact in the shallow aquifers. Therefore, it is not considered necessary for the underground water monitoring strategy to focus on these aquifers.
There are no springs identified within ATP 602, as discussed in Section 6 Therefore, this monitoring strategy also does not include provisions for monitoring springs.
The modelling (Appendix C) predicts that there will be some drawdown in the Baralaba Coal Measures, with maximum drawdown of 1.6 m (assuming abstraction rates that are substantially higher than what is proposed). However after simulated pumping ceases, the impact reduces rapidly and there are no Immediate or Long Term Affected Areas. Given that actual abstraction rates are planned to be significantly less than those modelled, drawdown impacts would also be expected to be much less. Therefore, a large-scale groundwater monitoring program is not warranted for the purpose of verifying localised, temporary drawdown impacts.
5.1.1 Monitoring threshold criteria
In order to identify adverse impacts, the monitoring strategy requires the development of criteria that detect significant changes against baseline or ongoing measurements. The following criteria will be used to identify significant changes in water quality and quantity:
Adverse chemical impacts: Compare concentrations of following analytes to previous monitoring rounds – if either (a) value exceeds highest previous measurement by >25% or (b) three subsequent monitoring events record an increase in one or more analytes concentration then a potential adverse impact has been identified; and
Adverse water level Impacts: Compare measured water level to previous monitoring rounds – if either (a) water level is lower than previous lowest measurement by >5m or (b) three subsequent monitoring events record a fall in water level >1m then a potential adverse impact has been identified.
These criteria are included in the Groundwater Monitoring Checklist included in Appendix C.
5.2 Monitoring strategy and timetable The monitoring strategy is designed to quantify changes occur as a result of water extraction during petroleum operations.
Underground Water Impact Report - ATP 602 5-1

Underground Water Impact Report - ATP 602 • Harcourt Petroleum N.L.
5.2.1 Extracted underground water
As in the past, Harcourt will maintain records of underground water extracted while exercising water rights. These quantities will be tabulated on a daily and monthly basis and graphed each year, and presented in a style similar to Figure 2-1. Results will be included in annual reports.
5.2.2 Field locations
The 2013 UWIR lists some potential bores for inclusion in a monitoring program. However, all of these bores are located at some distance (5 km or more) from the proposed production area and given the low proposed abstraction rates they are not considered relevant or useful for verifying predicted low level impacts in the immediate vicinity of the production area.
A reconnaissance will be conducted to locate bores within 2 km of the proposed production area. The reconnaissance will focus on locating bores within the Baralaba Coal Measures, as this aquifer is most likely to be affected by the proposed production wells. Any suitable bores identified during the reconnaissance will be included in the monitoring program.
5.2.3 Water level monitoring
Water level monitoring is designed to verify the model predictions and to provide early notification of any unexpected water level decline. Standing groundwater elevation will be recorded in Australian Height Datum (AHD). Groundwater levels will be determined using an electronic dip meter. The reference point below which the depth to water was measured will be recorded and photographed such that consistency with historical and future measurements can be maintained. Where applicable casing collar height above ground level will be measured and recorded. The threshold criteria discussed in Section 4 will be utilised to determine if groundwater level changes are significant.
Once production has commenced monitoring of bores within 2km shall comprise measurement of groundwater levels on a monthly basis for the first 12 months. On completion of one year of monthly monitoring to establish any seasonal or annual natural variations it may be possible to reduce groundwater level sampling to quarterly or biannual as appropriate and based on the results of monitoring.
5.2.4 Water quality monitoring
Water quality monitoring is designed to assess whether CSG operations are contributing to altered water quality within the affected aquifer. Accordingly, the suite of analytical parameters described in Table 5-1 focuses on parameters which may help distinguish aquifer water sources, and on hydrocarbon occurrence. All water quality analysis will be performed by a NATA accredited laboratory.
Once production has commenced monitoring of bores within 2km shall comprise collection of groundwater samples from the bores on a quarterly basis for the first 12 months. Samples will be scheduled for laboratory analysis for the suite included in Table 5-1. On completion of one year of quarterly monitoring to establish any seasonal or annual natural variations it may be possible to reduce groundwater quality sampling to bi-annual or annual as appropriate and based on the results of monitoring.
Underground Water Impact Report - ATP 602 5-2
Underground Water Impact Report - ATP 602 • Harcourt Petroleum N.L.
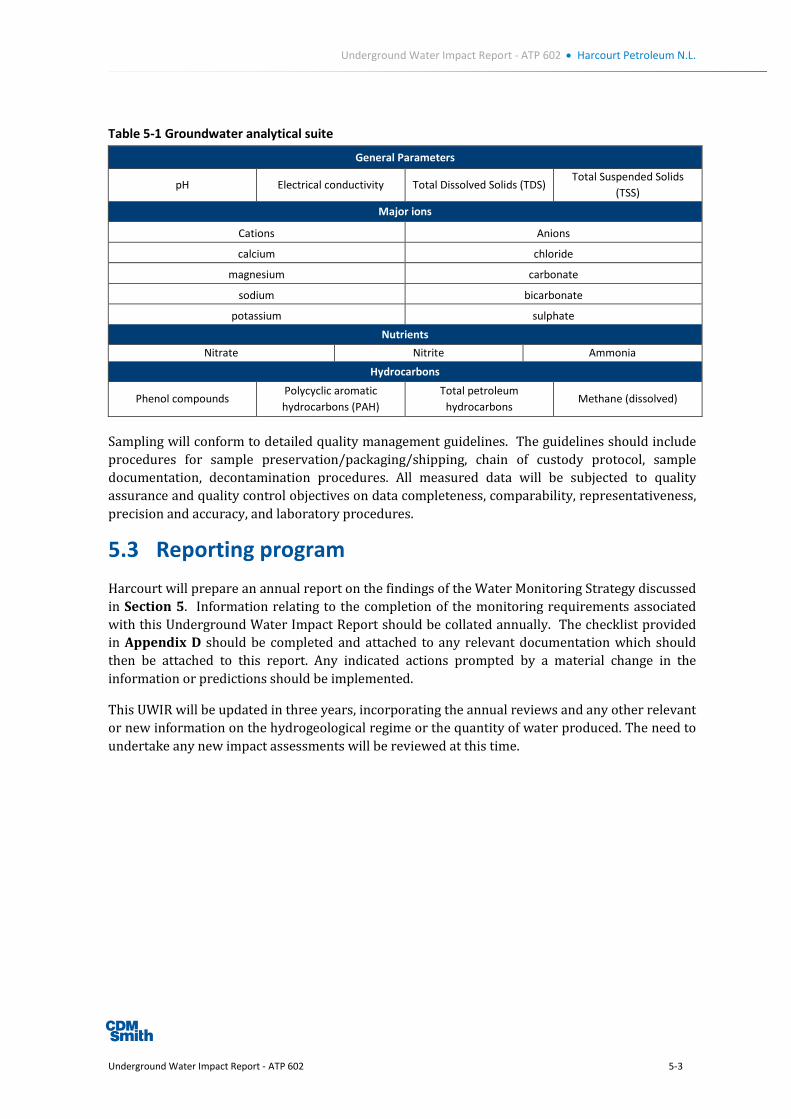
Table 5-1 Groundwater analytical suite
General Parameters
pH Electrical conductivity Total Dissolved Solids (TDS) Total Suspended Solids
(TSS) Major ions
Cations Anions
calcium chloride
magnesium carbonate
sodium bicarbonate
potassium sulphate Nutrients
Nitrate Nitrite Ammonia
Hydrocarbons
Phenol compounds Polycyclic aromatic hydrocarbons (PAH)
Total petroleum hydrocarbons
Methane (dissolved)
Sampling will conform to detailed quality management guidelines. The guidelines should include procedures for sample preservation/packaging/shipping, chain of custody protocol, sample documentation, decontamination procedures. All measured data will be subjected to quality assurance and quality control objectives on data completeness, comparability, representativeness, precision and accuracy, and laboratory procedures.
5.3 Reporting program Harcourt will prepare an annual report on the findings of the Water Monitoring Strategy discussed in Section 5. Information relating to the completion of the monitoring requirements associated with this Underground Water Impact Report should be collated annually. The checklist provided in Appendix D should be completed and attached to any relevant documentation which should then be attached to this report. Any indicated actions prompted by a material change in the information or predictions should be implemented.
This UWIR will be updated in three years, incorporating the annual reviews and any other relevant or new information on the hydrogeological regime or the quantity of water produced. The need to undertake any new impact assessments will be reviewed at this time.
Underground Water Impact Report - ATP 602 5-3

Section 6 Spring Impact Management (Part E) The Water Act requires UWIRs to identify springs which could be potentially affected by underground water extraction activities. For these springs where predicted water levels within the source aquifer would decline more than 0.2 metres, a spring impact management strategy is required.
6.1 Spring inventory A desktop review of spring inventories has been completed, searching for springs within 10 km of ATP 602boundaries. Springs and watercourses were identified using the following sources of information, and cross-checking against project maps.
Queensland Government Information Service (Queensland Wetland Data – Springs)
WetlandInfo Website
Great Artesian Basin Resource Operation Plan Spring Register
Based on these data no springs have been identified within the boundary of ATP 602. The closest spring is located approximately 7.5 km to the south the area (Figure 6-1) further springs are also present beyond this close to the Dawson River. Based on this finding, impact to springs as a result of this UWIR has not been further considered in this report.
Underground Water Impact Report - ATP 602 6-1

Underground Water Impact Report - ATP 602 • Harcourt Petroleum N.L.
Figure 6-1 Watercourses and registered springs proximal to ATP 602
Underground Water Impact Report - ATP 602 6-2

Section 7 Conclusion This Underground Water Impact Report was prepared for Harcourt ATP 602 in Queensland. The report conforms to reporting requirements laid out in the Water Act of 2000.
Review of published reports, registered bore extraction and water level data, and projected CSG operations at ATP 602 led to the identification of one aquifer which is likely to be affected by the exercise of underground water rights. Modelling has predicted that the shallow alluvium and basalt aquifers are not likely to be affected by underground water extraction. No Immediately Affected or Long Term Affected Areas were identified for the Baralaba Coal Measures.
A program was designed to quantify changes in water quality or levels as a result of water extraction during the projected petroleum operations. Although not required by law, the strategy covers regional monitoring in both the Baralaba Coal Measures and precautionary monitoring in the alluvial aquifer.
Data gathering will allow annual review of the accuracy of the maps when information changes substantially. The collected data will be reported, and an update of this UWIR will be generated in three years.
Underground Water Impact Report - ATP 602 7-1

Section 8 References AGE, 2006. Ensham Central Project EIA - Groundwater Impact Assessment. Prepared for Hansen
Consulting. http://www.ensham.com.au/updated/eis/pdf/Volume-2_Appendices/APPENDIX%20C%20-%20GROUNDWATER.pdf
Ausenco-Norwest, 2012, Groundwater Model, Northern Bowen Basin Regional Model Impact Predictions, Queensland, Australia. Prepared for Arrow Energy Pty Ltd. http://www.arrowenergy.com.au/__data/assets/pdf_file/0018/3870/Appendix-M_Groundwater-Model-Technical-Report.pdf
Bureau of Meteorology (BoM), 2013, Climate statistics for Moura, QLD. http://www.bom.gov.au/climate/averages/tables/cw_033013.shtml, viewed 11 April 2013.
BHP Billiton Mitsubishi Alliance, 2009. Daunia Coal Mine Project - Environmental Impact Statement. Appendix H Technical Report: Groundwater Modelling Assessment of Impact of Daunia Coal Mine on Regional Groundwater Aquifers. http://www.bhpbilliton.com/home/aboutus/regulatory/Documents/dauniaMineEisAppendixH.pdf
Cadman, SJ, L Pain, and V Vuckovic, 1998, Bowen and Surat Basins, Clarence-Moreton basin, Sydney Basin, Gunnedah Basin and other minor onshore basins, Qld, NSW and NT, Australian Petroleum Accumulations Report 11, Department of Primary Industries and Energy, Bureau of Resource Sciences.
Chong, 1971 Coal resources Baralaba –Moura, Kianga-Theodore Coalfield, Banana Creek Area, GSQ 1971/18,
Dear, J.F, McKellar, R.G. & Tucker, R.M., 1971 Geology of the Monto 1:250 000 sheet. Rep. neol. Surv. Qd, 46.
Gray, ARG, 1968, Stratigraphic drilling in the Surat and Bowen Basins, 1965-1966, Queensland Department of Mines, Report No. 22.
JBT, 2012. Foxleigh Plains Project - Environmental Impact Statement Groundwater Report. Prepared for Hansen Bailey. http://www.hansenbailey.com.au/assets/pdfs/foxleigh_eis/Appendix%20F%20-%20Groundwater.pdf
Olgers,F, Webb,A.W, Smith,J.A.J.and Coxhead,B.A 1966. 1:250,000 Geological Series Explanatory Notes Baralaba, Sheet SG/55-4, Bureau of Mineral Resources, Geology and Geophysics, Aust rep. 102, 1-59
Parsons Brinckerhoff, 2011. Middlemount Coal Project Stage 2 Environmental Impact Statement - Chapter 10 Groundwater. Prepared for Middlemount Coal. http://www.pb.com.au/middlemountcoal/09%20EIS%20for%20Public%20Consultation/Volume%202%20Main%20Text/10_Groundwater_110107.pdf
Queensland Springs Database Version 5 (Fensham and Fairfax, 2008). downloaded from the Queensland QGIS website http://dds.information.qld.gov.au/DDS/SearchResult.aspx
Underground Water Impact Report - ATP 602 8-1

Underground Water Impact Report - ATP 602 • Harcourt Petroleum N.L.
Simeone, S.F. and Corbett, B.J. (2003)Harcourt 1 well completion report, Oil Company of Australia, PL94_ Queensland, unpublished report.
Silwa, R, S Hamilton, J Hodgkinson, and J Draper (2008). Bowen Basin Structural Geology, poster produced by CSIRO and the Queensland Government Department of Mines and Energy.
URS, 2009. Caval Ridge Groundwater Impact Assessment. Prepared for BM Alliance Coal Operations Pty Ltd. http://www.bhpbilliton.com/home/aboutus/regulatory/Documents/creisAppJGroundwater.pdf
URS, 2012. Report Groundwater Impact Assessment, Bowen Gas Project. Prepared for Arrow Energy Pty Ltd. http://www.arrowenergy.com.au/__data/assets/pdf_file/0008/3869/Appendix-L_Groundwater-and-Geology-Technical-Report.pdf
Underground Water Impact Report - ATP 602 8-2

Appendix A - Summary of registered bores installed in alluvium
Bore ID (RN) Latitude Longitude Hydraulic unit Water quality
(µS/cm) Yield (L/s)
Water level
(mbgl) 68124 -24.4287 150.4846 BACK CREEK ALLUVIUM 1.9 7.45 62897 -24.37 150.4969 BACK CREEK ALLUVIUM 2740 25.2 6.7 67341 -24.3267 150.4638 BASALT 1.14 30.5
128449 -25.088 149.7387 BASALT 5000 0.63 29.6 128300 -24.9522 149.8513 BASALT POTABLE 1.23 28.5 128582 -24.6476 150.4719 BASALT POTABLE 5.6 25 128448 -24.9568 149.8831 BASALT 2400 0.2 23.8 128456 -24.4278 150.4797 BASALT POTABLE 0.2 22.5 128639 -24.8149 150.4894 BASALT POTABLE 22.5 128620 -24.4232 150.4316 BASALT 2.8 PPM 1.2 20 128626 -24.6439 149.7797 BASALT POTABLE 1.81 19.5 128619 -24.3722 150.5016 BASALT 0.1 18 128614 -24.2801 150.4241 BASALT POTABLE 1.2 16.4 128638 -24.3857 150.3177 BASALT POTABLE 0.4 15.3 128453 -24.3783 150.5135 BASALT SALTY 0.21 11.9 128625 -25.2355 149.6579 BASALT POTABLE 1.8 11.8 128301 -25.0142 150.1633 BASALT POTABLE 2.15 11.5 128615 -24.4145 150.5008 BASALT POTABLE 0.8 10.5 128586 -24.2961 150.4391 BASALT POTABLE 5.61 10 128648 -24.6242 150.2351 BASALT POTABLE 1.23 10 128616 -24.4056 150.5176 BASALT POTABLE 0.2 9.2 128634 -24.6236 150.2825 BASALT POTABLE 0.18 8.5 128635 -24.367 150.1777 BASALT POTABLE 1.5 8.5 128627 -24.4317 150.4231 BASALT POTABLE 0.6 8 128618 -24.7729 150.471 BASALT 0.5 7.77 128628 -24.4265 150.51 BASALT POTABLE 2.15 5.5 128457 -24.3946 150.4931 BASALT POTABLE 0.5 5.4 89807 -24.3789 150.4905 BASALT CONDT. 2200 1.34 4.5
13030685 -24.8531 150.2664 BOAM CREEK ALLUVIUM 7.79 89516 -24.349 150.459 BOAM CREEK ALLUVIUM COND 2030 40 5.61 89527 -24.3767 150.4924 BOAM CREEK ALLUVIUM COND 2650 38.5 4.52 89528 -24.3651 150.4782 BOAM CREEK ALLUVIUM COND 2750 39 4.34 89529 -24.3655 150.5131 BOAM CREEK ALLUVIUM COND 3050 39 2.42 68688 -24.38 150.4594 CALLIDE CREEK ALLUVIUM 15 18.5 68881 -24.3841 150.4975 CALLIDE CREEK ALLUVIUM 0.63 17.5 68318 -24.4245 150.43 CALLIDE CREEK ALLUVIUM 0.5 17.3 31064 -24.9414 150.091 CALLIDE CREEK ALLUVIUM 1.5 17 68564 -24.4074 150.438 CALLIDE CREEK ALLUVIUM 0.5 17 89746 -24.4034 150.4615 CALLIDE CREEK ALLUVIUM 8.06 16.9 89795 -24.4898 150.1578 CALLIDE CREEK ALLUVIUM 1 16.9 68763 -24.3712 150.5009 CALLIDE CREEK ALLUVIUM 1 16.8
13030671 -25.2739 150.2875 CALLIDE CREEK ALLUVIUM BRACKISH 16.72 128032 -24.3647 150.4718 CALLIDE CREEK ALLUVIUM POTABLE 25 16.7
13030604 -24.4247 150.5168 CALLIDE CREEK ALLUVIUM COND 1000 16.64 68874 -24.4078 150.4396 CALLIDE CREEK ALLUVIUM 0.5 16.6 68768 -24.5631 150.475 CALLIDE CREEK ALLUVIUM 0.38 16.36
Underground Water Impact Report - ATP 602 1
Underground Water Impact Report - ATP 602 • Harcourt Petroleum N.L.
Bore ID (RN) Latitude Longitude Hydraulic unit Water quality
(µS/cm) Yield (L/s)
Water level
(mbgl) 68459 -24.4106 150.4664 CALLIDE CREEK ALLUVIUM 16.4 16.3
128395 -24.5462 149.6655 CALLIDE CREEK ALLUVIUM POTABLE 1.6 16.3 68608 -24.296 150.4936 CALLIDE CREEK ALLUVIUM 0.63 16.1 68793 -24.4137 150.4672 CALLIDE CREEK ALLUVIUM 1 16 68711 -24.4267 150.473 CALLIDE CREEK ALLUVIUM 15 15.95
13030558 -24.3766 150.5003 CALLIDE CREEK ALLUVIUM COND 3640 15.9 68740 -24.3786 150.5019 CALLIDE CREEK ALLUVIUM COND 834 15.9
13030561 -25.1825 150.4197 CALLIDE CREEK ALLUVIUM 15.8 89841 -25.149 149.8025 CALLIDE CREEK ALLUVIUM 1 15.65
13030553 -24.4062 150.5164 CALLIDE CREEK ALLUVIUM `COND 1478 15.6 13030606 -24.3863 150.488 CALLIDE CREEK ALLUVIUM COND 1100 15.53
68460 -24.4217 150.5027 CALLIDE CREEK ALLUVIUM 26 15.5 68685 -24.4349 150.5189 CALLIDE CREEK ALLUVIUM 13.86 15.5
13030552 -24.4958 150.0912 CALLIDE CREEK ALLUVIUM COND 610 15.3 836 -24.5861 149.9604 CALLIDE CREEK ALLUVIUM TDS 472 MG/L 0 15.24
68109 -24.392 150.4411 CALLIDE CREEK ALLUVIUM 17.7 15 89881 -24.3419 150.473 CALLIDE CREEK ALLUVIUM 0.8 14.9 62910 -24.3729 150.4976 CALLIDE CREEK ALLUVIUM 16.3 14.8 89874 -24.3804 150.5008 CALLIDE CREEK ALLUVIUM 1.1 14.7 34488 -24.4376 150.4932 CALLIDE CREEK ALLUVIUM TDS 330 MG/L 0.8 14.6 68613 -24.6214 150.4613 CALLIDE CREEK ALLUVIUM 0.5 14.5 89902 -24.38 150.4949 CALLIDE CREEK ALLUVIUM 1 14.5
128653 -24.4123 150.2427 CALLIDE CREEK ALLUVIUM POTABLE 1 14.5 13030715 -24.9297 150.1783 CALLIDE CREEK ALLUVIUM 14.38 13030559 -24.3779 150.5005 CALLIDE CREEK ALLUVIUM COND 1220 14.3
453 -24.4733 149.8008 CALLIDE CREEK ALLUVIUM COND 585 0.8 14.3 13030557 -24.3763 150.5003 CALLIDE CREEK ALLUVIUM COND 1120 14.2
62884 -24.4251 150.5091 CALLIDE CREEK ALLUVIUM COND 450 10.1 14.2 13030555 -24.3742 150.4993 CALLIDE CREEK ALLUVIUM COND 3230 14.1
57616 -24.405 150.4908 CALLIDE CREEK ALLUVIUM 11 14 13030605 -24.2997 150.4206 CALLIDE CREEK ALLUVIUM COND 3650 13.94
68785 -24.5615 150.4947 CALLIDE CREEK ALLUVIUM 1 13.87 13030551 -24.4778 150.286 CALLIDE CREEK ALLUVIUM COND 750 13.8
68317 -24.5 150.4264 CALLIDE CREEK ALLUVIUM COND 767 25.2 13.8 89698 -24.4226 150.5136 CALLIDE CREEK ALLUVIUM 15.12 13.8
128038 -24.3772 150.4871 CALLIDE CREEK ALLUVIUM POTABLE 8 13.8 128391 -25.0759 150.1438 CALLIDE CREEK ALLUVIUM POTABLE 1.6 13.75 128394 -24.5456 149.6597 CALLIDE CREEK ALLUVIUM POTABLE 1.6 13.75
13030556 -24.3756 150.4988 CALLIDE CREEK ALLUVIUM COND 3870 13.7 128392 -25.0676 150.1252 CALLIDE CREEK ALLUVIUM POTABLE 1.6 13.6 128393 -24.9272 149.8361 CALLIDE CREEK ALLUVIUM POTABLE 1.6 13.6 34285 -24.3763 150.4242 CALLIDE CREEK ALLUVIUM COND 700 8.5 13.5
128390 -25.0823 150.1264 CALLIDE CREEK ALLUVIUM POTABLE 1.6 13.5 128396 -24.5462 149.6608 CALLIDE CREEK ALLUVIUM POTABLE 1 13.5 68439 -24.4063 150.4867 CALLIDE CREEK ALLUVIUM 36.6 13.25
13030594 -24.4082 150.499 CALLIDE CREEK ALLUVIUM COND 1680 13.1 13030579 -24.7558 150.5039 CALLIDE CREEK ALLUVIUM COND 1117 13.08
62934 -24.5024 150.4247 CALLIDE CREEK ALLUVIUM 0.6 13 13030554 -24.3742 150.4987 CALLIDE CREEK ALLUVIUM COND 2600 12.7
62415 -24.4525 150.5167 CALLIDE CREEK ALLUVIUM 31.5 12.7 89754 -24.8775 150.2094 CALLIDE CREEK ALLUVIUM 28.7 12.7 7841 -24.929 150.0666 CALLIDE CREEK ALLUVIUM TDS 469 MG/L 0 12.65
Underground Water Impact Report - ATP 602 2

Underground Water Impact Report - ATP 602 • Harcourt Petroleum N.L.
Bore ID (RN) Latitude Longitude Hydraulic unit Water quality
(µS/cm) Yield (L/s)
Water level
(mbgl) 68441 -24.3622 150.4668 CALLIDE CREEK ALLUVIUM 0.5 12.6 68167 -24.5569 150.4289 CALLIDE CREEK ALLUVIUM 0.5 12.5 68026 -24.4154 150.4864 CALLIDE CREEK ALLUVIUM 0.5 12.4 62940 -24.2934 150.4188 CALLIDE CREEK ALLUVIUM COND 680 18.9 12.4 34518 -24.9797 150.1417 CALLIDE CREEK ALLUVIUM COND 1710 7.6 12.4 89809 -24.3803 150.4984 CALLIDE CREEK ALLUVIUM 22.7 12.32 31374 -24.4731 150.1225 CALLIDE CREEK ALLUVIUM COND 1000 29 12.3 68276 -24.446 150.5072 CALLIDE CREEK ALLUVIUM COND 738 12.5 12.27 68693 -24.3118 150.4095 CALLIDE CREEK ALLUVIUM 1.4 12.27 32755 -24.3627 150.4662 CALLIDE CREEK ALLUVIUM 26 12.2 47105 -24.9779 150.1036 CALLIDE CREEK ALLUVIUM 0.8 12.2 57830 -24.3822 150.4727 CALLIDE CREEK ALLUVIUM 13.9 12.2
825 -24.7978 149.9562 CALLIDE CREEK ALLUVIUM TDS 390 MG/L 1.14 12.19 68544 -24.3828 150.5152 CALLIDE CREEK ALLUVIUM 18.9 12.15 31534 -24.3114 150.4466 CALLIDE CREEK ALLUVIUM 31.57 12.04
13030141 -24.5536 150.3758 CALLIDE CREEK ALLUVIUM COND 5000 12 34444 -24.442 150.4955 CALLIDE CREEK ALLUVIUM 0.01 11.9 57617 -24.5559 150.4277 CALLIDE CREEK ALLUVIUM COND 5100 1 11.9 68297 -24.5403 150.4278 CALLIDE CREEK ALLUVIUM 15 11.9
13030541 -24.5245 150.1091 CALLIDE CREEK ALLUVIUM COND 740 11.8 13030723 -24.8739 150.2936 CALLIDE CREEK ALLUVIUM 11.65
68935 -24.3036 150.423 CALLIDE CREEK ALLUVIUM 19.4 11.65 47130 -24.9873 150.1161 CALLIDE CREEK ALLUVIUM 7.6 11.6 68510 -24.6001 150.431 CALLIDE CREEK ALLUVIUM 0.5 11.6
13030534 -24.8446 150.1223 CALLIDE CREEK ALLUVIUM COND 2650 11.5 13030560 -24.3787 150.4952 CALLIDE CREEK ALLUVIUM COND 1710 11.4
62474 -24.339 150.4489 CALLIDE CREEK ALLUVIUM 1.4 11.3 415 -24.4813 149.834 CALLIDE CREEK ALLUVIUM 0.03 11.3
47356 -25.2566 149.9782 CALLIDE CREEK ALLUVIUM 0.58 11.3 57789 -24.3078 150.4414 CALLIDE CREEK ALLUVIUM 0.3 11.3 68230 -24.4211 150.5084 CALLIDE CREEK ALLUVIUM 26.5 11.3
13030581 -24.8836 150.4878 CALLIDE CREEK ALLUVIUM COND 1143 11.28 31533 -24.3235 150.4358 CALLIDE CREEK ALLUVIUM 25.26 11.28 34064 -24.3801 150.5118 CALLIDE CREEK ALLUVIUM COND 2430 1 11.2 89914 -24.3188 150.2751 CALLIDE CREEK ALLUVIUM COND 1082 0.88 11.16 31332 -24.2944 150.4327 CALLIDE CREEK ALLUVIUM GOOD 16.4 11 57919 -24.3211 150.4536 CALLIDE CREEK ALLUVIUM 21.4 10.8 31512 -24.3158 150.4201 CALLIDE CREEK ALLUVIUM COND 1762 27.1 10.7 38301 -24.4044 150.5114 CALLIDE CREEK ALLUVIUM COND 1250 12.5 10.7 68487 -24.3881 150.4353 CALLIDE CREEK ALLUVIUM 0.5 10.7 62911 -24.3802 150.4985 CALLIDE CREEK ALLUVIUM 21.9 10.6
13030717 -24.8681 150.305 CALLIDE CREEK ALLUVIUM 10.5 47469 -24.6267 150.4541 CALLIDE CREEK ALLUVIUM 1.3 10.5 68491 -24.3489 150.4371 CALLIDE CREEK ALLUVIUM 25 10.5
13030591 -24.2882 150.4435 CALLIDE CREEK ALLUVIUM COND 1476 10.4 31942 -24.3188 150.4519 CALLIDE CREEK ALLUVIUM COND 1050 26.9 10.4 31517 -24.3163 150.4194 CALLIDE CREEK ALLUVIUM 0.36 10.3 34286 -24.4294 150.4845 CALLIDE CREEK ALLUVIUM 8.84 10.2 68024 -24.4218 150.4917 CALLIDE CREEK ALLUVIUM COND 1350 10.2 31945 -24.3144 150.4493 CALLIDE CREEK ALLUVIUM 0.8 10.1 8230 -24.9159 150.0672 CALLIDE CREEK ALLUVIUM 0.63 10.06
33069 -24.3485 150.4726 CALLIDE CREEK ALLUVIUM COND 1025 15.2 10
Underground Water Impact Report - ATP 602 3

Underground Water Impact Report - ATP 602 • Harcourt Petroleum N.L.
Bore ID (RN) Latitude Longitude Hydraulic unit Water quality
(µS/cm) Yield (L/s)
Water level
(mbgl) 33375 -24.3917 150.491 CALLIDE CREEK ALLUVIUM COND 1200 24 9.98 33752 -24.3635 150.4847 CALLIDE CREEK ALLUVIUM 20.8 9.9 35817 -25.2498 149.7042 CALLIDE CREEK ALLUVIUM 9.9 37063 -24.3802 150.4836 CALLIDE CREEK ALLUVIUM POTABLE 28.5 9.9 33067 -24.3807 150.4614 CALLIDE CREEK ALLUVIUM COND 1060 12.5 9.8
13030580 -24.7558 150.5039 CALLIDE CREEK ALLUVIUM COND 2350 9.7 34009 -24.3652 150.5069 CALLIDE CREEK ALLUVIUM 4.42 9.7 62022 -24.3214 150.4495 CALLIDE CREEK ALLUVIUM 27.7 9.6
13030153 -25.1469 150.4103 CALLIDE CREEK ALLUVIUM COND 1950 9.6 13030154 -24.3765 150.4733 CALLIDE CREEK ALLUVIUM COND 1000 9.73 9.54
7684 -24.9433 150.0492 CALLIDE CREEK ALLUVIUM 9.5 9.5 47150 -25.004 150.1528 CALLIDE CREEK ALLUVIUM COND 843 1 9.5 57326 -24.6082 150.4771 CALLIDE CREEK ALLUVIUM 15 9.5 8420 -24.9101 150.0719 CALLIDE CREEK ALLUVIUM 1.5 9.45
47151 -25.0162 150.1525 CALLIDE CREEK ALLUVIUM 1 9.4 47695 -24.6083 150.4515 CALLIDE CREEK ALLUVIUM COND 980 1 9.3
13030151 -24.7879 150.2172 CALLIDE CREEK ALLUVIUM COND 1110 9.3 13030152 -24.5204 150.1755 CALLIDE CREEK ALLUVIUM 9.3 13030593 -24.5147 150.5028 CALLIDE CREEK ALLUVIUM COND 1620 9.2
31944 -24.3325 150.4492 CALLIDE CREEK ALLUVIUM COND 1480 17.7 9.2 31511 -24.3165 150.4192 CALLIDE CREEK ALLUVIUM POTABLE 22.3 9.2
13030592 -24.386 150.4348 CALLIDE CREEK ALLUVIUM COND 1090 9.1 34284 -24.417 150.4351 CALLIDE CREEK ALLUVIUM 5.05 9.1 33574 -24.3774 150.4829 CALLIDE CREEK ALLUVIUM 6.3 9 47149 -25.0048 150.1197 CALLIDE CREEK ALLUVIUM COND 1170 1 9 32324 -24.3129 150.4558 CALLIDE CREEK ALLUVIUM 47.99 8.94 47081 -24.9823 150.0889 CALLIDE CREEK ALLUVIUM COND 1420 1.3 8.9 8231 -24.9006 150.0727 CALLIDE CREEK ALLUVIUM 0.76 8.84
37313 -24.3049 150.4393 CALLIDE CREEK ALLUVIUM 8.5 33573 -24.3774 150.4826 CALLIDE CREEK ALLUVIUM 23.99 8.47 31531 -24.3037 150.4408 CALLIDE CREEK ALLUVIUM COND 1790 25.3 8.46 47648 -24.6089 150.4488 CALLIDE CREEK ALLUVIUM 0.8 8.4 32746 -24.3276 150.4689 CALLIDE CREEK ALLUVIUM COND 1640 2.1 8.3 31530 -24.3252 150.4324 CALLIDE CREEK ALLUVIUM COND 950 32.8 8.3 32770 -24.3292 150.4589 CALLIDE CREEK ALLUVIUM 42.3 8.2 33186 -24.3835 150.4538 CALLIDE CREEK ALLUVIUM COND 1580 19.7 8.2 33187 -24.3246 150.4748 CALLIDE CREEK ALLUVIUM 36 8.2 47616 -24.4167 150.4377 CALLIDE CREEK ALLUVIUM 25 8.2 33188 -24.345 150.4754 CALLIDE CREEK ALLUVIUM 0.5 8.1 44650 -24.3694 150.458 CALLIDE CREEK ALLUVIUM 32 8 47530 -24.523 150.434 CALLIDE CREEK ALLUVIUM COND 890 45.4 7.9 32325 -24.354 150.4396 CALLIDE CREEK ALLUVIUM 19.4 7.9 32745 -24.3552 150.4653 CALLIDE CREEK ALLUVIUM COND 1100 19.4 7.9 47458 -25.0031 150.5033 CALLIDE CREEK ALLUVIUM 7.9 31073 -24.938 150.0773 CALLIDE CREEK ALLUVIUM TDS 375 MG/L 45.46 7.86 32518 -24.321 150.4626 CALLIDE CREEK ALLUVIUM COND 3150 37.8 7.7 34067 -24.4107 150.4321 CALLIDE CREEK ALLUVIUM COND 1126 19.5 7.7 57579 -24.6437 150.4644 CALLIDE CREEK ALLUVIUM 7.7 31943 -24.3234 150.1047 CALLIDE CREEK ALLUVIUM COND 1500 37.8 7.6 57821 -24.3797 150.4785 CALLIDE CREEK ALLUVIUM 23.9 7.5 8368 -24.9076 150.0739 CALLIDE CREEK ALLUVIUM TDS 415 MG/L 2.3 7.5
31532 -24.3311 150.4242 CALLIDE CREEK ALLUVIUM COND 1820 24 7.5
Underground Water Impact Report - ATP 602 4

Underground Water Impact Report - ATP 602 • Harcourt Petroleum N.L.
Bore ID (RN) Latitude Longitude Hydraulic unit Water quality
(µS/cm) Yield (L/s)
Water level
(mbgl) 32767 -24.3244 150.4675 CALLIDE CREEK ALLUVIUM GOOD 1.21 7.32
13030132 -24.7253 150.4061 CALLIDE CREEK ALLUVIUM COND 1070 7.1 13030140 -24.5705 150.3951 CALLIDE CREEK ALLUVIUM COND 1820 6.8
57607 -24.644 150.4636 CALLIDE CREEK ALLUVIUM 0.8 6.8 57820 -24.3122 150.4471 CALLIDE CREEK ALLUVIUM 12.6 6.3 32754 -24.3387 150.4747 CALLIDE CREEK ALLUVIUM 15.1 5.7
13030138 -24.5254 150.4478 CALLIDE CREEK ALLUVIUM COND 2250 5.2 13030234 -24.809 150.2702 CALLIDE CREEK ALLUVIUM COND 2400 5.2
34489 -24.7567 150.1503 CALLIDE CREEK ALLUVIUM 20.6 5.2 13030233 -25.1194 150.2988 CALLIDE CREEK ALLUVIUM 4.7
111914 -24.4317 150.5132 CAMBOON VOLCANICS 680 US/CM 1.1 37 89968 -24.39 150.4516 CAMBOON VOLCANICS 980 CON 5.8 36 68678 -24.4109 150.5127 CAMBOON VOLCANICS 1.1 30
128263 -24.3681 149.9883 CAMBOON VOLCANICS 900PPM 2.27 27 31384 -24.3046 150.439 CAMBOON VOLCANICS 0.06 21.3
128178 -24.3992 150.4885 CAMBOON VOLCANICS 2300 M/S 0.25 21 128171 -24.4378 150.5157 CAMBOON VOLCANICS 5500 M/S 0.3 20.7 128175 -24.3929 150.4606 CAMBOON VOLCANICS 3400 M/S 0.26 20.7 128198 -24.5374 150.3609 CAMBOON VOLCANICS 1180 M/S 2.38 20.7 128200 -24.3333 150.4398 CAMBOON VOLCANICS 2.15 19.5 31442 -24.3093 150.4421 CAMBOON VOLCANICS 0.63 19.2
111910 -24.3093 150.4375 CAMBOON VOLCANICS 670 US/CM 1 18.6 31448 -24.3089 150.431 CAMBOON VOLCANICS 0.38 16.7
128182 -24.4727 150.4294 CAMBOON VOLCANICS 3430 M/S 0.63 16 128201 -24.41 150.4997 CAMBOON VOLCANICS 2.53 15.5 89805 -24.3793 150.4913 CAMBOON VOLCANICS 7.5 15.3 89799 -24.3128 150.4532 CAMBOON VOLCANICS 2900 US/CM 0.68 15.15 34522 -24.436 150.5193 CAMBOON VOLCANICS 0.04 14.6 68580 -24.3118 150.4543 CAMBOON VOLCANICS COND 5400 1.9 14
128144 -24.3187 150.4192 CAMBOON VOLCANICS 0.6 14 128173 -24.3676 150.4711 CAMBOON VOLCANICS 4900 M/S 2.66 13.7 33925 -24.4062 150.4296 CAMBOON VOLCANICS 0.19 12.8 89802 -24.3208 150.4377 CAMBOON VOLCANICS 2000 US/CM 1.37 12.72 47604 -24.2843 150.4386 CAMBOON VOLCANICS 3.5 12.2 31441 -24.3128 150.4243 CAMBOON VOLCANICS 0.25 12.2
128174 -24.4242 150.5109 CAMBOON VOLCANICS 3400 M/S 3.55 12 128183 -24.3029 150.4465 CAMBOON VOLCANICS 970 M/S 1.9 12 89901 -24.4398 150.4952 CAMBOON VOLCANICS COND 1000 0.56 11.8 31446 -24.3001 150.451 CAMBOON VOLCANICS 0.63 10.6 57732 -24.5559 150.4219 CAMBOON VOLCANICS 0.88 10.6
128216 -25.2801 149.7392 CAMBOON VOLCANICS 0.45 10.5 9265 -24.935 150.0772 CAMBOON VOLCANICS 0.63 10.27
31241 -24.28 150.417 CAMBOON VOLCANICS POTABLE 0.63 10.06 128179 -24.4157 150.5176 CAMBOON VOLCANICS 830 M/S 0.19 10 128181 -24.4154 150.5185 CAMBOON VOLCANICS 2400 M/S 4.68 10 84680 -24.4161 150.5019 CAMBOON VOLCANICS COND 2500 1 9.8 68951 -24.4281 150.5055 CAMBOON VOLCANICS 700 1.42 9.6
128199 -24.3753 150.4804 CAMBOON VOLCANICS 1.5 9.5 128215 -25.2476 149.7492 CAMBOON VOLCANICS 0.78 9.5 34211 -24.372 150.5134 CAMBOON VOLCANICS 0.19 9.3 38951 -24.3803 150.4579 CAMBOON VOLCANICS 0.6 9.2 47606 -24.4401 150.5125 CAMBOON VOLCANICS 1.29 9.1
Underground Water Impact Report - ATP 602 5
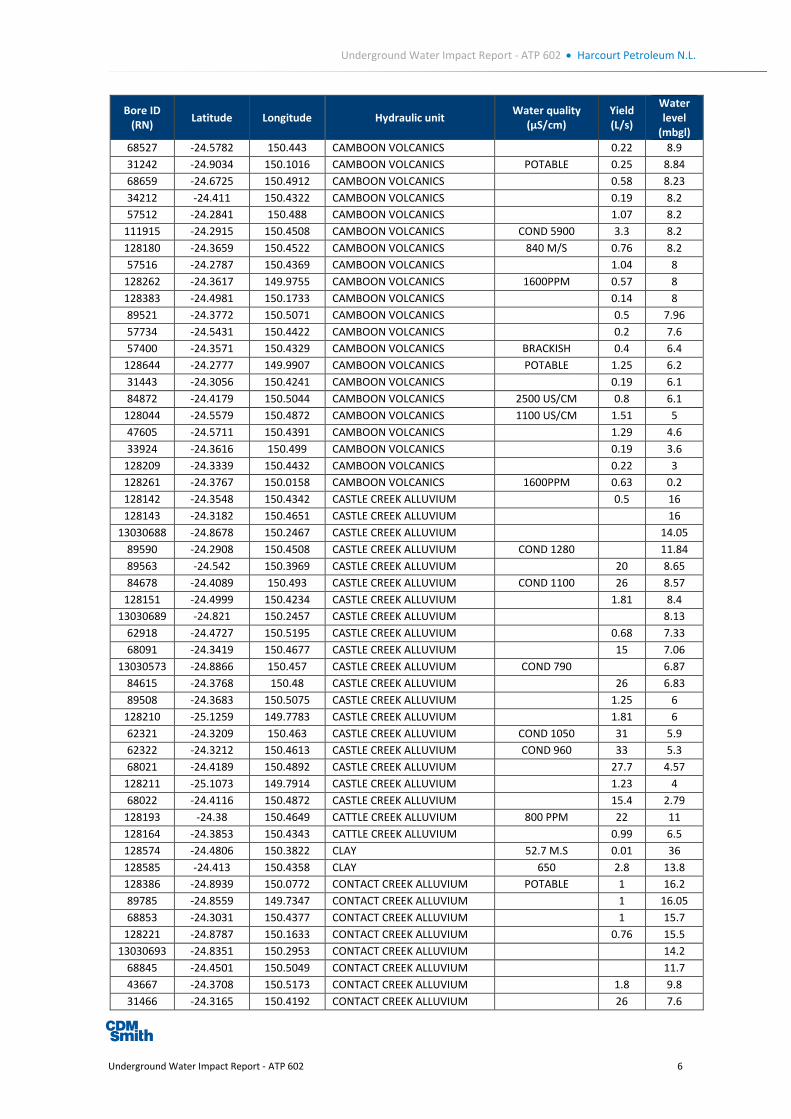
Underground Water Impact Report - ATP 602 • Harcourt Petroleum N.L.
Bore ID (RN) Latitude Longitude Hydraulic unit Water quality
(µS/cm) Yield (L/s)
Water level
(mbgl) 68527 -24.5782 150.443 CAMBOON VOLCANICS 0.22 8.9 31242 -24.9034 150.1016 CAMBOON VOLCANICS POTABLE 0.25 8.84 68659 -24.6725 150.4912 CAMBOON VOLCANICS 0.58 8.23 34212 -24.411 150.4322 CAMBOON VOLCANICS 0.19 8.2 57512 -24.2841 150.488 CAMBOON VOLCANICS 1.07 8.2
111915 -24.2915 150.4508 CAMBOON VOLCANICS COND 5900 3.3 8.2 128180 -24.3659 150.4522 CAMBOON VOLCANICS 840 M/S 0.76 8.2 57516 -24.2787 150.4369 CAMBOON VOLCANICS 1.04 8
128262 -24.3617 149.9755 CAMBOON VOLCANICS 1600PPM 0.57 8 128383 -24.4981 150.1733 CAMBOON VOLCANICS 0.14 8 89521 -24.3772 150.5071 CAMBOON VOLCANICS 0.5 7.96 57734 -24.5431 150.4422 CAMBOON VOLCANICS 0.2 7.6 57400 -24.3571 150.4329 CAMBOON VOLCANICS BRACKISH 0.4 6.4
128644 -24.2777 149.9907 CAMBOON VOLCANICS POTABLE 1.25 6.2 31443 -24.3056 150.4241 CAMBOON VOLCANICS 0.19 6.1 84872 -24.4179 150.5044 CAMBOON VOLCANICS 2500 US/CM 0.8 6.1
128044 -24.5579 150.4872 CAMBOON VOLCANICS 1100 US/CM 1.51 5 47605 -24.5711 150.4391 CAMBOON VOLCANICS 1.29 4.6 33924 -24.3616 150.499 CAMBOON VOLCANICS 0.19 3.6
128209 -24.3339 150.4432 CAMBOON VOLCANICS 0.22 3 128261 -24.3767 150.0158 CAMBOON VOLCANICS 1600PPM 0.63 0.2 128142 -24.3548 150.4342 CASTLE CREEK ALLUVIUM 0.5 16 128143 -24.3182 150.4651 CASTLE CREEK ALLUVIUM 16
13030688 -24.8678 150.2467 CASTLE CREEK ALLUVIUM 14.05 89590 -24.2908 150.4508 CASTLE CREEK ALLUVIUM COND 1280 11.84 89563 -24.542 150.3969 CASTLE CREEK ALLUVIUM 20 8.65 84678 -24.4089 150.493 CASTLE CREEK ALLUVIUM COND 1100 26 8.57
128151 -24.4999 150.4234 CASTLE CREEK ALLUVIUM 1.81 8.4 13030689 -24.821 150.2457 CASTLE CREEK ALLUVIUM 8.13
62918 -24.4727 150.5195 CASTLE CREEK ALLUVIUM 0.68 7.33 68091 -24.3419 150.4677 CASTLE CREEK ALLUVIUM 15 7.06
13030573 -24.8866 150.457 CASTLE CREEK ALLUVIUM COND 790 6.87 84615 -24.3768 150.48 CASTLE CREEK ALLUVIUM 26 6.83 89508 -24.3683 150.5075 CASTLE CREEK ALLUVIUM 1.25 6
128210 -25.1259 149.7783 CASTLE CREEK ALLUVIUM 1.81 6 62321 -24.3209 150.463 CASTLE CREEK ALLUVIUM COND 1050 31 5.9 62322 -24.3212 150.4613 CASTLE CREEK ALLUVIUM COND 960 33 5.3 68021 -24.4189 150.4892 CASTLE CREEK ALLUVIUM 27.7 4.57
128211 -25.1073 149.7914 CASTLE CREEK ALLUVIUM 1.23 4 68022 -24.4116 150.4872 CASTLE CREEK ALLUVIUM 15.4 2.79
128193 -24.38 150.4649 CATTLE CREEK ALLUVIUM 800 PPM 22 11 128164 -24.3853 150.4343 CATTLE CREEK ALLUVIUM 0.99 6.5 128574 -24.4806 150.3822 CLAY 52.7 M.S 0.01 36 128585 -24.413 150.4358 CLAY 650 2.8 13.8 128386 -24.8939 150.0772 CONTACT CREEK ALLUVIUM POTABLE 1 16.2 89785 -24.8559 149.7347 CONTACT CREEK ALLUVIUM 1 16.05 68853 -24.3031 150.4377 CONTACT CREEK ALLUVIUM 1 15.7
128221 -24.8787 150.1633 CONTACT CREEK ALLUVIUM 0.76 15.5 13030693 -24.8351 150.2953 CONTACT CREEK ALLUVIUM 14.2
68845 -24.4501 150.5049 CONTACT CREEK ALLUVIUM 11.7 43667 -24.3708 150.5173 CONTACT CREEK ALLUVIUM 1.8 9.8 31466 -24.3165 150.4192 CONTACT CREEK ALLUVIUM 26 7.6
Underground Water Impact Report - ATP 602 6

Underground Water Impact Report - ATP 602 • Harcourt Petroleum N.L.
Bore ID (RN) Latitude Longitude Hydraulic unit Water quality
(µS/cm) Yield (L/s)
Water level
(mbgl) 31395 -24.3197 150.4161 CONTACT CREEK ALLUVIUM 11.37 4
13030385 -24.5173 150.3533 DAWSON RIVER ALLUVIUM COND 1090 3.9 17.1 13030435 -24.4246 150.4197 DAWSON RIVER ALLUVIUM TDS 291.7 MG/L 1.52 14.33 13030392 -24.4493 150.5194 DAWSON RIVER ALLUVIUM 13.9
89578 -24.3727 150.4976 DAWSON RIVER ALLUVIUM 12.6 13.5 13030436 -24.3086 150.4164 DAWSON RIVER ALLUVIUM TDS 229 MG/L 1.5 13.3 13030434 -24.4704 150.3894 DAWSON RIVER ALLUVIUM COND 680 13.1 13030432 -24.4197 150.4242 DAWSON RIVER ALLUVIUM COND 245 12.9
89686 -24.3364 150.4491 DAWSON RIVER ALLUVIUM POTABLE 18.9 12.8 13030437 -24.4353 150.4088 DAWSON RIVER ALLUVIUM TDS 343.2 MG/L 1.5 12.8 13030391 -24.6575 150.4494 DAWSON RIVER ALLUVIUM COND 1100 12.7 13030428 -24.8603 150.1841 DAWSON RIVER ALLUVIUM COND 1700 4.4 12.5
89690 -24.355 150.4964 DAWSON RIVER ALLUVIUM POTABLE 2.4 12.5 128188 -24.6474 150.4669 DAWSON RIVER ALLUVIUM 350 PPM 2 12.5 89755 -24.4088 150.4988 DAWSON RIVER ALLUVIUM POTABLE 0.45 12.3 89593 -25.1259 149.8375 DAWSON RIVER ALLUVIUM 11.3 11.97
13030420 -24.445 150.5075 DAWSON RIVER ALLUVIUM COND 950 11.8 89575 -24.4629 150.3794 DAWSON RIVER ALLUVIUM 25 11.6
13030641 -24.6594 150.3122 DAWSON RIVER ALLUVIUM COND 528 11.54 13030429 -24.7866 150.2677 DAWSON RIVER ALLUVIUM COND 380 11.5 13030637 -24.4731 150.1208 DAWSON RIVER ALLUVIUM COND 595 11.46 13030683 -25.126 150.1114 DAWSON RIVER ALLUVIUM 11.34 13030387 -24.5398 150.3508 DAWSON RIVER ALLUVIUM 1.9 11.3 13030422 -24.7272 150.2278 DAWSON RIVER ALLUVIUM COND 22,300 11.2 13030427 -24.9243 150.0778 DAWSON RIVER ALLUVIUM COND 4200 11.1 13030423 -24.6919 150.1936 DAWSON RIVER ALLUVIUM COND 23,750 11.1
89598 -24.4447 150.5155 DAWSON RIVER ALLUVIUM GOOD 10.5 11.07 13030684 -24.9453 150.2939 DAWSON RIVER ALLUVIUM 11.04 13030418 -24.54 150.0247 DAWSON RIVER ALLUVIUM COND 920 4.9 10.9 13030403 -24.6852 150.235 DAWSON RIVER ALLUVIUM COND 5850 10.9 13030430 -24.7799 149.759 DAWSON RIVER ALLUVIUM COND 460 1.9 10.9 13030426 -25.2671 150.1334 DAWSON RIVER ALLUVIUM COND 5350 10.8 13030390 -24.5717 150.3953 DAWSON RIVER ALLUVIUM COND 2340 10.8
89581 -24.4547 150.5192 DAWSON RIVER ALLUVIUM 13.5 10.75 89597 -25.117 149.8461 DAWSON RIVER ALLUVIUM 16.4 10.74
13030415 -24.4265 150.5094 DAWSON RIVER ALLUVIUM COND 298 10.7 13030402 -24.7066 150.4426 DAWSON RIVER ALLUVIUM COND 4900 10.7 13030421 -24.7536 150.2581 DAWSON RIVER ALLUVIUM 35.3 10.7 13030586 -25.0831 150.4553 DAWSON RIVER ALLUVIUM COND 660 10.53 13030400 -24.6861 150.3628 DAWSON RIVER ALLUVIUM COND 6700 10.5
38975 -24.3125 150.4994 DAWSON RIVER ALLUVIUM COND 1760 30.7 10.47 13030425 -24.4736 150.1225 DAWSON RIVER ALLUVIUM COND 9600 10.4 13030639 -24.4737 150.0188 DAWSON RIVER ALLUVIUM COND 777 10.36 13030410 -24.8204 150.3576 DAWSON RIVER ALLUVIUM COND 595 10.3 13030424 -24.4715 150.1225 DAWSON RIVER ALLUVIUM COND 30,000 10.3 13030401 -24.726 150.4102 DAWSON RIVER ALLUVIUM COND 2500 10.3 13030411 -24.7939 150.2628 DAWSON RIVER ALLUVIUM 10.3 13030394 -24.2761 149.8342 DAWSON RIVER ALLUVIUM COND 2400 10.2 13030419 -25.0472 149.6689 DAWSON RIVER ALLUVIUM COND 1300 9.5 10.2 13030638 -24.4839 149.9703 DAWSON RIVER ALLUVIUM COND 2500 10.19 13030640 -24.4958 150.0912 DAWSON RIVER ALLUVIUM COND 1580 10.13
89577 -24.386 150.4351 DAWSON RIVER ALLUVIUM 10 10.1
Underground Water Impact Report - ATP 602 7

Underground Water Impact Report - ATP 602 • Harcourt Petroleum N.L.
Bore ID (RN) Latitude Longitude Hydraulic unit Water quality
(µS/cm) Yield (L/s)
Water level
(mbgl) 13030417 -24.4734 150.125 DAWSON RIVER ALLUVIUM COND 755 5.68 10.03 13030404 -24.6776 150.2296 DAWSON RIVER ALLUVIUM COND 5100 10 13030396 -24.4713 150.1213 DAWSON RIVER ALLUVIUM COND 1880 10 13030406 -24.3031 150.4228 DAWSON RIVER ALLUVIUM COND 1210 2.8 9.9 13030405 -24.7677 150.2966 DAWSON RIVER ALLUVIUM COND 1975 27.8 9.9 13030395 -24.6216 150.4628 DAWSON RIVER ALLUVIUM COND 1400 9.9 13030433 -24.4701 150.3891 DAWSON RIVER ALLUVIUM COND 28400 9.9 13030397 -24.9048 150.0892 DAWSON RIVER ALLUVIUM COND 10,000 9.8
89546 -24.6994 150.4862 DAWSON RIVER ALLUVIUM COND 3200 20 9.72 13030412 -24.7451 150.2941 DAWSON RIVER ALLUVIUM 9.7 13030393 -24.43 150.5112 DAWSON RIVER ALLUVIUM COND 2130 9.7
89547 -24.4276 150.5102 DAWSON RIVER ALLUVIUM COND 1300 38 9.55 13030399 -24.7096 150.4653 DAWSON RIVER ALLUVIUM COND 11500 3.79 9.5 13030407 -24.3863 150.4412 DAWSON RIVER ALLUVIUM COND 1070 9.5 13030738 -24.95 149.849 DAWSON RIVER ALLUVIUM 9.5 13030409 -24.8274 150.3459 DAWSON RIVER ALLUVIUM 1.52 9.5 13030398 -24.9095 150.0826 DAWSON RIVER ALLUVIUM COND 10,000 9.4 13030416 -24.4096 150.495 DAWSON RIVER ALLUVIUM COND 341 2.5 9.2 13030408 -24.7418 150.2983 DAWSON RIVER ALLUVIUM COND 815 5.8 9.2 13030576 -24.9983 150.3619 DAWSON RIVER ALLUVIUM COND 540 9.13 13030590 -24.2894 150.4456 DAWSON RIVER ALLUVIUM 9.07 13030735 -24.8286 150.3206 DAWSON RIVER ALLUVIUM 9.07 13030414 -24.7545 150.4921 DAWSON RIVER ALLUVIUM 8.8 13030413 -24.7824 150.5092 DAWSON RIVER ALLUVIUM COND 5090 8.7 13030389 -24.5503 150.377 DAWSON RIVER ALLUVIUM COND 4150 8.7 13030584 -25.0819 150.4572 DAWSON RIVER ALLUVIUM COND 7200 8.26
128298 -24.9242 149.8896 DAWSON RIVER ALLUVIUM POTABLE 8 13030582 -25.0856 150.1794 DAWSON RIVER ALLUVIUM BRACKISH 7.8 13030575 -25.0043 150.4561 DAWSON RIVER ALLUVIUM COND 4000 7.1 13030583 -25.1007 150.187 DAWSON RIVER ALLUVIUM COND 3600 7.08
89509 -24.3832 150.4862 DAWSON RIVER ALLUVIUM 1.26 6 13030574 -25.0327 150.44 DAWSON RIVER ALLUVIUM COND 2520 5.92
47549 -24.6233 150.4406 DAWSON RIVER ALLUVIUM 0.6 3 128163 -24.3993 150.4947 GLANDORE GRANODIORITE 0.78 20 89987 -24.3737 150.5114 GLANDORE GRANODIORITE 0.01 18.3 89987 -24.3737 150.5114 GLANDORE GRANODIORITE COND 12600 0.01 18.3
128196 -24.3988 150.4943 GLANDORE GRANODIORITE 2600 M/S 0.69 18.3 89961 -24.3615 150.4964 GLANDORE GRANODIORITE 3000 US/CM 0.43 17.12
128153 -24.3843 150.501 GLANDORE GRANODIORITE 1900 M/S 1.64 15 111911 -24.4459 150.5057 GLANDORE GRANODIORITE COND 1200 1.13 12 128197 -24.4092 150.4925 GLANDORE GRANODIORITE 2580 M/S 11.6 128148 -24.3089 150.4488 GLANDORE GRANODIORITE 1600 US/CM 1.26 10 128153 -24.3843 150.501 GLANDORE GRANODIORITE 1780 M/S 0.76 9 128153 -24.3843 150.501 GLANDORE GRANODIORITE 1720 M/S 2.78 8 128153 -24.3843 150.501 GLANDORE GRANODIORITE 1920 M/S 0.52 4.9 57511 -24.2912 150.4513 GLENHALVERN GRANITE 1.26 7.6
128446 -24.5525 149.9044 GRANITE POTABLE 0.63 75 128467 -24.4061 150.4865 GRANITE POTABLE 0.5 63.3 128444 -25.1686 150.106 GRANITE POTABLE 2.52 28 128623 -24.3536 150.4823 GRANITE POTABLE 0.13 18.8 128631 -24.4237 150.5149 GRANITE POTABLE 0.2 17 128640 -24.8248 150.5194 GRANITE POTABLE 0.3 15.3
Underground Water Impact Report - ATP 602 8

Underground Water Impact Report - ATP 602 • Harcourt Petroleum N.L.
Bore ID (RN) Latitude Longitude Hydraulic unit Water quality
(µS/cm) Yield (L/s)
Water level
(mbgl) 128432 -25.2255 149.9426 GRANITE GOOD 0.2 14 128629 -24.3608 150.4901 GRANITE POTABLE 0.2 12.8 128466 -24.3995 150.4958 GRANITE POTABLE 0.13 11.5 128630 -24.7739 150.465 GRANITE POTABLE 0.07 8.5 111909 -24.3724 150.5132 GRANITE 1300 US/CM 10 8.2 128632 -24.3907 150.4835 GRANITE POTABLE 0.3 8.2 128413 -25.1015 149.8415 GRANITE BRACKISH 0.44 7 128633 -24.426 150.2273 GRANITE POTABLE 1.24 5.4 68557 -24.3669 150.4774 GREVILLEA CREEK ALLUVIUM COND 1920 3.8 16.4 68553 -24.2813 150.4466 GREVILLEA CREEK ALLUVIUM 0.5 15.9 68362 -24.5509 150.4222 GREVILLEA CREEK ALLUVIUM 1.7 15.3 89705 -24.5464 149.6633 GREVILLEA CREEK ALLUVIUM 0.9 15.3 62403 -24.3192 150.4658 GREVILLEA CREEK ALLUVIUM 1.9 14.4 68130 -24.2944 150.4005 GREVILLEA CREEK ALLUVIUM 1.5 14.3
13030544 -24.4672 150.1259 GREVILLEA CREEK ALLUVIUM COND 1050 14.2 128206 -24.4093 150.5 GREVILLEA CREEK ALLUVIUM 1 13.8 33681 -24.3813 150.4972 GREVILLEA CREEK ALLUVIUM 1.5 13.6 37244 -24.3124 150.4415 GREVILLEA CREEK ALLUVIUM COND 2470 1.6 13.4 36463 -24.3603 150.4836 GREVILLEA CREEK ALLUVIUM 1.1 12.7 57595 -24.6542 150.4864 GREVILLEA CREEK ALLUVIUM COND 3400 16 12.7 32926 -24.3811 150.4607 GREVILLEA CREEK ALLUVIUM 44.2 12.1 33263 -24.393 150.473 GREVILLEA CREEK ALLUVIUM 0.6 11.8
128149 -24.5157 150.4871 GREVILLEA CREEK ALLUVIUM 11.55 37331 -24.3207 150.4354 GREVILLEA CREEK ALLUVIUM 0 10.7 32633 -24.3417 150.4563 GREVILLEA CREEK ALLUVIUM COND 2950 3.4 9.7 57795 -24.3034 150.4466 GREVILLEA CREEK ALLUVIUM 0.5 9.3 47092 -24.9715 150.0944 GREVILLEA CREEK ALLUVIUM COND 6200 1.9 8.4 8362 -24.8923 150.0849 GREVILLEA CREEK ALLUVIUM 2 6.7
32632 -24.8849 150.1462 GREVILLEA CREEK ALLUVIUM 1.89 6 128185 -24.415 150.518 KARIBOE CREEK ALLUVIUM 12.6 18.05 89736 -24.3375 150.4332 KARIBOE CREEK ALLUVIUM 1 16.1 68452 -24.3847 150.4778 KARIBOE CREEK ALLUVIUM 1.5 15.7
13030545 -24.4943 150.2504 KARIBOE CREEK ALLUVIUM COND 1650 13.9 31980 -24.327 150.4563 KARIBOE CREEK ALLUVIUM COND 2800 45.5 9 31132 -24.9377 150.0773 KARIBOE CREEK ALLUVIUM COND 2475 30.2 8.8 34106 -24.4114 150.4323 KARIBOE CREEK ALLUVIUM 4.7 7.5
13030084 -25.2097 150.1411 KARIBOE CREEK ALLUVIUM COND 2230 4.8 31527 -24.6862 149.8354 KARIBOE CREEK ALLUVIUM 37.8 4.6 31528 -25.155 150.1756 KARIBOE CREEK ALLUVIUM 38.4 3.3 68835 -24.3204 150.4372 KROOMBIT CREEK ALLUVIUM 1.38 59.5
128220 -24.8998 150.1083 KROOMBIT CREEK ALLUVIUM 0.63 18 128187 -24.5719 150.4381 KROOMBIT CREEK ALLUVIUM 25.26 17.7 89963 -24.3845 150.4527 KROOMBIT CREEK ALLUVIUM 0.63 17.55 89957 -24.3787 150.5135 KROOMBIT CREEK ALLUVIUM POTABLE 9.99 17.5 68489 -24.4145 150.5019 KROOMBIT CREEK ALLUVIUM 0.4 17.4 68829 -24.3056 150.433 KROOMBIT CREEK ALLUVIUM 1 17.2
416 -24.4843 149.8417 KROOMBIT CREEK ALLUVIUM 0.01 16.8 68592 -24.6354 150.4702 KROOMBIT CREEK ALLUVIUM 1.3 16.7 68552 -24.3859 150.435 KROOMBIT CREEK ALLUVIUM COND 920 1.3 16.6
128596 -24.339 150.4488 KROOMBIT CREEK ALLUVIUM POTABLE 0.8 16.4 13030694 -24.8443 150.2866 KROOMBIT CREEK ALLUVIUM 16.35
68843 -24.347 150.4716 KROOMBIT CREEK ALLUVIUM POTABLE 11.25 16.35
Underground Water Impact Report - ATP 602 9

Underground Water Impact Report - ATP 602 • Harcourt Petroleum N.L.
Bore ID (RN) Latitude Longitude Hydraulic unit Water quality
(µS/cm) Yield (L/s)
Water level
(mbgl) 89890 -24.3325 150.4572 KROOMBIT CREEK ALLUVIUM 1 16.28 89794 -24.8295 149.8 KROOMBIT CREEK ALLUVIUM 0.38 16.2
13030615 -24.3814 150.4989 KROOMBIT CREEK ALLUVIUM 16.13 89737 -24.4106 150.499 KROOMBIT CREEK ALLUVIUM 20.2 16
13030669 -25.1503 150.2606 KROOMBIT CREEK ALLUVIUM 15.8 68456 -24.4092 150.4941 KROOMBIT CREEK ALLUVIUM 20.2 15.8 89733 -24.3374 150.4523 KROOMBIT CREEK ALLUVIUM 1 15.8 89730 -24.41 150.4958 KROOMBIT CREEK ALLUVIUM 1 15.4 68866 -24.7024 150.4858 KROOMBIT CREEK ALLUVIUM 1 15.3 68903 -24.4091 150.4919 KROOMBIT CREEK ALLUVIUM COND 830 1.89 15.15 89908 -24.2944 150.4138 KROOMBIT CREEK ALLUVIUM POTABLE 17.5 14.95 68802 -24.4195 150.4347 KROOMBIT CREEK ALLUVIUM 23.94 14.86
13030477 -24.3222 150.4258 KROOMBIT CREEK ALLUVIUM 14.8 31134 -24.9478 150.0768 KROOMBIT CREEK ALLUVIUM COND 990 0.88 14.6 35002 -24.9828 150.14 KROOMBIT CREEK ALLUVIUM COND 840 0.76 14.52 43863 -24.305 150.4543 KROOMBIT CREEK ALLUVIUM 35.9 14.4 89956 -24.482 150.421 KROOMBIT CREEK ALLUVIUM POTABLE 1.2 14.38 32683 -24.3186 150.465 KROOMBIT CREEK ALLUVIUM 0.5 14.2 89873 -24.545 150.4251 KROOMBIT CREEK ALLUVIUM 0.8 14.15 68543 -24.3701 150.5153 KROOMBIT CREEK ALLUVIUM 1.89 14.1
128341 -24.2986 149.6997 KROOMBIT CREEK ALLUVIUM POTABLE 10.25 14.05 34972 -24.437 150.4186 KROOMBIT CREEK ALLUVIUM 13.9 14 47084 -24.9792 150.0891 KROOMBIT CREEK ALLUVIUM 25.2 13.8
128017 -24.3281 150.4422 KROOMBIT CREEK ALLUVIUM 8 13.8 13030259 -25.0603 150.0714 KROOMBIT CREEK ALLUVIUM 13.73
68057 -24.5376 150.4292 KROOMBIT CREEK ALLUVIUM POTABLE 1.1 13.7 62034 -24.3261 150.4455 KROOMBIT CREEK ALLUVIUM 0.8 13.7 68605 -24.3045 150.3994 KROOMBIT CREEK ALLUVIUM COND 2650 1.2 13.7 89857 -25.2773 149.7392 KROOMBIT CREEK ALLUVIUM POTABLE 0.8 13.7
128028 -24.4268 150.5141 KROOMBIT CREEK ALLUVIUM 1.26 13.7 68911 -24.8226 149.8055 KROOMBIT CREEK ALLUVIUM 13.5 89789 -24.4262 150.4286 KROOMBIT CREEK ALLUVIUM 0.76 13.5
128002 -24.3387 150.4566 KROOMBIT CREEK ALLUVIUM 0.8 13.4 128654 -24.3582 150.4383 KROOMBIT CREEK ALLUVIUM POTABLE 13.35 68981 -24.3657 150.4964 KROOMBIT CREEK ALLUVIUM POTABLE 0.56 13.34 68611 -24.6073 150.4462 KROOMBIT CREEK ALLUVIUM 12.6 13.3
128010 -24.3572 150.5143 KROOMBIT CREEK ALLUVIUM 8.75 13.3 68761 -24.3738 150.5011 KROOMBIT CREEK ALLUVIUM 1.4 13.2 68912 -24.8306 149.8011 KROOMBIT CREEK ALLUVIUM 1 13.15 68950 -24.2953 150.4233 KROOMBIT CREEK ALLUVIUM 0.75 13.13 68621 -24.4189 150.4263 KROOMBIT CREEK ALLUVIUM 19 13.1 68801 -25.2423 149.6972 KROOMBIT CREEK ALLUVIUM COND 500 15.12 13 68800 -24.4026 150.4835 KROOMBIT CREEK ALLUVIUM 0.88 13 68618 -24.3978 150.4875 KROOMBIT CREEK ALLUVIUM 7.56 12.95 47252 -25.2817 150.26 KROOMBIT CREEK ALLUVIUM 0.6 12.9
128369 -24.8984 150.0878 KROOMBIT CREEK ALLUVIUM POTABLE 12 12.9 13030679 -25.2729 150.2783 KROOMBIT CREEK ALLUVIUM COND 1250 1.26 12.8
43088 -24.3413 150.4862 KROOMBIT CREEK ALLUVIUM COND 2110 11.3 12.8 47251 -25.0679 150.2483 KROOMBIT CREEK ALLUVIUM 0.6 12.8 68735 -24.3852 150.4771 KROOMBIT CREEK ALLUVIUM 12.6 12.7 47249 -24.9584 150.1083 KROOMBIT CREEK ALLUVIUM 0.6 12.6 57496 -24.329 150.4209 KROOMBIT CREEK ALLUVIUM 1 12.6
Underground Water Impact Report - ATP 602 10
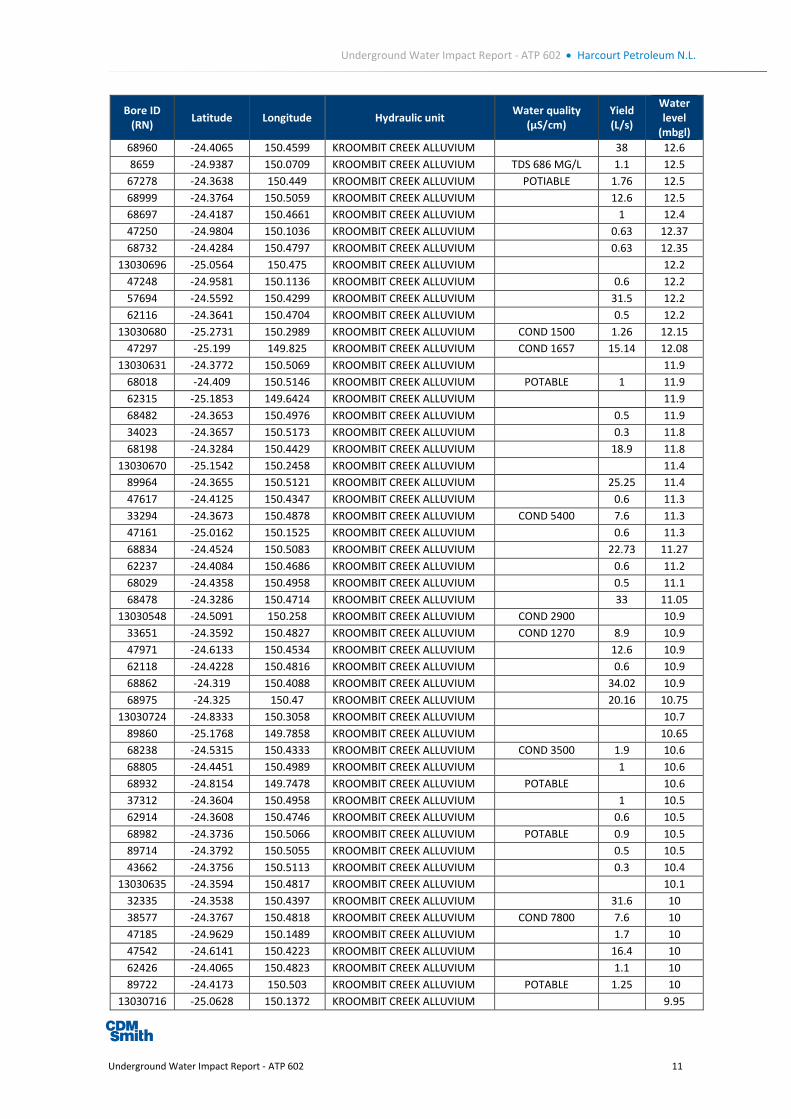
Underground Water Impact Report - ATP 602 • Harcourt Petroleum N.L.
Bore ID (RN) Latitude Longitude Hydraulic unit Water quality
(µS/cm) Yield (L/s)
Water level
(mbgl) 68960 -24.4065 150.4599 KROOMBIT CREEK ALLUVIUM 38 12.6 8659 -24.9387 150.0709 KROOMBIT CREEK ALLUVIUM TDS 686 MG/L 1.1 12.5
67278 -24.3638 150.449 KROOMBIT CREEK ALLUVIUM POTIABLE 1.76 12.5 68999 -24.3764 150.5059 KROOMBIT CREEK ALLUVIUM 12.6 12.5 68697 -24.4187 150.4661 KROOMBIT CREEK ALLUVIUM 1 12.4 47250 -24.9804 150.1036 KROOMBIT CREEK ALLUVIUM 0.63 12.37 68732 -24.4284 150.4797 KROOMBIT CREEK ALLUVIUM 0.63 12.35
13030696 -25.0564 150.475 KROOMBIT CREEK ALLUVIUM 12.2 47248 -24.9581 150.1136 KROOMBIT CREEK ALLUVIUM 0.6 12.2 57694 -24.5592 150.4299 KROOMBIT CREEK ALLUVIUM 31.5 12.2 62116 -24.3641 150.4704 KROOMBIT CREEK ALLUVIUM 0.5 12.2
13030680 -25.2731 150.2989 KROOMBIT CREEK ALLUVIUM COND 1500 1.26 12.15 47297 -25.199 149.825 KROOMBIT CREEK ALLUVIUM COND 1657 15.14 12.08
13030631 -24.3772 150.5069 KROOMBIT CREEK ALLUVIUM 11.9 68018 -24.409 150.5146 KROOMBIT CREEK ALLUVIUM POTABLE 1 11.9 62315 -25.1853 149.6424 KROOMBIT CREEK ALLUVIUM 11.9 68482 -24.3653 150.4976 KROOMBIT CREEK ALLUVIUM 0.5 11.9 34023 -24.3657 150.5173 KROOMBIT CREEK ALLUVIUM 0.3 11.8 68198 -24.3284 150.4429 KROOMBIT CREEK ALLUVIUM 18.9 11.8
13030670 -25.1542 150.2458 KROOMBIT CREEK ALLUVIUM 11.4 89964 -24.3655 150.5121 KROOMBIT CREEK ALLUVIUM 25.25 11.4 47617 -24.4125 150.4347 KROOMBIT CREEK ALLUVIUM 0.6 11.3 33294 -24.3673 150.4878 KROOMBIT CREEK ALLUVIUM COND 5400 7.6 11.3 47161 -25.0162 150.1525 KROOMBIT CREEK ALLUVIUM 0.6 11.3 68834 -24.4524 150.5083 KROOMBIT CREEK ALLUVIUM 22.73 11.27 62237 -24.4084 150.4686 KROOMBIT CREEK ALLUVIUM 0.6 11.2 68029 -24.4358 150.4958 KROOMBIT CREEK ALLUVIUM 0.5 11.1 68478 -24.3286 150.4714 KROOMBIT CREEK ALLUVIUM 33 11.05
13030548 -24.5091 150.258 KROOMBIT CREEK ALLUVIUM COND 2900 10.9 33651 -24.3592 150.4827 KROOMBIT CREEK ALLUVIUM COND 1270 8.9 10.9 47971 -24.6133 150.4534 KROOMBIT CREEK ALLUVIUM 12.6 10.9 62118 -24.4228 150.4816 KROOMBIT CREEK ALLUVIUM 0.6 10.9 68862 -24.319 150.4088 KROOMBIT CREEK ALLUVIUM 34.02 10.9 68975 -24.325 150.47 KROOMBIT CREEK ALLUVIUM 20.16 10.75
13030724 -24.8333 150.3058 KROOMBIT CREEK ALLUVIUM 10.7 89860 -25.1768 149.7858 KROOMBIT CREEK ALLUVIUM 10.65 68238 -24.5315 150.4333 KROOMBIT CREEK ALLUVIUM COND 3500 1.9 10.6 68805 -24.4451 150.4989 KROOMBIT CREEK ALLUVIUM 1 10.6 68932 -24.8154 149.7478 KROOMBIT CREEK ALLUVIUM POTABLE 10.6 37312 -24.3604 150.4958 KROOMBIT CREEK ALLUVIUM 1 10.5 62914 -24.3608 150.4746 KROOMBIT CREEK ALLUVIUM 0.6 10.5 68982 -24.3736 150.5066 KROOMBIT CREEK ALLUVIUM POTABLE 0.9 10.5 89714 -24.3792 150.5055 KROOMBIT CREEK ALLUVIUM 0.5 10.5 43662 -24.3756 150.5113 KROOMBIT CREEK ALLUVIUM 0.3 10.4
13030635 -24.3594 150.4817 KROOMBIT CREEK ALLUVIUM 10.1 32335 -24.3538 150.4397 KROOMBIT CREEK ALLUVIUM 31.6 10 38577 -24.3767 150.4818 KROOMBIT CREEK ALLUVIUM COND 7800 7.6 10 47185 -24.9629 150.1489 KROOMBIT CREEK ALLUVIUM 1.7 10 47542 -24.6141 150.4223 KROOMBIT CREEK ALLUVIUM 16.4 10 62426 -24.4065 150.4823 KROOMBIT CREEK ALLUVIUM 1.1 10 89722 -24.4173 150.503 KROOMBIT CREEK ALLUVIUM POTABLE 1.25 10
13030716 -25.0628 150.1372 KROOMBIT CREEK ALLUVIUM 9.95
Underground Water Impact Report - ATP 602 11
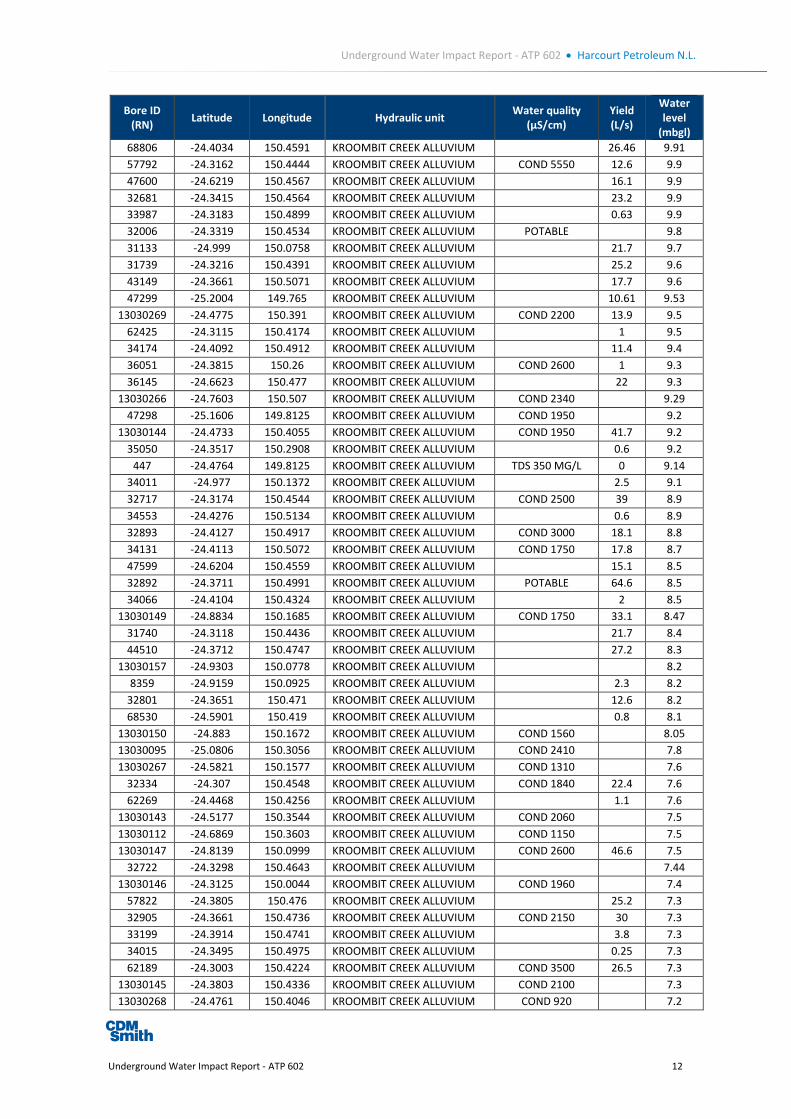
Underground Water Impact Report - ATP 602 • Harcourt Petroleum N.L.
Bore ID (RN) Latitude Longitude Hydraulic unit Water quality
(µS/cm) Yield (L/s)
Water level
(mbgl) 68806 -24.4034 150.4591 KROOMBIT CREEK ALLUVIUM 26.46 9.91 57792 -24.3162 150.4444 KROOMBIT CREEK ALLUVIUM COND 5550 12.6 9.9 47600 -24.6219 150.4567 KROOMBIT CREEK ALLUVIUM 16.1 9.9 32681 -24.3415 150.4564 KROOMBIT CREEK ALLUVIUM 23.2 9.9 33987 -24.3183 150.4899 KROOMBIT CREEK ALLUVIUM 0.63 9.9 32006 -24.3319 150.4534 KROOMBIT CREEK ALLUVIUM POTABLE 9.8 31133 -24.999 150.0758 KROOMBIT CREEK ALLUVIUM 21.7 9.7 31739 -24.3216 150.4391 KROOMBIT CREEK ALLUVIUM 25.2 9.6 43149 -24.3661 150.5071 KROOMBIT CREEK ALLUVIUM 17.7 9.6 47299 -25.2004 149.765 KROOMBIT CREEK ALLUVIUM 10.61 9.53
13030269 -24.4775 150.391 KROOMBIT CREEK ALLUVIUM COND 2200 13.9 9.5 62425 -24.3115 150.4174 KROOMBIT CREEK ALLUVIUM 1 9.5 34174 -24.4092 150.4912 KROOMBIT CREEK ALLUVIUM 11.4 9.4 36051 -24.3815 150.26 KROOMBIT CREEK ALLUVIUM COND 2600 1 9.3 36145 -24.6623 150.477 KROOMBIT CREEK ALLUVIUM 22 9.3
13030266 -24.7603 150.507 KROOMBIT CREEK ALLUVIUM COND 2340 9.29 47298 -25.1606 149.8125 KROOMBIT CREEK ALLUVIUM COND 1950 9.2
13030144 -24.4733 150.4055 KROOMBIT CREEK ALLUVIUM COND 1950 41.7 9.2 35050 -24.3517 150.2908 KROOMBIT CREEK ALLUVIUM 0.6 9.2
447 -24.4764 149.8125 KROOMBIT CREEK ALLUVIUM TDS 350 MG/L 0 9.14 34011 -24.977 150.1372 KROOMBIT CREEK ALLUVIUM 2.5 9.1 32717 -24.3174 150.4544 KROOMBIT CREEK ALLUVIUM COND 2500 39 8.9 34553 -24.4276 150.5134 KROOMBIT CREEK ALLUVIUM 0.6 8.9 32893 -24.4127 150.4917 KROOMBIT CREEK ALLUVIUM COND 3000 18.1 8.8 34131 -24.4113 150.5072 KROOMBIT CREEK ALLUVIUM COND 1750 17.8 8.7 47599 -24.6204 150.4559 KROOMBIT CREEK ALLUVIUM 15.1 8.5 32892 -24.3711 150.4991 KROOMBIT CREEK ALLUVIUM POTABLE 64.6 8.5 34066 -24.4104 150.4324 KROOMBIT CREEK ALLUVIUM 2 8.5
13030149 -24.8834 150.1685 KROOMBIT CREEK ALLUVIUM COND 1750 33.1 8.47 31740 -24.3118 150.4436 KROOMBIT CREEK ALLUVIUM 21.7 8.4 44510 -24.3712 150.4747 KROOMBIT CREEK ALLUVIUM 27.2 8.3
13030157 -24.9303 150.0778 KROOMBIT CREEK ALLUVIUM 8.2 8359 -24.9159 150.0925 KROOMBIT CREEK ALLUVIUM 2.3 8.2
32801 -24.3651 150.471 KROOMBIT CREEK ALLUVIUM 12.6 8.2 68530 -24.5901 150.419 KROOMBIT CREEK ALLUVIUM 0.8 8.1
13030150 -24.883 150.1672 KROOMBIT CREEK ALLUVIUM COND 1560 8.05 13030095 -25.0806 150.3056 KROOMBIT CREEK ALLUVIUM COND 2410 7.8 13030267 -24.5821 150.1577 KROOMBIT CREEK ALLUVIUM COND 1310 7.6
32334 -24.307 150.4548 KROOMBIT CREEK ALLUVIUM COND 1840 22.4 7.6 62269 -24.4468 150.4256 KROOMBIT CREEK ALLUVIUM 1.1 7.6
13030143 -24.5177 150.3544 KROOMBIT CREEK ALLUVIUM COND 2060 7.5 13030112 -24.6869 150.3603 KROOMBIT CREEK ALLUVIUM COND 1150 7.5 13030147 -24.8139 150.0999 KROOMBIT CREEK ALLUVIUM COND 2600 46.6 7.5
32722 -24.3298 150.4643 KROOMBIT CREEK ALLUVIUM 7.44 13030146 -24.3125 150.0044 KROOMBIT CREEK ALLUVIUM COND 1960 7.4
57822 -24.3805 150.476 KROOMBIT CREEK ALLUVIUM 25.2 7.3 32905 -24.3661 150.4736 KROOMBIT CREEK ALLUVIUM COND 2150 30 7.3 33199 -24.3914 150.4741 KROOMBIT CREEK ALLUVIUM 3.8 7.3 34015 -24.3495 150.4975 KROOMBIT CREEK ALLUVIUM 0.25 7.3 62189 -24.3003 150.4224 KROOMBIT CREEK ALLUVIUM COND 3500 26.5 7.3
13030145 -24.3803 150.4336 KROOMBIT CREEK ALLUVIUM COND 2100 7.3 13030268 -24.4761 150.4046 KROOMBIT CREEK ALLUVIUM COND 920 7.2
Underground Water Impact Report - ATP 602 12

Underground Water Impact Report - ATP 602 • Harcourt Petroleum N.L.
Bore ID (RN) Latitude Longitude Hydraulic unit Water quality
(µS/cm) Yield (L/s)
Water level
(mbgl) 13030602 -24.4168 150.5025 KROOMBIT CREEK ALLUVIUM COND 1880 7.11
8369 -24.9054 150.0758 KROOMBIT CREEK ALLUVIUM TDS 1616 MG/L 2.3 7 31273 -24.2962 150.4225 KROOMBIT CREEK ALLUVIUM COND 6620 0.63 7 32333 -24.3386 150.4493 KROOMBIT CREEK ALLUVIUM 27.9 6.9
13030603 -24.4186 150.5042 KROOMBIT CREEK ALLUVIUM COND 1750 6.83 32336 -24.3235 150.4556 KROOMBIT CREEK ALLUVIUM 1 6.8 35037 -24.4967 150.4206 KROOMBIT CREEK ALLUVIUM 55.9 6.78 62523 -24.3408 150.4437 KROOMBIT CREEK ALLUVIUM COND 2800 18.9 6.75
13030135 -24.7013 150.4439 KROOMBIT CREEK ALLUVIUM COND 2620 6.7 31625 -24.3228 150.4383 KROOMBIT CREEK ALLUVIUM COND 4250 18.9 6.7 31270 -25.0325 150.1516 KROOMBIT CREEK ALLUVIUM COND 3150 14.2 6.7 36614 -24.3061 150.4235 KROOMBIT CREEK ALLUVIUM COND 8420 0.9 6.7
13030601 -24.3833 150.4811 KROOMBIT CREEK ALLUVIUM COND 1950 6.65 57745 -24.4301 150.5113 KROOMBIT CREEK ALLUVIUM 29 6.6
13030240 -24.7603 150.4808 KROOMBIT CREEK ALLUVIUM COND 1580 6.55 31657 -24.3032 150.4418 KROOMBIT CREEK ALLUVIUM 1.2 6.5 43862 -24.3133 150.4586 KROOMBIT CREEK ALLUVIUM 37.9 6.5
13030600 -24.6242 150.4214 KROOMBIT CREEK ALLUVIUM COND 1580 6.5 32906 -24.3664 150.4738 KROOMBIT CREEK ALLUVIUM COND 1500 38 6.3 62119 -24.3072 150.4144 KROOMBIT CREEK ALLUVIUM 0.5 6.3 32162 -24.3219 150.3938 KROOMBIT CREEK ALLUVIUM COND 3300 32.83 6.25 31886 -24.3207 150.4488 KROOMBIT CREEK ALLUVIUM 0.5 6.2 47607 -24.4376 150.5158 KROOMBIT CREEK ALLUVIUM 6.1 8366 -24.8612 150.2397 KROOMBIT CREEK ALLUVIUM 2.3 6.1
32720 -24.2789 150.3341 KROOMBIT CREEK ALLUVIUM COND 3250 45 5.99 32719 -24.3675 150.4485 KROOMBIT CREEK ALLUVIUM COND 1840 24.7 5.97 31626 -24.2804 150.4406 KROOMBIT CREEK ALLUVIUM 20.7 5.9 31526 -24.3087 150.431 KROOMBIT CREEK ALLUVIUM COND 3700 39.4 5.8
13030262 -24.7935 150.5052 KROOMBIT CREEK ALLUVIUM 5.64 8276 -24.937 150.0676 KROOMBIT CREEK ALLUVIUM TDS 644 MG/L 0.9 5.6
13030108 -24.7669 150.5173 KROOMBIT CREEK ALLUVIUM COND 1960 5.5 34003 -24.3187 150.4893 KROOMBIT CREEK ALLUVIUM 0.74 5.4 32721 -24.279 150.3342 KROOMBIT CREEK ALLUVIUM COND 2000 35.5 5.3 32783 -25.1592 150.2172 KROOMBIT CREEK ALLUVIUM COND 2800 30 5.18 33418 -24.3862 150.4882 KROOMBIT CREEK ALLUVIUM 19.8 5.18
13030261 -24.6208 150.4187 KROOMBIT CREEK ALLUVIUM 5.13 13030263 -24.7628 150.4652 KROOMBIT CREEK ALLUVIUM 5.13 13030110 -24.8834 150.4576 KROOMBIT CREEK ALLUVIUM COND 1910 5.1 13030111 -24.7127 150.4612 KROOMBIT CREEK ALLUVIUM COND 1950 32.8 5.1 13030096 -24.7164 150.2851 KROOMBIT CREEK ALLUVIUM COND 1900 5.1 13030109 -24.8524 150.4598 KROOMBIT CREEK ALLUVIUM COND 1930 5.1
32022 -24.3351 150.4478 KROOMBIT CREEK ALLUVIUM 2305 US/CM 27.8 4.8 32902 -24.9059 150.1258 KROOMBIT CREEK ALLUVIUM 18.9 4.8 32718 -24.3523 150.4487 KROOMBIT CREEK ALLUVIUM COND 3750 52.3 4.7 31749 -24.3305 150.4418 KROOMBIT CREEK ALLUVIUM COND 2850 34.1 4.6
13030265 -24.7603 150.4645 KROOMBIT CREEK ALLUVIUM 4.49 32161 -24.316 150.4591 KROOMBIT CREEK ALLUVIUM COND 3130 20.2 4.4 32904 -24.3329 150.463 KROOMBIT CREEK ALLUVIUM COND 2390 36.5 4.4 32781 -24.4723 150.1508 KROOMBIT CREEK ALLUVIUM COND 3300 63 4.34 32903 -24.3414 150.4771 KROOMBIT CREEK ALLUVIUM COND 2420 25 4.3
13030264 -24.7632 150.476 KROOMBIT CREEK ALLUVIUM 4.12 13030093 -25.0698 150.311 KROOMBIT CREEK ALLUVIUM COND 4100 4.1
Underground Water Impact Report - ATP 602 13

Underground Water Impact Report - ATP 602 • Harcourt Petroleum N.L.
Bore ID (RN) Latitude Longitude Hydraulic unit Water quality
(µS/cm) Yield (L/s)
Water level
(mbgl) 13030098 -24.7694 150.4541 KROOMBIT CREEK ALLUVIUM COND 3500 4 13030137 -24.5217 150.4486 KROOMBIT CREEK ALLUVIUM COND 3400 3.8
31529 -24.3268 150.4293 KROOMBIT CREEK ALLUVIUM 52.7 3.6 13030238 -24.7615 150.4763 KROOMBIT CREEK ALLUVIUM COND 3000 3.3 13030100 -24.8585 150.4642 KROOMBIT CREEK ALLUVIUM COND 1440 2.9 13030102 -24.8583 150.4633 KROOMBIT CREEK ALLUVIUM 2.8 13030106 -24.7572 150.4583 KROOMBIT CREEK ALLUVIUM 2.8 13030103 -24.8583 150.4632 KROOMBIT CREEK ALLUVIUM 2.7 13030107 -24.7584 150.4615 KROOMBIT CREEK ALLUVIUM COND 2840 2.6 13030105 -24.8056 150.5129 KROOMBIT CREEK ALLUVIUM COND 3010 31.6 2.6 13030099 -24.7798 150.4637 KROOMBIT CREEK ALLUVIUM COND 2450 2.5 13030104 -24.8249 150.4862 KROOMBIT CREEK ALLUVIUM COND 3000 2.3 13030237 -24.8318 150.3143 KROOMBIT CREEK ALLUVIUM 2.06
128378 -25.1541 150.1713 LONESOME CREEK ALLUVIUM POTABLE 0.99 9.5 128311 -25.022 150.158 LONESOME CREEK ALLUVIUM POTABLE 0.99 8.7 89582 -24.3615 150.4669 LONESOME CREEK ALLUVIUM 10 8.5 68337 -24.6275 150.4239 LONESOME CREEK ALLUVIUM COND 3850 23 6.15 68104 -24.3436 150.4744 LONESOME CREEK ALLUVIUM COND 3850 22.7 5.95 68105 -24.4078 150.4966 LONESOME CREEK ALLUVIUM COND 670 23.9 5.8 68103 -24.3427 150.4757 LONESOME CREEK ALLUVIUM COND 1350 43.6 5.65 68338 -24.6415 150.4591 LONESOME CREEK ALLUVIUM COND 4600 23 5.54 89591 -24.3858 150.4987 LONESOME CREEK ALLUVIUM COND 3300 25.3 5.3
128154 -24.3233 150.442 MOOCOOROOBA GRANITE 1220 M/S 0.25 17 128154 -24.3233 150.442 MOOCOOROOBA GRANITE 1110 M/S 1.14 9 128154 -24.3233 150.442 MOOCOOROOBA GRANITE 1430 M/S 0.25 6.4 47186 -24.9851 150.15 OAKY CREEK ALLUVIUM 1 12.1
13030714 -24.9317 150.1756 OAKY CREEK ALLUVIUM 9.25 13030713 -24.9161 150.3817 OAKY CREEK ALLUVIUM BRACKISH 9.1
128195 -24.3674 150.4775 OXTRACK FORMATION 1200 M/S 0.6 26.5 10926 -24.9415 150.0749 OXTRACK FORMATION FAIR 1.8 3 44642 -24.3723 150.4921 PROSPECT CREEK ALLUVIUM 10.1 14 89903 -24.3714 150.4836 PROSPECT CREEK ALLUVIUM 0.76 13.95 89832 -24.4124 150.4735 PROSPECT CREEK ALLUVIUM 22.7 13.65 36418 -24.3917 150.4689 PROSPECT CREEK ALLUVIUM COND 1520 0.3 13
128021 -24.3499 150.4722 PROSPECT CREEK ALLUVIUM 0.44 12.45 34774 -25.1247 150.0633 PROSPECT CREEK ALLUVIUM 0.9 12.3 33848 -24.3995 150.4295 PROSPECT CREEK ALLUVIUM 1.69 12.2
128037 -24.3306 150.4652 PROSPECT CREEK ALLUVIUM POTABLE 0.9 12.2 31234 -24.9553 150.0744 PROSPECT CREEK ALLUVIUM 0.57 11.7
128207 -24.3848 150.4526 PROSPECT CREEK ALLUVIUM 3 11.5 68985 -24.3754 150.5071 PROSPECT CREEK ALLUVIUM 1.26 11.4 34210 -24.4126 150.4325 PROSPECT CREEK ALLUVIUM 0.19 11.1 43137 -24.2971 150.4501 PROSPECT CREEK ALLUVIUM COND 2100 1.3 10.84 62577 -24.4267 150.5097 PROSPECT CREEK ALLUVIUM COND 2720 13.9 10.7 68777 -24.5595 150.4839 PROSPECT CREEK ALLUVIUM 0.75 10.15 68313 -24.495 150.4214 PROSPECT CREEK ALLUVIUM 0.5 10 31235 -24.2762 150.399 PROSPECT CREEK ALLUVIUM COND 2060 31.6 9.8 31385 -24.3201 150.4158 PROSPECT CREEK ALLUVIUM 10.1 9.1 34492 -24.4318 150.501 PROSPECT CREEK ALLUVIUM 0.12 9.1 68674 -24.7282 150.5037 PROSPECT CREEK ALLUVIUM COND?? 2800 8.4 8.66 68676 -24.4177 150.4283 PROSPECT CREEK ALLUVIUM 1.76 8.1 31239 -24.2859 150.4113 PROSPECT CREEK ALLUVIUM POTABLE 9.25 7.92
Underground Water Impact Report - ATP 602 14

Underground Water Impact Report - ATP 602 • Harcourt Petroleum N.L.
Bore ID (RN) Latitude Longitude Hydraulic unit Water quality
(µS/cm) Yield (L/s)
Water level
(mbgl) 31884 -24.3351 150.4447 PROSPECT CREEK ALLUVIUM 0.25 7.9
13030010 -24.7171 150.2296 PROSPECT CREEK ALLUVIUM COND 1380 7.8 57850 -24.3833 150.47 PROSPECT CREEK ALLUVIUM 29 7.7 33073 -24.3858 150.4346 PROSPECT CREEK ALLUVIUM COND 1250 24 7.6 33933 -24.414 150.4718 PROSPECT CREEK ALLUVIUM 0.63 7.6 33202 -24.3863 150.4434 PROSPECT CREEK ALLUVIUM COND 3100 1.9 7.4 68322 -24.4212 150.4344 PROSPECT CREEK ALLUVIUM 0.5 7.4 33374 -24.3892 150.4326 PROSPECT CREEK ALLUVIUM 18.9 7.3 47188 -24.9854 150.1522 PROSPECT CREEK ALLUVIUM COND 1400 12.95 7.2 35065 -24.8212 150.3583 PROSPECT CREEK ALLUVIUM 0.38 6.96 31267 -25.0697 150.1317 PROSPECT CREEK ALLUVIUM 2.5 6.9 68871 -24.4196 150.4956 PROSPECT CREEK ALLUVIUM 0.63 6.6 31236 -24.9568 150.0777 PROSPECT CREEK ALLUVIUM COND 3850 2.3 6.55 31130 -24.9537 150.0769 PROSPECT CREEK ALLUVIUM COND 1200 26 6.5 68275 -24.4384 150.4197 PROSPECT CREEK ALLUVIUM COND 2700 17 6.5 68906 -24.3457 150.4361 PROSPECT CREEK ALLUVIUM 1500PPM 1.89 6.4 35965 -24.4211 150.2446 PROSPECT CREEK ALLUVIUM COND 2380 1.1 6.2 68905 -24.4095 150.495 PROSPECT CREEK ALLUVIUM TDS 630 PPM 6.3 6.2 31883 -24.3 150.4476 PROSPECT CREEK ALLUVIUM 14 6 34326 -24.4272 150.5126 PROSPECT CREEK ALLUVIUM COND 4200 2.3 6 47303 -25.2334 149.7297 PROSPECT CREEK ALLUVIUM COND 3100 7.2 5.9
13030009 -24.339 150.1634 PROSPECT CREEK ALLUVIUM COND 1950 5.8 33849 -24.4171 150.4667 PROSPECT CREEK ALLUVIUM 5.8 34892 -24.3361 150.5119 PROSPECT CREEK ALLUVIUM 15.2 5.8 68278 -24.3665 150.513 PROSPECT CREEK ALLUVIUM 9.1 5.8
13030003 -24.4217 150.4287 PROSPECT CREEK ALLUVIUM COND 6750 5.7 13030006 -24.4319 149.9005 PROSPECT CREEK ALLUVIUM COND 2060 31.16 5.6 13030008 -24.3682 150.5157 PROSPECT CREEK ALLUVIUM COND 2060 5.5 13030007 -24.3868 150.4423 PROSPECT CREEK ALLUVIUM COND 1900 5.5
35064 -24.8254 150.345 PROSPECT CREEK ALLUVIUM COND 2100 0.25 5.5 31238 -24.8989 150.091 PROSPECT CREEK ALLUVIUM 1.26 5.49
13030005 -24.3203 150.4548 PROSPECT CREEK ALLUVIUM COND 1850 5.4 35063 -24.4255 150.2273 PROSPECT CREEK ALLUVIUM 0.38 5.29 68907 -24.432 150.5134 PROSPECT CREEK ALLUVIUM 3000PPM 2.5 5.1
13030215 -24.9872 150.5142 PROSPECT CREEK ALLUVIUM COND 2800 4.73 68031 -24.3 150.4369 PROSPECT CREEK ALLUVIUM 30.2 4.7 31440 -24.3083 150.4409 PROSPECT CREEK ALLUVIUM COND 1440 18.9 4.7 34584 -25.1565 150.2614 PROSPECT CREEK ALLUVIUM COND 1950 7.6 4.57
13030004 -24.4091 150.4924 PROSPECT CREEK ALLUVIUM COND 5700 4.1 68753 -24.3763 150.5015 PROSPECT CREEK ALLUVIUM COND 2840 18.9 4.04 31240 -24.2936 150.3999 PROSPECT CREEK ALLUVIUM POTABLE 1.26 4.03 31381 -24.9008 150.112 PROSPECT CREEK ALLUVIUM 3.8 32671 -24.6136 149.8414 PROSPECT CREEK ALLUVIUM COND 2950 11.9 3.7
13030214 -24.8473 150.4474 PROSPECT CREEK ALLUVIUM BRACKISH 3.5 34069 -24.4112 150.4323 PROSPECT CREEK ALLUVIUM 27.3 3.38 31444 -24.2992 150.4205 PROSPECT CREEK ALLUVIUM 20.2 3.3 57561 -24.6362 150.4694 PROSPECT CREEK ALLUVIUM 3.3
13030002 -24.3031 150.4227 PROSPECT CREEK ALLUVIUM COND 1560 3.2 31065 -24.9381 150.0861 PROSPECT CREEK ALLUVIUM COND 2050 1.5 2.6
13030218 -24.4378 150.1402 PROSPECT CREEK ALLUVIUM 2.51 33757 -24.3669 150.4998 PROSPECT CREEK ALLUVIUM 13.89 2.44
13030216 -24.4451 150.1028 PROSPECT CREEK ALLUVIUM COND 1150 2.29
Underground Water Impact Report - ATP 602 15
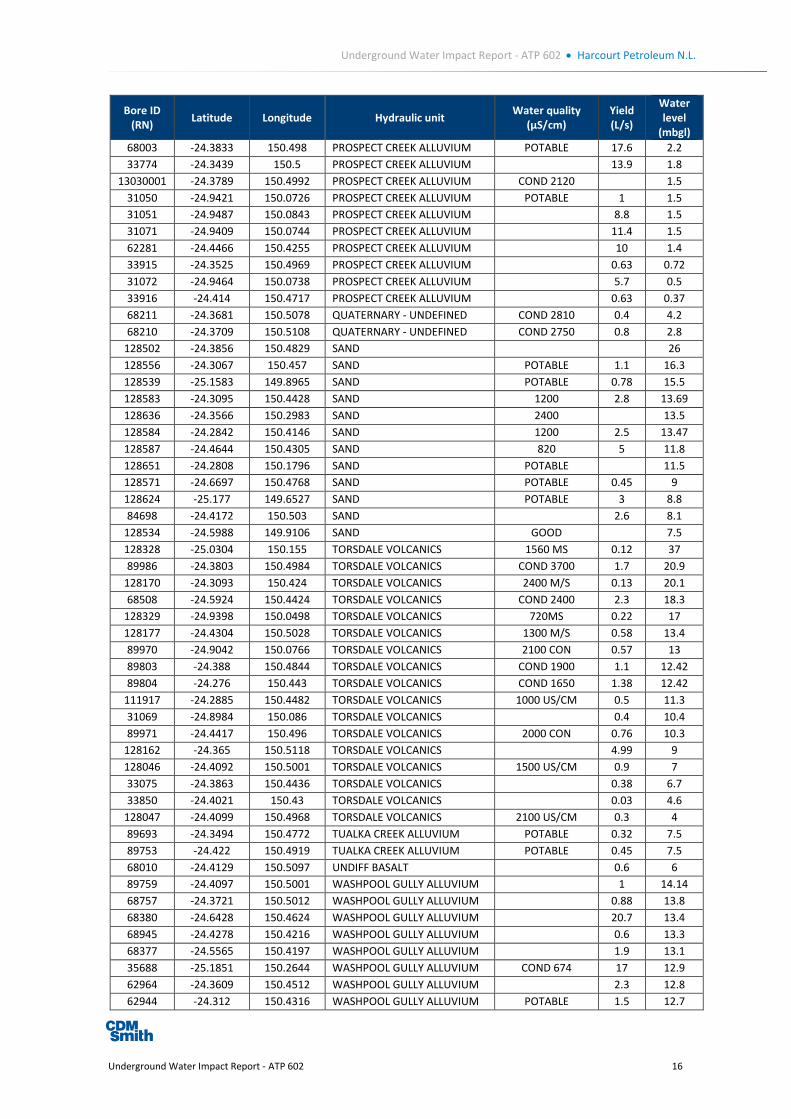
Underground Water Impact Report - ATP 602 • Harcourt Petroleum N.L.
Bore ID (RN) Latitude Longitude Hydraulic unit Water quality
(µS/cm) Yield (L/s)
Water level
(mbgl) 68003 -24.3833 150.498 PROSPECT CREEK ALLUVIUM POTABLE 17.6 2.2 33774 -24.3439 150.5 PROSPECT CREEK ALLUVIUM 13.9 1.8
13030001 -24.3789 150.4992 PROSPECT CREEK ALLUVIUM COND 2120 1.5 31050 -24.9421 150.0726 PROSPECT CREEK ALLUVIUM POTABLE 1 1.5 31051 -24.9487 150.0843 PROSPECT CREEK ALLUVIUM 8.8 1.5 31071 -24.9409 150.0744 PROSPECT CREEK ALLUVIUM 11.4 1.5 62281 -24.4466 150.4255 PROSPECT CREEK ALLUVIUM 10 1.4 33915 -24.3525 150.4969 PROSPECT CREEK ALLUVIUM 0.63 0.72 31072 -24.9464 150.0738 PROSPECT CREEK ALLUVIUM 5.7 0.5 33916 -24.414 150.4717 PROSPECT CREEK ALLUVIUM 0.63 0.37 68211 -24.3681 150.5078 QUATERNARY - UNDEFINED COND 2810 0.4 4.2 68210 -24.3709 150.5108 QUATERNARY - UNDEFINED COND 2750 0.8 2.8
128502 -24.3856 150.4829 SAND 26 128556 -24.3067 150.457 SAND POTABLE 1.1 16.3 128539 -25.1583 149.8965 SAND POTABLE 0.78 15.5 128583 -24.3095 150.4428 SAND 1200 2.8 13.69 128636 -24.3566 150.2983 SAND 2400 13.5 128584 -24.2842 150.4146 SAND 1200 2.5 13.47 128587 -24.4644 150.4305 SAND 820 5 11.8 128651 -24.2808 150.1796 SAND POTABLE 11.5 128571 -24.6697 150.4768 SAND POTABLE 0.45 9 128624 -25.177 149.6527 SAND POTABLE 3 8.8 84698 -24.4172 150.503 SAND 2.6 8.1
128534 -24.5988 149.9106 SAND GOOD 7.5 128328 -25.0304 150.155 TORSDALE VOLCANICS 1560 MS 0.12 37 89986 -24.3803 150.4984 TORSDALE VOLCANICS COND 3700 1.7 20.9
128170 -24.3093 150.424 TORSDALE VOLCANICS 2400 M/S 0.13 20.1 68508 -24.5924 150.4424 TORSDALE VOLCANICS COND 2400 2.3 18.3
128329 -24.9398 150.0498 TORSDALE VOLCANICS 720MS 0.22 17 128177 -24.4304 150.5028 TORSDALE VOLCANICS 1300 M/S 0.58 13.4 89970 -24.9042 150.0766 TORSDALE VOLCANICS 2100 CON 0.57 13 89803 -24.388 150.4844 TORSDALE VOLCANICS COND 1900 1.1 12.42 89804 -24.276 150.443 TORSDALE VOLCANICS COND 1650 1.38 12.42
111917 -24.2885 150.4482 TORSDALE VOLCANICS 1000 US/CM 0.5 11.3 31069 -24.8984 150.086 TORSDALE VOLCANICS 0.4 10.4 89971 -24.4417 150.496 TORSDALE VOLCANICS 2000 CON 0.76 10.3
128162 -24.365 150.5118 TORSDALE VOLCANICS 4.99 9 128046 -24.4092 150.5001 TORSDALE VOLCANICS 1500 US/CM 0.9 7 33075 -24.3863 150.4436 TORSDALE VOLCANICS 0.38 6.7 33850 -24.4021 150.43 TORSDALE VOLCANICS 0.03 4.6
128047 -24.4099 150.4968 TORSDALE VOLCANICS 2100 US/CM 0.3 4 89693 -24.3494 150.4772 TUALKA CREEK ALLUVIUM POTABLE 0.32 7.5 89753 -24.422 150.4919 TUALKA CREEK ALLUVIUM POTABLE 0.45 7.5 68010 -24.4129 150.5097 UNDIFF BASALT 0.6 6 89759 -24.4097 150.5001 WASHPOOL GULLY ALLUVIUM 1 14.14 68757 -24.3721 150.5012 WASHPOOL GULLY ALLUVIUM 0.88 13.8 68380 -24.6428 150.4624 WASHPOOL GULLY ALLUVIUM 20.7 13.4 68945 -24.4278 150.4216 WASHPOOL GULLY ALLUVIUM 0.6 13.3 68377 -24.5565 150.4197 WASHPOOL GULLY ALLUVIUM 1.9 13.1 35688 -25.1851 150.2644 WASHPOOL GULLY ALLUVIUM COND 674 17 12.9 62964 -24.3609 150.4512 WASHPOOL GULLY ALLUVIUM 2.3 12.8 62944 -24.312 150.4316 WASHPOOL GULLY ALLUVIUM POTABLE 1.5 12.7
Underground Water Impact Report - ATP 602 16

Underground Water Impact Report - ATP 602 • Harcourt Petroleum N.L.
Bore ID (RN) Latitude Longitude Hydraulic unit Water quality
(µS/cm) Yield (L/s)
Water level
(mbgl) 68522 -24.6007 150.4128 WASHPOOL GULLY ALLUVIUM 0.5 12.7 68502 -24.5815 150.4424 WASHPOOL GULLY ALLUVIUM 0.5 12.6 62958 -24.3749 150.4805 WASHPOOL GULLY ALLUVIUM 0.63 12.15 62957 -24.3753 150.4767 WASHPOOL GULLY ALLUVIUM 17.6 11.8 35687 -24.5443 150.4288 WASHPOOL GULLY ALLUVIUM COND 1150 28.4 11.6 35689 -25.2329 149.7169 WASHPOOL GULLY ALLUVIUM 10.6 11.6 68595 -24.6542 150.4872 WASHPOOL GULLY ALLUVIUM 0.5 11.5 68020 -24.4136 150.4979 WASHPOOL GULLY ALLUVIUM POTABLE 1.2 11.27 89747 -24.5335 150.4336 WASHPOOL GULLY ALLUVIUM 1 11.07 35691 -24.3837 150.2859 WASHPOOL GULLY ALLUVIUM 13 10.8 62056 -24.3203 150.4549 WASHPOOL GULLY ALLUVIUM 0.5 10.8 68776 -24.5576 150.4858 WASHPOOL GULLY ALLUVIUM COND 3400 0.88 10.32 35690 -24.5125 150.5114 WASHPOOL GULLY ALLUVIUM COND 1260 11.5 9.9 47162 -24.9723 150.1616 WASHPOOL GULLY ALLUVIUM 1 9.3 68182 -24.3679 150.5008 WASHPOOL GULLY ALLUVIUM 32.8 9 57638 -24.5679 150.4127 WASHPOOL GULLY ALLUVIUM 28.4 8.7 47192 -24.9756 150.1378 WASHPOOL GULLY ALLUVIUM COND 865 15.2 8.57 32353 -24.3412 150.4551 WASHPOOL GULLY ALLUVIUM 30.3 8.5 68070 -24.5162 150.4127 WASHPOOL GULLY ALLUVIUM 0.5 8.2 32355 -24.3461 150.4476 WASHPOOL GULLY ALLUVIUM 1.6 7.8 47615 -24.4349 150.5191 WASHPOOL GULLY ALLUVIUM 7.7 32354 -24.3188 150.4578 WASHPOOL GULLY ALLUVIUM 35.3 7.4 57310 -24.6163 150.4536 WASHPOOL GULLY ALLUVIUM 24 7.1 47247 -24.9667 150.1261 WASHPOOL GULLY ALLUVIUM COND 2570 1 6.9 62923 -24.4732 150.5177 WASHPOOL GULLY ALLUVIUM 0.6 6.8 57737 -24.5487 150.4297 WASHPOOL GULLY ALLUVIUM 1.3 6.4 35626 -24.538 150.428 WASHPOOL GULLY ALLUVIUM 0.6 6.1 47520 -24.282 150.4435 WASHPOOL GULLY ALLUVIUM 20 6.1 34010 -24.4062 150.4297 WASHPOOL GULLY ALLUVIUM 0.6 2.4
Underground Water Impact Report - ATP 602 17

Appendix B - Summary of laboratory results for registered bores sampled in January and September 2013
Underground Water Impact Report - ATP 602 8-1

Appendix B: Analytical Results ‐ Inorganics GasesClient: Harcourt Petroluem
Project: Harcourt Petroluem N. L. UWIR
Description
ANZECC 2000A
Freshwater 95% *
ANZECC 2000
Agriculture Irrigation
ANZECC 2000
Livestock
NHMRC 2011B
Drinking Water
Guidelines - Health
NHMRC 2011
Drinking Water
Guidelines - Aesthetic
Reference 84478 84253 84479 84477 84477 84477 84322 84321 84479 84477 84477Sample 128169A 128284C 128587 128636A 128636B 13030385 13030394A 13030823 13030830 9239 47605BDate 14/01/2013 15/01/2013 18/01/2013 17/01/2013 17/01/2013 17/01/2013 16/01/2013 16/01/2013 18/01/2013 17/01/2013 17/01/2013
PQL UnitsInorganicsCalcium - Dissolved 0.5 mg/L 1000 19 77 50 130 77 77 60 450 360 15 85Potassium - Dissolved 0.5 mg/L 2.8 2.7 5.3 4 10 13 1.6 6.1 60 18 6.1Sodium - Dissolved 0.5 mg/L 230 20 180 400 170 160 320 38 170 290 1400 4500 54 120Magnesium - Dissolved 0.5 mg/L 7.2 28 14 61 22 38 45 52 570 8.9 39Hydroxide Alkalinity (OH-) as CaCO3 5 mg/L <5 <5 <5 <5 <5 <5 <5 <5 <5 <5 <5Bicarbonate Alkalinity as CaCO3 5 mg/L 680 460 310 440 53 370 500 390 400 480 390Carbonate Alkalinity as CaCO3 5 mg/L <5 <5 <5 <5 <5 <5 <5 <5 <5 <5 <5Total Alkalinity as CaCO3 5 mg/L 680 460 310 440 53 370 500 390 400 480 390Sulphate, SO4 1 mg/L 1000 500 250 <1 12 15 51 <1 <1 26 65 76 <1 2Chloride, Cl 1 mg/L 350 240 140 140 550 250 320 380 3400 10000 12 240Ionic Balance % -3.8 -0.08 0.72 0.55 -2.5 -5.1 -3.7 -8.1 -5.3 -40 -6.8Total Dissolved Solids 5 mg/L 600 1200 730 660 1400 740 870 1100 7800 18000 300 820pH pH Units 7 - 8.5 6.5 - 8.6 7.7 - 7.4 - - - - 6.9 8.1 - -Electrical Conductivity 1 µS/cm 1900 - 1100 - - - - 10000 26000 - -Ammonia as N in water 0.005 mg/L 0.9 0.5 0.64 0.073 - 0.074 2.1 14 0.018 0.63 - 76 17Nitrate as N in water 0.005 mg/L 0.7 339 50 <0.005 0.007 - 0.092 <0.005 <0.005 0.24 <0.005 - <0.005 <0.005Nitrite as N in water 0.005 mg/L <0.005 0.007 - <0.005 <0.005 <0.005 0.024 <0.005 - <0.005 <0.005TKN in water 0.1 mg/L 0.7 0.2 - 0.3 2.3 15 0.2 0.7 - 68 18GasesCarbon Dioxide CO2 0 mg/L 24 - 23 - - - - 47 7.2 - -Sulphide 0.5 mg/L <0.5 - <0.5 - - - - <0.5 <0.5 - -Methane 5 µg/L 14000 - <5 - - - - 34 <5 - -Notes:
B: National Health and Medical Research Council (NHMRC) 2011. National Water Quality Management Strategy: Australian Drinking Water Guidelines 6.
A: Australia and New Zealand Environment Conservation Council and Agriculture Resource Management Council of Australia and New Zealand (ANZECC/ARMCANZ) 2000. Australia and New Zealand Guidelines for Fresh and Marine Water Quality, October, 2000

Appendix B: Analytical Results ‐ Inorganics GasesClient: Harcourt Petroluem
Project: Harcourt Petroluem N. L. UWIR
Description
ANZECC 2000A
Freshwater 95% *
ANZECC 2000 Agriculture Irrigation
ANZECC 2000 Livestock
NHMRC 2011B
Drinking Water
Guidelines - Health
NHMRC 2011 Drinking
Water Guidelines -
Aesthetic
Reference 84477 84187 84187 84253 84253 84253 84253Sample 47605D 84914 84915A 89509-12 89509-13 89509-15A 89509-16Date 17/01/2013 14/01/2013 14/01/2013 15/01/2013 15/01/2013 15/01/2013 15/01/2013
PQL UnitsInorganicsCalcium - Dissolved 0.5 mg/L 1000 97 27 53 66 67 53 74Potassium - Dissolved 0.5 mg/L 0.8 3.7 4.3 1.2 2.9 2.1 3.1Sodium - Dissolved 0.5 mg/L 230 20 180 87 310 570 120 65 59 170Magnesium - Dissolved 0.5 mg/L 44 19 46 33 24 19 59Hydroxide Alkalinity (OH-) as CaCO3 5 mg/L <5 <5 <5 <5 <5 <5 <5Bicarbonate Alkalinity as CaCO3 5 mg/L 350 400 750 310 360 270 640Carbonate Alkalinity as CaCO3 5 mg/L <5 <5 <5 <5 <5 <5 <5Total Alkalinity as CaCO3 5 mg/L 350 400 750 310 360 270 640Sulphate, SO4 1 mg/L 1000 500 250 46 8 81 14 10 5 12Chloride, Cl 1 mg/L 350 170 270 370 180 39 51 140Ionic Balance % -2.4 2.9 7.4 -1.6 -1.6 -0.74 -2.5Total Dissolved Solids 5 mg/L 600 770 800 1300 630 470 380 830pH pH Units 7 - 8.5 6.5 - 8.6 - 7.6 7.3 - - - -Electrical Conductivity 1 µS/cm - 1500 2500 - - - -Ammonia as N in water 0.005 mg/L 0.9 0.5 <0.005 - - <0.005 0.029 0.079 2.7Nitrate as N in water 0.005 mg/L 0.7 339 50 0.38 - - 0.8 <0.005 0.007 <0.005Nitrite as N in water 0.005 mg/L <0.005 - - <0.005 <0.005 <0.005 <0.005TKN in water 0.1 mg/L 0.2 - - 0.2 0.2 <0.1 3.5GasesCarbon Dioxide CO2 0 mg/L - 21 70 - - - -Sulphide 0.5 mg/L - <0.5 1.7 - - - -Methane 5 µg/L - 1900 2600 - - - -Notes:
B: National Health and Medical Research Council (NHMRC) 2011. National Water Quality Management Strategy: Australian Drinking Water Guidelines 6.
A: Australia and New Zealand Environment Conservation Council and Agriculture Resource Management Council of Australia and New Zealand (ANZECC/ARMCANZ) 2000. Australia and New Zealand Guidelines for Fresh and Marine Water Quality, October, 2000

Appendix B: Analytical Results ‐ Field Parameters, Total Dissolved MetalsClient: Harcourt Petroluem
Project: Harcourt Petroluem N. L. UWIR
Description
ANZECC 2000A
Freshwater 95%
ANZECC 2000
Agriculture Irrigation
ANZECC 2000
Livestock
NHMRC 2011B
Drinking Water
Guidelines - Health
NHMRC 2011
Drinking Water
Guidelines - Aesthetic
Reference 84478 84253 84479 84477 84477 84477 84322 84321 84479 84477Sample 128169A 128284C 128587 128636A 128636B 13030385 13030394A 13030823 13030830 9239Date 14/01/2013 15/01/2013 18/01/2013 17/01/2013 17/01/2013 17/01/2013 16/01/2013 16/01/2013 18/01/2013 17/01/2013
PQL UnitsField ParametersConductivity (uS/cm) 1781 1154 992 2368 962 1482 1240 9451 25978 4.6Specific Conductance (uS/cm) ‐ ‐ ‐ ‐ 945 1492 1284 9349 ‐ 4.3Dissolved Oxygen (mg/L) 1.43 1.62 4.15 3.28 0.16 0.54 1.34 1.49 7.65 2.47ORP (mV) ‐111.3 ‐146.3 ‐32.3 ‐14.3 -224.8 -203.3 -53.4 -86.1 -87.4 -78.3pH 7.52 6.87 7.45 6.66 7.01 7.19 6.89 6.76 7.67 7.97Temperature (oC) 25.2 24.8 26.1 24.1 26 24.6 23.2 25.6 27.2 28.3Metals DisolvedArsenic-Dissolved 1 µg/L 24 100 500 10 <1 <1 <1 <1 1 1 1 5 1 <1Cadmium-Dissolved 0.1 µg/L 0.2 10 10 2 <0.1 <0.1 <0.1 <0.1 <0.1 <0.1 <0.1 <0.1 <0.1 <0.1Chromium-Dissolved 1 µg/L 100 1000 50 <1 <1 <1 <1 <1 <1 <1 <1 <1 <1Copper-Dissolved 1 µg/L 1.4 200 400 2000 1000 2 4 2 2 <1 <1 <1 2 2 1Lead-Dissolved 1 µg/L 3.4 2000 100 10 <1 <1 <1 <1 <1 <1 <1 <1 <1 <1Mercury-Dissolved 0.05 µg/L 0.6 2 2 1 <0.05 <0.05 <0.05 <0.05 <0.05 <0.05 <0.05 <0.05 <0.05 <0.05Nickel-Dissolved 1 µg/L 11 200 1000 20 <1 <1 <1 <1 <1 <1 <1 3 8 2Zinc-Dissolved 1 µg/L 8 2000 20000 3000 5 8 6 17 7 3 <1 25 39 6Aluminium-Dissolved 10 µg/L 55 5000 5000 100 <10 - <10 - - - - 10 <10 -Iron-Dissolved 10 µg/L 200 300 170 - <10 - - - - 2000 53 -Beryllium-Dissolved 0.5 µg/L 100 60 <0.5 - <0.5 - - - - <0.5 <0.5 -Barium-Dissolved 1 µg/L 2000 280 - 150 - - - - 1200 400 -Boron-Dissolved 5 µg/L 370 500 5000 4000 320 - 68 - - - - 190 1200 -Cobalt-Dissolved 1 µg/L 50 1000 <1 - <1 - - - - 2 3 -Manganese-Dissolved 5 µg/L 1900 200 500 100 16 - <5 - - - - 1500 660 -Molybdenum-Dissolved 1 µg/L <1 - <1 - - - - <1 <1 -Selenium-Dissolved 1 µg/L <1 - 2 - - - - <1 <1 -Uranium-Dissolved 0.5 µg/L <0.5 - 1 - - - - 2.1 2.8 -Vanadium-Dissolved 1 µg/L 6 100 <1 - 4 - - - - <1 <1 -Metals TotalArsenic-Total 1 µg/L 24 100 10 - <1 - <1 3 2 <1 - - <1Cadmium-Total 0.1 µg/L 0.2 10 2 - <0.1 - <0.1 <0.1 <0.1 <0.1 - - <0.1Chromium-Total 1 µg/L 100 50 - <1 - <1 1 <1 <1 - - <1Copper-Total 1 µg/L 1.4 200 2000 - <1 - <1 2 2 1 - - 6Lead-Total 1 µg/L 3.4 2000 10 - <1 - <1 1 5 <1 - - <1Mercury-Total 0.05 µg/L 0.6 2 1 - <0.05 - <0.05 <0.05 <0.05 <0.05 - - <0.05Nickel-Total 1 µg/L 11 200 20 - <1 - <1 2 1 <1 - - 3Zinc-Total 5 µg/L 8 2000 - 3 - 11 14 13 3 - - 15Notes:
B: National Health and Medical Research Council (NHMRC) 2011. National Water Quality Management Strategy: Australian Drinking Water Guidelines 6.
A: Australia and New Zealand Environment Conservation Council and Agriculture Resource Management Council of Australia and New Zealand (ANZECC/ARMCANZ) 2000. Australia and New Zealand Guidelines for Fresh and Marine Water Quality, October, 2000
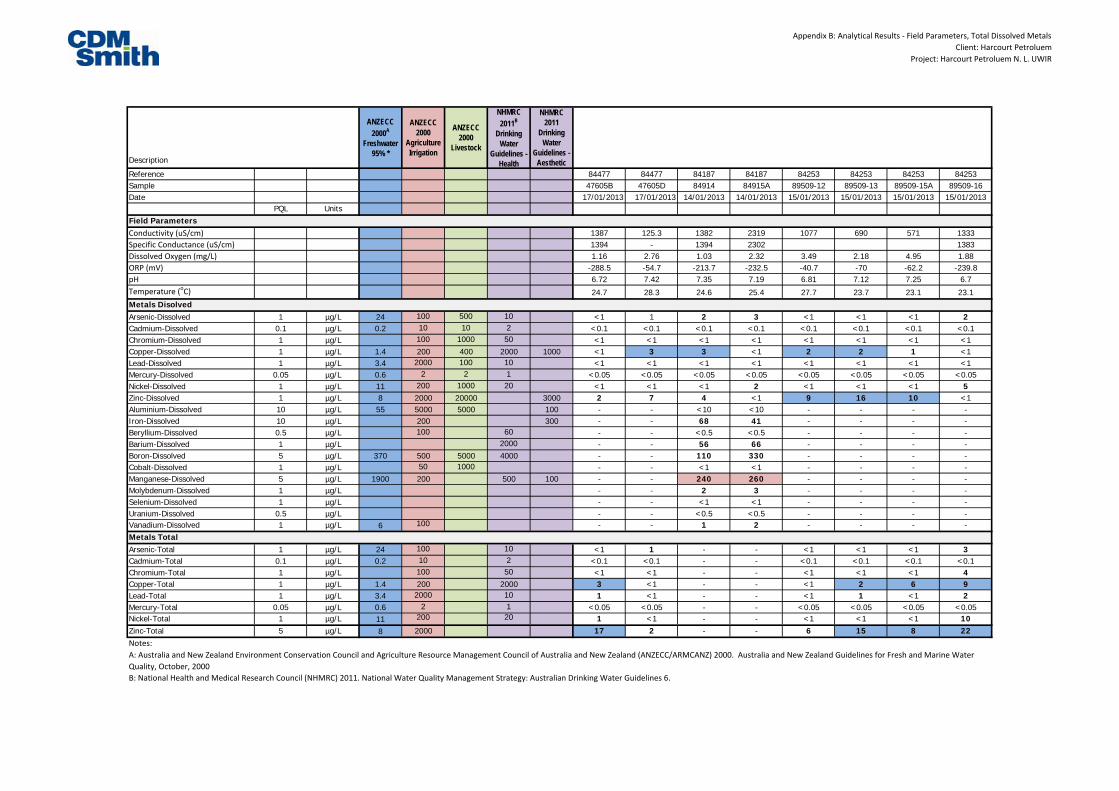
Appendix B: Analytical Results ‐ Field Parameters, Total Dissolved MetalsClient: Harcourt Petroluem
Project: Harcourt Petroluem N. L. UWIR
Description
ANZECC 2000A
Freshwater 95% *
ANZECC 2000
Agriculture Irrigation
ANZECC 2000
Livestock
NHMRC 2011B
Drinking Water
Guidelines - Health
NHMRC 2011
Drinking Water
Guidelines - Aesthetic
Reference 84477 84477 84187 84187 84253 84253 84253 84253Sample 47605B 47605D 84914 84915A 89509-12 89509-13 89509-15A 89509-16Date 17/01/2013 17/01/2013 14/01/2013 14/01/2013 15/01/2013 15/01/2013 15/01/2013 15/01/2013
PQL UnitsField ParametersConductivity (uS/cm) 1387 125.3 1382 2319 1077 690 571 1333Specific Conductance (uS/cm) 1394 - 1394 2302 1383Dissolved Oxygen (mg/L) 1.16 2.76 1.03 2.32 3.49 2.18 4.95 1.88ORP (mV) -288.5 -54.7 -213.7 -232.5 -40.7 -70 -62.2 -239.8pH 6.72 7.42 7.35 7.19 6.81 7.12 7.25 6.7Temperature (oC) 24.7 28.3 24.6 25.4 27.7 23.7 23.1 23.1Metals DisolvedArsenic-Dissolved 1 µg/L 24 100 500 10 <1 1 2 3 <1 <1 <1 2Cadmium-Dissolved 0.1 µg/L 0.2 10 10 2 <0.1 <0.1 <0.1 <0.1 <0.1 <0.1 <0.1 <0.1Chromium-Dissolved 1 µg/L 100 1000 50 <1 <1 <1 <1 <1 <1 <1 <1Copper-Dissolved 1 µg/L 1.4 200 400 2000 1000 <1 3 3 <1 2 2 1 <1Lead-Dissolved 1 µg/L 3.4 2000 100 10 <1 <1 <1 <1 <1 <1 <1 <1Mercury-Dissolved 0.05 µg/L 0.6 2 2 1 <0.05 <0.05 <0.05 <0.05 <0.05 <0.05 <0.05 <0.05Nickel-Dissolved 1 µg/L 11 200 1000 20 <1 <1 <1 2 <1 <1 <1 5Zinc-Dissolved 1 µg/L 8 2000 20000 3000 2 7 4 <1 9 16 10 <1Aluminium-Dissolved 10 µg/L 55 5000 5000 100 - - <10 <10 - - - -Iron-Dissolved 10 µg/L 200 300 - - 68 41 - - - -Beryllium-Dissolved 0.5 µg/L 100 60 - - <0.5 <0.5 - - - -Barium-Dissolved 1 µg/L 2000 - - 56 66 - - - -Boron-Dissolved 5 µg/L 370 500 5000 4000 - - 110 330 - - - -Cobalt-Dissolved 1 µg/L 50 1000 - - <1 <1 - - - -Manganese-Dissolved 5 µg/L 1900 200 500 100 - - 240 260 - - - -Molybdenum-Dissolved 1 µg/L - - 2 3 - - - -Selenium-Dissolved 1 µg/L - - <1 <1 - - - -Uranium-Dissolved 0.5 µg/L - - <0.5 <0.5 - - - -Vanadium-Dissolved 1 µg/L 6 100 - - 1 2 - - - -Metals TotalArsenic-Total 1 µg/L 24 100 10 <1 1 - - <1 <1 <1 3Cadmium-Total 0.1 µg/L 0.2 10 2 <0.1 <0.1 - - <0.1 <0.1 <0.1 <0.1Chromium-Total 1 µg/L 100 50 <1 <1 - - <1 <1 <1 4Copper-Total 1 µg/L 1.4 200 2000 3 <1 - - <1 2 6 9Lead-Total 1 µg/L 3.4 2000 10 1 <1 - - <1 1 <1 2Mercury-Total 0.05 µg/L 0.6 2 1 <0.05 <0.05 - - <0.05 <0.05 <0.05 <0.05Nickel-Total 1 µg/L 11 200 20 1 <1 - - <1 <1 <1 10Zinc-Total 5 µg/L 8 2000 17 2 - - 6 15 8 22Notes:
B: National Health and Medical Research Council (NHMRC) 2011. National Water Quality Management Strategy: Australian Drinking Water Guidelines 6.
A: Australia and New Zealand Environment Conservation Council and Agriculture Resource Management Council of Australia and New Zealand (ANZECC/ARMCANZ) 2000. Australia and New Zealand Guidelines for Fresh and Marine Water Quality, October, 2000

Table T1: Laboratory Results Client: Harcourt Petroluem N.L.
Project: ATP564 602 Groundwater Baseline Assessment ‐ Phase 2 3
ATP602 ATP602 ATP602 ATP602 ATP602 ATP564 ATP602
Park 02 Park 06 Park 04 13030823 Park 01 Undi 02 Hill 02
41535 41535 41535 41533 41534 41533 41534
97658‐1 97658‐2 97658‐3 97658‐4 97658‐5 97658‐6 97658‐7
water water water water water water water
LOR
Units
ANZECC
200
0 Freshw
ater 95%
*
ANZECC
200
0 Ag
riculture Irrig
ation2
ANZECC
200
0 Livestock
NHMRC
201
1 DWG ‐
Health
NHMRC
201
1 DrW
G ‐
Aesthe
tic
Aluminium – Dissolved
10 µg/L 55 5000 5000 100 <10 <10 <10 <10 <10 30 20
Arsenic – Dissolved
1 µg/L 24 100 500 10 2 <1 <1 3 <1 <1 <1
Barium – Dissolved
1 µg/L 2000 130 210 610 1200 610 370 340
Beryllium – Dissolved
0.5 µg/L 100 60 <0.5 <0.5 <0.5 <0.5 <0.5 <0.5 <0.5
Boron – Dissolved
5 µg/L 370 500 5000 4000 270 530 760 180 1000 96 410
Cadmium – Dissolved
0.1 µg/L 0.2 10 10 2 <0.1 <0.1 <0.1 <0.1 <0.1 <0.1 <0.1
Chromium – Dissolved
1 µg/L 3.3‐LR 100 1000 50 <1 <1 <1 <1 <1 <1 <1
Cobalt – Dissolved
1 µg/L 30‐MR 50 1000 <1 <1 <1 2 <1 7 1
Copper – Dissolved
1 µg/L 1.4 200 400 2000 1000 <1 <1 <1 3 <1 4 1
Iron – Dissolved 10 µg/L 300 200 300 23000 250 95 510 620 1300000 300
Lead – Dissolved 1 µg/L 3.4 2000 100 10 <1 <1 <1 1 <1 <1 <1
Manganese – Dissolved
5 µg/L 1900 200 500 100 170 14 210 1600 270 26000 330
Mercury – Dissolved
0.05 µg/L 0.6 2 2 1 <0.05 <0.05 <0.05 <0.05 <0.05 <0.05 <0.05
Molybdenum – Dissolved
1 µg/L 34‐LR 10 150 0.05 2 2 <1 4 <1 <1 13
Nickel – Dissolved
1 µg/L 11 200 1000 20 2 <1 4 23 15 4 5
Selenium – Dissolved
1 µg/L 11‐MR 20 20 10 <1 <1 <1 <1 <1 <1 <1
Uranium – Dissolved
0.5 µg/L 0.5 10 200 17 <0.5 0.6 <0.5 1 <0.5 <0.5 <0.5
Vanadium‐Dissolved
1 µg/L 10 <1 <1 <1 <1 <1 <1 <1
Zinc‐Dissolved 1 µg/L 8 2000 3000 15 9 5 55 5 44 24
Aluminium‐Total 10 µg/L 55 5000 5000 100 70 120 1100 4000 2600 90 480
Arsenic‐Total 1 µg/L 24 100 500 10 2 <1 3 9 2 <1 2
Barium‐Total 1 µg/L 2000 140 230 740 1300 740 380 370
Beryllium‐Total 0.5 µg/L 100 60 <0.5 <0.5 <0.5 <0.5 <0.5 <0.5 <0.5
Boron‐Total 5 µg/L 370 500 5000 4000 260 490 820 180 960 110 390
Cadmium‐Total 0.1 µg/L 0.2 10 10 2 <0.1 <0.1 0.3 <0.1 <0.1 <0.1 <0.1
Chromium‐Total 1 µg/L 3.3‐LR 100 1000 50 <1 <1 2 21 3 3 1
Cobalt‐Total 1 µg/L 30‐MR 50 1000 <1 <1 2 6 1 8 <1
Copper‐Total 1 µg/L 1.4 200 400 2000 1000 6 50 6 13 5 11 15
Iron‐Total 10 µg/L 300 200 300 42000 2700 3200 6900 5600 1290000 1300
Lead‐Total 1 µg/L 3.4 2000 100 10 13 2 10 170 3 2 2
Manganese‐Total
5 µg/L 1900 200 500 100 250 16 260 1900 310 25000 350
Mercury‐Total 0.05 µg/L 0.6 2 2 1 <0.05 <0.05 <0.05 <0.05 [NT] <0.05 <0.05
Molybdenum‐Total
1 µg/L 34‐LR 10 150 0.05 2 2 <1 4 <1 <1 13
Nickel‐Total 1 µg/L 11 200 1000 20 2 <1 6 39 16 5 6
Selenium‐Total 1 µg/L 11‐MR 20 20 10 <1 <1 <1 <1 <1 <1 <1
Uranium‐Total 0.5 µg/L 0.5 10 200 17 <0.5 0.6 <0.5 1.2 <0.5 <0.5 <0.5
Vanadium‐Total 1 µg/L 10 <1 4 4 16 8 <1 2
Zinc‐Total 1 µg/L 8 2000 20000 3000 130 110 470 82 110 41 93
Notes:LOR ‐ Limit of Reporting‐ Not Analysed* ‐ LOR exceeds the guidelineLR ‐ Low ReliabilityMR ‐ Moderate reliabilityµg/L‐ Micrograms per Litremg/L ‐ Milligrams per litre2 ‐ Low trigger values in irrigation water (long‐term use)
Analyte
Sample Location
Sample I.D
Sample Date
Sample Batch
Sample Type
Metals
Page 1 of 2

Table T1: Laboratory Results Client: Harcourt Petroluem N.L.
Project: ATP564 602 Groundwater Baseline Assessment ‐ Phase 2 3
ATP602 ATP602 ATP602 ATP602 ATP602 ATP564 ATP602
Park 02 Park 06 Park 04 13030823 Park 01 Undi 02 Hill 02
41535 41535 41535 41533 41534 41533 41534
97658‐1 97658‐2 97658‐3 97658‐4 97658‐5 97658‐6 97658‐7
water water water water water water water
LOR
Units
ANZECC
200
0 Freshw
ater 95%
*
ANZECC
200
0 Ag
riculture Irrig
ation2
ANZECC
200
0 Livestock
NHMRC
201
1 DWG ‐
Health
NHMRC
201
1 DrW
G ‐
Aesthe
tic
Analyte
Sample Location
Sample I.D
Sample Date
Sample Batch
Sample Type
Chloride Cl 1 mg/L 350 310 140 570 4000 390 5300 1100
Sulphate SO4 1 mg/L 1000 500 250 60 36 7 47 1 1 <1
Sulphide 0.5 mg/L 0.5 <0.5 0.9 <0.5 <0.5 3.7 <0.5
Calcium 0.5 mg/L 1000 76 39 26 450 30 200 54
Magnesium 0.5 mg/L 33 26 4.3 37 4.3 91 2.8
Sodium 0.5 mg/L 230 20 180 180 220 610 1600 560 2000 870
Potassium 0.5 mg/L 15 7.3 2.5 6.4 2.2 7 4.2
Hydroxide Alkalinity (OH‐)
5 mg/L <5 <5 <5 <5 <5 <5 <5
Carbonate Alkalinity (CaCO3)
5 mg/L <5 <5 <5 <5 <5 <5 <5
Bicarbonate Alkalinity (CaCO3)
5 mg/L 300 480 630 300 810 <5 540
Total Alkalinity as CaCO3
5 mg/L 300 480 630 300 810 <5 540
Ionic Balance % ‐4.3 ‐2.2 ‐1.1 ‐10 ‐2.3 ‐18 ‐2.6
pH ‐ Lab pH Units 7.1 7.8 7.7 7.2 7.4 4.2 7.5
Electrical Conductivity ‐
Lab1 µS/cm 1600 1400 2900 10000 2600 15000 4500
Total Dissolved Solids ‐ Lab
5 mg/L 1200 970 810 1600 6300 1500 12000 2200
Methane 5 µg/L 1100 440 2000 40 4700 12000 18000
Carbon Dioxide CO2
mg/l 115 45 60 90 115 >115
2 ‐ Low trigger values in irrigation water (long‐term use)
* ‐ LOR exceeds the guidelineLR ‐ Low ReliabilityMR ‐ Moderate reliabilityµg/L‐ Micrograms per Litremg/L ‐ Milligrams per litre
Notes:LOR ‐ Limit of Reporting‐ Not Analysed
Physical Param
eters
Major Anion
s an
d Ca
tions
Miscellane
ous
Gases
Page 2 of 2

Appendix C – Groundwater impact assessment undertaken for 2013 UWIR Possible changes in groundwater levels in aquifers affected by the extraction of underground water rights in ATP 602 are predicted through the use of a numerical groundwater model. Throughout this analysis, the focus is on aquifers likely to be possibly affected by CSG pumping.
Modelling methodology
MODFLOW-SURFACT model implementation
The numerical groundwater flow model uses MODFLOW-SURFACT (SURFACT) which is developed and maintained by HydroGeoLogic Inc (HydroGeoLogic 1998). SURFACT is based on the MODFLOW code developed by the United States Geological Survey (McDonald and Harbaugh, 1988) and includes several modifications to address recognised limitations of MODFLOW. The modifications include better handling of dry cells, more accurate tracking of the water table and additional robust solvers packages (HydroGeoLogic 1998, Panday and Huyakorn 2008). The requirement of MODFLOW to retain laterally continuous model layers can result in numerous thin and mostly dry cells that can be problematic in areas where the water table extends across multiple layers, particularly in areas of steep topographic gradient. SURFACT is chosen in this study because it is better able to simulate these conditions and provides better numerical stability. All model layers are defined as confined or unconfined depending upon whether the water table lies within each particular model grid cell.
Model domain and grid
The model domain covers a total area of 15,000 km2 and has an active area of 6,403 km2. The model grid comprises 150 rows, 100 columns and 6 layers, giving a total of 90,000 cells (37,994 active cells). The grid is shown regionally in Figure 8-1. The south-western extent of the model domain is bounded by the extent of sub-cropping Jurassic formations and the steeply dipping Mimosa Syncline. The west and northern model extents are placed sufficiently west and north of the proposed CSG pumping area. The eastern model extent is bounded by the Banana Fault and volcanics.
A rectangular model grid, rotated by 6 degrees (anti clockwise) to align with the Basin morphology, is adopted. The model origin is at 769209.6E, 7177873.346N (MGA Zone 55, GDA1994).
Underground Water Impact Report - ATP 602 1

Underground Water Impact Report - ATP 602 • Harcourt Petroleum N.L.
Figure 8-1 Groundwater Model Domain
Underground Water Impact Report - ATP 602 2

Underground Water Impact Report - ATP 602 • Harcourt Petroleum N.L.
A uniform column and row spacing of 1 km is assigned. The model grid discretisation is coarse and is considered commensurate with the current understanding of the site hydrogeology. Refinement of the model grid is not considered warranted at this stage as it would not be expected to increase the confidence level of model predictions without additional site specific data.
Model layers
A 3D hydrogeological model was generated using the Baralaba Coal Measures (BCM) depth, outcrop zones, bore stratigraphy, and nominal dips and thicknesses from the literature. The model is represented by 6 layers in total (Figure 8-2 and Table 8-1). Table 8-3 correlates the model layers and stratigraphy. The extent, top and base of each layer used in the numerical groundwater model has been sourced from the 3D Hydrogeological model. Due to requirements of SURFACT (specifically that model layers are not allowed to be discontinuous) where geological model layers outcrop then disappear, they are continued in the SURFACT model at a thickness of 1 metre and are assigned the parameters of the layer directly below them. Where the BCM outcrops for example, in the SURFACT model it is overlain by model layers that in other areas represent the full thickness of the Kaloola and Gyranda Subgroup. As previously noted, the Clematis Group does not represent a standalone unit within the Bowen Basin, rather a collection of lithologies in a certain area. The Clematis Group is therefore not allocated a model layer of its own, but where the Clematis Group, the Rewan Group and the Moolayember Formation cross into the area designated as "Clematis", they are all allocated the Clematis Group hydraulic parameters.
Figure 8-2 3D model of the ground surface and 6 model layers (base of all layers are presented, the alluvium is directly under the ground surface)
Underground Water Impact Report - ATP 602 3
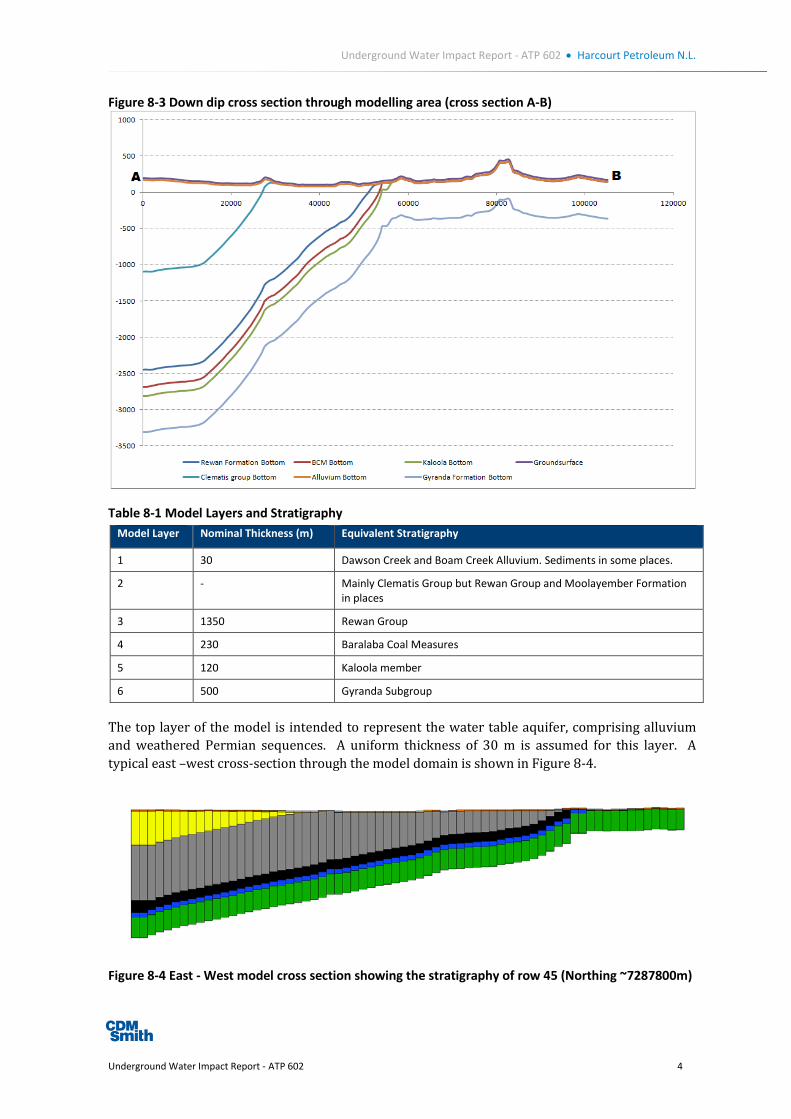
Underground Water Impact Report - ATP 602 • Harcourt Petroleum N.L.
Figure 8-3 Down dip cross section through modelling area (cross section A-B)
Table 8-1 Model Layers and Stratigraphy Model Layer Nominal Thickness (m) Equivalent Stratigraphy
1 30 Dawson Creek and Boam Creek Alluvium. Sediments in some places.
2 - Mainly Clematis Group but Rewan Group and Moolayember Formation in places
3 1350 Rewan Group
4 230 Baralaba Coal Measures
5 120 Kaloola member
6 500 Gyranda Subgroup
The top layer of the model is intended to represent the water table aquifer, comprising alluvium and weathered Permian sequences. A uniform thickness of 30 m is assumed for this layer. A typical east –west cross-section through the model domain is shown in Figure 8-4.
Figure 8-4 East - West model cross section showing the stratigraphy of row 45 (Northing ~7287800m)
Underground Water Impact Report - ATP 602 4

Underground Water Impact Report - ATP 602 • Harcourt Petroleum N.L.
Boundary conditions
A no flow boundary condition is assigned around the perimeter of the model. The use of a no flow boundary is conservative and is considered appropriate given the uncertainty in the site hydrogeology and broader hydrogeology beyond the model domain.
A uniform recharge rate of 18.25 mm/yr is assigned to the area of alluvials defined via regional geology to represent the background rainfall derived recharge. Evapotranspiration (ET) from the water table is simulated with an ET rate of 2 m/yr assigned to the top layer of the model and an extinction depth of 5 m.
Model cells in high elevation areas of Layer 1 (e.g. no aquifers present) are inactivated (no flow). Drain cells have been assigned to model Layer 1 for all the major surface drainages (Figure 8-5). Drain elevation equates to topographic level minus 1 to 7 m (to represent a nominal base of drainage channel). A conductance value of 1000 m2/d has been assigned to drain cells. These drains represent the effect that discharge to shallow surface water bodies (e.g. intermittent creeks and streams) would have on the alluvium.
The implication of the selected boundary conditions is that under a baseline condition all of recharge into the model is balanced by ET and drain flow. Any water removed from simulated production activities will be derived initially from aquifer (and bounding aquitard) storage. The volume of water removed by ET and change will change if the simulated production activities result in drawdown at the water table where the water table lies within the specified ET extinction depth or above the drain base elevation.
Underground Water Impact Report - ATP 602 5

Underground Water Impact Report - ATP 602 • Harcourt Petroleum N.L.
Figure 8-5 Model boundary conditions on Layer 1
Underground Water Impact Report - ATP 602 6
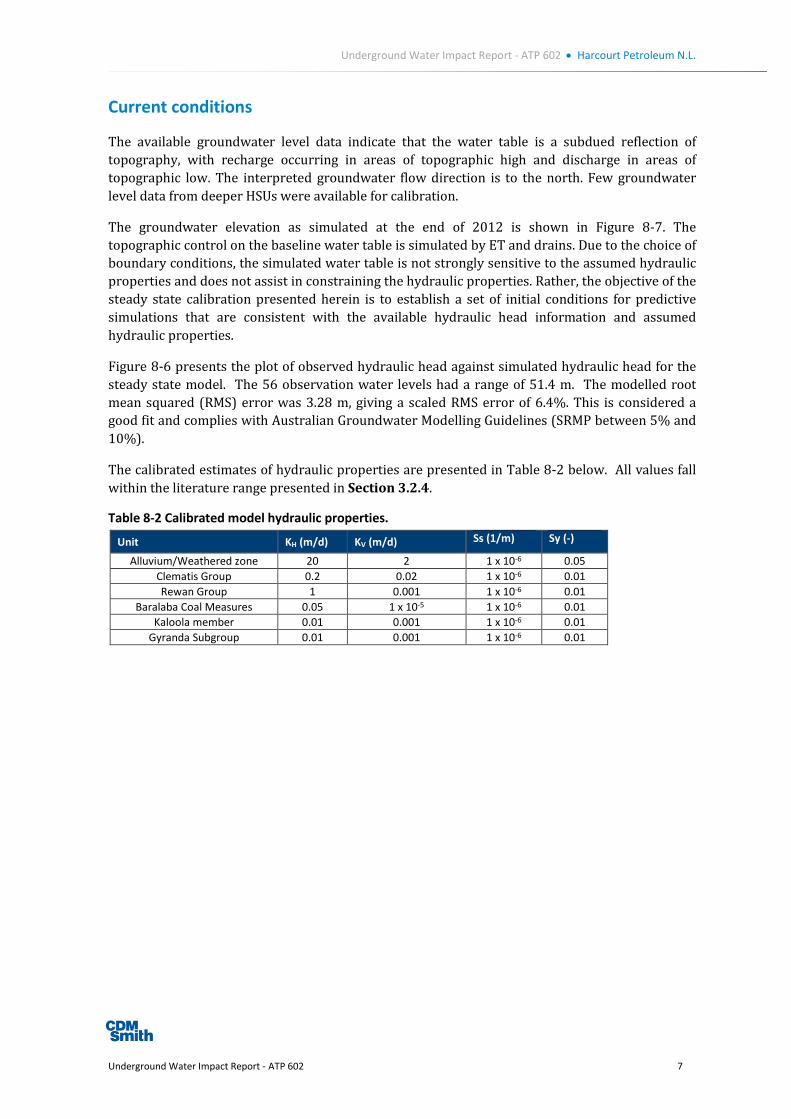
Underground Water Impact Report - ATP 602 • Harcourt Petroleum N.L.
Current conditions
The available groundwater level data indicate that the water table is a subdued reflection of topography, with recharge occurring in areas of topographic high and discharge in areas of topographic low. The interpreted groundwater flow direction is to the north. Few groundwater level data from deeper HSUs were available for calibration.
The groundwater elevation as simulated at the end of 2012 is shown in Figure 8-7. The topographic control on the baseline water table is simulated by ET and drains. Due to the choice of boundary conditions, the simulated water table is not strongly sensitive to the assumed hydraulic properties and does not assist in constraining the hydraulic properties. Rather, the objective of the steady state calibration presented herein is to establish a set of initial conditions for predictive simulations that are consistent with the available hydraulic head information and assumed hydraulic properties.
Figure 8-6 presents the plot of observed hydraulic head against simulated hydraulic head for the steady state model. The 56 observation water levels had a range of 51.4 m. The modelled root mean squared (RMS) error was 3.28 m, giving a scaled RMS error of 6.4%. This is considered a good fit and complies with Australian Groundwater Modelling Guidelines (SRMP between 5% and 10%).
The calibrated estimates of hydraulic properties are presented in Table 8-2 below. All values fall within the literature range presented in Section 3.2.4.
Table 8-2 Calibrated model hydraulic properties.
Unit KH (m/d) KV (m/d) Ss (1/m) Sy (-)
Alluvium/Weathered zone 20 2 1 x 10⁻⁶ 0.05 Clematis Group 0.2 0.02 1 x 10⁻⁶ 0.01 Rewan Group 1 0.001 1 x 10⁻⁶ 0.01
Baralaba Coal Measures 0.05 1 x 10⁻⁵ 1 x 10⁻⁶ 0.01 Kaloola member 0.01 0.001 1 x 10⁻⁶ 0.01
Gyranda Subgroup 0.01 0.001 1 x 10⁻⁶ 0.01
Underground Water Impact Report - ATP 602 7
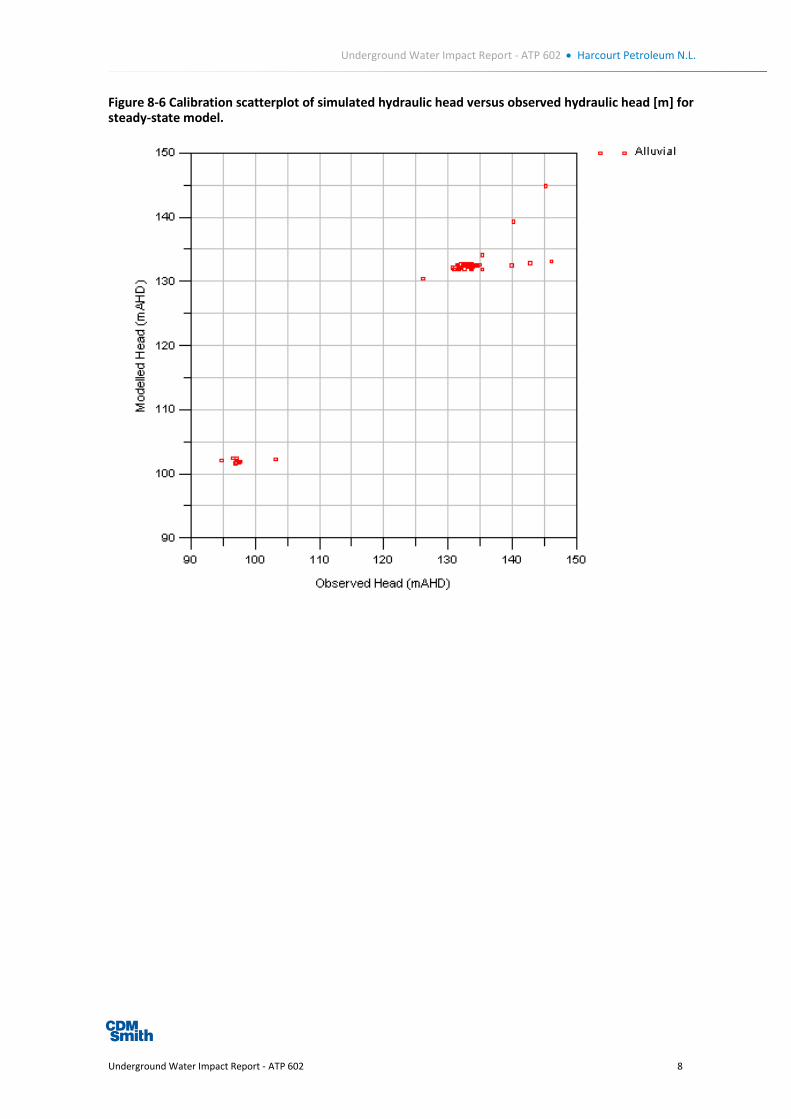
Underground Water Impact Report - ATP 602 • Harcourt Petroleum N.L.
Figure 8-6 Calibration scatterplot of simulated hydraulic head versus observed hydraulic head [m] for steady-state model.
Underground Water Impact Report - ATP 602 8

Underground Water Impact Report - ATP 602 • Harcourt Petroleum N.L.
Figure 8-7 Simulated water table at end of 2012.
Underground Water Impact Report - ATP 602 9

Underground Water Impact Report - ATP 602 • Harcourt Petroleum N.L.
Prediction methodology
The predictive simulations consider the potential impacts to groundwater due to the proposed production program. The production program will draw down the water levels within the targeted coal seams and bounding HSUs. Possible pathways of drawdown impacts to the water table include lateral flow via coal seams and vertical flow via overburden.
The water production from gas wells is simulated using SURFACT’s WELL package by prescribing the production rate. The simulated CSG pumping produces water screened from the Baralaba Coal Measures (model layer 4) for a period of 3 years after which the pumping is switched off and the model run for a further 40 years. The production schedule modelled is detailed in Table 8-3 and Table 8-4 with the location of CSG wells shown in Figure 8-8. Due to proximity of ATP 564P tenement, and the knowledge of proposed pumping rates over the next three years, this information was also included in the groundwater model.
Table 8-3 ATP 602 predicted water production schedule
Bore Phase Number of Pumping wells
Year 1 Pumping rates (kL/day)
Year 2 Pumping rates (kL/day)
Year 3 Pumping rates (kL/day)
ATP 602 Year 1 4 0 7.1 7.4 ATP 602 Year 2 5 0 7.1 7.4 ATP 602 Year 3 6 0 0 7.4
All Phases 14 0 63.6 111.3
Table 8-4 ATP564P predicted water production schedule
Bore Phase Number of Pumping wells
Year 1 Pumping rates (kL/day)
Year 2 Pumping rates (kL/day)
Year 3 Pumping rates (kL/day)
ATP564 Year 1 4 15.9 12.7 9.1 ATP564 Year 2 6 0 12.7 9.1 ATP564 Year 3 4 0 0 9.1
All Phases 14 63.6 127.2 127.2
It is acknowledged that the current generation of regional groundwater flow models, including this model, are not capable of simulating localised drawdown at production wells and the associated two-phase flow of water and gas in the near-area of the wells. The implication of neglecting two phase flow is that drawdown at the wells is likely to be underestimated. The assessment of localised two-phase flow effect is beyond the scope of this Project and is not considered warranted for the purpose of assessing the regional scale impact to groundwater due to the proposed production program. Additionally it is acknowledged that the Baralaba Coal Measures is a sequence of coal seams and interburden units and that by combining coal seams and interburden into a single hydrostratagraphic unit the predicted drawdown will be an average drawdown across the entire unit. In reality, the drawdown may vary vertically throughout the BCM. However, given the proposed production schedule the inclusion of individual coal seams is not considered warranted.
Groundwater impact affected areas
Predicted water level decline maps
The Water Act defines the trigger threshold in the water level decline as 5 metres for a consolidated aquifer and 2 metres for an unconsolidated aquifer. In the groundwater model, the Quaternary Alluvium in layer 1 is defined as unconsolidated. All other aquifer layers are classified as consolidated. The results are divided in two categories: the Immediately Affected Area and the Long Term Affected Area. The Immediate Affected Area shows the impacted zones during the first
Underground Water Impact Report - ATP 602 10

Underground Water Impact Report - ATP 602 • Harcourt Petroleum N.L.
three years following the report consultation (2014 to 2016). The Long Term Affected Area shows the impacted zones at any time following the three year period.
Immediately Affected Area maps and bores
The maximum drawdown occurs within the Baralaba Coal Measures at the end of 3 years production. This drawdown is shown in Figure 8-8. Note that the drawdown shown to the north of ATP 602 occurs as a result of pumping from the ATP 564P area that was simultaneously simulated in this model prediction. The simulated maximum drawdown within the BCM is 1.6 m. Hence, there are no areas that exceed the 5 m threshold for consolidated aquifers. Similarly, no areas exceed the 2 m threshold for drawdown in the unconsolidated aquifer in layer 1.
The model prediction is that no bores will be affected within 3 years.
Long term Affected Area
After the cessation of CSG pumping the simulated maximum drawdown within the BCM reduces to less than 1 m within a few months and zero drawdown is predicted within the alluvial aquifer. Hence, there are predicted to be no long term affected areas that exceed the 5 m threshold for consolidated aquifers or the 2 m threshold for unconsolidated aquifers.
Uncertainty analysis
Given the relatively small volumes of water to be produced and the minimal drawdown impacts predicted by the calibrated model a detailed predictive uncertainty analysis (Doherty, 2003) is not warranted.
Underground Water Impact Report - ATP 602 11

Underground Water Impact Report - ATP 602 • Harcourt Petroleum N.L.
Figure 8-8 Simulated drawdown in the Baralaba Coal Measures at the end of 3 years CSG pumping.
Underground Water Impact Report - ATP 602 12
Underground Water Impact Report - ATP 602 • Harcourt Petroleum N.L.
Key findings and review procedures This report identifies areas which are Immediately Affected and Long Term Affected by predicting drawdowns above the trigger levels, caused by underground water extraction.
Groundwater modelling using the best available information predicts that there will be no Immediate or Long Term Affected Areas at ATP 602 in the coal seams where extraction takes place or in the overlying Alluvium aquifer.
These findings depend upon several documents and data sources and will be reviewed on an annual basis to maintain accuracy of the maps. Reviews are particularly important whenever the modelling assumptions or data change significantly. A model review will be performed annually whenever new information that is likely to appreciably impact model results is available. Information which may fall under this category includes:
geological structural information, e.g. from drill holes or geophysical surveys, which may modify aquifer extents;
hydrogeological parameters, e.g. from pressure testing or core geophysical analysis, which may modify model parameters and affect aquifer connectivity;
planned groundwater operations, including projected CSG water extraction rates;
calibration data, e.g. pressure heads from new monitoring wells; and
unexpected results from monitoring locations, where impacts do not correspond to predictions.
After a model update, new maps will be developed for assessing the Immediately Affected and Long Term Affected Areas. Reporting is further described in Section 6.
Underground Water Impact Report - ATP 602 13

Appendix D - UWIR Groundwater Monitoring Checklist The following checklist will be completed at each monitoring episode.
Task
Verify monitoring completed as required
1 All monitored bores intact? Y/N
If boreholes damaged amend registered details
2 All monitoring completed according to schedule Y/N
If monitoring incomplete commission additional monitoring as required
Review monitoring data
3 Potentially adverse impacts identified?
Compare measured water level to previous monitoring rounds – if either
(a) water level is lower than previous lowest measurement by >5m or
(b) three subsequent monitoring events record a fall in water level >1m then a potential adverse impact has been identified.
Y/N
If potentially adverse impacts identified then:
Advise Environment Manager;
Review operational activities;
If appropriate commission review of data;
Identify any requirement for and implement changes in operation to mitigate adverse impacts.
Checklist Reviewed by Name -
Date -
Underground Water Impact Report - ATP 602 8-1
Underground Water Impact Report - ATP 602 • Harcourt Petroleum N.L.
Appendix E - Submissions Report for UWIR for ATP 602
Underground Water Impact Report - ATP 602 8-2

HARCOURT PETROLEUM N.L.
ACN 055 269 040
ATP602 Underground Water Impact Report
Submissions Response Document

Contents
1. Introduction .................................................................................................................................... 1
1.1. Context of the Project ............................................................................................................. 1
1.2. Submissions Period ................................................................................................................. 1
2. Submissions Received ..................................................................................................................... 1
3. Conclusion ....................................................................................................................................... 2
Appendices
Appendix A ‐ Biloela Central Telegraph Public Notice
Appendix B ‐ ATP602 UWIR Notification Letter Sent to Bore Owners
Appendix C ‐ Submissions Received

ATP602 Underground Water Impact Report – Submissions Response Document Page 1
1. Introduction This report has been prepared to summarise and respond to submissions received in response to the
Draft Underground Water Impact Report (UWIR) for Authority to Prospect (ATP) 602. The Draft UWIR
was prepared in accordance with section 381 and section 382 of the Queensland Water Act 2000
(Water Act).
1.1. Context of the Project
Harcourt Petroleum N.L., as the Operator of Authority to Prospect (ATP) 564, proposes to conduct coal
seam gas production testing and development within ATP 602, located near Moura in Central
Queensland. As per the requirements of the Water Act, a Draft UWIR was prepared to meet the
requirements for the operation of ATP 602. A total of 1 well is proposed to be installed and
commissioned for operation during the next three years.
1.2. Submissions Period
The Draft UWIR was released for public comment from 18 June 2016 until the close of business 15 July
2013.
In accordance with the Water Act, a public notice was published in the Biloela Central Telegraph on
Friday 17 June 2016 (see Appendix A) and on the Biloela Central Telegraph website.
In addition, letters were sent to landowners, identified as an “owner of a water bore within the area
to which the report relates” (Water Act). The purpose of the letter (Appendix B) was to:
notify the bore owner of the public release of the UWIR for ATP 564;
provide details on how to obtain copies of the report;
provide details on how to make a submission on the report; and
welcome any feedback during the public comment period.
Electronic and hard copies of the report were provided to the public upon request, as per the
information in the public notice.
Throughout the public notification period, six (6) electronic copies of the report were requested by
various members of the public.
2. Submissions Received
Throughout the public submission period only one (1) submission was received in response to the
UWIR for ATP 602. The submission was received via email on the 14 July 2016. The submission was
from a landowner whose properties were within the vicinity of the Project area. The full submission
and response can be found in Appendix C

ATP602 Underground Water Impact Report – Submissions Response Document Page 2
3. Conclusion Harcourt Petroleum NL does not consider the one submission made to warrant amendment of the
Draft UWIR for ATP 602 and no changes have been made.
Harcourt Petroleum NL trusts the response above sufficiently address the issues and comments raised
in the submissions provided.
Liaison and communication between Harcourt Petroleum NL and landowners will continue to develop
the understanding of groundwater conditions in and around the project area. Harcourt Petroleum NL’s
baseline assessment of registered and identified unregistered bores is ongoing.

APPENDIX A
www.centraltelegraph.com.au CentralTelegraph | Friday, June 17, 2016 | 25
ValleyFunerals&Cremation ServicesFor 24 hour service
Ph: 4972 0800Specialising in Cremations at theBoyne Tannum Memorial Parklands
Crematorium, Boyne Island6323235ab
SEEKING COMPANION 69 yo Independent Male.Have not had schooling. Good listener, honest. NonDrinker & Non Smoker. Looking for honest woman 65 -70. Enjoys Fishing, BBQ’s, going for coffees and drives.
Contact Bob 0407 624 522.
NOTICE OF INTENTION TO APPLY FOR GRANTAfter 14 days from today an application for a grant ofprobate of the will dated 1 March 2006 of OLIVE MAYDALES late of 24 Mouatt Street, Monto, Queensland andformerly of "Jindah", Moura, Queensland, deceased, willbe made by Clive Thomas Dales and Marie Ruth Frostto the Supreme Court at Rockhampton.
You may object to the grant by lodging a caveat in thatregistry.
Lodged by: Adornato Law - 28 Gladstone Road, BiloelaQLD 4715
NOTICE OF INTENTION TO APPLY FOR GRANTAfter 14 days from today an application for a grantof Probate of the Will dated 15 July 2004 ofGRAHAM DOMINIC CARRIGAN late of PalmGrove, Mungabunda Road, Moura, Queensland,deceased will be made by CATHERINE MARYCARRIGAN to the Supreme Court at Brisbane.
You may object to the grant by lodging a caveatin that registry.Lodged by Edgar & Wood Solicitors of 118Cunningham Street, Dalby, Queensland.
Found
FOUND Something? DID you know that our foundadverts are FREE!! So if you have found someone’s petor personal item, call the Classifieds now and we willhelp you find the owner 1300 136 181.
To advertise, call 1300 136 181 or visitfinda.com.au to view more ads online.
For more information please phone Mr Bernard Tan on 07 3218 6199.
PUBLIC NOTICE Pursuant to Section 382 of the Water Act 2000Release of UNDERGROUND WATER IMPACT REPORT
In accordance with the requirements of section 381 and section 382 ofthe Water Act 2000 (Water Act), Harcourt Petroleum NL has developedan underground water impact report (UWIR) for its operations withinauthority to prospect (ATP) 564 and 602 located north of Moura andsouth of Theodore in Central Queensland.
You have the opportunity to review and comment on these UWIRs.
The reports will be available for public comment from 18 June 2016. Toobtain a copy (electronic or hard copy) please contact Mr Bernard Tan ofHarcourt Petroleum NL on 07 3218 6199.
Written submissions on the UWIR maybe made to Harcourt Petroleum NL andmailed to:GPO Box 848Brisbane Qld 4001Or by [email protected]
6317
985a
a
Your submission must be:• In writing; and• Received by COB on 15 July 2016.
Please note that as required by section382(d) of the Water Act copies of allreceived submissions must be providedto the chief executive. The submissionswill be considered as part of theassessment process for the UWIR.
Banana Shire CouncilPUBLIC NOTICE
Half Yearly Water MeterReadings
Residents are advised that Banana ShireCouncil will be carrying out a systematicinspection program in accordance with theLocal Government Act 2009, of all meteredpremises connected to the water supplyschemes in Banana, Baralaba, Biloela,Callide Dam, Cracow, Goovigen, Moura,Taroom, Thangool, Theodore and Wowan,to record water meter readings.
The water meter reading program willcommence on Monday 13 June 2016 andend on Monday 11 July 2016 and will beconducted between the hours of 6.00amand 5.00pm daily.
Council officers and/or appointed personswith appropriate identification willundertake the water meter readingprogram and may be required to enterproperties to gain access to and read thewater meters. Residents are required torestrain their dogs during this period, andcheck that garden vegetation does notobstruct access to the water meters.
Enquires may be directed to Council’sWater Services Section on (07) 4992 9500.
Ray GeraghtyCHIEF EXECUTIVE OFFICER
Jobs
Media & Advertising
[Opportunities with APN]
MEDIA SALES CONSULTANTThe Observer Gladstone
Job DescriptionA career in multi-mediaWhy not start right here at Gladstone's leadingmedia organization, The Observer.
The CompanyThe Observer is a big part of APN News andMedia Group - a dynamic, diverse andsuccessful company with wide interest inAustralia, New Zealand and Asia. Our 200Newspapers, magazines, radio stations, onlineand outdoor advertising are market leaders.We're upbeat, progressive and growing fast.
The PositionThe position involves multi media advertisingsales in print and online, while servicing theneeds of local businesses. You will also workclosely with clients to achieve and exceedcustomer expectations, maintaining andgrowing a client base whilst actively seeking outnew business opportunities. If you thrive in achallenging role while maintaining the highestlevel of professionalism you will embrace thisgreat opportunity to join our progressiveorganisation.
The ApplicantThe ideal applicant will need to possess thefollowing:• A background of demonstrated achievement
in a sales or related field is highly desirable• A desire to work with clients in achieving their
objectives• A fundamental belief in the value of
advertising• An empathy for customer service and desire
to provide solution and opportunity• Outgoing personality and high level of
communication and negotiation skills bothwritten and oral
• Knowledge of the needs of the market and theability to develop new opportunities
• Current driver's licence• Self motivation and boundless energy• Aptitude for digital media and technological
developments in advertising
The PackageA generous package will be negotiated with thesuccessful applicant including salary plus acommission scheme that rewards performance.
How to ApplyPlease email your application to:[email protected] phone enquiries welcome on07 4970 3021
Applications close on Friday 24th June, 2016.
Gladstone Newspapers is an equal opportunityemployer
Tributes
Death Notices
Funeral Directors & Services
Celebrations, Classes & Events
Friendship & Relationships
Notices
Legal Notices
Notices
Public Notices
Book a Tribute,Public Noticeor Celebration.Call 1300 136 181 orvisit finda.com.au
View Tributes Online.Visit finda.com.au
RecruitingLocals?
Call 1300 967 500or visit finda.com.au
Tenders (Notices)
Banana Shire Council
Preferred Suppliers - Hireof Plant and Equipment
Tender No. T16/17.1Council is seeking tenders to establish aRegister of Preferred Suppliers - Hire ofPlant and Equipment through a Wet Hireand Dry Hire arrangement. This contractwill cover the period from the date that thetender is accepted to 30 June 2017.
The purpose of this contract is to identify apool of suitable suppliers to call upon forIntermittent Hire at various timesthroughout the year. Plant requiredconsists of but is not limited to Graders,Scrapers, Loaders, Dozers, Excavators,Water Trucks, Material Cartage Trucks(all combinations) and CompactionEquipment.
Tenders shall be prepared in accordancewith the conditions of tendering availablefrom Council. The Tender documents areto be received at Banana Shire CouncilAdministration Complex located at 62Valentine Plains Road, Biloela by 11.00amFriday 8th July 2016.
Tender documents are to be downloadedby accessing www.banana.qld.gov.au andregistering your details.
Ray GeraghtyChief Executive OfficerBanana Shire CouncilPO Box 412BILOELA Q 4715
Remember Them.
YOULES, MelvilleOf Biloela.
Passed into God’s care on 12th June 2016.
Aged 50 years
Dearly Loved Husband of Tina. LovedFather of Biddy and Jock.
Family and Friends are respectfully invitedto attend Mel’s Funeral Service at theBiloela Bowls Club, commencing at 1.30pmon Wednesday 22nd June 2016.
CALLIDE DAWSON FUNERALSPHONE: (07) 4992 2332
www.callidedawsonfunerals.com.au

APPENDIX B


APPENDIX C

1
Zoe Stackhouse
From: Harcourt AdminSubject: FW: Copy of report for UWIR for 564 and 602
From: Admin [mailto:[email protected]] Sent: Thursday, 14 July 2016 9:21 AM To: Harcourt Admin <[email protected]> Subject: RE: Copy of report for UWIR for 564 and 602 Hi, We have ascertained that the two properties that are affected by this are called “Hillview” and “Dawson Park”, 230 Birchley’s Road, Isla. We have concerns about the impact on our groundwater and until such time as we fully understand what the effect will be we would like to register our objection to the proposed coal seam gas production testing and development. Along with this we refuse the right for anyone to enter our properties. Regards,
Jim Gorman Noosa Fair Group | Level 14, 46 Edward Street, Brisbane QLD 4000 | P: 07 3211 1102 | F: 07 3211 1103 E: [email protected]
1
Zoe Stackhouse
From: Harcourt AdminSubject: FW: Copy of report for UWIR for 564 and 602
From: Harcourt Admin Sent: Thursday, 14 July 2016 12:32 PM To: Admin <[email protected]> Cc: Bernard Tan <[email protected]> Subject: RE: Copy of report for UWIR for 564 and 602 Hi Jim Thanks for your response. Harcourt will consider your email a submission on the ATP 602P UWIR and submit to the Chief Executive along with the report. With respect to the concerns raised in your submission, if you are amenable, Harcourt could organise for an independent hydrogeologist to contact you to discuss the report and the effect on your water bores. If you would like for Harcourt to organise this, please let me know. Please note also that if Harcourt needs to enter any of your properties in the future, Harcourt will comply with all requirements of the Land Access Code. Kind regards, Harcourt Admin HARCOURT PETROLEUM N.L. D: +61 7 3218 6199 F: +61 7 3211 9872 E: [email protected]
From: Admin [mailto:[email protected]] Sent: Thursday, 14 July 2016 9:21 AM To: Harcourt Admin Subject: RE: Copy of report for UWIR for 564 and 602 Hi, We have ascertained that the two properties that are affected by this are called “Hillview” and “Dawson Park”, 230 Birchley’s Road, Isla. We have concerns about the impact on our groundwater and until such time as we fully understand what the effect will be we would like to register our objection to the proposed coal seam gas production testing and development. Along with this we refuse the right for anyone to enter our properties. Regards,
Jim Gorman Noosa Fair Group | Level 14, 46 Edward Street, Brisbane QLD 4000 | P: 07 3211 1102 | F: 07 3211 1103 E: [email protected]

Appendix F - Disclaimer and Limitations This report has been prepared by CDM Smith Australia Pty Ltd (CDM Smith) for the sole benefit of Harcourt Petroleum] for the sole purpose of providing a Underground Water Impact Report for ATP 602 near Moura in Central Queensland.
This report should not be used or relied upon for any other purpose without CDM Smith’s prior written consent. CDM Smith, nor any officer or employee of CDM Smith, accepts no responsibility or liability in any way whatsoever for the use or reliance of this report for any purpose other than that for which it has been prepared.
Except with CDM Smith’s prior written consent, this report may not be:
(a) released to any other party, whether in whole or in part (other than to Harcourt Petroleum N.L.’s officers, employees and advisers);
(b) used or relied upon by any other party; or
(c) filed with any Governmental agency or other person or quoted or referred to in any public document.
CDM Smith, nor any officer or employee of CDM Smith, accepts no liability or responsibility whatsoever for or in respect of any use or reliance upon this report by any third party.
The information on which this report is based has been provided by Harcourt Petroleum N.L. and third parties. CDM Smith (including its officer and employee):
(a) has relied upon and presumed the accuracy of this information;
(b) has not verified the accuracy or reliability of this information (other than as expressly stated in this report);
(c) has not made any independent investigations or enquiries in respect of those matters of which it has no actual knowledge at the time of giving this report to Harcourt Petroleum N.L.; and
(d) makes no warranty or guarantee, expressed or implied, as to the accuracy or reliability of this information.
In recognition of the limited use to be made by Harcourt Petroleum N.L. of this report, Harcourt Petroleum N.L. agrees that, to the maximum extent permitted by law, CDM Smith (including its officer and employee) shall not be liable for any losses, claims, costs, expenses, damages (whether in statute, in contract or tort for negligence or otherwise) suffered or incurred by Harcourt Petroleum N.L. or any third party as a result of or in connection with the information, findings, opinions, estimates, recommendations and conclusions provided in the course of this report.
If further information becomes available, or additional assumptions need to be made, CDM Smith reserves its right to amend this report.
Underground Water Impact Report - ATP 602 1