Embed Size (px)
Citation preview

Corporate PresentationFebruary 2012
Underground Energy Corp.Unlocking Shale Oil Opportunities in California & NevadaTSX-V:UGE
� Focused on the Monterey and other oil-prone shale formations principally in California but also Nevada currently comprising 80,424 net acres (37,584 in California and 42,840 in Nevada)
� Continuing to assemble quality land position in California• Initial asset at Asphaltea comprises 5,850 net acres• Recent acquisition from Panther Energy Company increases California acreage from 7,830 net acres
to 37,584 (29,697 Monterey – a 4x increase)• 2 AMIs covering 140 square miles in the Santa Maria and San Joaquin basins (initial 1,880 net acres)
� Zaca assets provide near term production potential with initial Management estimates of 6 MMbbls2P Reserves and 20.8 MMbbls prospective resources1
� Asphaltea assigned 2 billion bbls OOIP and 109 MMbbls of prospective recoverable resources2
� Initial drilling program of 5 wells to commence mid-February � California-based team with proven track record of creating significant shareholder value
• Founders of OSUM Oil Sands Corp. (~ $2.0 billion private oil sands company based in Calgary, AB)• Operations team with proven track record of finding and growing reserves & production in California
� Attractively valued compared to other shale and resource focused exploration and development companies with significant near-term value creating milestones
2
Investment Highlights
1. Management estimates which also include a review by an internal qualified reservoir engineer2. Source: GLJ Petroleum Consultants, effective date June 1, 2011

The Team – Built for California Oil
Note: Refer to the Appendix for detail description on the company's management team and board of directors 3
California-based
Management Independent Board MembersMichael Kobler – Chairman, President & CEO
30 years oil & large infrastructure projects globally and in California; founder and former CEO
of OSUM Oil Sands
Bruce Berwager – Chief Operating Officer32 years international oil & gas experience;
Chevron, Unocal, Conoco, Warrenformer COO and Director of Venoco;
20+ years shale experience in CA, TX, PA
Randy Aldridge - Director30 years international oil experience;
President of Koch Pipelines & Koch Petroleum Canada; Koch Oil Co., True Energy
Peter Ballachey – CFO & Corporate Secretary34 years experience;
16 years senior financial roles in Canada and USA
Simon Clarke – VP Corporate DevelopmentFounder OSUM Oil Sands;
20+ years capital markets experience
Harland Johnson - Director40 years technical and management upstream experience; ExxonMobil
and affiliates
Dana Brock – VP Engineering30 years California energy and infrastructure
experience; Unocal, OSUM Oil Sands
David Hoyt – VP Exploration & Development35 years in exploration and development
geology and geophysics; 25 years in California with ARCO, TXO, Warren, Foothill
Andrew Squires - Director23 years heavy oil experience;
Petro-Canada, Dome, Amoco, Paramount; Current Senior VP OSUM Oil Sands
Randy Ray – Chief GeophysicistMore than 35 years in western US; expert in
integrated seismic and geological interpretation
Kim Wolfe – Regulatory Mgr. & Compliance CA and Santa Barbara permitting and
regulatory; 10 years oil & gas experience at Venoco, Greka, SCS
Douglas Urch - Director30+ years international experience;
CFO Bankers Petroleum and previously CFO of Rally Energy
Capital Structure Snapshot
4
UGEListed on the TSX Venture Exchange
202.2 millionBasic Shares Issued and Outstanding
336.0 millionFully Diluted Shares Outstanding
15.5%Insider Ownership
25.9%Institutional Ownership
58.6%Retail Ownership
$0.24January 31, 2012 Closing Share Price
$48.5 millionMarket Capitalization (on Basic Shares)
$16.0 millionCash Balance at December 31, 2011
$31.0 millionWorking Capital at December 31, 2011
$32.5 millionEnterprise Value (on Basic Shares)
$37.0 millionPotential Proceeds from Dilutive Securities
5
Growth Strategy
Time
Shar
ehol
der V
alue
Time
Shar
ehol
der V
alue
� Grow primarily through the drill bit� Aggressively drill prospects to ramp-up production� Apply advanced drilling, completion and
recovery technologies to maximize recovery
���Enhance
Build
Platform� Proven management team� Strong, committed investor base� Quality asset portfolio under lease with a mix of lower risk assets
and high impact resource opportunities
� Convert prospects to drill-ready projects� De-risk portfolio through:
• G&G technical assessments • Advanced 2D/3D seismic techniques• Appraisal drilling and formation evaluation
� Aggregate additional quality prospective acreage
UGE Today
6
Recent Achievements
July 2011
July 2011
Closed $25.5 million brokered private placement
Completed RTO transaction and commenced trading on TSX-V
August 2011 Entered into AMI in San Joaquin Basin covering 90 square miles (initial 1,464 net acres already leased)
August 2011
August 2011
August 2011
November 2011
February 2012
Entered into Development Agreement with Titan Energy in relation to Mustang Flats, Nevada (ability to earn total of 11,554 net acres at 100% WI)
Strengthened technical team by hiring Randy Ray as Chief Geophysicist
Completed extended seismic shoot at Asphaltea (further de-risks key prospects)
Acquired 29,854 net acres in California from Panther Energy Company
Secured rig for 5 initial wells with option for further 5 wells – drilling to commence at Zaca in mid-February 2012
December 2011 Continued to strengthen operations team

California Focused with Nevada Upside
� Currently 80,424 net acres under lease in California and Nevada
� 29,697 net acres prospective for oil from Monterey and equivalent shales in Santa Maria and San Joaquin Basins
• Two producing wells and multiple drill ready sites
• Multiple exploitation and exploration prospects, including field extensions
� 7,887 net acres of conventional prospects in the San Joaquin Basin
• One producing gas well• Additional exploration potential
� 42,840 net acres in Chainman and other emerging shale plays in 7prospect areas in Nevada
San Francisco
Los Angeles
Las Vegas
CALIFORNIA
NEVADA
Underground leases
L
7
8
Monterey Shale Formation
World Class Source Rock� Over 290 billion barrels of oil generated1
World Class Reservoir Rock� Has produced over 2.5 billion barrels1
� Early onshore drilling on surface features
� 70’s to 90’s offshore exploration with seismic
� 2000’s onshore exploration with seismic and development with horizontal wells
San Joaquin Basin
Ventura & Santa Barbara Channel
Los Angeles Basin
Santa Maria Basin
Los Angeles
Monterey is the source and reservoir rock for most of the major oil fields discovered in
CaliforniaUnderground Monterey prospects
1. Source: California DOGGR and USGS
Significant Monterey Shale Basins

9
Other players
Key Monterey Players
� Largest Monterey land holder in State (LA, Ventura and San Joaquin basins)
� 10-15 exploratory wells per year planned through 2015 to test shale prospects
� 200,000 acres and 520 drilling targets de-risked for oil-prone shale development
� $1.5 billion capex budget for California (195 shale wells in 2011 – IPs of 300+)
� Now Producing approx. 50,000 bopd from Monterey and equivalent shales
� Actively drilling in San Joaquin, Santa Maria and Salinas basins – 214,000 net acres
� Joint 500 mile seismic shoot in San Joaquin with Oxy – first half complete
� Announced two 2011 Monterey discoveries• Sevier (90 MMboe)• Salinas Valley (44 MMboe)
� 2012 plan 50-75, largely vertical, Monterey wells
� Recent take private offer at $12.50 per share ($1.4 billion enterprise value)
la
Monterey Shale Type Curves
10
Log Rate vs. Time
Horizontal Wells EUR = 645 Mbbls
Vertical Wells EUR = 540 Mbbls
Deviated Wells EUR = 6,378 Mbbls
1. Source: Occidental Petroleum Corporation, Minerals Management Service, DOGGR

11
% o
f WTI
Sources of Data: WTI (US EIA); MWSS (Chevron); California Energy Commission
California Heavy Oil (MWSS) vs. WTI
60%
70%
80%
90%
100%
110%
120%
130%
($15.00)
($10.00)
($5.00)
$0.00
$5.00
$10.00
$15.00
$20.00
$25.00
2000 2001 2002 2003 2004 2005 2006 2007 2008 2009 2010 2011 2012
$/B
BL
Dollar Differential
Percent of WTI
Avg. Differential- $6.50
Avg. Differential- $11.60
Avg. Differential- $7.00
Market Collapse
California (CA)
� CA imports 62% of crude oil (~ 1 MM bopd) by sea (ANS, Latin America, Asia, Middle East)
� CA is not connected to other US oil supply or markets
� CA oil prices currently more reflective of world prices (e.g. Brent) than WTI
� Significant rig availability with low servicing costs and year–round access to CA projects
Avg. Differential+ $4.70
Zaca Extension and Prospects
121. Management estimates which also include review by an internal qualified reservoir engineer
� Santa Barbara County, California� 80% WI (Operator)� 7,750 gross acres (6,200 net acres)� Monterey targets (analog to Asphaltea)� Zaca field (32 MMbbls recovered to date)� Average vertical well IP’s 205 BOPD and
EUR of 540 Mbbls oil� 6 MMbbls 2P Reserves1
� 20.8 MMbbls Prospective Resources1,� Includes:
• 1 producing test well (15-20 bopd)• Existing 2D seismic coverage re-
processed and new seismic swath acquired December 2011
• 20-30 initial drilling locations� Additional structures identified by seismic� Permitted pad locations chosen� Drilling of step out extension wells to
commence mid-February 2012
San FranciscoModesto
Fresno
Santa Barbara
San Joaquin Basin
Santa Maria Basin
StanislausCounty
Merced County
MaderaCounty
FresnoCounty
TulareCounty
KingsCounty
San Luis Obispo County
San Benito County
Producing Oil FieldProducing Gas Field
010 10 20 30 40 50 miles
KernCounty
AsphalteaSanta Rita Zaca
ButtonwillowDevil’s Den
Burrel
Challenger
Santa Barbara County
Petroleum Basin
BakersfieldUnderground PropertyHighlighted Property

13131
Existing Oil WellUnderground Energy Lease BoundaryZaca Oil Field Recognized BoundaryExisting Zaca FieldProbable Geologic Structure Identified by Seismic
Existing Seismic Line circa 1986New Seismic Line circa 2011Permitted Pad Locations
Possible Geologic Structure Identified by Seismic
Initial Well Locations
Underground’sZaca Assets
• Historic recovery rates 6.8%
• Primary recovery techniques only
• Potential to increase recovery rates further
• Latest seismic techniques
• Deviated / horizontal drilling
• Possibly EOR
Permitted Site B Permitted Site D
Zaca Well Economics
14
Typical Well All Wells Type Curve
Infill WellsType Curve
Well Depth (MD feet) 4,500-6,500 4,500-6,500
Dry Hole Well Costs ($M) $800-$1,300 $800-$1,300
Completion Cost ($M) $200-$400 $200-$400
Total Well Cost ($M) $1,000-$1,700 $1,000-$1,700
UGE Interest (WI / NRI) 80% / 62.6% 80% / 62.6%
Initial Prod Rate (BOPD) 205 70
Cum. Production (MBO) 535 375
NPV @10% BT ($M)1 $ 12,025 $ 8,163
IRR (%) 231% 90%
Payback (years) 0.42 1.13
0
50
100
150
200
250
0 60 120 180 240 300 360
0
50
100
150
200
250
0 60 120 180 240 300 360
1. Economics are internal estimates using NYMEX Futures Strip Prices as of Jan.30, 2012 with $14.74 deduction for diluent, gravity, location
Zaca Field – All Historic Wells Normalized Type Curve (61 wells)
Zaca Field – Infill Wells Drilled 1971 to Present Normalized Type Curve (18 wells)
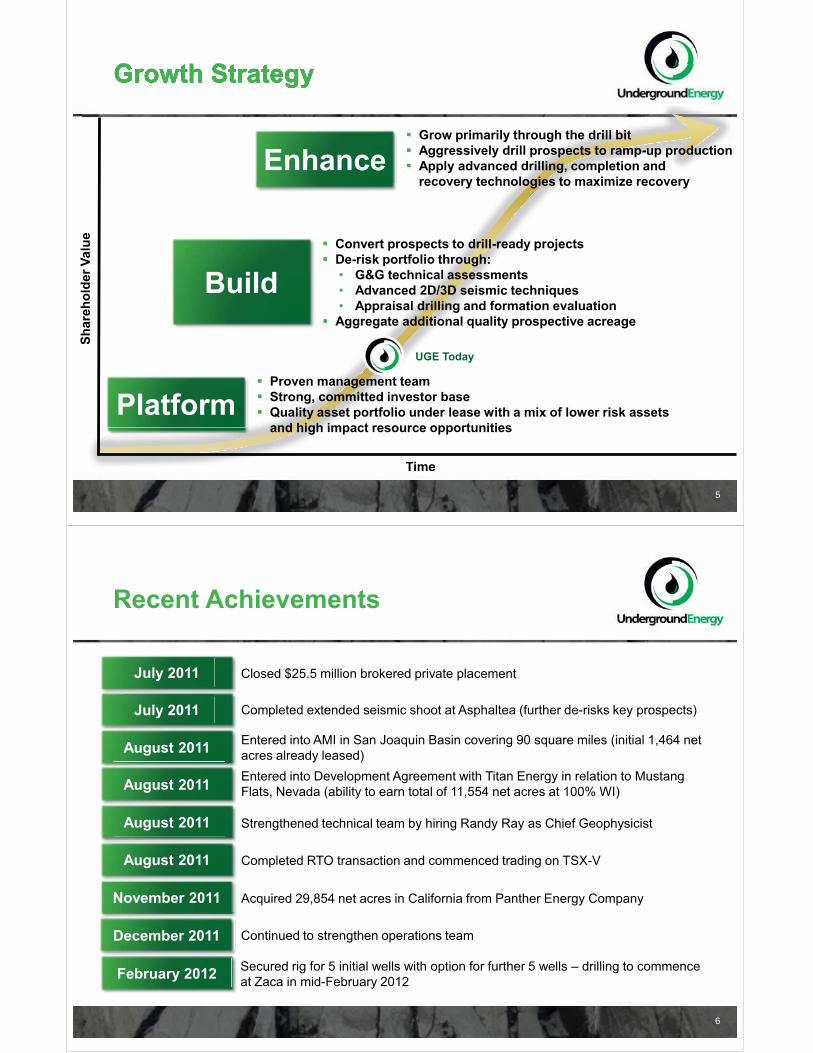
Asphaltea
151. Source: GLJ Petroleum Consultants, effective date June 1, 2011
San FranciscoModesto
Fresno
Santa Barbara
San Joaquin Basin
Santa Maria Basin
StanislausCounty
Merced County
MaderaCounty
FresnoCounty
TulareCounty
KingsCounty
San Luis Obispo County
San Benito County
Producing Oil FieldProducing Gas FieldUnderground Property
010 10 20 30 40 50 miles
KernCounty
AsphalteaSanta Rita Zaca
Buttonwillow
Burrel
Challenger
Santa Barbara County
Petroleum Basin
BakersfieldHighlighted Property
� Santa Barbara County, California� 100% WI (Operator)� 5,850 acres� 2 billion bbls OOIP / 109 MMbbls
Prospective Resources1
• Assumes 4.8% recovery rate – analog fields 10-15%
� Monterey shale oil targets• Highly fractured, conventional structures• Close to infrastructure and existing
Monterey production� Analog fields: Zaca (32 MMboe), Cat Canyon
(251 Mmboe), Orcutt (209 Mmboe)� Includes:
• 30+ miles of seismic acquired in Q2 and Q4 2011 being processed
• 26 permitted wells� Near term plan:
• Process and interpret seismic• First well targeted mid 2012
Devil’s Den
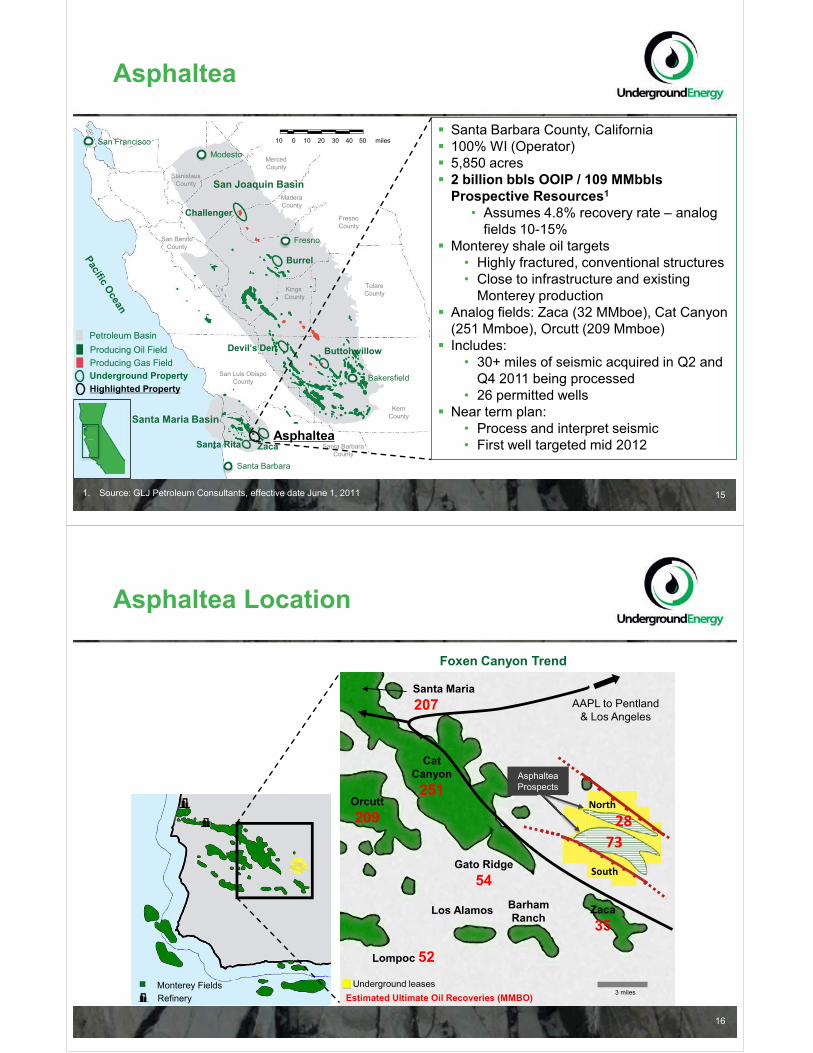
Cat Canyon251
Zaca35
Santa Maria207
Gato Ridge54
Orcutt209
Lompoc 52
Barham Ranch
AAPL to Pentland & Los Angeles
Los Alamos
3 miles
Asphaltea Location
Estimated Ultimate Oil Recoveries (MMBO)
16
Foxen Canyon Trend
7328
North
RefineryMonterey Fields
South
Underground leases
Asphaltea Prospects
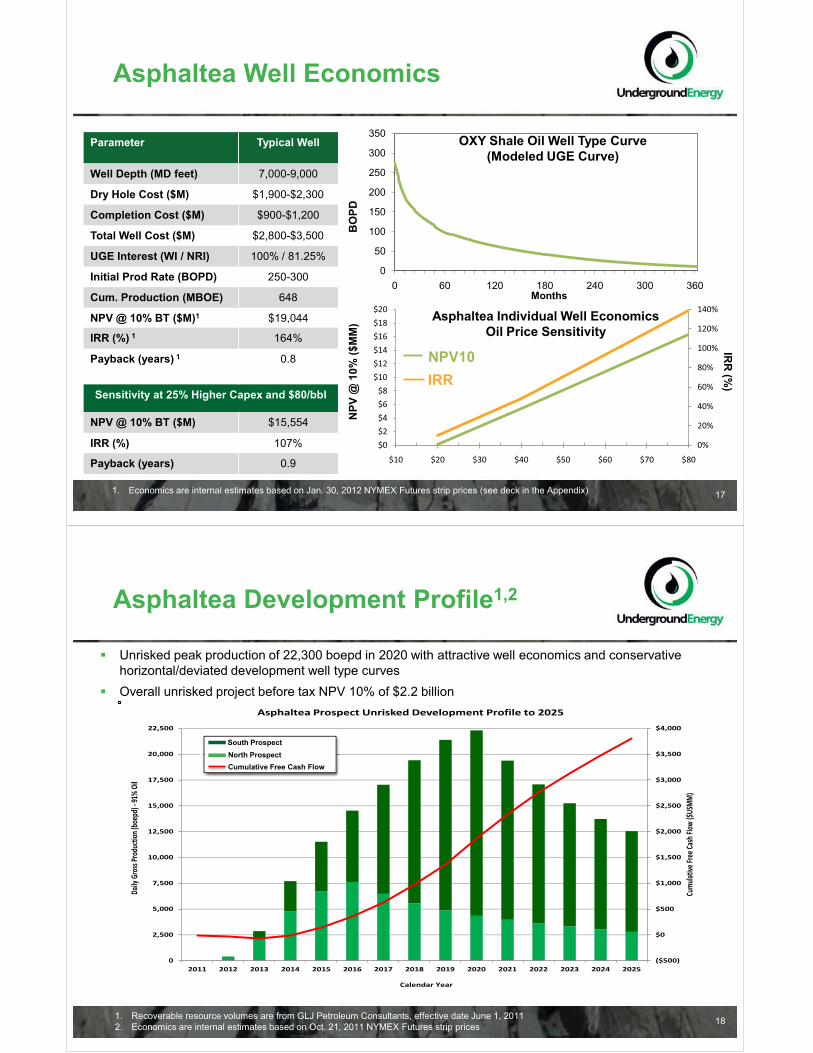
Parameter Typical Well
Well Depth (MD feet) 7,000-9,000
Dry Hole Cost ($M) $1,900-$2,300
Completion Cost ($M) $900-$1,200
Total Well Cost ($M) $2,800-$3,500
UGE Interest (WI / NRI) 100% / 81.25%
Initial Prod Rate (BOPD) 250-300
Cum. Production (MBOE) 648
NPV @ 10% BT ($M)1 $19,044
IRR (%) 1 164%
Payback (years) 1 0.8
Sensitivity at 25% Higher Capex and $80/bbl
NPV @ 10% BT ($M) $15,554
IRR (%) 107%
Payback (years) 0.9
0
50
100
150
200
250
300
350
0 60 120 180 240 300 360Months
OXY Shale Oil Well Type Curve (Modeled UGE Curve)
1. Economics are internal estimates based on Jan. 30, 2012 NYMEX Futures strip prices (see deck in the Appendix)
0%
20%
40%
60%
80%
100%
120%
140%
$0$2$4$6$8
$10$12$14$16$18$20
$10 $20 $30 $40 $50 $60 $70 $80
Asphaltea Individual Well Economics Oil Price Sensitivity
IRRNPV10
NPV
@ 1
0% ($
MM
)B
OPD
IRR
(%)
17
Asphaltea Well Economics
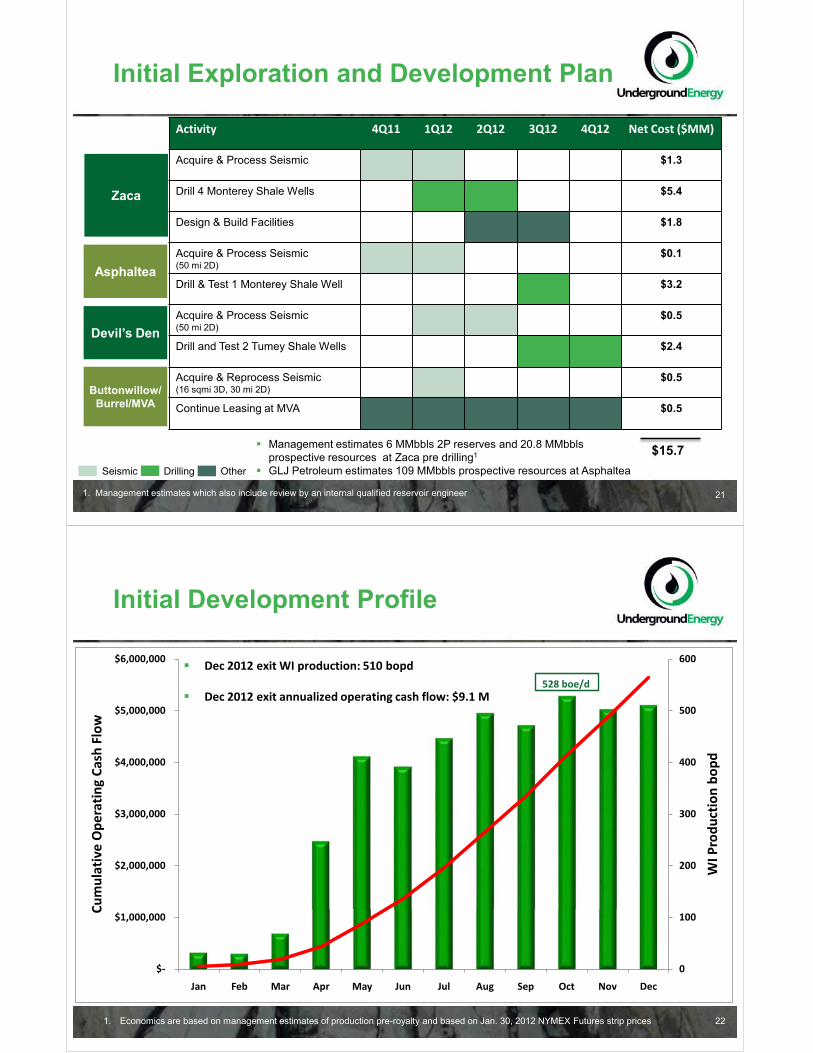
Asphaltea Development Profile1,2
18
($500)
$0
$500
$1,000
$1,500
$2,000
$2,500
$3,000
$3,500
$4,000
0
2,500
5,000
7,500
10,000
12,500
15,000
17,500
20,000
22,500
2011 2012 2013 2014 2015 2016 2017 2018 2019 2020 2021 2022 2023 2024 2025
Cumu
lative
Free
Cash
Flow
($US
MM
)
Daily
Gro
ss Pr
oduc
tion (
boep
d) -9
1% O
il
Calendar Year
Asphaltea Prospect Unrisked Development Profile to 2025
South Prospect
North Prospect
Cumulative Free Cash Flow
� Unrisked peak production of 22,300 boepd in 2020 with attractive well economics and conservative horizontal/deviated development well type curves
� Overall unrisked project before tax NPV 10% of $2.2 billion
1. Recoverable resource volumes are from GLJ Petroleum Consultants, effective date June 1, 20112. Economics are internal estimates based on Oct. 21, 2011 NYMEX Futures strip prices
South ProspectNorth ProspectCumulative Free Cash Flow

Other California Assets
19
San FranciscoModesto
Fresno
Santa Barbara
San Joaquin Basin
Santa Maria Basin
StanislausCounty
Merced County
MaderaCounty
FresnoCounty
TulareCounty
KingsCounty
San Luis Obispo County
San Benito County
Producing Oil FieldProducing Gas FieldUnderground Property
010 10 20 30 40 50 miles
KernCounty
AsphalteaZaca
Burrel
Santa Barbara County
Petroleum Basin
Bakersfield
Challenger� Madera and Merced Counties, California� 70.49% WI (Operator),11,219 gross acres (7,887 net acres)� Zilch, Blewett, Vaqueros/Temblor sands; and Kreyenhagen
& Moreno shale gas targetsBurrel� Fresno County, California� 80% WI, 10,656 gross acres (8,525 net acres)� Zilch & Vaqueros sand, Monterey & Kreyenhagen shale oil
targets� Analog fields: Helm (46 MMboe), Raisin City (47 Mmboe)\Devil’s Den� Kern County, California� 65% WI (Operator), 6,795 gross acres (4,417 net acres)� Shallow Monterey (Diatomite) and Tumey shale oil targets� Analog fields: McKittrick (350 MMboe), Cymric (543 MMboe)Buttonwillow� Kern County, California� 80% WI (Operator), 1,445 gross acres (1,156 net acres)� Monterey/McClure shale, 44X and Randolph sand oil
targets� Analog fields: North Shafter (10 MMboe), Rose (4.8 MMboe) Santa Rita� Santa Barbara County, California� 80% WI (Operator), 1,217 gross acres (974 net acres)� Monterey shale & Point Sal sand oil targets� On trend with Lompoc Field (52 MMbbls)
Highlighted Property
Devil’s Den Buttonwillow
Santa Rita
Challenger
Nevada Assets
� “Early mover” advantage by building a strong land position ahead of the curve
� Complex geology, but existing discoveries have had very high production rates
� Emerging shale oil potential (Bakken-like)� Key competitors will help prove up plays -
Cabot (COG), EOG (EOG), SM Energy (SM), Callon (CPE), PetroHunt
� Mustang Flats – Entered into a development agreement• 100% Working Interest,11,554 acres
� Blackburn & Deadman Creek – 2D and 3D seismic purchased, interpretation begun
� Coaldale – Offset exploratory well drilling
� Bull Run – Surface geological mapping underway
20
Underground leases
Blackburn West Mustang Flats
Flat TopTrap Springs
Coaldale
Bull Run Deadman Creek
RAILROAD VALLEY46.2MMBO
Reno
Las Vegas
Winnemucca Elko
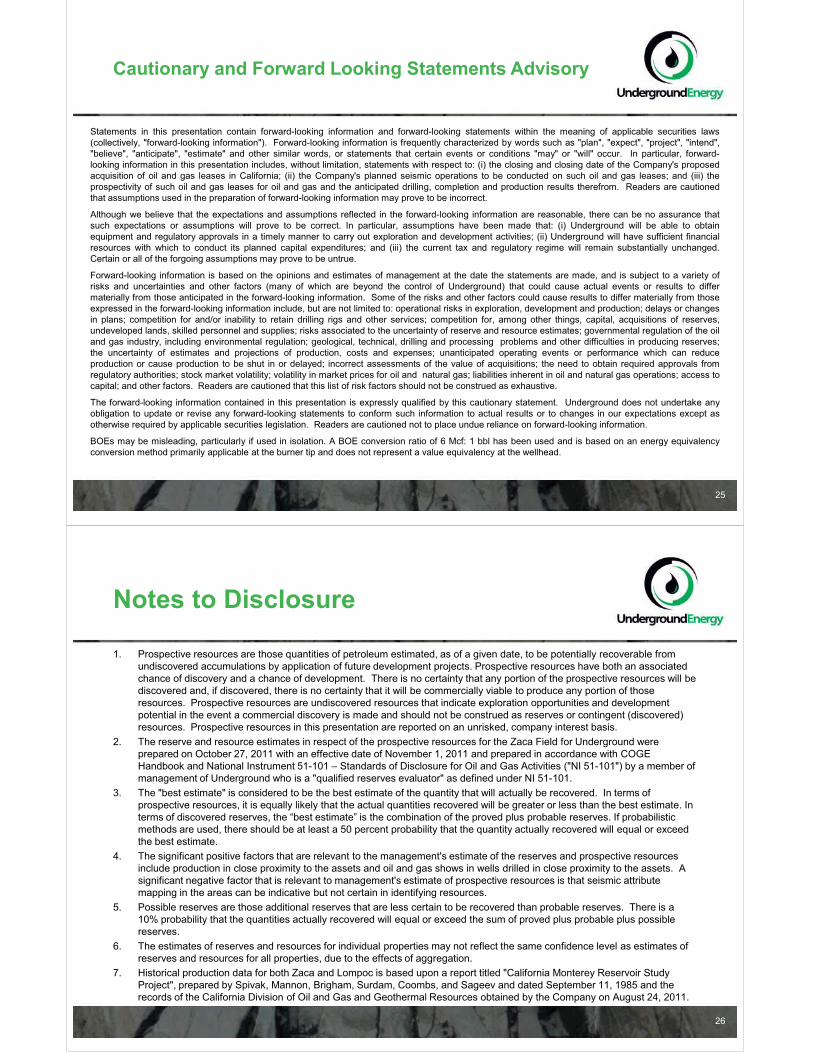
Initial Exploration and Development Plan
21
Activity 4Q11 1Q12 2Q12 3Q12 4Q12 Net Cost ($MM)
Acquire & Process Seismic $1.3
Drill 4 Monterey Shale Wells $5.4
Design & Build Facilities $1.8
Acquire & Process Seismic (50 mi 2D)
$0.1
Drill & Test 1 Monterey Shale Well $3.2
Acquire & Process Seismic (50 mi 2D)
$0.5
Drill and Test 2 Tumey Shale Wells $2.4
Acquire & Reprocess Seismic (16 sqmi 3D, 30 mi 2D)
$0.5
Continue Leasing at MVA $0.5
Zaca
Asphaltea
Devil’s Den
DrillingSeismic Other
$15.7� Management estimates 6 MMbbls 2P reserves and 20.8 MMbblsprospective resources at Zaca pre drilling1
� GLJ Petroleum estimates 109 MMbbls prospective resources at Asphaltea
Buttonwillow/Burrel/MVA
1. Management estimates which also include review by an internal qualified reservoir engineer
22
Initial Development Profile
0
100
200
300
400
500
600
$-
$1,000,000
$2,000,000
$3,000,000
$4,000,000
$5,000,000
$6,000,000
Jan Feb Mar Apr May Jun Jul Aug Sep Oct Nov Dec
WI P
rodu
ctio
n bo
pd
Cum
ulat
ive
Ope
ratin
g Ca
sh F
low
528 boe/d
� Dec 2012 exit WI production: 510 bopd
� Dec 2012 exit annualized operating cash flow: $9.1 M
1. Economics are based on management estimates of production pre-royalty and based on Jan. 30, 2012 NYMEX Futures strip prices

Company Timeline
23
2010 2011 2012
Santa Barbara Countypermitting expertise added
California/Monterey operational expertise added
Land-use permit granted for initial 26 Asphaltea wells
Monterey/Nevada geological expertise added
$6MM pre-IPO equity financing
Acquisition of 2,390 acres in Nevada, second lease at Asphaltea (3,400 acres)
Farm-in on EQ Energy 28,984 acres, Nevada
GLJ report –2.3billion bbls oil initially in place
Entered into San Joaquin / Santa Maria AMIs
Development agreement with Titan on Mustang Flats
Closed $25.5 million financing
Initial seismic shoot at Asphaltea
Closed RTO and started trading on TSX-V
Closed Panther acquisition
Secure drilling rig for initial 2012 program
2D / 3D seismic and geological analysis of San Joaquin assets
Commence step out drilling at Zaca
Seismic shot at Zaca /Asphaltea
Commence drilling at Asphaltea / Devil’s Den
GLJ Reserve Report due
Complete interpretation of Asphaltea seismic
Contact Information
Underground Energy Corp.3rd Floor7 W. Figueroa StreetSanta Barbara, CA, 93101-5109Tel: 805.845.4700Fax: 805.845.1177www.ugenergy.com
President & CEO – Mike [email protected]: (805) 845-4700, x18
CFO – Peter [email protected]: (805) 845-4700, x17
COO – Bruce [email protected]: (805) 845-4700, x11
VP Corp Development – Simon [email protected]: (604) 551-9665
24
Cautionary and Forward Looking Statements Advisory
Statements in this presentation contain forward-looking information and forward-looking statements within the meaning of applicable securities laws(collectively, "forward-looking information"). Forward-looking information is frequently characterized by words such as "plan", "expect", "project", "intend","believe", "anticipate", "estimate" and other similar words, or statements that certain events or conditions "may" or "will" occur. In particular, forward-looking information in this presentation includes, without limitation, statements with respect to: (i) the closing and closing date of the Company's proposedacquisition of oil and gas leases in California; (ii) the Company's planned seismic operations to be conducted on such oil and gas leases; and (iii) theprospectivity of such oil and gas leases for oil and gas and the anticipated drilling, completion and production results therefrom. Readers are cautionedthat assumptions used in the preparation of forward-looking information may prove to be incorrect.
Although we believe that the expectations and assumptions reflected in the forward-looking information are reasonable, there can be no assurance thatsuch expectations or assumptions will prove to be correct. In particular, assumptions have been made that: (i) Underground will be able to obtainequipment and regulatory approvals in a timely manner to carry out exploration and development activities; (ii) Underground will have sufficient financialresources with which to conduct its planned capital expenditures; and (iii) the current tax and regulatory regime will remain substantially unchanged.Certain or all of the forgoing assumptions may prove to be untrue.
Forward-looking information is based on the opinions and estimates of management at the date the statements are made, and is subject to a variety ofrisks and uncertainties and other factors (many of which are beyond the control of Underground) that could cause actual events or results to differmaterially from those anticipated in the forward-looking information. Some of the risks and other factors could cause results to differ materially from thoseexpressed in the forward-looking information include, but are not limited to: operational risks in exploration, development and production; delays or changesin plans; competition for and/or inability to retain drilling rigs and other services; competition for, among other things, capital, acquisitions of reserves,undeveloped lands, skilled personnel and supplies; risks associated to the uncertainty of reserve and resource estimates; governmental regulation of the oiland gas industry, including environmental regulation; geological, technical, drilling and processing problems and other difficulties in producing reserves;the uncertainty of estimates and projections of production, costs and expenses; unanticipated operating events or performance which can reduceproduction or cause production to be shut in or delayed; incorrect assessments of the value of acquisitions; the need to obtain required approvals fromregulatory authorities; stock market volatility; volatility in market prices for oil and natural gas; liabilities inherent in oil and natural gas operations; access tocapital; and other factors. Readers are cautioned that this list of risk factors should not be construed as exhaustive.
The forward-looking information contained in this presentation is expressly qualified by this cautionary statement. Underground does not undertake anyobligation to update or revise any forward-looking statements to conform such information to actual results or to changes in our expectations except asotherwise required by applicable securities legislation. Readers are cautioned not to place undue reliance on forward-looking information.
BOEs may be misleading, particularly if used in isolation. A BOE conversion ratio of 6 Mcf: 1 bbl has been used and is based on an energy equivalencyconversion method primarily applicable at the burner tip and does not represent a value equivalency at the wellhead.
25
Notes to Disclosure
1. Prospective resources are those quantities of petroleum estimated, as of a given date, to be potentially recoverable from undiscovered accumulations by application of future development projects. Prospective resources have both an associated chance of discovery and a chance of development. There is no certainty that any portion of the prospective resources will be discovered and, if discovered, there is no certainty that it will be commercially viable to produce any portion of those resources. Prospective resources are undiscovered resources that indicate exploration opportunities and development potential in the event a commercial discovery is made and should not be construed as reserves or contingent (discovered) resources. Prospective resources in this presentation are reported on an unrisked, company interest basis.
2. The reserve and resource estimates in respect of the prospective resources for the Zaca Field for Underground were prepared on October 27, 2011 with an effective date of November 1, 2011 and prepared in accordance with COGE Handbook and National Instrument 51-101 – Standards of Disclosure for Oil and Gas Activities ("NI 51-101") by a member of management of Underground who is a "qualified reserves evaluator" as defined under NI 51-101.
3. The "best estimate" is considered to be the best estimate of the quantity that will actually be recovered. In terms of prospective resources, it is equally likely that the actual quantities recovered will be greater or less than the best estimate. In terms of discovered reserves, the “best estimate” is the combination of the proved plus probable reserves. If probabilistic methods are used, there should be at least a 50 percent probability that the quantity actually recovered will equal or exceedthe best estimate.
4. The significant positive factors that are relevant to the management's estimate of the reserves and prospective resources include production in close proximity to the assets and oil and gas shows in wells drilled in close proximity to the assets. Asignificant negative factor that is relevant to management's estimate of prospective resources is that seismic attribute mapping in the areas can be indicative but not certain in identifying resources.
5. Possible reserves are those additional reserves that are less certain to be recovered than probable reserves. There is a 10% probability that the quantities actually recovered will equal or exceed the sum of proved plus probable plus possible reserves.
6. The estimates of reserves and resources for individual properties may not reflect the same confidence level as estimates of reserves and resources for all properties, due to the effects of aggregation.
7. Historical production data for both Zaca and Lompoc is based upon a report titled "California Monterey Reservoir Study Project", prepared by Spivak, Mannon, Brigham, Surdam, Coombs, and Sageev and dated September 11, 1985 and the records of the California Division of Oil and Gas and Geothermal Resources obtained by the Company on August 24, 2011.
26
Appendix
Management Team
Mike Kobler, Chairman, CEO and President � 30 years international project management and engineering experience; � Founder of successful OSUM Oil Sands Corp., Calgary� Founder and President, UCM Civil Engineering Consulting Firm focused on large infrastructure construction projects in California
Bruce Berwager, COO - Masters Petroleum Eng, P.Eng� 32 years international oil and gas exploration, development, operations management and engineering roles with Chevron, Unocal,
Conoco, Venoco and others� 20+ years experience with Shale in California (Monterey), Texas (Barnett & Wolfcamp), Pennsylvania (Marcellus)� Former Director and COO of Venoco, SVP and GM for California Ops-Warren Resources
Peter Ballachey, CFO and Corporate Secretary - CA� Over 34 years experience including 16 years senior financial CFO roles in Canada and USA� Former CFO of OSUM Oil Sands Corp., Calgary
Simon Clarke, VP Corporate Development and Director, LLB� Founder, Board Observer and Advisor to OSUM Oil Sands Corp� Managing Director Invico Energy II Fund, Director of Argus Metals Corp., Director of Underground Energy, Inc.
David Hoyt, VP Exploration & Development – CPG, RPG� 35 years exploration and development geology and geophysics project management and interpretation experience with ARCO, TXO,
Warren, Foothill and as an independent consultant� Extensive academic and Industry experience in California, Nevada, Alaska
Randy Ray, Chief Geophysicist – BS, MS � Professional Geologist, Texas and Wyoming� More than 35 years experience in Western US� Expert in integrated seismic and geological interpretation
Kim Wolfe, Regulatory Manager and Compliance Officer – Paralegal, NP� California and Santa Barbara permitting and regulatory expert� 10 yrs oil and gas experience with Venoco, Greka, Tracer in land, legal and compliance roles
28
Independent Directors
Randy Aldridge – Independent Director� 30 years international oil experience: Chairman- Koch Pipelines, President- Koch Petroleum Canada, President-Koch Oil Co.,
Chairman-True Energy Corp.� Board Member, Energy Holdings international Inc. and Husky/BP Toledo Refinery LLC
Harland Johnson – Independent Director� 40 years technical and management experience in the upstream petroleum industry for Exxon Corporation and its affiliates� Formerly Presidente, Divisão de Exploração e Produção, Esso Brasileira de Petróleo Limitada; and President, Exxon Trinidad Limited� BSc (Honors) Chemistry, U of Alberta. PhD Metallurgy, U of Alberta
Andrew Squires – Independent Director� Sr. Vice-President, OSUM Oil Sands Corp.� 23 years experience in heavy oil and oil sands at Petro-Canada, Dome, Amoco, Paramount
Douglas Urch – Independent Director� EVP, Finance and CFO Bankers Petroleum Ltd.� Director and Audit Committee Chairman at Petrodorado Energy� More than 30 years oil & gas experience at RallyEnergy, Mohave Exploration, Sunshine Oilsands, Barrington Petroleum, TriGas
Exploration and Ryerson Oil & Gas
Sam Charanek – Advisor to the Board� 15 years of capital markets and finance experience with a focus on international oil and gas strategies� Co-founder of Pan Orient Energy, Canacol Energy, Excelsior Energy (now Athabasca), PetroDorado Energy and Mena Hydrocarbons� Advised Zodiac Exploration, Gallic Energy and ArPetrol Energy and Sunshine Oilsands
29
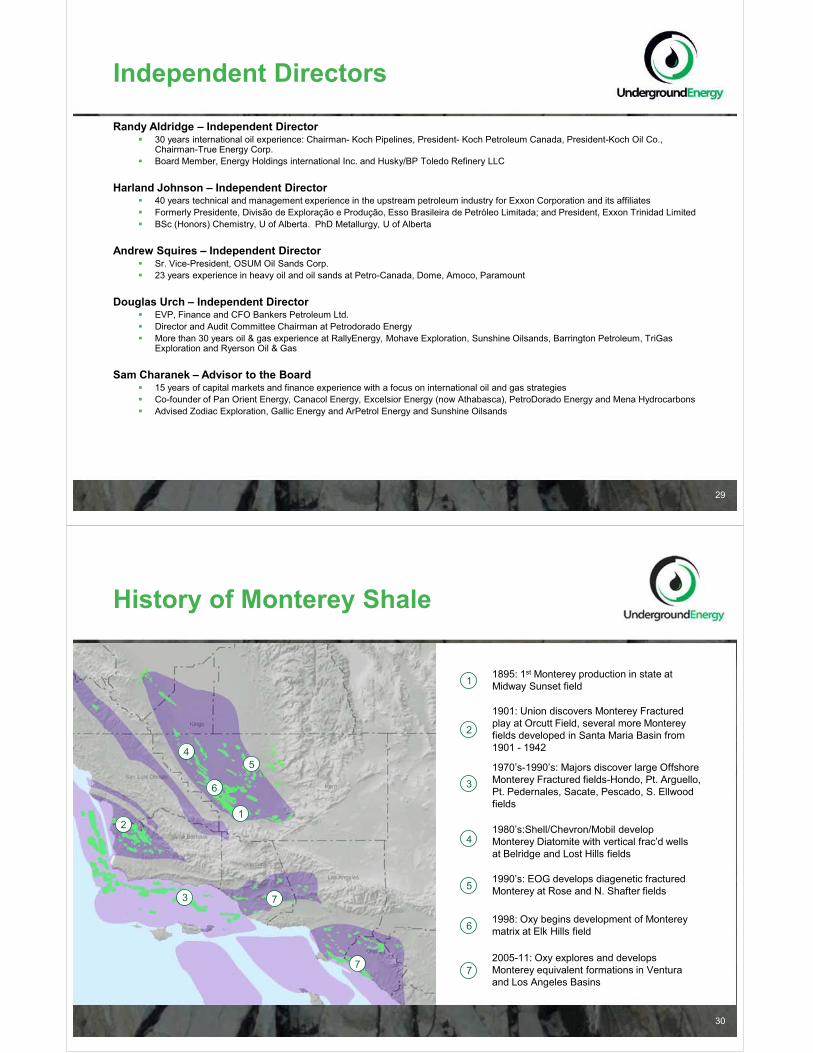
History of Monterey Shale
1895: 1st Monterey production in state at Midway Sunset fieldt1
1901: Union discovers Monterey Fractured play at Orcutt Field, several more Monterey fields developed in Santa Maria Basin from 1901 - 1942
t2
1970’s-1990’s: Majors discover large Offshore Monterey Fractured fields-Hondo, Pt. Arguello, Pt. Pedernales, Sacate, Pescado, S. Ellwood fields
t3
1980’s:Shell/Chevron/Mobil develop Monterey Diatomite with vertical frac’d wells at Belridge and Lost Hills fields
t4
1990’s: EOG develops diagenetic fractured Monterey at Rose and N. Shafter fieldst5
1998: Oxy begins development of Monterey matrix at Elk Hills fieldt6
2005-11: Oxy explores and develops Monterey equivalent formations in Ventura and Los Angeles Basins
7
30
t1t2
t3
t4t5
t6
7
7

Monterey Play Types
� Fracture Dominated• Outward basins – Structural traps – Hondo, Pt. Pedernales, Orcutt, Cat Canyon, Asphaltea – cleaner shales• Inward basins – Diagenetic traps – Rose, North Shafter
� Matrix Dominated: Mostly Diatomite – Belridge, Lost Hills, Elk Hills, Cymric, McKittrick
� Dual Porosity: Matrix, micro-fractures and fractures – S. Ellwood, Midway-Sunset
31
Matrix DominatedFracture Dominated135 Miles
OFFSHORE-ONSHORE MONTEREY OUTBOUND BASINS ONSHORE SAN JOAQUIN INBOUND BASIN
Cat Canyon-Gato Ridge147 MMBO
Pt. Pedernales90 MMBO
Asphaltea Closures
103 MMBO
Orcutt209 MMBO
Cuyama230 MMBO
Elk Hills86 MMBO
North Shafter17 MMBO
South Belridge540 MMBO
Hondo427 MMBO
Monterey Formation
UE’s Initial 2 Monterey Prospects are Naturally Fractured, Conventional Structures
San Andreas Fault
Key Attributes of Commercial Resource Plays� TOC in excess of 1%� T-MAX of 450�F� Enhanced Permeability from Interbedded Sand/Carbonates or Natural Fractures
Play Formation Depth (ft)
Gross Thickness (ft)
Matrix Porosity (%)
Matrix Permeability (md)
Total Organic Content (%)
Bakken 7,000-11,000 20-150 3-12 0.005-0.2 2-18
Eagle Ford 8,0000-14,000 75-300 3-15 <0.0001-0.003 4.7
Niobrara 2,000-8,000 >150 4-8 na 5
Monterey (SMV) 3,500-10,000 500-3,500 5-30 0.0001-2 4-5
Monterey(SJV)Antelope/McClure/McDonald/FruitvalePuente/U237 (LAB) Mohnian/Modelo
5,000-13,000 500-5,000 15-30 0.0001-2 0.1-4
Tumey 3,000-19,000 200-700 5-10 0.001 0.9-3.2
Kreyenhagen 3,000-19,000 400-2,400 5-10 <0.0001-1 4-12
Moreno (Gas) 4,000-14,000 100-11,000 na na 0.5-4
Chainman/Pilot > 8,200 400-2,400 5-10 Fracture Enhanced 1.5-11.7
Paleozoic >8,200-15,000 2,000-3,000 Fracture Enhanced Fracture Enhanced 4.4-25
500 3,500-3 4 54-5
US Shale Oil Comparison
32
44000-2,40002,
222,,0000 3,0000-3 44.4 2554-
11.5-11.77-1
High Profile US Oil-Prone
Shale Plays
California Resource Shale
Plays
Nevada Emerging Shale
Plays

Local Prices based on NYMEX Futures Strip
33
NYMEX Futures Strip Prices as of January 30, 2012
Crude Oil Prices Natural Gas PricesWTI @ Current Current SMV NYMEX Local Gas Local Gas
Cushing Differential Differential Crude Oil Henry Hub Price PriceOklahoma MWSS (1) SMV (2) Forecast Differential
vs WTI vs MWSS % ofYear $US/bbl $US/bbl $US/bbl $US/bbl $US/mmbtu HH Nymex $US/mmbtu
Dec. 2012 $100.43 +$6.68 $(4.65) $102.46 $3.51 118% $4.14
2013 $97.50 +$6.68 $(4.65) $99.53 $3.99 118% $4.71
2014 $93.68 +$6.68 $(4.65) $95.71 $4.31 118% $5.09
2015 $90.75 +$6.68 $(4.65) $92.78 $4.56 118% $5.38
2016 $89.19 +$6.68 $(4.65) $91.22 $4.82 118% $5.69
2017 $88.49 +$6.68 $(4.65) $90.52 $5.11 118% $6.03
2018 $88.66 +$6.68 $(4.65) $90.69 $5.41 118% $6.38
2019 $89.00 +$6.68 $(4.65) $91.03 $5.71 118% $6.74
2020 $89.80 +$6.68 $(4.65) $91.83 $6.04 118% $7.13
2021+ $90.00 +$6.68 $(4.65) $92.03 $6.35 118% $7.49
1. MWSS is an abbreviation for Midway Sunset, the benchmark for California heavy oil at 13�����2. SMV is an abbreviation for Santa Maria Valley crude oil at 15�����