Embed Size (px)
Citation preview

Undergraduate Team – Engine
Student Design Competition 2014/15
An Ultra-High Bypass Ratio Turbofan
Engine for the Future
- Request for Proposal -
September 13, 2014

2
Abstract
Major engine manufacturers are continually assessing and revising their technical & business
plans to ensure that their vision reaches into the next decade. In the commercial aviation market,
replacement engines for new generations of the Boeing 787 and Airbus A380 & A350 airplanes
are currently being considered. Very recently Rolls-Royce revealed its road map for the future(*)
,
whereby it will extend its Trent 1000 and Trent XWB engine programs to address significantly
higher bypass ratios, further improvements in propulsive efficiencies at cruise and reduced fuel
burn & emissions for long range travel in 2025 and beyond. This Request for Proposal asks that
you also look to 2025 and design a new geared, 3-spool, high bypass ratio turbofan for entry into
service around that time for use on twin-engine, wide-body passenger and freight aircraft. Your
primary objective is also reduced fuel burn, as a result of higher propulsive efficiency at cruise
conditions.
A generic model, representative of 3-spool current systems is supplied as a baseline engine. This
model has been generated solely on the basis of publically-available information. You should
model this engine with your design system to provide a viable reference from which to gauge
your improvements. You are then required to retain the core of the baseline design and generate
a new LP/IP system that fits around it, using aerodynamic similarity. A simple but typical,
multi-segment, extended mission should be constructed that covers both design-point and off-
design engine operations. Such a mission will also test propulsive efficiencies at cruise and
reduced fuel burn specifically and should be “flown” using both engines. The performance
characteristics and total fuel consumption of both engines should be estimated over the mission
and stated clearly in the proposal. The benefits of the new design should be clearly stated.
Special attention should be paid to engine mass, dimensions & integration with the aircraft.
Technical feasibility is critical and operating costs should also be considered.
Dr. Ian Halliwell
AIAA Air Breathing Propulsion Group and IGTI Aircraft Engines & Education Committees
Principal Engineer, PSM-Alstom
E-mail: [email protected]
(*)
Aviation Week and Space Technology, August 25, 2014.

3
CONTENTS
Page
1. Introduction 4
2. Design Objectives & Requirements 6
3. Baseline Engine Model 8
3.1 Overall Characteristics 9
3.2 Inlet 17
3.3 Fan 17
3.4 Intermediate-Pressure Compressor 19
3.5 Inter-Compressor Duct 20
3.6 High-Pressure Compressor
20
3.7 Combustor 22
3.8 High-Pressure Turbine 22
3.9 Inter-Turbine Duct 1 25
3.10 Intermediate-Pressure Turbine 25
3.11 Inter-Turbine Duct 2 28
3.12 Low-Pressure Turbine 28
3.13 Core Exhaust & Nozzle 31
3.14 Bypass Duct
32
4. Hints & Suggestions 32
5. Competition Expectations 33
References 34
Suggested Reading 35
Available Software & Reference Material 35
Appendix 1. Letter of Intent 37
Appendix 2. Rules and Guidelines 38
I. General Rules 38
II. Copyright 39
III. Schedule & Activity Sequences 39
IV. Proposal Requirements 39
V. Basis for Judging 40

4
1. Introduction
The A350-900 is the first Airbus A350 model and seats 314 passengers in a three-class cabin and
9-abreast layout. It has a standard design range target of 15,000 km (8,100 nmi). The −900 is
designed to compete with the Boeing 777-200ER and replace the Airbus A340-300. A −900R
variant, which has been proposed but not yet launched, would feature higher engine thrust and a
strengthened structure.
Figure 1: Rolls-Royce Trent XWB Engines on the Airbus A350
The range of the A350-900R is estimated to be 17,600 km (9,500 nmi), which would be boosted
to about 19,100 km (10,315 nmi) by these design improvements to compete with the Boeing 777-
200LR and be capable of non-stop flight from London-Heathrow to Auckland. Rolls-Royce
agreed with Airbus to supply a new variant of the Trent engine - correspondingly named the
Trent XWB - for the A350 XWB aircraft. After low-speed wind tunnel tests, Airbus froze the
static thrust at sea level for all three proposed variants in the 330–420 kN (74,000–94,000 lbf)
range in 2010. This Request for Proposal is aimed at future engines for this type of aircraft and
for this type of mission.

5
Figures 1 and 2 are from the Airbus and Rolls-Royce websites respectively and show the A350
XWB aircraft and the installed engine.
Figure 2: A Closer View of the Rolls-Royce Trent XWB Engine Installation
General characteristics
Capacity 314 passengers (3-class)
Length 66.89 m
Wing span 69.8 m
Height 17.05 m
Wing area 443 m²
Max. take-off weight 268 t
Power plant 2 × high bypass ratio turbofans; 374 kN each at take-off
Performance
Cruise speed Mach 0.85
Range 17,600 km
Service ceiling 12.19 km
Table 1: General Characteristics of the Airbus A350-XWR Aircraft

6
Some typical aircraft characteristics are given in Table 1. At take-off, the total thrust needed
from each of the two engines is 374 kN. Table 2 contains a summary of basic engine
characteristics, taken mostly from References 1 and 2. This data provides target values for the
baseline engine model. It is emphasized that the model is intended to be only a rough generic
representation of the Rolls-Royce Trent XWB purely for the purposes of this exercise!
Design Features of the Baseline Engine
Engine Type Axial, turbofan
Number of fan/booster/compressor stages 1, 8, 6
Number of HP/LP turbine stages 1, 2, 7
Combustor type Annular
Maximum net thrust at sea level 400.4 kN
Specific fuel consumption at cruise at Mach 0.85 & 12.19 altitude 18.00 g/kN.s
Overall pressure ratio at max. power 50.0
Bypass ratio 9.3
Max. envelope diameter 2.997 m
Max. envelope length 4.064 m
Dry weight less tail-pipe 5,445 kg
Table 2: Baseline Engine Design Targets: Basic Data, Overall Geometry & Performance
The actual baseline engine model is described in some detail in Section 3.
2. Design Objectives & Requirements
A new engine design is required for future versions of the Airbus A350 and Boeing 777 and
787, with an entry-into-service date of 2025. The new engine should include a geared
fan. An explanation should be given for why a gear is needed, along with the pros and
cons!
The current flight envelope ranges from take-off at static sea-level conditions to cruise at
12,190 m/Mach 0.85. This is to be retained for the new engine, so these two flight
conditions should be used as the principal design points for candidate engines. Maximum
potential take-off thrust should match that of the baseline engine described later and the
actual take-off thrust given in Table 1 should be assumed. The range target outlined in

7
the Introduction should be borne in mind and it is hoped that the endurance might be
extended with the new derivative engine by reducing the fuel consumption and
minimizing engine mass.
In the baseline engine model, a nominal power off-take of only 50 kW has been assumed.
This is too low and should be increased to 200 kW.
The generic baseline engine model should be used as a starting point. The core of the
engine (HP compressor, combustor & HP turbine) should be retained and a new LP/IP
system should be designed around it. The bypass ratio should be increased to 15 by using
a geared fan. The overall pressure ratio should be increased to 60.
A turbine inlet temperature of 1784K has been assumed in the baseline engine. In the
new design, based on the entry into service date, assume that advances in materials and
cooling technology permit a T4 limit of 1930K. The development and potential
application of carbon matrix composites is of particular interest. Based on research of
available literature, justify carefully your choices of any new materials, their location
within the engine and the appropriate advances in design limits that they provide.
Aerodynamic similarity should be used to ensure compatibility between conditions at the
IPC exit and HPC inlet. The new engine design should be optimized for minimum
engine mass & fuel burn, based on trade studies to determine the best combination of fan
& intermediate compressor pressure ratios, bypass ratio, overall pressure ratio and turbine
entry temperature. Values of these four major design parameters should be compatible
with those expected to be available in 2025 and the selected design limits should be
justified in the proposal.
For the gear, assume a mass of 0.0036 kg per hp transmitted.
Design proposals must include engine mass, engine dimensions, net thrust values,
specific fuel consumption, thermal and propulsive efficiencies at take-off (standard sea-
level conditions) and cruise. Details of the major flow path components must be given.
These include inlet, fan, IP Compressor, HP compressor, combustor, HP turbine, IP
turbine, LP turbine, exhaust nozzle, bypass duct, and the connecting ducts.
Since reduced specific fuel consumption does not necessarily lead to reduced fuel
consumption should the new engine be heavier, the fuel burn over an assumed mission
must be determined by dividing it into suitable segments in terms of time at altitude and
Mach number and summing the incremental fuel burn estimates. This should be done for
both the baseline engine and the new derivative to determine the improvement.

8
3. Baseline Engine Model
As stated previously, the baseline engine is a 3-spool, high bypass ratio turbofan. A generic
model has been generated from publically-available information (References 1 & 2) using
GasTurb12. Some details of the baseline model are given below to assist with construction of
your baseline case and to provide some indication of typical values of design parameters.
Figure 3: An Unmixed, High Bypass Ratio Turbofan Engine Schematic
with Calculation Stations & Nominal Cooling Flows
Figure 3 contains a general schematic with relevant station numbers.

9
3.1 Overall Characteristics
Major Design Parameters
In a turbofan engine, the four primary design variables are turbine entry temperature (T4), overall
pressure ratio (OPR or P3/P2), fan pressure ratio (FPR or P21/P2) and bypass ratio (BPR). We
usually differentiate between the fan pressure ratios in the core & bypass streams. In a 3-spool
engine an additional variable is introduced in the form of pressure ratio generated by the
intermediate pressure compressor, so an optimum IPC/HPC pressure ratio split must therefore be
determined.
Table 3: Basic Input
Table 3 is the “Basic Input” for the GasTurb12 model of the baseline engine and the five primary
design variables are specified. To generate an acceptable replica of the engine, a unique
combination of the remainder must be estimated iteratively using performance figures which are
provided – namely the net thrust (FN) and specific fuel consumption (sfc) at cruises conditions -
as targets. Since the sfc target is not at the engine design point, this can only be checked

10
periodically once what is thought to be a satisfactory design point solution has first been
obtained.
Table 3 also contains some of the secondary inputs, while the remainder are addressed below.
The first row of Table 3 assumes negligible total pressure loss between the inlet leading edge and
the fan face. The inner and outer fan pressure ratios are then selected separately; there is more
blade speed at the fan tip than at its hub, so the inner & outer fan pressure ratios have been set at
1.4 & 1.43 respectively – fairly aggressive but not unreasonable for a modern single-stage
machine. A zero total pressure loss is then accounted for in the duct between the fan and the IP
compressor or booster. This is probably optimistic but not too much so, as the prevailing Mach
number is quite low. Knowing that the required overall pressure ratio is 50.0, results in a
pressure ratio across the remainder of the compression system of 35.714, allowing for losses.
This is distributed between the booster and the HP compressor with 6.3 across the former (over 8
stages) and 5.76 across the latter (over 6 stages). A 2.5% total pressure loss is assumed in the
bypass duct. Inter-turbine duct losses of 0.8% and zero have been used – again somewhat
optimistic!
Continuing with the input description, the design bypass ratio was set at 9.3. A value of 1783.33
K for the turbine exit temperature was taken as being reasonable for this engine with limited
cooling capacity and an expected long life for the HP turbine (say 5,000 hours). The temperature
is a guessed value as, understandably, engine manufacturers do not reveal such critical
information. In fact, this value of T4 was the result of an iterative process that involved
turbomachinery efficiencies and the target thrust. The next four parameters relate to the primary
combustor; they are all fairly conventional values by modern standards. The burner “part load
constant” is an element in the calculation of burner efficiency that is discussed in the GasTurb12
User Guide in Reference 3. Without expert knowledge, this is best left alone! The remaining
parameters in Table 3 may be considered as secondary influences and are discussed briefly
below.
Secondary Design Parameters
Cooling Air: Mention has already been made of bleed and cooling air flows – the
secondary flows. Only the overboard bleed is listed in Table 3 (although this is in fact
zero), however the secondary flows indicated in Figure 2 have been set via another “air
system” tab on the input screen as fractions of W25, the HP compressor entry flow.
Pressure Losses: A number of total pressure losses, mentioned earlier, are also specified
in Table 3 by inserting the appropriate pressure ratios across the inter-compressor duct,
the inter-turbine duct, the mixer and the primary combustor.
Turbomachinery Efficiencies: Efficiencies of the fan, HP compressor, HP turbine and
LP turbine are entered via their respective tabs on the input screen. The values are not
listed specifically in Table 3, but may be reviewed in the output summary presented later
in Table 4. The designer has the choice of either isentropic or polytropic values, so he or
she should be certain of their applicability and their definitions! Both values appear in
11
the output summary in Table 4. However, another option is available that has been used
here for both compressors & fan and turbines. It allows GasTurb12 to estimate turbine
efficiencies from data supplied – via values of stage loading and flow coefficients. For
turbines these values are used in a Smith Chart (Reference 4), assuming an equal work
spilt between stages. It is recommended that either this be used or initial values be taken
from Table 4.
Power Off-take: All engines have power extracted – in the Trent XWB it is taken from
the IP spool via a bevel gear and a tower shaft that passes through an enlarged vane or
strut in the frame between the IP and HP compressors. This is often preferred to the use
of a separate auxiliary power unit, depending on how much power is required for
airframe use. In the application currently under consideration, considerable auxiliary
power may be needed for avionics and passenger equipment and this usage is growing
rapidly in modern aircraft. We have selected a nominal power off-take of 50 kW from
our baseline engine but 200kW has been requested in Design Objectives in Section 2.
A limited study has been made of the influence of a number of secondary parameters and it was
determined that the default values present in the GasTurb12 generic model should be retained,
based on the known expertise of the author of the code.
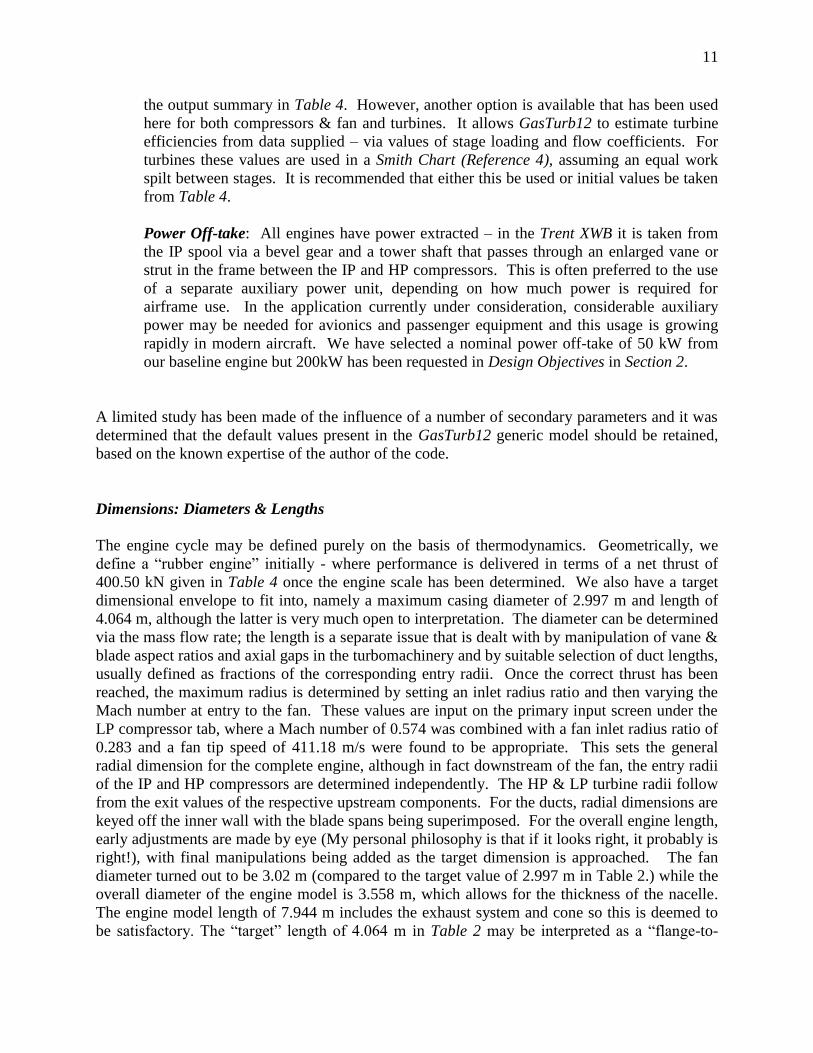
Dimensions: Diameters & Lengths
The engine cycle may be defined purely on the basis of thermodynamics. Geometrically, we
define a “rubber engine” initially - where performance is delivered in terms of a net thrust of
400.50 kN given in Table 4 once the engine scale has been determined. We also have a target
dimensional envelope to fit into, namely a maximum casing diameter of 2.997 m and length of
4.064 m, although the latter is very much open to interpretation. The diameter can be determined
via the mass flow rate; the length is a separate issue that is dealt with by manipulation of vane &
blade aspect ratios and axial gaps in the turbomachinery and by suitable selection of duct lengths,
usually defined as fractions of the corresponding entry radii. Once the correct thrust has been
reached, the maximum radius is determined by setting an inlet radius ratio and then varying the
Mach number at entry to the fan. These values are input on the primary input screen under the
LP compressor tab, where a Mach number of 0.574 was combined with a fan inlet radius ratio of
0.283 and a fan tip speed of 411.18 m/s were found to be appropriate. This sets the general
radial dimension for the complete engine, although in fact downstream of the fan, the entry radii
of the IP and HP compressors are determined independently. The HP & LP turbine radii follow
from the exit values of the respective upstream components. For the ducts, radial dimensions are
keyed off the inner wall with the blade spans being superimposed. For the overall engine length,
early adjustments are made by eye (My personal philosophy is that if it looks right, it probably is
right!), with final manipulations being added as the target dimension is approached. The fan
diameter turned out to be 3.02 m (compared to the target value of 2.997 m in Table 2.) while the
overall diameter of the engine model is 3.558 m, which allows for the thickness of the nacelle.
The engine model length of 7.944 m includes the exhaust system and cone so this is deemed to
be satisfactory. The “target” length of 4.064 m in Table 2 may be interpreted as a “flange-to-
12
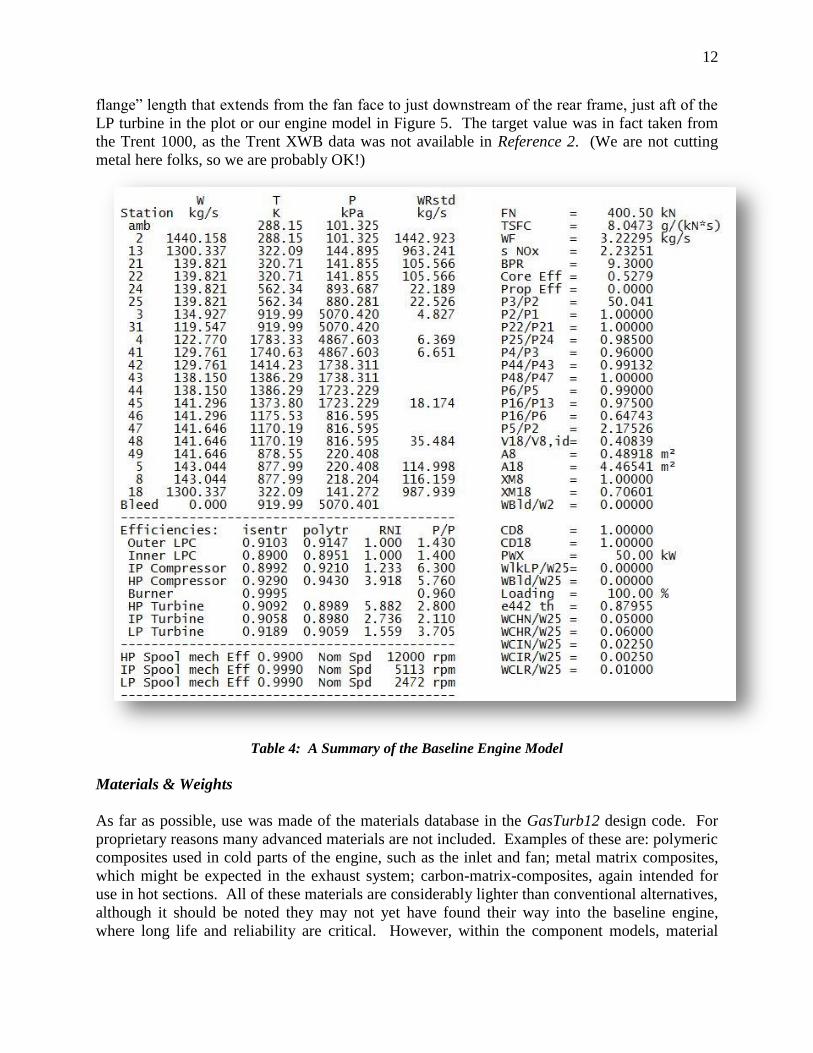
flange” length that extends from the fan face to just downstream of the rear frame, just aft of the
LP turbine in the plot or our engine model in Figure 5. The target value was in fact taken from
the Trent 1000, as the Trent XWB data was not available in Reference 2. (We are not cutting
metal here folks, so we are probably OK!)
Table 4: A Summary of the Baseline Engine Model
Materials & Weights
As far as possible, use was made of the materials database in the GasTurb12 design code. For
proprietary reasons many advanced materials are not included. Examples of these are: polymeric
composites used in cold parts of the engine, such as the inlet and fan; metal matrix composites,
which might be expected in the exhaust system; carbon-matrix-composites, again intended for
use in hot sections. All of these materials are considerably lighter than conventional alternatives,
although it should be noted they may not yet have found their way into the baseline engine,
where long life and reliability are critical. However, within the component models, material
13
densities can be modified independently of the database and I have taken advantage of this
feature in some cases where I believe that “advanced” materials of lower density are appropriate.
Use has also been made of the materials data in Reference 5, interpolating and extrapolating
where necessary.
In GasTurb12 component weights are calculated by multiplying the effective volumes by the
corresponding material densities. Of course, only the major elements which are designed
directly are weighed and there are many more constituents. Nuts, bolts, washers, seals and other
much larger elements such as fuel lines, oil lines, pumps and control systems still must be
accounted for. In the engine industry, this is done usually, at the preliminary design stage, by the
application of a multiplier or adder whose value is based on decades of experience. In general, a
multiplication factor of 1.3 is recommended in the GasTurb12 manual, but for an engine as large
as the Trent XWB I reduced this to a “net mass factor” of 1.15 in Table 5 mainly because it got
me closer to the gross engine weight I was looking for! The total mass of the engine shown in
Table 5 (5,576.61 kg) is 2.4% over the 5,445 kg target in Table 2, but it should be remembered
that the “tail pipe” is not accounted for in the latter and in our model the core nozzle weighs
110.27 kg when the mass factor has been applied. Conveniently, this accounts for most of the
discrepancy!
A summary of the baseline engine model is presented in Table 4 and Table 5 is a more detailed
“Overall Output Table”.
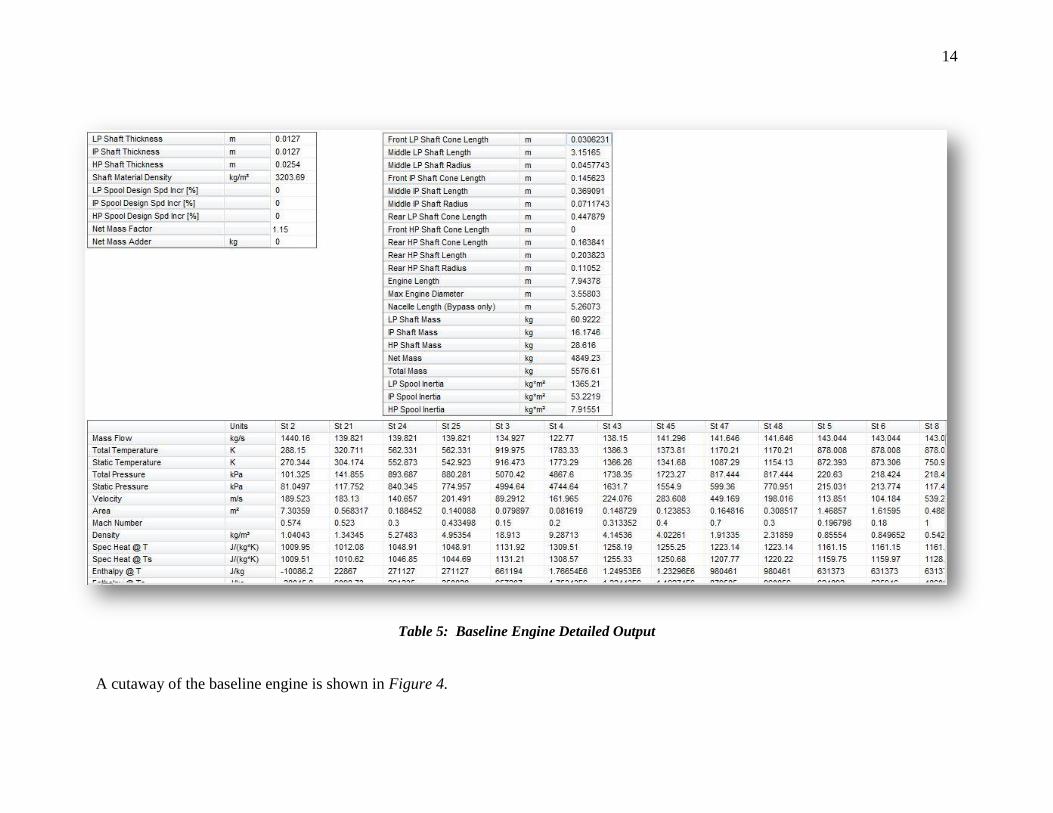
14
Table 5: Baseline Engine Detailed Output
A cutaway of the baseline engine is shown in Figure 4.
15
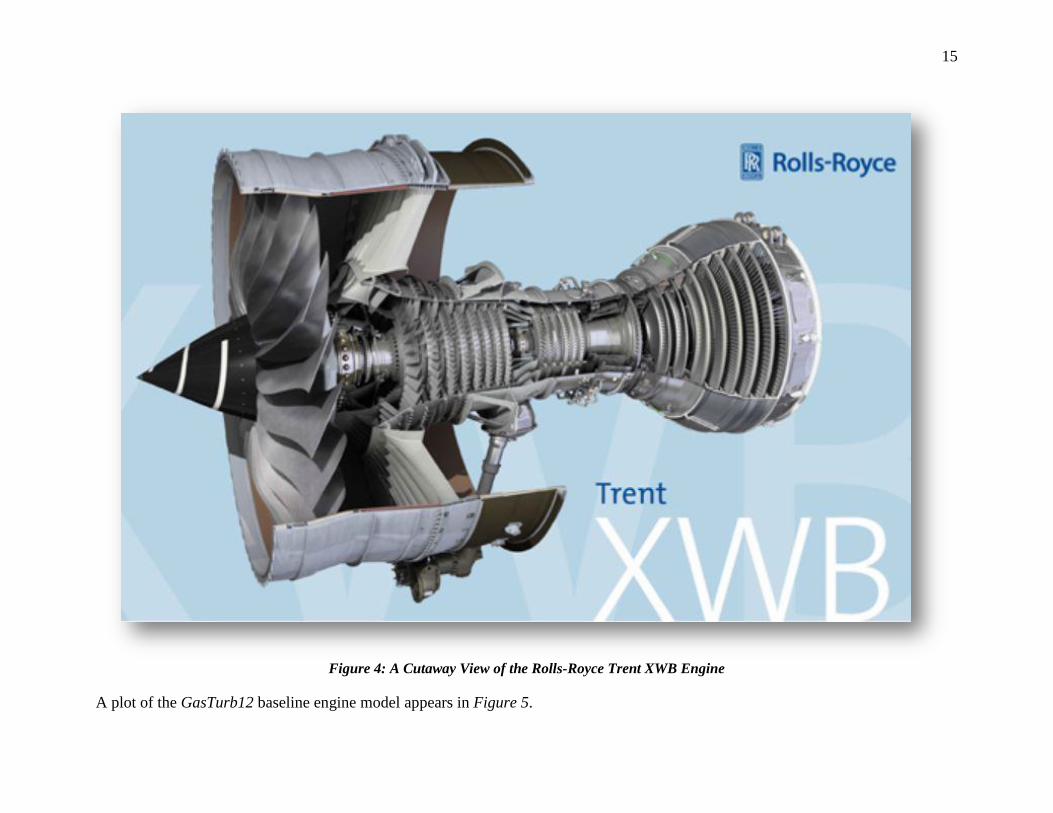
Figure 4: A Cutaway View of the Rolls-Royce Trent XWB Engine
A plot of the GasTurb12 baseline engine model appears in Figure 5.

16
Figure 5: GasTurb12 Model of the Rolls-Royce Trent XWB - the Baseline Engine
Some details of the component models now follow.

17
3.2 Inlet
The inlet is designed with a conical center body (Figure 5). In practice, a single-stage fan can be
cantilevered from a bearing located in the main frame of the engine. The outer diameter of the
inlet has been determined from that of the fan.
Table 6: Inlet Design
Pertinent characteristics of the inlet are shown in Table 6. At 109.725 kg, the inlet is fairly light
and this is because, based on the density, we have taken a typical Ti-Al alloy as our choice of
materials. It is noteworthy that the GasTurb “inlet” is merely the portion of the casing (plus
center body) immediately upstream of the fan. The GasTurb12 model begins at the “upstream
flange”, which is located further forward of the central cone than shown in the real engine in
Figure 4.
3.3 Fan
Table 7: Fan: Detailed Overview

18
The fan characteristics are given in Tables 7 & 8. The radius ratio and inlet Mach number are of
particular interest because, when taken with mass flow rate, they define the fan tip radius. Based
on tip radius, the blade tip speed sets the rotational speed of the LP spool. The value of corrected
flow per unit area (197.18 kg/m2 or 40.37 lbm/ft
2) is fairly conventional and corresponds to the
input value of Mach number (0.574).
Table 8: Fan General Output
On September 12, 2014 three new parameters were added to the LPC input of GasTurb12 to
control the inlet duct to the IPC. The new inputs are indicated in red in Table 8. If necessary, an
update to the code should be acquired by users.

19
3.4 Intermediate-Pressure Compressor
Inputs for the intermediate pressure compressor are provided in Tables 7 & 8. To maintain
access to the engine geometry and plot, it may be necessary to s switch to the “efficiency known”
option and insert the estimated isentropic value.
Table 7: Intermediate Compressor - Detailed Overview
Table 9: Intermediate Compressor - General Output
20
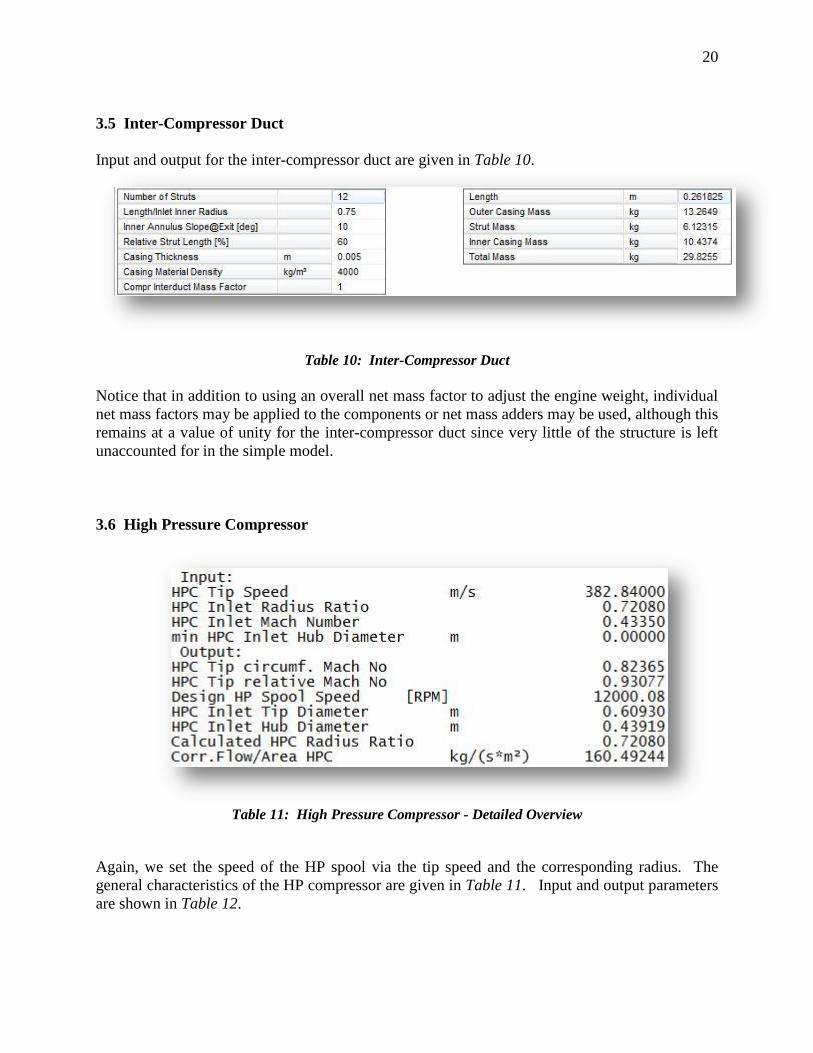
3.5 Inter-Compressor Duct
Input and output for the inter-compressor duct are given in Table 10.
Table 10: Inter-Compressor Duct
Notice that in addition to using an overall net mass factor to adjust the engine weight, individual
net mass factors may be applied to the components or net mass adders may be used, although this
remains at a value of unity for the inter-compressor duct since very little of the structure is left
unaccounted for in the simple model.
3.6 High Pressure Compressor
Table 11: High Pressure Compressor - Detailed Overview
Again, we set the speed of the HP spool via the tip speed and the corresponding radius. The
general characteristics of the HP compressor are given in Table 11. Input and output parameters
are shown in Table 12.

21
Table 12: High Pressure Compressor - General Output

22
3.7 Combustor
A fairly conventional annular combustor is used and details are given in Table 13. The high
density of its material corresponds to the necessary thermal properties. The combustor is a major
structural component, linked closely to the HP turbine first vane assembly.
Table 13: Combustor
3.8 High-Pressure Turbine
Table 14: High Pressure Turbine – Basis for Efficiency Estimate
As stated in Section 3.1, the efficiency of the high pressure turbine was estimated by GasTurb12
on the basis of the data shown in Table 14, which is made available once that efficiency option is
selected. As a result of that selection, the details of the HP turbine in Table 14 appear.

23
Table 15: HPT Summary
A general summary of the HP turbine is given in Table 16, followed by the velocity diagrams
and Smith Chart in Figure 6.

24
Table 16: High Pressure Turbine – General Output
Figure 6: High Pressure Turbine Velocity Diagrams & Smith Chart
25
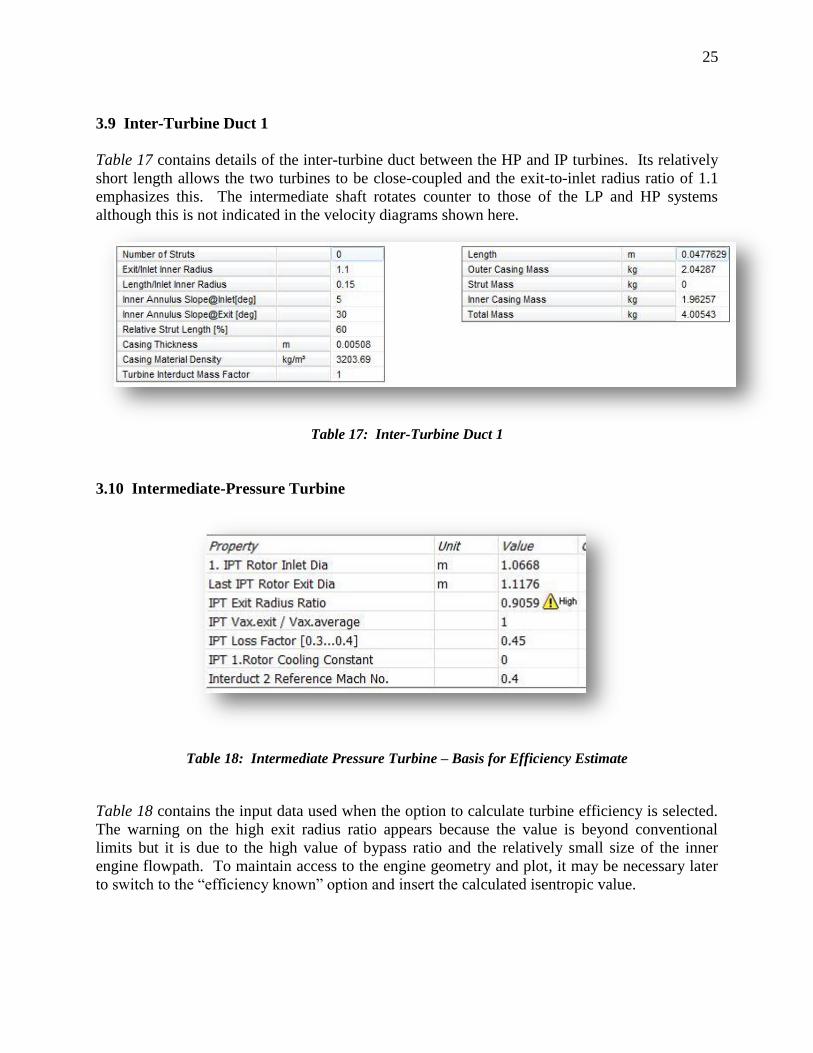
3.9 Inter-Turbine Duct 1
Table 17 contains details of the inter-turbine duct between the HP and IP turbines. Its relatively
short length allows the two turbines to be close-coupled and the exit-to-inlet radius ratio of 1.1
emphasizes this. The intermediate shaft rotates counter to those of the LP and HP systems
although this is not indicated in the velocity diagrams shown here.
Table 17: Inter-Turbine Duct 1
3.10 Intermediate-Pressure Turbine
Table 18: Intermediate Pressure Turbine – Basis for Efficiency Estimate
Table 18 contains the input data used when the option to calculate turbine efficiency is selected.
The warning on the high exit radius ratio appears because the value is beyond conventional
limits but it is due to the high value of bypass ratio and the relatively small size of the inner
engine flowpath. To maintain access to the engine geometry and plot, it may be necessary later
to switch to the “efficiency known” option and insert the calculated isentropic value.
26
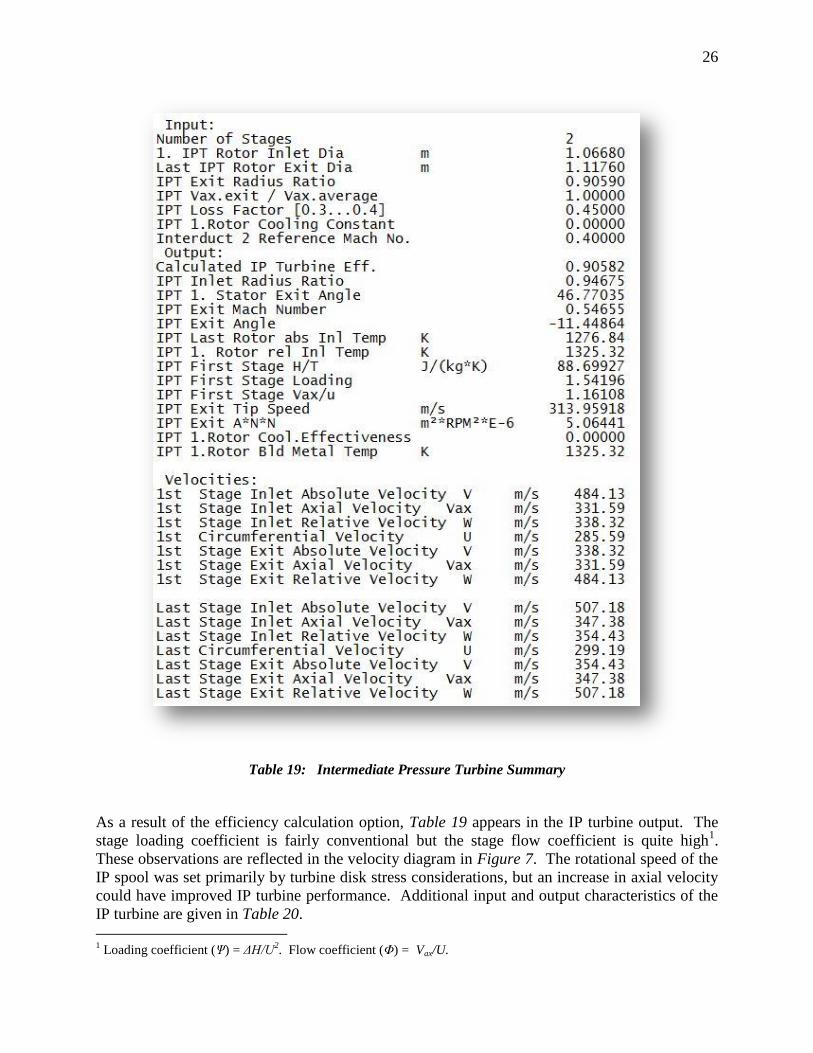
Table 19: Intermediate Pressure Turbine Summary
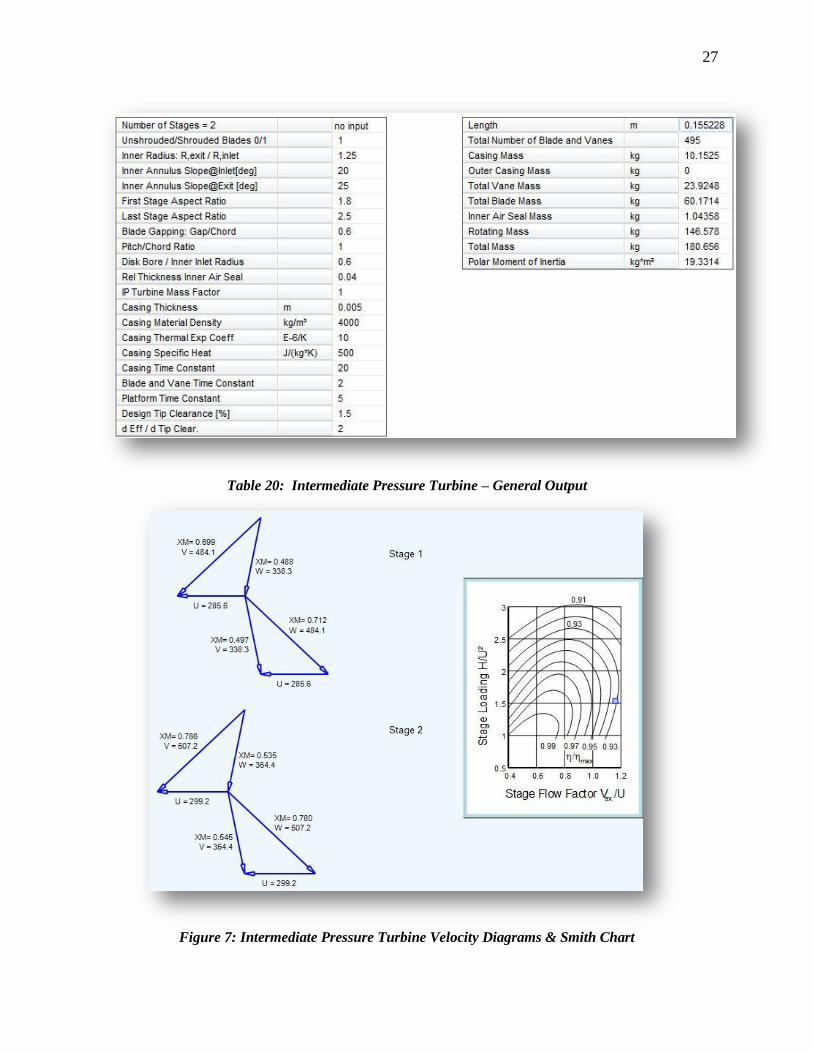
As a result of the efficiency calculation option, Table 19 appears in the IP turbine output. The
stage loading coefficient is fairly conventional but the stage flow coefficient is quite high1.
These observations are reflected in the velocity diagram in Figure 7. The rotational speed of the
IP spool was set primarily by turbine disk stress considerations, but an increase in axial velocity
could have improved IP turbine performance. Additional input and output characteristics of the
IP turbine are given in Table 20.
1 Loading coefficient (Ψ) = ΔH/U
2. Flow coefficient (Φ) = Vax/U.
27
Table 20: Intermediate Pressure Turbine – General Output
Figure 7: Intermediate Pressure Turbine Velocity Diagrams & Smith Chart

28
3.11 Inter-Turbine Duct 2
Table 21: Inter-Turbine Duct 2
Table 21 contains input and output information for the second inter-turbine duct between the IP
and LP turbines. The exit/inlet radius ratio increases the radial location of the LP turbine and
results in higher blade speeds, lower loading coefficients and hence improved efficiencies.
3.12 Low-Pressure Turbine
Characteristics of the low pressure turbine are presented in Tables 22 - 24 and Figure 8. Figure
8 contains velocity diagrams for the first and last stages. The flared nature of the LP turbine
flowpath ensures that meanline radii are maximized, stage loading coefficients are minimized
and stage efficiencies are fairly. However, it may be seen from Figure 8 that the common design
point for all seven stages is too far to the left on the Smith Chart due mainly to the high mean
blade speed and improvements in the form of higher efficiency and smaller disks could be
obtained by reducing rpm. It should be noted that the efficiency contours in Figure 8 (and
Figure 7 & 9) are expressed as fractions of the maximum value on the chart! The true value of
the average stage efficiency is 91.89%, which corresponds to the value in the engine
performance summary in Table 4.
Table 22: Basis for LP Turbine Calculated Efficiency

29
Table 23: LPT Summary

30
Table 24: Low Pressure Turbine: General Output
Figure 8: Low Pressure Turbine Velocity Diagrams & Smith Chart
31
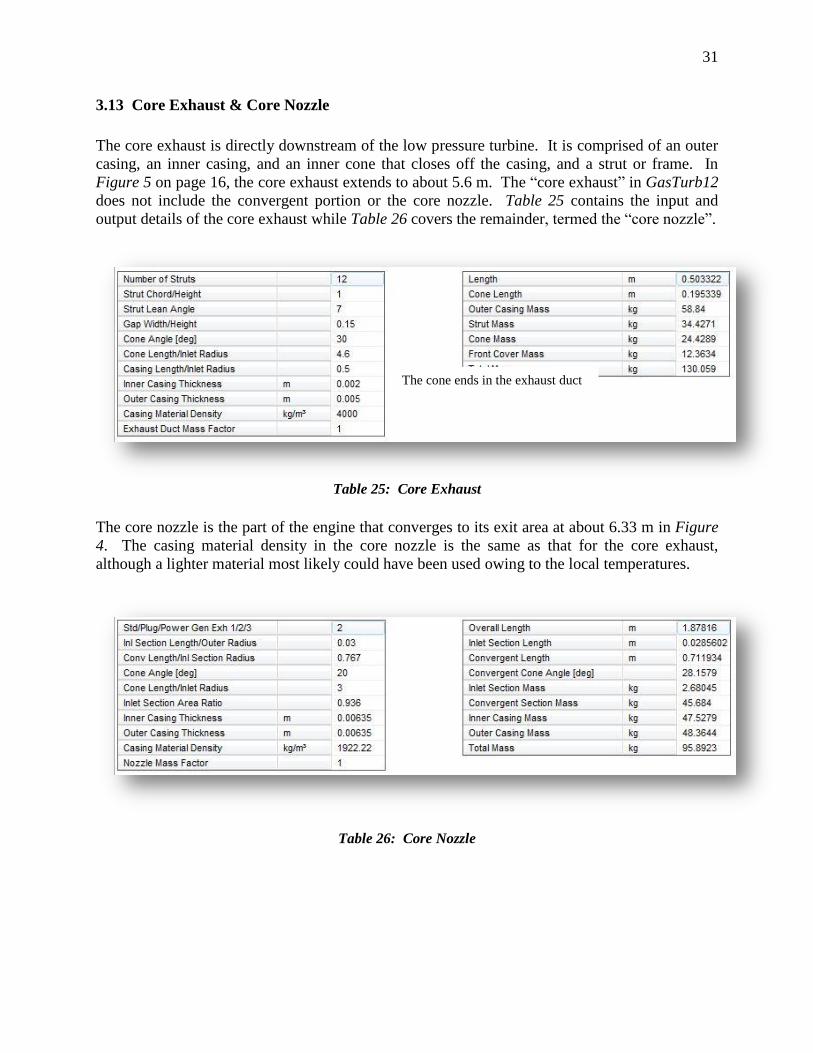
3.13 Core Exhaust & Core Nozzle
The core exhaust is directly downstream of the low pressure turbine. It is comprised of an outer
casing, an inner casing, and an inner cone that closes off the casing, and a strut or frame. In
Figure 5 on page 16, the core exhaust extends to about 5.6 m. The “core exhaust” in GasTurb12
does not include the convergent portion or the core nozzle. Table 25 contains the input and
output details of the core exhaust while Table 26 covers the remainder, termed the “core nozzle”.
Table 25: Core Exhaust
The core nozzle is the part of the engine that converges to its exit area at about 6.33 m in Figure
4. The casing material density in the core nozzle is the same as that for the core exhaust,
although a lighter material most likely could have been used owing to the local temperatures.
Table 26: Core Nozzle
The cone ends in the exhaust duct
32
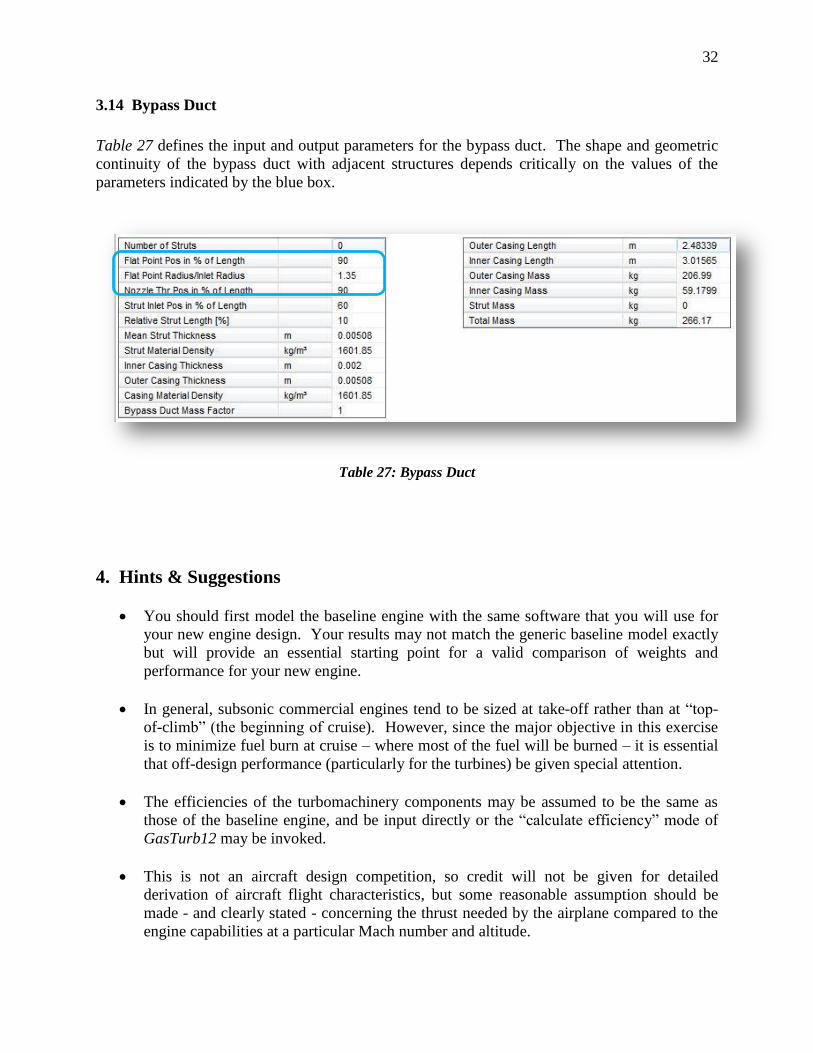
3.14 Bypass Duct
Table 27 defines the input and output parameters for the bypass duct. The shape and geometric
continuity of the bypass duct with adjacent structures depends critically on the values of the
parameters indicated by the blue box.
Table 27: Bypass Duct
4. Hints & Suggestions
You should first model the baseline engine with the same software that you will use for
your new engine design. Your results may not match the generic baseline model exactly
but will provide an essential starting point for a valid comparison of weights and
performance for your new engine.
In general, subsonic commercial engines tend to be sized at take-off rather than at “top-
of-climb” (the beginning of cruise). However, since the major objective in this exercise
is to minimize fuel burn at cruise – where most of the fuel will be burned – it is essential
that off-design performance (particularly for the turbines) be given special attention.
The efficiencies of the turbomachinery components may be assumed to be the same as
those of the baseline engine, and be input directly or the “calculate efficiency” mode of
GasTurb12 may be invoked.
This is not an aircraft design competition, so credit will not be given for detailed
derivation of aircraft flight characteristics, but some reasonable assumption should be
made - and clearly stated - concerning the thrust needed by the airplane compared to the
engine capabilities at a particular Mach number and altitude.

33
The use of design codes from industrial or government contacts, that are not accessible to
all participating teams, is not allowed.
Even though the date for submission of Letters of Intent is stated as November 1, 2014 on
pages 37 and 39, it is recommended that teams who know that they will enter the
competition inform AIAA, ASME-IGTI or Dr. Ian Halliwell ([email protected])
as soon as possible, so that assistance may be given and access to design codes may be
arranged, where appropriate (See page 35).
Questions will be taken by volunteers from the AIAA Air Breathing Propulsion Technical
Group or the IGTI Aircraft Engines Technical Committee, whose contact information will be
provided to teams who submit a letter of intent.
5. Competition Expectations
The existing rules and guidelines for the Student Design Competition shall be observed and these
are provided in Appendix 2. In addition, the following specific suggestions are offered for the
event.
This is a preliminary engine design. It is not expected that student teams produce design
solutions of industrial quality, however it is hoped that attention will be paid to the practical
difficulties encountered in a real-world design situation and that these will be recognized and
acknowledged. If such difficulties can be resolved quantitatively, appropriate credit will be
given. If suitable design tools and/or knowledge are not available, then a qualitative description
of an approach to address the issues is quite acceptable.
In a preliminary engine design the following features must be provided:
Definition and justification of the mission and the critical mission point(s) that drive the
candidate propulsion system design.
Clear and concise demonstration that the overall engine performance satisfies the mission
requirements.
Documentation of the trade studies conducted to determine the preferred engine cycle
parameters such as fan pressure ratio, bypass ratio, overall pressure ratio, turbine inlet
temperature, etc.
An engine configuration with a plot of the flow path that shows how the major
components fit together, with comments on operability at different mission points.

34
A clear demonstration of design feasibility, with attention having been paid to
technology limits. Examples of some, but not all, velocity diagrams are important to
demonstrate viability of turbomachinery components.
Stage count estimates, again, with attention having been paid to technology limits.
Estimates of component performance and overall engine performance to show that the
assumptions made in the cycle have been achieved.
While only the preliminary design of major components in the engine flow path is expected to be
addressed quantitatively in the proposals, it is intended that the role of secondary systems such as
fuel & lubrication be given serious consideration in terms of modifications and how they would
be integrated in to the new engine design. Credit will be given for clear descriptions of how any
appropriate upgrades would be incorporated and how they would affect the engine cycle.
Each proposal should contain a brief discussion of any computer codes or Microsoft Excel
spreadsheets used to perform engine design & analysis, with emphasis on any additional special
features generated by the team.
Proposals should be limited to fifty pages, which will not include the
administrative/contents or the “signature” pages.
References
1. “Road Map: Rolls-Royce’s future turbofan strategy will leverage European, national and
company research.”
Aviation Week & Space Technology. August 25, 2014.
2. “Aerospace Source Book.”
Aviation Week & Space Technology. January 26, 2009.
3. “GasTurb 12: A Design & Off-Design Performance Program for Gas Turbines”
<http://www.gasturb.de>
Joachim Kurzke, 2012.
4. “A Simple Correlation of Turbine Efficiency”
S. F. Smith
Journal of the Royal Aeronautical Society. Volume 69. 1965.
5. “Aeronautical Vest Pocket Handbook”. Pratt & Whitney Aircraft. Circa 1980
35
Suggested Reading
1. “Gas Turbine Theory”
H.I.H Saravanamuttoo, G.F.C Rogers &.H. Cohen,
Prentice Hall. 5th
Edition 2001.
2. “Aircraft Engine Design”
J.D.Mattingly, W.H. Heiser, & D.H. Daley
AIAA Education Series. 1987.
3. “Elements of Propulsion – Gas Turbines and Rockets”
J.D. Mattingly.
AIAA Education Series. 2006.
4. “Jet Propulsion”
N. Cumpsty.
Cambridge University Press. 2000.
5. “Gas Turbine Performance”
P. Walsh & P. Fletcher.
Blackwell/ASME Press. 2nd
Edition, 2004.
6. “Fundamentals of Jet Propulsion with Applications”
Ronald D. Flack
Cambridge University Press. 2005.
7. “The Jet Engine”
Rolls-Royce plc. 2005.
8. “Aircraft Propulsion” 2nd
Edition.
Saeed Farokhi.
John Wiley & Sons Ltd. 2014.
Available Software & Additional Reference Material
GasTurb 12 is a comprehensive code for the preliminary design of propulsion and industrial gas
turbine engines (Reference 3). It encompasses design point and off-design performance, based
on extensive libraries of engine architectures and component performance maps, all coupled to
impressive graphics. A materials database and plotting capabilities enable a detailed engine
model to be generated, with stressed disks and component weights. A student license for this
code is available at a very low price directly from [email protected] strictly for academic work
only.
36
AxSTREAM is the first design & analysis code that permits the topic of propulsion and power
generation by gas & steam turbine to progress beyond velocity diagrams in the course of
university class. A suite of compressor and turbine modules cover the design steps from
meanline and streamline solutions to detailed design of airfoils. Use of this code is also
supported fully by excellent graphics. SoftInWay Inc. recently announced the availability of
AxSTREAM Lite to students that covers the design of turbines. However, an expanded license
will be provided to participants in the Undergraduate Team Engine Design Competition that also
includes fans and compressors for an appropriate time period prior to submission of proposals.
Once a Letter of Intent has been received, the names of team members will be
recognized as being eligible to be granted access to the AxSTREAM software.
Students must then apply to SoftInWay Inc. SoftInWay will not contact team
members.
GSP is NLR's (www.nlr.nl) primary gas turbine performance simulation tool
(www.GSPteam.com). It is a component based modeling environment based on a flexible object-
oriented architecture that allows modelers to simulate steady-state and transient performance of
virtually any gas turbine configuration using a user-friendly drag-and-drop interface. GSP has
been used for a variety of applications such as various types of off-design performance analysis,
emission calculations, control system design and diagnostics of both aircraft and industrial gas
turbines. All team managers or supervisors of the competing design teams are welcome to
request a free team license.
The offers above are subject to ITAR restrictions.

37
Appendix 1. Letter of Intent
Undergraduate Team Engine Design Competition 2014/15
Request for Proposal: An Ultra-High Bypass Ratio Turbofan Engine for the Future
Title of Design Proposal: _________________________________________________________
Name of School: _______________________________________________________________
Designer’s Name AIAA or ASME Graduation Date Degree
______________________ ______________ ______________ _________________
Team Leader
______________________ ______________ ______________ _________________ Team Leader E-mail
________________________ ________________ ________________ ___________________
________________________ ________________ ________________ ___________________
________________________ ________________ ________________ ___________________
________________________ ________________ ________________ ___________________
AIAA Foundation will act as the administrator for this competition.
In order to be eligible for the 2014/2015 Undergraduate Team Engine Design Competition, you
must complete this form and return it electronically to the AIAA Student Programs Coordinator,
Rachel Andino ([email protected]) before November 1, 2014, at AIAA Headquarters, as noted in
Appendix 2, Section III, “Schedule and Activity Sequences.”
Signature of Faculty Advisor Signature of Project Advisor Date
Faculty Advisor – Printed Project Advisor – Printed Date

38
Appendix 2. Rules and Guidelines
I. General Rules
1. All undergraduate AIAA or ASME branch or at-large Student Members are eligible and
encouraged to participate.
2. Teams will be groups of not more than four students.
3. An electronic copy of the report in MS Word or Adobe PDF format must be submitted on a
CD or DVD to AIAA Student Programs. Total size of the file(s) cannot exceed 60 MB, which
must also fit on 50 double spaced, 12 point font pages when printed. The file title should
include the team name and/or university. A “Signature” page must be included in the
report and indicate all participants, including faculty and project advisors, along with their
AIAA or ASME member numbers. Designs that are submitted must be the work of the
students, but guidance may come from the Faculty/Project Advisor and should be accurately
acknowledged. Graduate student participation in any form is prohibited.
4. Design projects that are used as part of an organized classroom requirement are eligible and
encouraged for competition.
5. More than one design may be submitted from students at any one school.
6. If a design group withdraws their project from the competition, the team chairman must notify
AIAA Headquarters immediately.
7. Judging will be in two parts.
First, the written proposals will be assessed by a judging panel comprised of members of
AIAA and IGTI organizing committees from the industrial and government communities.
Second, the best three teams will be invited to present their work to a second judging
panel at a special technical session. The in person presentation will either be at the ASME
TurboExpo in Montreal, Canada in June 2015 or the AIAA Propulsion and Energy Forum
in Orlando, FL in July 2015. The results of the presentations will be combined with the
earlier scores from the proposals to determine first, second and third places.
8. Certificates will be presented to the winning design teams for display at their university and a
certificate will also be presented to each team member and the faculty/project advisor. The
finishing order will be announced immediately following the three presentations.
Certificates and recognition in a press release will be the only prizes for this
competition. There will be neither prize money nor travel assistance to attend
the final presentation.

39
II. Copyright
All submissions to the competition shall be the original work of the team members.
Any submission that does not contain a copyright notice shall become the property of AIAA. A
team desiring to maintain copyright ownership may so indicate on the signature page but
nevertheless, by submitting a proposal, grants an irrevocable license to AIAA to copy, display,
publish, and distribute the work and to use it for all of AIAA’s current and future print and
electronic uses (e.g. “Copyright © 20__ by _____. Published by the American Institute of
Aeronautics and Astronautics, Inc., with permission.).
Any submission purporting to limit or deny AIAA licensure (or copyright) will not be eligible
for prizes.
III. Schedule & Activity Sequences
Significant activities, dates, and addresses for submission of proposal and related materials are as
follows:
A. Letter of Intent – November 1, 2014
B. Receipt of Proposal – April 1, 2015
C. Proposal evaluations completed - April 30, 2015
D. Round 2 Proposal Presentations & Announcement of Winners – June or July 2015. See
the website for updates as to location of the final presentation.
The finished proposal must be received at AIAA Headquarters on or before the date specified
above for the Receipt of Proposal (Item B).
IV. Proposal Requirements
A technical proposal is the most important criterion in the award of a contract. It should be
specific and complete. While it is realized that all of the technical factors cannot be included in
advance, the following should be included and keyed accordingly:
1. Demonstrate a thorough understanding of the Request for Proposal (RFP) requirements.
2. Describe the proposed technical approaches to comply with each of the requirements specified
in the RFP, including phasing of tasks. Legibility, clarity, and completeness of the technical
approach are primary factors in evaluation of the proposals.
3. Particular emphasis should be directed at identification of critical, technical problem areas.
Descriptions, sketches, drawings, systems analysis, method of attack, and discussions of new
techniques should be presented in sufficient detail to permit engineering evaluation of the
proposal. Exceptions to proposed technical requirements should be identified and explained.

40
4. Include tradeoff studies performed to arrive at the final design.
5. Provide a description of automated design tools used to develop the design.
V. Basis for Judging
Round 1: Proposal
1. Technical Content (35 points)
This concerns the correctness of theory, validity of reasoning used, apparent understanding and
grasp of the subject, etc. Are all major factors considered and a reasonably accurate evaluation of
these factors presented?
2. Organization and Presentation (20 points)
The description of the design as an instrument of communication is a strong factor on judging.
Organization of written design, clarity, and inclusion of pertinent information are major factors.
3. Originality (20 points)
The design proposal should avoid standard textbook information, and should show independence
of thinking or a fresh approach to the project. Does the method and treatment of the problem
show imagination? Does the approach show an adaptation or creation of automated design
tools?
4. Practical Application and Feasibility (25 points)
The proposal should present conclusions or recommendations that are feasible and practical, and
not merely lead the evaluators into further difficult or insolvable problems.
Round 2: Presentation
Each team will have 30 minutes to present a summary of its proposal to the judging panel and
answer questions. In addition to the categories above, the presentations will be assessed for
clarity, effectiveness and the ability to sell the teams’ ideas. Scores from the presentation will be
added to those from the proposal. The presentation score will be adjusted so that it is worth 30%
of the overall value.