Embed Size (px)
Citation preview

85
UNDERGRADUATE MATHEMATICS STUDENTS’ UNDERSTANDING OF THE CONCEPT OF FUNCTION
Caroline Bardini1, Robyn Pierce1, Jill Vincent1, Deborah King2
1Melbourne Graduate School of Education, The University of Melbourne, VIC 3010, Australia
2Department of Mathematics and Statistics, The University of Melbourne, VIC 3010, Australia e-mail: [email protected]
Abstract Concern has been expressed that many commencing undergraduate mathematics students have mastered skills without conceptual understanding. A pilot study carried out at a leading Australian university indicates that a significant number of students, with high tertiary entrance ranks, have very limited understanding of the concept of function, despite the emphasis it receives in the secondary mathematics curriculum. Whilst most students were familiar with families of functions, many were unable to give an appropriate definition or recognize whether a given graph or rule represents a function; and could not make correct connections between function graphs and tables of values.
Keywords: Algebra, Functions, Secondary School Mathematics, Undergraduate Mathematics
Abstrak Keprihatinan telah diungkapkan bahwa mulai banyak mahasiswa sarjana matematika telah menguasai keterampilan tanpa pemahaman konseptual. Sebuah penelitian yang dilakukan pada sebuah universitas terkemuka di Australia menunjukkan bahwa sejumlah besar mahasiswa, dengan peringkat masuk yang tergolong tinggi, memiliki pemahaman yang sangat terbatas terhadap konsep fungsi, meskipun penekanannya pada materi yang diterima mereka dalam kurikulum matematika sekolah menengah. Sementara sebagian besar mahasiswa yang akrab dengan keluarga fungsi, banyak yang tidak dapat memberikan definisi yang tepat atau mengenali apakah grafik yang diberikan atau aturan merupakan suatu fungsi; dan tidak bisa membuat hubungan yang benar antara fungsi grafik dan tabel nilai.
Kata Kunci: Aljabar, Fungsi, Matematika Sekolah Menengah, Mahasiswa Matematika
The notion of a function has been seen as a unifying concept both within mathematics and also
between mathematics and the real world. It is widely agreed that a strong understanding of the concept
of function is vital for students studying calculus. In later years of secondary schooling, much of the
mathematics curriculum is devoted to the study of calculus. It is the function that is the fundamental
object in calculus, and not just any function, but a continuous function, so to really understand
calculus, students need a sound understanding of functions. Research (see below) has shown that an
understanding of function develops over an extended period of time and that in the past many
undergraduate students demonstrated poorly developed notions of function. Much of this research was
conducted in the early 1990’s; since then two decades have passed but has the situation changed? The
research reported in this paper explores the conceptual understanding of functions held by current
students from a leading Australian university.

86 IndoMS-JME, Volume 5, No. 2, July 2014, pp. 85-107
In this section we will look at the history of the term ‘function’ and its definition as it is used in
mathematics. This review will also cover research on students’ misconceptions regarding functions
and various recommended pedagogical strategies including an emphasis on multiple representations.
History and Definition
The concept of function in mathematics dates back to at least the seventeenth century and has
evolved considerably over that time. In 1692, Leibniz used the term ‘function’ with respect to aspects
of curves such as the gradient at a point. Early in the 18th century Bernoulli used ‘function’ to describe
an expression made up of a variable and some constants: “One calls here Function of a variable a
quantity composed in any manner whatever of this variable and of constants” (cited in Kleiner, 1989,
p. 284). Kleiner notes that it was Euler who brought the concept to prominence by treating calculus as
a formal theory of functions. By 1748, Euler had refined his thinking on functions and wrote:
If … some quantities depend on others in such a way that if the latter are changed the
former undergo changes themselves then the former quantities are called functions of the
latter quantities. This is a very comprehensive notion and comprises in itself all the
modes through which one quantity can be determined by others. If, therefore, x denotes
a variable quantity then all the quantities which depend on x in any manner whatever or
are determined by it are called its function (cited in Kleiner, 1989, p. 288).
By the 19th century, new concepts of ‘function’ were developing, leading to Dirichlet’s 1837
definition:
y is a function of a variable x , defined on the interval a x b , if to every value of the
variable x in this interval there corresponds a definite value of the variable y . Also, it is
irrelevant in what way this correspondence is established (cited in Kleiner, 1989, p. 291).
By the early 20th century, discussions about the precise meaning of function and variable
resulted in 1939 to Bourbaki’s formal ordered pairs definition of function: a relation between ordered
pairs in which every first element has a unique second element.
Let E and F be two sets, which may or may not be distinct. A relation between a
variable element x of E and a variable element y of F is called a functional relation
in y if, for all x E , there exists a unique y F which is in the given relation with x .
We give the name of function to the operation which in this way associates with every
element x E the element y F which is in the given relation with x (cited in Kleiner,
1989, p. 299).

Bardini, et al., Undergraduate Mathematics Students’ … 87
This is often referred to as the Bourbaki definition or the Dirichlet-Bourbaki definition. A
typical current Australian school textbook definition would be worded: “We define a function as a
relation between two sets, called the domain and range, such that each element in the domain
corresponds to exactly one element in the range.”
Incomplete and Incorrect Understandings of Functions and Function Notation
Eisenberg (1992) notes that the mathematics education literature on functions can be divided
broadly into two groups of studies: those which promote the importance of teaching functions and
present specific pedagogical approaches, and those that focus on the difficulties students encounter in
understanding functions.
As noted by Kieran (1993), “in the process of generalizing the function definition,
mathematicians have banished the rule that was the essential idea of the function” (p. 191). Perhaps
not surprisingly, then, the difficulty that students have with the function concept may be due in part to
a mismatch between the definition of function that is presented to them and the nature of the tasks and
applications they are required to complete:
The concept of function can be defined in a formal symbolic way, almost without using
words… But at the very moment the notion is applied in a context, mathematical or
mathematized, informal language is being used and this informal language brings about
meanings that transcend the mere logic of the definition (Sierpinska, 1992, p. 29).
Vinner and Dreyfus (1989) note that although a version of the Bourbaki definition is frequently
presented in textbooks and curricula, “the examples used to illustrate and work with the concept are
usually, sometimes exclusively, functions whose rule of correspondence is given by a formula.”
Consequently, when asked to give a definition of function, students would be likely to give a
Bourbaki-type definition, but their work on identification or construction tasks might be based on the
formula conception.
Vinner and Dreyfus (1989) suggest that students do not necessarily use the definition when
deciding whether a given mathematical object is a function, deciding instead on the basis of a ‘concept
image’, that is, the set of all the mental pictures associated in the student’s mind as a result of his or
her experience with examples and non-examples of functions. Vinner and Dreyfus note that “the set of
mathematical objects considered by the student to be examples of the concept is not necessarily the
same as the set of mathematical objects determined by the definition” (p. 356).
Tall and Bakar (1991) report on a study with twenty eight students (aged 16-17) who had
studied the notion of a function during the previous year and had used functions in calculus, but with
little emphasis on aspects such as domain and range. The students were set the task: “Explain in a
sentence or so what you think a function is. If you can give a definition of a function then do so” (p.
105). Tall and Bakar note that none of the students gave satisfactory definitions, but all gave

88 IndoMS-JME, Volume 5, No. 2, July 2014, pp. 85-107
explanations, including the following:
• a function is like an equation which has variable inputs, processes the inputted number and gives
an output.
• a process that numbers go through, treating them all the same to get an answer.
• an order which plots a curve or straight line on a graph.
• a term which will produce a sequence of numbers, when a random set of numbers is fed into the
term.
• a series of calculations to determine a final answer, to which you have submitted a digit.
• a set of instructions that you can put numbers through. (p. 105)
Tall and Bakar note that most of the students
expressed some idea of the process aspect of function – taking some kind of input and
carrying out some procedure to produce an output – but no one mentioned that this only
applies to a certain domain of inputs, or that it takes a range of values. Many used
technical mathematical words, such as term, sequence, series, set, in an everyday sense,
intimating potential difficulties for both students and teachers in transferring
mathematical knowledge (p. 105).
Tall and Bakar (1991) claim that even though curriculum documents include the definition of
the function concept, the definition “is not stressed and proves to be inoperative, with student
understanding of the concept reliant on properties of familiar prototype examples” (p. 212) with the
result that students have many misconceptions. Tall and Bakar note, for example, that 44% of a
sample of 109 students starting a university mathematics course considered a constant function is not a
function in at least one of its graphical or algebraic forms, usually because y is independent of the
value of x . Furthermore, 62% of the students thought that a circle is a function. Blume and Heckman
(1997) comment that despite the recognised importance of multiple representations in secondary
school mathematics, many students do not understand the connections among these representations.
Carlson (1998) undertook a study which included high achieving students who had either just
completed college algebra or, at least, some calculus subjects. The college algebra course had included
an introduction to functions. Carlson found that many of the students did not understand function
notation, had difficulty understanding the role of the independent and dependent variables in a given
functional relationship, could not explain what is meant by expressing one quantity as a function of
another, and were unable to speak the language of functions. Students reported that they replaced
understanding with memorisation in the absence of time for reflecting and questioning.
Oehrtman, Carlson and Thompson (2008), referring to Carlson’s 1998 study, reported that many
students believed that constant functions (e.g., 5y ) were not functions because they do not vary.
When asked to give an example of a function all of whose output values are equal to each other, “only

Bardini, et al., Undergraduate Mathematics Students’ … 89
7% of A-students in college algebra could produce a correct example, and 25% of A-students in
second semester calculus produced x = y as an example.” (p. 151). Oehrtman, Carlson and Thompson
also found that many of these students were unable to correctly calculate f x a given a function
f x , with 43% of the college algebra students attempting to find f x a by adding a onto the
end of the expression for f x rather than substituting x a into the function. When asked to
explain their thinking, students typically justified their answers in terms of a memorised procedure
rather than thinking of x a as an input to the function. Oehrtman, Carlson and Thompson also note
that students typically memorise without understanding that the graph of a function g given by
g x f x a is shifted to the left of the graph of f “but asking them to discover or interpret this
statement as meaning ‘the output of g at every x is the same as the output of f at every x a ’ will
give them a more powerful way to understand this idea” (p. 161).
Oehrtman, Carlson and Thompson (2008) found that students often confused the visual
attributes of a real-world situation with similar attributes of the graph of a function that models the
situation. School mathematics tends to focus on special features of graphs, for example, turning points,
points of inflection and gradient. Function models of real-world situations sometimes exhibit similar
features, for example, a road going up a hill, a curve in a road, or a vehicle slowing down. Oehrtman,
Carlson and Thompson note that the superficial similarity of these features of graphs and the real-
world setting often leads to confusion, even for students with a strong understanding of functions.
They assert that
students are thinking of the graph of a function as a picture of a physical situation rather
than as a mapping from a set of input values to a set of output values. Developing an
understanding of function in such real-world situations that model dynamic change is an
important bridge for success in advanced mathematics (p. 154).
Norman (1992) considers that teachers’ mathematical knowledge and mathematical pedagogical
knowledge is crucial to an understanding of the learning and teaching of the function concept.
Reporting on a study with ten teachers working towards a master’s degree in mathematics education,
Norman notes that teachers, even those who were “more mathematically experienced”, exhibited gaps
in their understanding of function. Most of the teachers could provide an informal description of
function that would be useful for explaining to someone who did not understand the concept.
However, the formal definition of function caused considerable confusion, as demonstrated by the
response of one teacher:

90 IndoMS-JME, Volume 5, No. 2, July 2014, pp. 85-107
It’s each member of the domain matches with a unique element of the range … or vice
versa … So I don’t ever use that; I don’t like it. No, it doesn’t make sense to me … Each
member of the domain does not match with a unique member of the range [referring to
the set {(1, 3), (2, 3), (3, 3)}]; but it does vice versa, so each member of the range
matches with a unique member of the domain (p. 224).
In general these teachers had not built strong connections between their informal definitions of
function and what they viewed as the formal mathematical definition. They could readily identify
standard examples of functions, “but in more complex situations sometimes rely on inappropriate (and
incorrect) tests of functionality” (p. 229). Norman notes that for some of the teachers, image concepts
were “almost exclusively related to expressions of the form y f x . One teacher, for example,
when asked if x were a function of y for the equation 24x y , replied: “No. y is a function of x .
Except in this case it’s not one.” (p. 225).
Cooney and Wilson (1993) note that there are many aspects of teachers’ thinking about
functions that warrant research – for example, do teachers view functions as graphs, rules, algebraic
expressions, or sets of ordered pairs; how do their conceptions influence their teaching of functions; do
they regard functions as a unifying concept within mathematics? After observing a teacher ask
students to explain what is meant by a linear function then accept an example rather than a definition,
Cooney and Wilson question whether the teacher was aware of the difference in cognitive demand
when asking for a definition or an example; whether she was aware of the range of representations that
could have been used to assess the students’ understanding of the concept of linear functions; to what
extent her understanding of functions was contributing to how she made decisions during the lesson.
Carlson (1998) suggests that
curriculum developers underestimate the complexity of acquiring an understanding of the
essential components of the function concept… and that current curricula provide little
opportunity for developing the ability to: interpret and represent covariant aspects of
functions, understand and interpret the language of functions, interpret information from
dynamic functional events (p. 142).
She asserts that “the pace at which content is presented, the context in which it is presented as
well as the types of activities in which we engage students have an enormous impact on what students
know and what they can do” (p. 143). Clement (2001) stresses the need for “developing a concept
image that is well aligned with the mathematical definition” (p. 748).

Bardini, et al., Undergraduate Mathematics Students’ … 91
Suggestions for Appropriate Pedagogy
Vinner and Dreyfus (1989) assert that
…at least a doubt should be raised whether the Dirichlet-Bourbaki approach to the
function concept should be taught in courses where it is not intensively needed. If
discontinuous functions, functions with split domains, functions with exceptional points,
or other strange functions are needed, we think that they should be introduced as cases
extending the students’ previous experience. The formal definition should be only a
conclusion of the various examples introduced to the students (p. 365).
Sierpinska (1992) asserts that “the pedagogical conclusion… is that an early introduction of the
general definition of function does not make sense; it will be either ignored or misunderstood.” (p. 48).
For students to understand the concept of function, Sierpinska suggests that “the notion of function can
be regarded as a result of human endeavor to come to terms with changes observed and experienced in
the surrounding world” (p. 31) and that introducing students to the concept of functions as models of
relationships may overcome some of the difficulties associated with the concept.
Knuth (2000) claims that students who develop a deep understanding of the notion of function
know which representation is most appropriate for use in different contexts and are able to move
backwards and forwards between different representations. Dreyfus (2002) asserts that to be
successful in mathematics, students need rich mental representations of concepts, that is, many linked
aspects of the concept. He observes that “poor mental images of the function concept … are typical
among beginning college students, who think only in terms of formulas when dealing with functions”
(p. 32).
The use of CAS and graphics calculators to enhance student learning by carefully linking
representations has been a common theme in recent literature (see for example Zbeik et al., 2007).
Conjectures that the use of multiple representations is key to promoting students’ understanding of
functions is supported by research data (see for example, Kieran & Yerushalmy, 2004). Linking
representations and gaining ‘representational fluency’, where students can interpret mathematical
ideas in distinct representations, then move between them, supports the development of robust
conceptual schema. Oehrtman, Carlson and Thompson (2008) point out that a strong procedural
emphasis, where students think about functions only in terms of symbolic manipulations and
procedural techniques, has not been effective for building a deep conceptual understanding of
functions. It seems that such approaches are still prevalent despite the advice based on earlier research.
Our research examines the understanding of functions of students who have met the
requirements to be permitted to study first year University mathematics. It therefore will provide some
insights into the efficacy of their school mathematics studies in establishing a sound understanding of
the concept of a function.
92 IndoMS-JME, Volume 5, No. 2, July 2014, pp. 85-107
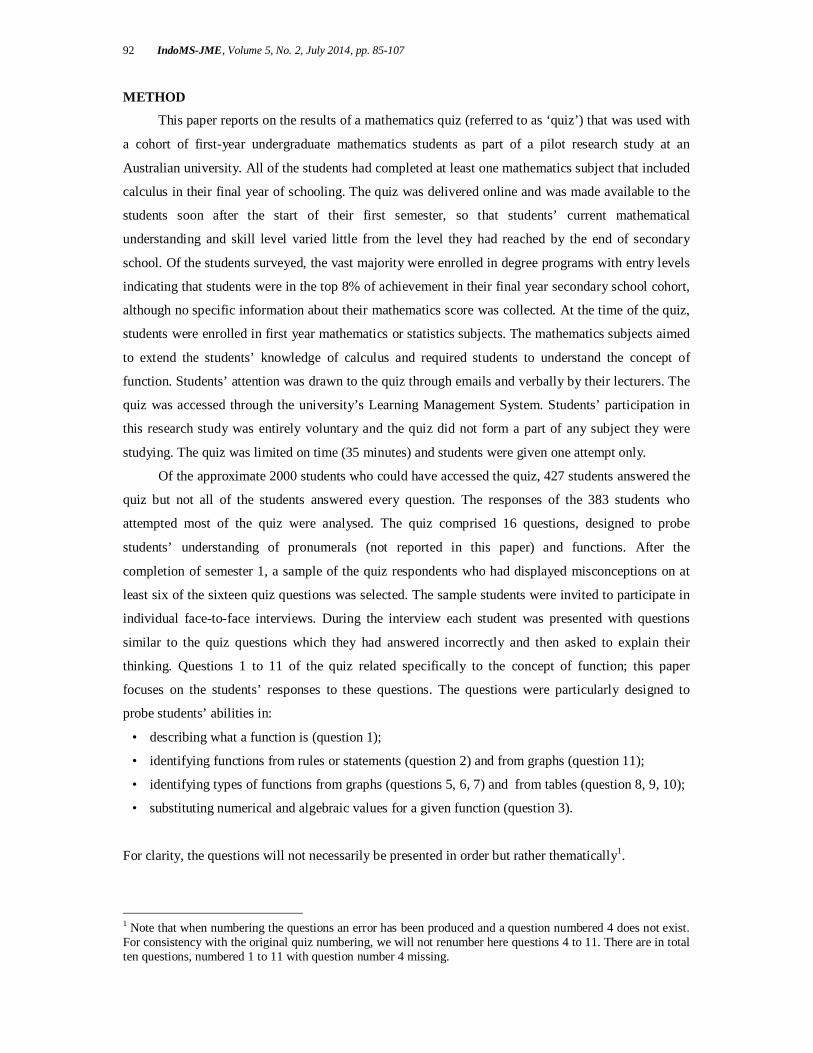
METHOD
This paper reports on the results of a mathematics quiz (referred to as ‘quiz’) that was used with
a cohort of first-year undergraduate mathematics students as part of a pilot research study at an
Australian university. All of the students had completed at least one mathematics subject that included
calculus in their final year of schooling. The quiz was delivered online and was made available to the
students soon after the start of their first semester, so that students’ current mathematical
understanding and skill level varied little from the level they had reached by the end of secondary
school. Of the students surveyed, the vast majority were enrolled in degree programs with entry levels
indicating that students were in the top 8% of achievement in their final year secondary school cohort,
although no specific information about their mathematics score was collected. At the time of the quiz,
students were enrolled in first year mathematics or statistics subjects. The mathematics subjects aimed
to extend the students’ knowledge of calculus and required students to understand the concept of
function. Students’ attention was drawn to the quiz through emails and verbally by their lecturers. The
quiz was accessed through the university’s Learning Management System. Students’ participation in
this research study was entirely voluntary and the quiz did not form a part of any subject they were
studying. The quiz was limited on time (35 minutes) and students were given one attempt only.
Of the approximate 2000 students who could have accessed the quiz, 427 students answered the
quiz but not all of the students answered every question. The responses of the 383 students who
attempted most of the quiz were analysed. The quiz comprised 16 questions, designed to probe
students’ understanding of pronumerals (not reported in this paper) and functions. After the
completion of semester 1, a sample of the quiz respondents who had displayed misconceptions on at
least six of the sixteen quiz questions was selected. The sample students were invited to participate in
individual face-to-face interviews. During the interview each student was presented with questions
similar to the quiz questions which they had answered incorrectly and then asked to explain their
thinking. Questions 1 to 11 of the quiz related specifically to the concept of function; this paper
focuses on the students’ responses to these questions. The questions were particularly designed to
probe students’ abilities in:
• describing what a function is (question 1);
• identifying functions from rules or statements (question 2) and from graphs (question 11);
• identifying types of functions from graphs (questions 5, 6, 7) and from tables (question 8, 9, 10);
• substituting numerical and algebraic values for a given function (question 3).
For clarity, the questions will not necessarily be presented in order but rather thematically1.
1 Note that when numbering the questions an error has been produced and a question numbered 4 does not exist. For consistency with the original quiz numbering, we will not renumber here questions 4 to 11. There are in total ten questions, numbered 1 to 11 with question number 4 missing.

Bardini, et al., Undergraduate Mathematics Students’ … 93
RESULTS AND DISCUSSION
Question 1
Question 1 is an open ended question, addressing students’ worded descriptions of function: “Explain,
in plain English, what a function is.”
Approximately ninety-five percent of the 383 students answered Question 1. Only 228 of the 383
students (59.5%), that is 62.8% of those who answered, were able to give one or more valid
descriptors of a function, but most explanations represented incomplete or incorrect concepts,
supporting observations by Tall and Bakar (1991). In Table 1, the valid descriptors are categorised as:
rule connecting dependent variable and independent variable; unique value of dependent variable for
each value of the independent variable; vertical line test (a vertical line drawn anywhere on the graph
of a function crosses the graph only once); mapping between values of independent and dependent
variable; mapping with one-to-one or many-to-one correspondence; graph of relationship between
independent and dependent variables.
Table 1. Responses to Question 1 (in Categories)
Concepts present in students’
responses
Percentage of all quiz
respondents who included this
element.
n = 383
Percentage of Q1 respondents
who included this element.
n = 363
Rule 51 54
Unique y-value for each x-value 19 21
Vertical line test 4 4
Mapping 4 5
One-to-one or many-to-one 5 5
Graph 6 7
At least one valid descriptor 60 63
Not answered 5
The wide diversity in the students’ responses is illustrated by the following statements:
• A function is a rule which relates the values of one variable quantity to the values of another
variable quantity, and does so in such a way that the value of the second variable quantity is
uniquely determined by the value of the first variable quantity.
• It is an equation that has one y value for every x value. If you draw a line through the plot of the
graph, the line will only pass through the plot once.
• A mapping, usually in the form of a rule, from one set to another, with the property that each
input has a unique output.
• A graph that passes the vertical line test.

94 IndoMS-JME, Volume 5, No. 2, July 2014, pp. 85-107
• f x .
• It is like a machine that has an input and an output. And the output is related somehow to the
input.
• Anything that takes an input and spits out a single output. Example: an apple juicer.
• It is a mechanism that alters numbers put in to equal different numbers when they come out.
• A function is a one-to-many relation.
• Something with the ability to do something else.
• Something with x in it.
• Describe the real world in mathematical terms.
Clearly, whilst some students had a well-developed working understanding of the function
concept, others had tried to memorise definitions, often unsuccessfully as in the case of “a function is
a one-to-many relation”. Still others displayed naïve conceptual understanding influenced by the
number-machine/food-processor analogy.
Question 2
In Question 2 students were presented with six descriptors and asked to indicate which ones defined
functions (given in items 2a, 2b, 2c and 2e):
2a. 2( ) 2f x x where x ∈ ℝ
2b. f x ax b where x, a, b, c ∈ ℝ
2c. 푓(푥) =푥 푖푓 푥 ≤ 02 푖푓 0 < 푥 ≤ 1 푓표푟 푎푙푙 푥 ∈ ℝ2푥 푖푓 푥 > 1
2d. 푓(푥) =2푥 + 1 푖푓 푥 < 2 푓표푟 푎푙푙 푥 ∈ ℝ−5푥 + 3 푖푓 푥 > 1
2e. Let f be a function whose rule f x is the area of a circle with circumference x
2f. Let f be a function whose rule f x is the area of a rectangle with perimeter x
For functions described in items 2a, 2b, 2c and 2e, the rationale was to see whether students
would recognise functions in a range of different written and symbolic representations, from familiar
prototypes of functions (item 2a) to hybrid functions with more than a single rule descriptor (item 2c)
or worded descriptions (item 2e). The later type of representation is not often seen or worked on at
secondary level, yet it is frequently encountered at the tertiary level and students often struggle in
recognising a function when it is given in a format for which one cannot immediately determine a rule.

Bardini, et al., Undergraduate Mathematics Students’ … 95
All 383 students completed Question 2 but only 23 students (7%) responded correctly to all six
items. Table 2 shows the percentages of 383 students who selected each of the rules/statements as
defining functions.
Table 2. Question 2: Percentage of Students Selecting Each Descriptor
Rule or
statement
% of students who
marked as function
( 383n )
% of correct
responses (n = 383)
2a* 89 89
2b* 85 85
2c* 75 75
2d 56 44
2e* 50 50
2f 39 61
* indicates function
The surprising number of students who did not believe that rules given in items 2a and 2b
defined functions (11% and 15% respectively) were confused perhaps by inclusion of the surd and
pronumeral parameters. For the hybrid rules in items 2c and 2d, 73 students (19%) believed that
neither the rule in item 2c nor item 2d represented functions, and although these students in fact
responded correctly for item 2d, their reasoning was probably incorrect. Despite their experience of
hybrid functions in senior secondary mathematics, the concept of a hybrid function apparently ran
counter to their concept image of a function being represented by a recognisable rule, for example, a
linear or a quadratic rule. Although a correct response to item 2c was given by 289 students (75%),
only 96 of these students recognised that the rule in item 2d did not define a function, with many
students failing to make the connection between the hybrid set of rules and the function property that
each value of the independent variable must correspond to a unique value of the dependent variable.
For the verbal statements in item 2e and 2f 177 students (46.2%) apparently believed that
neither the statement in item 2e nor that in 2f represented a function. For these students, very likely the
concept of function embodied an algebraic rule or a graph. Whilst these students were in fact correct
for item 2f, it is likely that their reasoning was incorrect. Only 56 students (14.6%) correctly indicated
that the statement in item 2e defined a function but the statement in item 2f did not. These students
understood that a function could be defined in words but also recognised that the rectangle area did not
give rise to a unique value of the dependent variable for each value of the independent variable.
Question 11
Question 11 is discussed next as it again required students to identify functions, but this time graphical
representations rather than rules were provided.

96 IndoMS-JME, Volume 5, No. 2, July 2014, pp. 85-107
“Among the following graphs, which one corresponds to a function? (Choose as many as they
apply).”
11a 11b 11c
All 383 students in the study answered Question 11 but correct responses to all three graphs
were given by only 160 students (41.8%). Surprisingly, almost one third of students believed that
graph in item 11b represented a function (see Table 3).
Table 3. Question 11: Percentage of Students Selecting Each Graph as Graph of Functions
% of students
( 383n )
% of correct
responses
11a* 60 60
11b 33 67
11c* 79 79
*indicates function
The hybrid function described by the rule in item 2c is represented by the graph in item 11a. Of
the 383 students, only 207 students (54%) were consistent in identifying both representations as a
function, with 70 students (18.3%) believing that neither were functions (see Table 4). A further
21.4% indicated that only the rule represented a function and 6.3% indicated that only the graph was a
function.
Table 4. Number of Students with Correct Responses to Items 2c and 11a
Rule 2c and
graph 11a
Rule 2c but not
graph 11a
Graph 11a but not
rule 2c
Neither
207 82 24 70

Bardini, et al., Undergraduate Mathematics Students’ … 97
The quadratic function described by the rule in item 2a is represented by the graph in item 11c.
Two hundred and eighty-three (73.9%) of the 383 students correctly indicated that both rule 2a and
graph 11c represented functions (see Table 5). Only 22 students (5.7%) believed that neither were
functions. However, 20 students who identified the rule in item 2a as a function did not identify the
graph in item 11c as a function. A further 58 students identified the graph, but not the corresponding
rule, as a function.
Table 5. Number of Students with Correct Responses to Items 2a and 11c
Rule 2a and
graph 11c
Rule 2a but not
graph 11c
Graph 11c but not
rule 2a
Neither
283 20 58 22
Of the 14 students who referred to the ‘vertical line’ test in Question 1, eleven responded
correctly to all three graphs, but the other three did not identify the graph in item 11a as a function. Of
the 75 students who referred in Question 1 to ‘a unique y-value for each x-value’, 64 students
responded correctly to the graph in item 11b, 65 students responded correctly to the graph in item 11c,
with five students responding incorrectly to both items 11b and 11c.
Only 17 students (4.4%) responded correctly to all of the six rules in Question 2 as well as to
the three graphs in Question 11. In their final year of school, 11 of these students had completed two
mathematics subjects that included calculus, including the highest level mathematics subject.
However, only 5 of the 11 students referred to ‘a unique y-value for each x-value’ in their explanation
of function in Question 1. Their explanations, whilst not including naïve number machine
explanations, still showed wide diversity, as seen by the following explanations from two of the
students:
• Functions are equations in which there is either one x-value for each y-value (one-to-one
functions) or multiple x-values for one y-value (many-to-one functions). If there are multiple y-
values for one x-value then it is not a function.
• A number that changes as a result of some variable changing. For example, your position could
change depending on what the time is.

98 IndoMS-JME, Volume 5, No. 2, July 2014, pp. 85-107
Question 3
This question is about gauging students’ substitution skills for the function 2 2f x x x where
x ∈ ℝ.
“Let f be a function such that, for all real x, 2 2f x x x .
a What is the value of 1f ?
b Find f a . Find f a .
c Find 22 , , 1 ,f x f x f x f x .
d What is the coefficient of 2x in f f x ? Select one of the following:
0 1 2 3 4
Table 6 shows the percentage of students who answered each part of Question 3 and the
percentage who answered correctly.
Table 6. Number of Students Responding Correctly to Question 3
Percentage of
students correct
(n = 383)
% of those who
answered who
were correct
(338≤n≤366)
3a 1f 93 98
3b.1 f a 92 96
3b.2 f a 86 91
3c.1 2f x 80 86
3c.2 f x 83 90
3c.3 1f x 68 75
3c.4 2f x 82 91
3d Coefficient of 2x in
f f x
47 53

Bardini, et al., Undergraduate Mathematics Students’ … 99
Table 7 shows the number of different answers and the frequency of the most common incorrect
answers for items 3a, 3b and 3c.
Table 7. Number of Unique Answers and Most Common Incorrect Answers for Question 3
Item Number of unique
answers
Most common incorrect answers with
number of students in brackets
3a 6 0 (4)
3b.1 13 2 3a a (2)
3b.2 22 2 2a a (6) 2 2a a (5)
3c.1 27 22 2 2x x (9) 24 2 2x x (4) 24x (4)
3c.2 22 2 2x x (8) 2 2x x (4) 2 2x x (3)
3c.3 29 2 3x x (37) 2 2x x (6)
3c.4 16 4 2 2x x (12) 3 2 2x x (3)
Most students were able to find 1f and f a correctly. However, for f a , f x ,
2f x , 1f x , and 2f x , mistakes fell into two categories: symbol manipulation, particularly in
the case of a negative sign before a binomial bracket, and incorrect substitution, for example, writing
2 1x instead of 21x for the first term when finding 1f x . The coefficient of 2x in f f x
was correctly determined by less than half of the 383 students and only slightly more than half of the
338 students who answered the question. Table 8 shows the numbers and percentages of these 338
students who selected each of the alternative choices for the value of f f x . Incorrect responses
were probably the result of errors in algebraic substitution and manipulation, possible confusion of
f f x with the derivative, and guessing if students did not know how to interpret f f x .
Table 8. Students’ Responses to Item 3d
Value of
f f x
Number of
students
Percentage
(n = 338)
0 25 7
1 64 19
2 40 12
3 25 7
4* 178 53
5 3 1
Other 3 1
* indicates correct value

100 IndoMS-JME, Volume 5, No. 2, July 2014, pp. 85-107
Questions 5, 6 and 7
In each of questions 5, 6 and 7, students were presented with a graph and asked to select from a list the
appropriate rule for the graph.
A substantial number of students did not answer questions 5 to 10, whereas all students answered
Question 11. This suggests that these students may have found questions 5 to 10 difficult. For
comparison, percentages of students selecting each multiple-choice option in questions 5 to 10 have
therefore been expressed in tables 9 and 10 both as a percentage of the total number of students (383)
and as a percentage of the students who answered the question.
If we consider only those students who answered questions 5, 6 and 7, almost all students were
successful in selecting the correct options. However, the approximate 10% of students who did not
answer the questions is of concern if indeed this was because they found the questions difficult.
Question 5
5a 4 12f x x
5b 22 3 2f x x x
5c 12xf x e
5d 3 23 4 12f x x x x
Question 6
6a 6f x x
6b 26f x x x
6c 6 2 xf x e
6d 5 6f x x
Question 7
7a 3 4f x x
7b 24f x x
7c 2xf x e
7d 42 3 4f x x x

Bardini, et al., Undergraduate Mathematics Students’ … 101
Table 9. Students’ Multiple Choice Responses for Questions 5, 6 and 7
Question 5
Percentage
(n = 383)
Percentage of those who answered
(n = 349)
Option 5a 0 0
Option 5b 2 2
Option 5c 0 0
Option 5d* 89 97
Unanswered 9
Question 6
Percentage
(n = 383)
Percentage of those who answered
(n = 346)
Option 6a 1 1
Option 6b* 89 98
Option 6c 1 1
Option 6d 0 0
Unanswered 10
Question 7
Percentage
(n = 383)
Percentage of those who answered
(n = 347)
Option 7a* 90 99
Option 7b 0 0
Option 7c 0 0
Option 7d 0 0
Unanswered 9
* indicates correct option
Questions 8, 9, 10
In each of questions 8, 9 and 10 students were presented with a table of values and asked to select
from a list the most appropriate type of function rule.
Question 8
x f x
2 4
1 1
8a linear
8b quadratic
8c exponential
8d none of the above

102 IndoMS-JME, Volume 5, No. 2, July 2014, pp. 85-107
0 0
1 1
2 4
3 9
Question 9
x f x
2 0.04
1 0.2
0 1
1 5
2 25
3 125
9a linear
9b quadratic
9c exponential
9d none of the above
Question 10
x f x
2 5
1 4
0 3
1 2
2 1
3 0
10a linear
10b quadratic
10c exponential
10d none of the above
As for questions 5, 6 and 7, approximately 10% of students did not answer the questions 8, 9
and 10 (see Table 10). If we consider only those students who answered the questions, it seems that
some students found it harder to match a type of function with a table of values than with a graph.
Most students (95%) who answered Question 10 selected 10a linear. This reflects the discrepancy
between school mathematics where any straight line function is commonly called ‘linear’ and the more
precise nomenclature of tertiary mathematics which distinguishes linear functions as a special case of
affine functions. Linear functions map 0 to 0. We could assume that some of the 11 students who
selected ‘none of the above’ were unable to determine the relationship between the y-values and the x-
values. However, it may be that some had encountered affine functions and would know that the table
did not represent a linear function as the point (0, 0) is not consistent with the values in the table. So
this question may have disadvantaged students whose knowledge went beyond normal secondary
school mathematics.

Bardini, et al., Undergraduate Mathematics Students’ … 103
As for questions 5 to 7, if we assume that those who chose not to answer the questions did so
because they found the questions difficult, the findings suggest that up to 15% of these undergraduate
mathematics students are unable to match a table of values with the simple function types they would
have met in secondary school mathematics.
Table 10. Students’ Multiple Choice Responses for Questions 7, 8 and 9
Question 7
Number of
students
Percentage
(n = 383)
Percentage of those
who answered
(n = 347)
Option 7a 3 1 1
Option 7b* 327 85 94
Option 7c 12 3 4
Option 7d 5 1 1
Unanswered 36 9
Question 8
Number of
students
Percentage
(n = 383)
Percentage of those who
answered
(n = 343)
Option 8a 8 2 2
Option 8b 7 2 2
Option 8c* 307 80 89
Option 8d 21 6 6
Unanswered 40 10
Question 9
Number of
students
Percentage
(n = 383)
Percentage of those who
answered
(n = 341)
Option 9a* 323 84 95
Option 9b 5 1 2
Option 9c 2 1 1
Option 9d 11 3 3
Unanswered 42 11
* indicates correct option

104 IndoMS-JME, Volume 5, No. 2, July 2014, pp. 85-107
CONCLUSION AND SUGGESTION
Although universities all have different entry requirements and assume differing levels of
background knowledge, for students studying mathematics either as a subject in its own right or as
part of a science, commerce or engineering degree, a basic level of proficiency with fundamental
skills, like algebraic manipulation is required. Conceptual understanding is harder to mandate, but
implications can be made from considering topics students have covered at secondary school. So if
calculus or probability, for example, is studied at school, it would be natural to assume that the
curriculum included a deep study of functions, and so at tertiary level, functions may be revised rather
than developed again from scratch. If students lack the fundamental understanding required, then all
that comes after is built on shaky foundations.
By the end of secondary schooling we are discussing the concept of function in the context of a
domain and codomain that are either the whole of ℝ or subsets of ℝ. Once students arrive at
university, the idea of function is quickly extended in a variety of ways; for example, we can think of
Re(z) and Im(z) as functions with domain ℂ and codomain ℝ, we can think of a bijection that maps ℂ
onto ℝ2, we study functions from ℝn to ℝ – functions of several variables, in linear algebra we think of
functions from ℝm to ℝn, we study inner products mapping ℝn to ℝ and so on. After that we think of a
more generalised notion of function where the domain and codomains may be polynomials, matrices
or functions themselves, and this is still first year university. It is hard to imagine how students make
sense of this if they have not yet mastered the idea of a function, or can only do so in the context of the
graph of a function.
But perhaps even more importantly, when students come to university (or progress through year
levels of school) holding misconceptions or lacking deep understanding, it can be hard to reverse.
When trying to redress these misconceptions, students will often disengage, since their beliefs and
understandings are challenged, leading to insecurity in their own thinking. Hence it is important to
constantly reinforce old concepts in new settings, helping students to make connections between
related mathematical ideas.
Misconceptions and naïve ignorance relating to the concept of function are apparent for a
significant number of students in the study. These misconceptions are consistent with those previously
reported in the literature.
Although we were not particularly seeking for a formal definition of function when asking
students to explain, in words, what a function is, few were able to give a correct explanation. The
often vagueness of their explanation seemed to be reflected in their inability to determine if a graph or
a rule represented a function, and a substantial number were not able to identify the type of function
(for example, quadratic or exponential) represented in a graph or table of values. From responses to
Question 2 and Question 11, for example, it seems that students do not make a clear distinction and get
confused between what is a function per se and continuous function, differentiable function, one-to-
one function etc, or a hybrid function that has more than a single rule descriptor. The inconsistent

Bardini, et al., Undergraduate Mathematics Students’ … 105
responses to questions 2 and 11 indicate that a considerable number of these undergraduate students
either did not make connections between the different modes of representation of functions or at least
that they were more likely to identify a function from its graph correctly. To this matter, it is
interesting to note that more students seemed to recognise a hybrid function when provided with its
algebraic rule than when represented graphically. It could be that a function that is not differentiable,
as can be seen on the graph, maybe what affected students’ choices. If this hypothesis proves to be
correct, then it should also explain why of the 14 students who referred to the ‘vertical line’ test in
Question 1, eleven responded correctly to all three graphs, but the other three did not identify the
graph in item 11a as a function. Students’ apparent familiarity with graphical representations may be a
reflection of the increased ease of access to many examples through the use of technology. However
the inconsistencies in their responses to Questions 2 and 11 suggests that there has not been a teaching
emphasis on linking numeric, symbolic and graphic representation as recommended in the literature
(Dreyfus, 2002; Yerushalmy, 2004; Zbiek et al, 2007).
Of further concern is the inability of many students to accurately manipulate algebraic
expressions (Question 3), with common errors relating to negative signs before brackets containing a
binomial expression. Incorrect responses to this question also indicated some important manipulative
errors when students had to deal with double entry arguments (arguments with single entry such as 1,
a, x2 had a much higher correct response rate than arguments like –a, –x, 2x, x+1).Technology could
also be used to emphasise that, for example, substitution for x replaces every x in the expression, not
just the first one. Quick checking of the results of each stage of problem solution not just the final
answer would immediately alert students to this error.
That all of these students had been sufficiently successful in their final year of school
mathematics to enrol in first semester undergraduate mathematics at a high profile university suggests
that school mathematics, including final year examinations, emphasises skills rather than deep
conceptual understanding. The advice of Vinner and Dreyfus (1989), Sierpinska (1992) and others is
still pertinent. Students need to develop a concept of function through exposure to many examples
where the various representations are linked and then summarise and formalise this learning through
the application of the definition of function. It is critical that students are aware of the aspects of the
definition of function that they are calling on when they are asked to consider functionality and that
they are able to make connections between the various representations of function.
ACKNOWLEDGMENTS
Justin Matthyrs, Emily Duane, Kaye Stacey. Support for this publication has been provided by
the Australian Government Office for Learning and Teaching (OLT). The views expressed in this
publication do not necessarily reflect the views of the OLT.

106 IndoMS-JME, Volume 5, No. 2, July 2014, pp. 85-107
REFERENCES Blume, G. & Heckman, D. (1997). What do students know about algebra and functions? In P. Kenney
& E. Silver (Eds.), Results from the Sixth Mathematics Assessment of the National Assessment of Educational Progress, pp. 225–277. Reston, VA: National Council of Teachers of Mathematics.
Bridger, M. & Bridger, M. (2001). Mapping diagrams: another view of functions. In A. Cuoco & F. R. Curcio (Eds.), The roles of representation in school mathematics, pp. 103–116. Reston, VA: National Council of Teachers of Mathematics.
Carlson, M. P. (1998). A cross‐sectional investigation of the development of the function concept. Research in Collegiate Mathematics Education III, Conference Board of the Mathematical Sciences, Issues in Mathematics Education, 7(2), 114–162.
Clement, L. (2001). What do students really know about functions? Mathematics Teacher, 94(9), 745–748.
Cooney, T. J. & Wilson, M. J. (1993). Teachers thinking about functions: Historical and research perspectives. In T. A. Romberg, E. Fennema & T. P. Carpenter. Integrating research on the graphical representation of functions (pp. 131–158). Mahwah, NJ: Lawrence Erlbaum.
Eisenberg, T. (1992). On the development of a sense for functions. In E. Dubinsky & G. Harel (Eds.), The concept of function: Aspects of epistemology and pedagogy (pp. 153–174).
Kieran, C. (1993). Functions, graphing, and technology: Integrating research on learning and instruction. In T. Carpenter, E. Fennema, & T. Romberg (Ed.), Integrating research in the graphical representation of functions, pp.189–237. Hillsdale, NJ: Erlbaum.
Kieran, C. & Yerushalmy, M. (2004). Computer algebra systems and algebra: Curriculum, assessment, teaching, and learning. In K. Stacey, H. Chick, & M. Kendal (Eds.), The Future of the Teaching and Learning of Algebra: The 12th ICMI study (pp. 99-154). Norwood, MA: Kluwer Academic Publishers.
Kleiner, I. (1989). Evolution of the function concept: a brief survey. The College Mathematics Journal, 20(4), 282–300.
Knuth, E. (2000). Understanding connections between equations and graphs, The Mathematics Teacher, 93(1), January 2000, pp. 48–53.
Norman, A. (1992). Teachers’ mathematical knowledge of the concept of function. In E. Dubinsky & G. Harel (Eds.), The concept of function: Aspects of epistemology and pedagogy, pp. 215–58. Washington, DC: The Mathematical Association of America.
Oehrtman, M. C., Carlson, M. P., & Thompson, P. W. (2008). Foundational reasoning abilities that promote coherence in students’ understandings of function. In M. P. Carlson & C. Rasmussen (Eds.), Making the connection: Research and practice in undergraduate mathematics, pp. 150–170). Washington, DC: Mathematical Association of America.
Sierpinska, A. (1992). On understanding the notion of function. In E. Dubinsky & G. Harel (Eds.), The concept of function: Aspects of epistemology and pedagogy, pp. 22–58. Washington, DC: The Mathematical Association of America.
Tall, D. & Bakar, N. (1991). Students’ mental prototypes for functions and graphs. In P. Boero & F. Furinghetti (Eds.), Proceedings of PME 15, Assisi, Vol. 1, pp. 104–111. Assisi: Program Committee of the 15th PME Conference.
Bardini, et al., Undergraduate Mathematics Students’ … 107
Thompson, P. W. (1994). Students, functions, and the undergraduate curriculum. In E. Dubinsky, A. H. Schoenfeld, & J. J. Kaput (Eds.), Research in Collegiate Mathematics Education, 1 (Issues in Mathematics Education, Vol. 4, pp. 21–44). Providence, RI: American Mathematical Society.
Vinner, S. & Dreyfus, T. (1989). Images and definitions for the concept of function. Journal for Research in Mathematics Education, 20(4), 356–366.
Zbiek, R. M., Heid, M. K., Blume, G. W., & Dick, T. (2007). Research on technology in mathematics education: A perspective of constructs. In F. Lester (Ed.), Second handbook of research on mathematics teaching and learning. (pp. 1169-1207). Charlotte, NC: Information Age.