Embed Size (px)
Citation preview

WELDING RESEARCH
WELDING JOURNAL / JULY 2019, VOL. 98204-s
https://doi.org/10.29391/2019.98.018
Introduction
Keyhole plasma arc welding (KPAW) has a promising fu-ture in the welding of automobiles (Ref. 1), airplanes (Ref.2), rockets (Ref. 3), and structural steels (Ref. 4) due to itshigh-energy density, low equipment cost, and joint toler-ance. However, welding defects (Ref. 5), such as undercut,are easily formed during welding, which decrease the static,fatigue, and fracture strength of the weld joint. The undercut formation mechanism had been widely dis-cussed in arc welding based on experimental observationand numerical simulation. In the gas tungsten arc welding(GTAW) process, the inward Marangoni force caused by the
positive surface tension temperature coefficient was pro-posed by Mills to explain the undercut formation (Ref. 6).However, the undercut was not generated during the GTAWof high-sulphur steel (positive surface tension temperaturecoefficient) with low welding speed. Mendez found that athin layer of liquid metal was formed under the arc due tothe large arc pressure in the high-current GTAW process.The premature solidification of this thin liquid layer initiat-ed the undercut (Ref. 7). Meng developed a three-dimen-sional numerical model for the high-speed GTAW process(Refs. 8, 9). The premature solidification of the thin liquidlayer at the periphery and the inward flow at the trailing pe-riphery promoted the undercut formation (Ref. 8). He alsoproposed that the arc shear stress was the dominant drivenforce for the weld pool deformation and backward flow ofthe liquid metal (Ref. 9). However, the arc shear stress andarc pressure in his studies were calculated based on the em-pirical equations. In the submerged arc welding (SAW)process, based on the x-ray observation, the undercut oc-curred when the liquid metal was displaced more than thesolidification point (Ref. 10). The large arc pressure was sug-gested to be responsible for the undercut formation (Ref.11). In the gas metal arc welding (GMAW) process, Nguyensuggested that the backward flow of the liquid metal causedby the arc pressure and droplet impact was the main reasonfor the undercut and humping formation (Ref. 12). Based onthe observation of the weld pool and the movement of thetracer particles, Zong suggested that the large longitudinal-to-transverse velocity ratio, and the inward flow in the mid-dle of the weld pool, contributed to the undercut formation(Refs. 13, 14). It can be concluded from previous studiesthat the weld pool convection in arc welding plays an impor-tant role in the undercut formation. It should be noted that the undercut formation in theKPAW process is different from that in the GTAW, SAW, andGMAW processes. Undercut is likely formed in the GTAW,SAW, and GMAW processes with high current and highwelding speed (Refs. 8, 10, 12), while it can be formed in theKPAW process with low current and low welding speed. Thismay be caused by the formation of the penetrated keyholeand the complex weld pool convection. Previous studies ofcomplete-joint-penetration laser welding showed the molten
Undercut Formation Mechanism in Keyhole Plasma Arc Welding
X-ray transmission, high-speed video camera, and thermal camerasystems were developed to study undercut formation
BY A. V. NGUYEN, D. WU, S. TASHIRO, AND M. TANAKA
ABSTRACT Undercut formation is a common weld defect in keyholeplasma arc welding. Based on the comprehensiveexperimental measurement of the weld pool convectionwith the help of x-ray transmission, high-speed video cam-era, and thermal camera systems, undercut formation issuggested to be caused by the irregular fluid flow and un-even energy distribution of the weld pool. As the plasmagas rate is increased, the counterclockwise eddy inside theweld pool is increased, and the backward flow at the topsurface is decreased, so more energy is transported to thebottom surface, while less energy is transported to the topsurface. The rear part of the top weld pool is easily solidi-fied, so a teardrop-shaped profile is easily formed. Due tothe strong inward flow at the top surface caused by theteardrop-shaped top weld pool profile and the dominantcounterclockwise eddy inside the weld pool, more energy istransported from the lateral sides to the centerline of thetop weld pool. A high-temperature zone is formed at thecenterline of the top weld pool, while the lateral sides areeasily prematurely solidified, causing the undercutformation at the top surface.
KEYWORDS • Keyhole Plasma Arc Welding • Undercut Formation • X-Ray Transmission System • Thermal Camera
Nguyen (2018105) Supplement .qxp_Layout 1 6/6/19 5:35 PM Page 204

WELDING RESEARCH
JULY 2019 / WELDING JOURNAL 205-s
metal was pressured toward the bottom surface, whichcaused redistribution of the thermal energy between the topand bottom welds (Ref. 15) and facilitated the formation ofweld defects on the top and bottom surfaces (Ref. 16). Eventhough experimental observation and numerical simulationhave been carried out to analyze the keyhole behavior (Ref.17), keyhole stability (Refs. 18, 19), weld pool convection(Refs. 20–22), and weld defect formation (Ref. 5) in theKPAW process, the weld pool convection in previous numer-ical simulations is different from the experimental results(Ref. 23), and the undercut formation mechanism has notbeen revealed. In this study, the convective patterns inside the weld poolin the KPAW process were measured by the x-ray transmis-sion system. The convective patterns on the weld pool sur-faces were measured by tracing the movement of the zirco-nia particles based on the high-speed video camera system.The temperature of the weld pool surface was measured bythe thermal camera system. Based on the comprehensive ex-periments, the fluid flow and the temperature distributionof the weld pool were analyzed. For the first time, the un-dercut formation mechanism in the KPAW process is re-vealed in detail.
Experimental Procedures
Figure 1 shows a photograph of the experimental setup.A transfer-type plasma arc welding torch (100WH, NipponSteel Welding & Engineering Co. Ltd.) and a welding powersource (NW-300ASR, Nippon Steel Welding & EngineeringCo. Ltd.) were used in the experiments. The x-ray transmis-sion system consisting of two sets of x-ray power sourcesand image intensifiers as well as a high-speed video camerawas used to observe the movement of 0.5-mm-diametertungsten particles, thus allowing the convective patterns in-side the weld pool to be measured. The x-ray 1 power sourcewith the tube current of 1.0 mA and the tube voltage of230.0 kV was located at the upper side of the base metal.The x-ray 2 power source with the tube current of 3.5 mAand the tube voltage of 225.0 kV was located at the lowerside of the base metal. The image intensifiers were used toconvert the x-ray transmission images to visible images,
which were then captured by the high-speed video camerawith the frame rate of 1000 frames/s. During welding, themovement of zirconia particles on the top and bottom weldpool surfaces were measured by another high-speed videocamera with the frame rate of 3000 frames/s, thus allowingthe convective patterns on the weld pool surfaces to bemeasured. It should be noted that the tungsten particles orthe zirconia particles were put into the prefabricated holesin the base metal. The thermal camera (Miro Ex4 Phantom, Vision ResearchInc.), including three color sensors composed of red (R),green (G), and blue (B), was used to take the weld pool sur-faces images with the frame rate of 2000 frames/s. It shouldbe noted that to avoid the strong radiation of the arc, theweld pool surface images were taken immediately after
Fig. 1 — Photographs of the X-ray transmission system and welding equipment.
Fig. 2 — Weld bead appearances and cross sections of theweld beads.
Nguyen (2018105) Supplement .qxp_Layout 1 6/6/19 5:35 PM Page 205

WELDING RESEARCH
WELDING JOURNAL / JULY 2019, VOL. 98206-s
switching off the main arc. The main arc completely disap-peared within 1.0 ms. In our previous study, it was foundthat the decrease of the surface temperature was negligiblewithin 2 ms after cutting the arc (Ref. 24). The weld pooltemperature was calculated from the ratio of the R sensorsignal to the G sensor signal in the image based on the two-color pyrometry method. Detailed descriptions of the exper-imental methods can be seen in our previous work (Ref. 23). The stainless steel SUS304 plates with the dimensions of300 100 4 mm were used as the base metal in the experi-ments. The torch orifice diameter was 2.0 mm, and the elec-trode setback was 3 mm. The distance between the nozzle and
the base metal was 5 mm. The welding current was direct cur-rent 120 A, and the welding voltage was approximately 27 V.The welding speed was 3 mm/s. Pure argon (Ar) was used asthe main plasma gas and the shielding gas. During welding,the backshielding gas was introduced to a backside gas box,which was put on the welding jig, avoiding oxidation of theback weld bead. The main plasma gas flow rate was 0.7, 1.7,and 3.0 L/min. The shielding gas flow rate was 7.5 L/min.
Results
Influence of Plasma Gas Rate on Weld Bead Formation
The weld bead appearances and the cross sections of theweld beads in cases of 0.7, 1.7, and 3.0 L/min are indicatedin Fig. 2. In the case of 0.7 L/min, only a blind keyhole wasformed, and no undercut was generated. The inclination ofthe front keyhole wall about 33 deg. In the case of 1.7 L/min, a penetrated keyhole was formed,and the slight undercut was generated at the weld toe. Theundercut depth was about 0.13 mm. The keyhole width atthe bottom surface at the B-B cross section was about 2.2mm. The inclination of the front keyhole wall was about 20deg. In the case of 3.0 L/min, serious undercut was generatedat the weld toe. The undercut depth was about 1.2 mm. Thekeyhole width at the bottom surface at the B-B cross sectionwas about 3.1 mm. The inclination of the front keyhole wallwas about 23 deg.
The Influence of Plasma Gas Rate on the Fluid Flow
The three-dimensional convective patterns inside the weldpool in cases of 0.7, 1.7, and 3.0 L/min are indicated in Fig. 3.In the case of 0.7 L/min, only a blind keyhole was formed. Themolten metal flowed upward and backward along the rearkeyhole wall. Therefore, only a clockwise eddy was formed in-side the weld pool. The maximum velocity (0.39 m/s) was lo-cated at the convective pattern near the top surface. In the case of 1.7 L/min, a clockwise eddy was formed in-
Fig. 3 — The three-dimensional convective patterns inside the weld pool: A — 0.7 L/min; B — 1.7 L/min; C — 3.0 L/min.
Fig. 4 — The convective pattern at the top surface of theweld pool: A — 0.7 L/min; B — 1.7 L/min; C — 3.0 L/min.
A
A
B
B
C
C
Nguyen (2018105) Supplement .qxp_Layout 1 6/6/19 5:35 PM Page 206

WELDING RESEARCH
JULY 2019 / WELDING JOURNAL 207-s
side the top weld pool, and a counterclockwise eddy wasformed inside the bottom weld pool. The maximum velocity(0.32 m/s) was located at the convective pattern near thebottom surface. In the case of 3.0 L/min, near the rear keyhole wall, onlya counterclockwise eddy can be seen inside the weld pool. Atthe rear part of the bottom weld pool, a clockwise eddy wasformed. The maximum velocity (0.45 m/s) was located atthe convective pattern near the bottom surface. It can be concluded from Fig. 3 that as the plasma gasrate was increased, the counterclockwise eddy inside the topweld pool became smaller, and then disappeared. The convective patterns at the top surface of the weldpool in cases of 0.7, 1.7, and 3.0 L/min are presented in Fig.4. In the case of 0.7 L/min, all the zirconia particles flowedbackward and outward to the rear part of the top weld pool. In the case of 1.7 L/min, the zirconia particles flowedbackward to the rear part of the top weld pool. However, atthe lateral sides of the top weld pool, the particles reachedthe top weld pool periphery, and then flowed inward. In the case of 3.0 L/min, near the keyhole, the zirconiaparticles flowed downward. At the middle of the top weldpool, the zirconia particles flowed backward and inward. The distribution of the average flow velocity at the topsurface of the weld pool in cases of 0.7, 1.7, and 3.0 L/minare presented in Fig. 5. In the case of 0.7 L/min, from thefront part to the rear part of the top weld pool, the flow ve-locity was first increased and then decreased. The maximumvelocity (about 1.2 m/s) was located at the middle of the topweld pool. In the case of 1.7 L/min, the flow velocity tendency wassimilar to that in the case of 0.7 L/min. The maximum veloc-ity (about 0.62 m/s) was also located at the middle of thetop weld pool. In the case of 3.0 L/min, the maximum velocity (about0.8 m/s) was found near the top keyhole, in which the zirco-nia particles flowed downward and inward. It can be concluded from Figs. 4 and 5 that when a pene-trated keyhole is formed, at the top surface, the inward flowcan be observed at the middle of the top weld pool, and thebackward flow becomes weak. If the plasma gas rate is toolarge, the downward and inward flow with high velocity canbe observed near the top keyhole. The convective patterns at the bottom surface of theweld pool in cases of 1.7 and 3.0 L/min are presented in Fig.
6. In the case of 1.7 L/min, the zirconia particles flowed out-ward and backward to the rear part of the bottom weld pool.There were two convective patterns in the case of 3.0 L/min.All the particles flowed backward from the keyhole towardthe rear part of the bottom weld pool. At the rear part of thebottom weld pool, several particles flowed forward. The distribution of the average flow velocity at the bot-tom surface of the weld pool in cases of 1.7 and 3.0 L/minare presented in Fig. 7. It can be seen that from the keyholeto the rear part of the weld pool, the flow velocity was de-creased. The maximum flow velocity just behind the keyholein the case of 3.0 L/min (about 1.3 m/s) was higher thanthat in the case of 1.7 L/min (about 1.15 m/s).
The Influence of Plasma Gas Rate on Temperature Distribution
The top weld pool and temperature distribution in thecases of 0.7, 1.7, and 3.0 L/min are presented in Fig. 8. Inthe case of 0.7 L/min, the top weld pool was elliptical, andthere were two high-temperature zones located at the lateralsides of the top weld pool (X = 4 ~5 mm). The premature so-lidification of the molten metal at the lateral sides can’t beseen. From the front to the rear part of the top weld pool,the temperature was first increased and then decreased. In the case of 1.7 L/min, the top weld pool length was de-creased. The high-temperature zone was located at the cen-terline of the top weld pool (X = 5 mm). The maximum tem-perature was about 1870 K. The premature solidification ofthe molten metal can be seen at the lateral sides. In the case of 3.0 L/min, the top weld pool length was the
Fig. 5 — The distribution of average flow velocity at the top surface of the weld pool: A — 0.7 L/min; B — 1.7 L/min; C — 3.0 L/min.
Fig. 6 — The convective pattern at the bottom surface of theweld pool: A — 1.7 L/min; B — 3.0 L/min.
A
A
B
B
C
Nguyen (2018105) Supplement .qxp_Layout 1 6/6/19 5:35 PM Page 207

WELDING RESEARCH
WELDING JOURNAL / JULY 2019, VOL. 98208-s
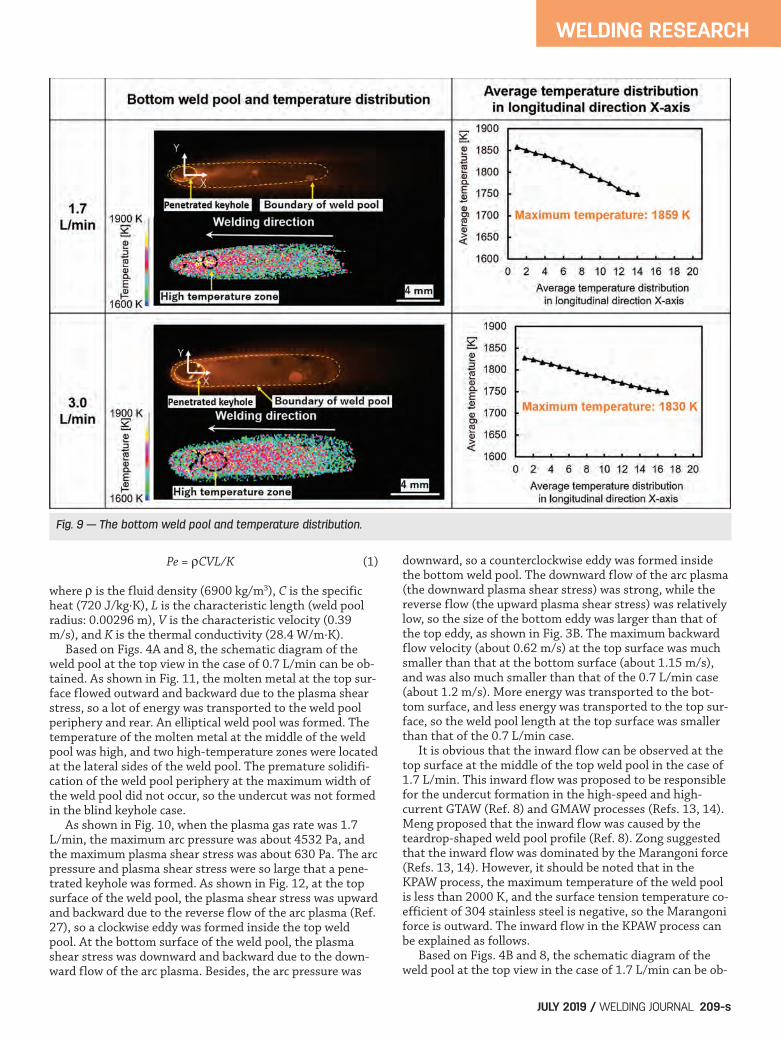
smallest. The high-temperature zone was also located at thecenterline of the top weld pool (X = 3.5 mm). The maximumtemperature was about 1805 K. The premature solidificationof the molten metal can be seen at the lateral sides. The bottom weld pool and temperature distribution incases of 1.7 and 3.0 L/min are presented in Fig. 9. The bot-tom weld pool was much longer and wider in the case of 3.0L/min. The bottom weld pool length was about 17 mm inthe case of 3.0 L/min and 14 mm in the case of 1.7 L/min.The temperature distributions in both cases have the sametendency with the highest value located just behind the key-hole. However, the maximum temperature was higher in thecase of 1.7 L/min, where 1859 K at X = 1 mm in comparisonto the case of 3.0 L/min where 1830 K at X = 1 mm. It can be concluded from Figs. 8 and 9 that as the plasmagas rate was increased, the weld pool length was decreased
at the top surface, but increased at the bottom surface. Thehigh-temperature zone moved from the lateral sides to thecenterline of the top weld pool.
Discussion
In this study, an electrode-arc model was developed tostudy the plasma arc physics in the KPAW process. The de-tailed description of the numerical model can be seen in ourprevious work (Ref. 25). The influence of the plasma gasrate on the weld pool convection and weld bead formationwas analyzed, and the undercut formation mechanism wasrevealed.
The Relationship between Plasma Gas Rate and WeldPool Convection, Weld Bead Formation
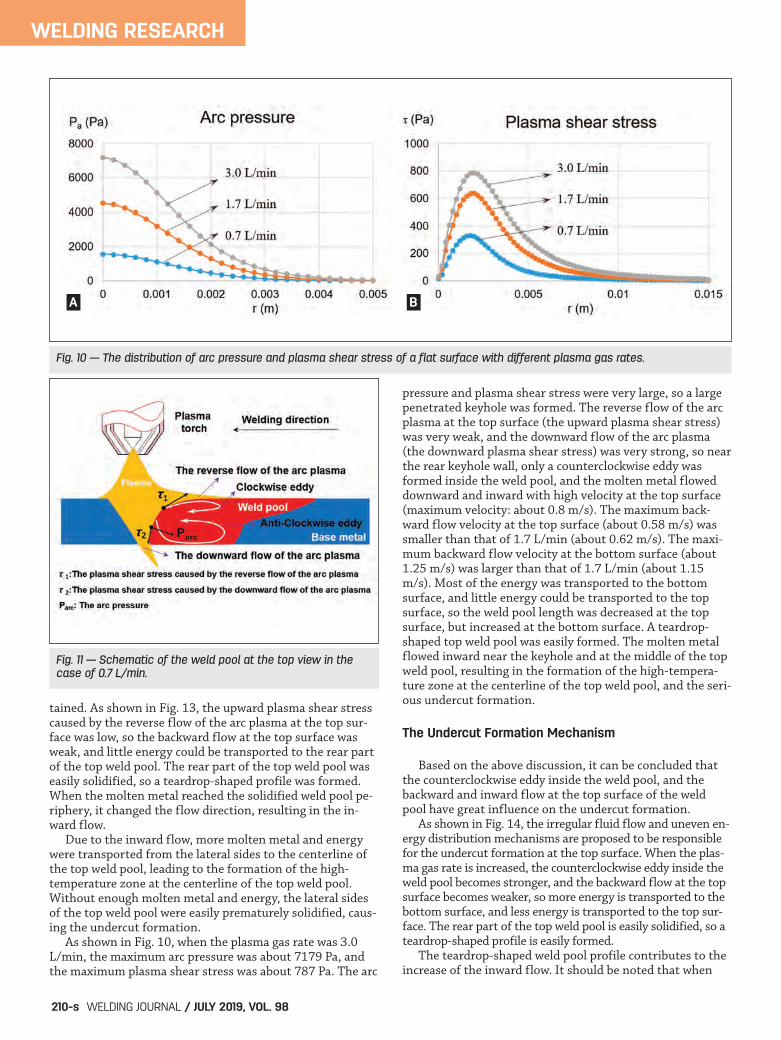
Figure 10 shows the distribution of the arc pressure (Pa)and plasma shear stress () of a flat surface with differentplasma gas rates. When the plasma gas rate was 0.7 L/min,the maximum arc pressure was about 1562 Pa, and the max-imum plasma shear stress was about 330 Pa. The arc pres-sure and plasma shear stress were so small that only a blindkeyhole was formed. It should be noted that in the blind keyhole case, the arcpressure was downward, and the plasma shear stresscaused by the reverse flow of the arc plasma was upwardand backward (Ref. 21). Based on Figs. 3A and 4A, it can beconcluded that the plasma shear stress was the dominantdriven force for the clockwise eddy inside the weld pooland the backward and outward flow on the top surface.The arc pressure had minor influence on the weld poolconvection. The Peclet number of the weld pool in the blind keyholecase is calculated by Equation 1, and its value is about 202.The Peclet number is a dimensionless number showing theratio between convection and conduction. The much higherPeclet number in the blind keyhole case means the heattransportation by the fluid flow is the dominant mechanismfor the energy transportation inside the weld pool (Ref. 26).
Fig. 7 — The distribution of the average flow velocity at the bottom surface of the weld pool: A — 1.7 L/min; B — 3.0 L/min.
Fig. 8 — The top weld pool and temperature distribution.
A B
Nguyen (2018105) Supplement .qxp_Layout 1 6/6/19 5:35 PM Page 208
WELDING RESEARCH
JULY 2019 / WELDING JOURNAL 209-s
Pe = CVL/K (1)
where is the fluid density (6900 kg/m3), C is the specificheat (720 J/kg·K), L is the characteristic length (weld poolradius: 0.00296 m), V is the characteristic velocity (0.39m/s), and K is the thermal conductivity (28.4 W/m·K). Based on Figs. 4A and 8, the schematic diagram of theweld pool at the top view in the case of 0.7 L/min can be ob-tained. As shown in Fig. 11, the molten metal at the top sur-face flowed outward and backward due to the plasma shearstress, so a lot of energy was transported to the weld poolperiphery and rear. An elliptical weld pool was formed. Thetemperature of the molten metal at the middle of the weldpool was high, and two high-temperature zones were locatedat the lateral sides of the weld pool. The premature solidifi-cation of the weld pool periphery at the maximum width ofthe weld pool did not occur, so the undercut was not formedin the blind keyhole case. As shown in Fig. 10, when the plasma gas rate was 1.7L/min, the maximum arc pressure was about 4532 Pa, andthe maximum plasma shear stress was about 630 Pa. The arcpressure and plasma shear stress were so large that a pene-trated keyhole was formed. As shown in Fig. 12, at the topsurface of the weld pool, the plasma shear stress was upwardand backward due to the reverse flow of the arc plasma (Ref.27), so a clockwise eddy was formed inside the top weldpool. At the bottom surface of the weld pool, the plasmashear stress was downward and backward due to the down-ward flow of the arc plasma. Besides, the arc pressure was
downward, so a counterclockwise eddy was formed insidethe bottom weld pool. The downward flow of the arc plasma(the downward plasma shear stress) was strong, while thereverse flow (the upward plasma shear stress) was relativelylow, so the size of the bottom eddy was larger than that ofthe top eddy, as shown in Fig. 3B. The maximum backwardflow velocity (about 0.62 m/s) at the top surface was muchsmaller than that at the bottom surface (about 1.15 m/s),and was also much smaller than that of the 0.7 L/min case(about 1.2 m/s). More energy was transported to the bot-tom surface, and less energy was transported to the top sur-face, so the weld pool length at the top surface was smallerthan that of the 0.7 L/min case. It is obvious that the inward flow can be observed at thetop surface at the middle of the top weld pool in the case of1.7 L/min. This inward flow was proposed to be responsiblefor the undercut formation in the high-speed and high-current GTAW (Ref. 8) and GMAW processes (Refs. 13, 14).Meng proposed that the inward flow was caused by theteardrop-shaped weld pool profile (Ref. 8). Zong suggestedthat the inward flow was dominated by the Marangoni force(Refs. 13, 14). However, it should be noted that in theKPAW process, the maximum temperature of the weld poolis less than 2000 K, and the surface tension temperature co-efficient of 304 stainless steel is negative, so the Marangoniforce is outward. The inward flow in the KPAW process canbe explained as follows. Based on Figs. 4B and 8, the schematic diagram of theweld pool at the top view in the case of 1.7 L/min can be ob-
Fig. 9 — The bottom weld pool and temperature distribution.
Nguyen (2018105) Supplement .qxp_Layout 1 6/6/19 5:35 PM Page 209
WELDING RESEARCH
WELDING JOURNAL / JULY 2019, VOL. 98210-s
tained. As shown in Fig. 13, the upward plasma shear stresscaused by the reverse flow of the arc plasma at the top sur-face was low, so the backward flow at the top surface wasweak, and little energy could be transported to the rear partof the top weld pool. The rear part of the top weld pool waseasily solidified, so a teardrop-shaped profile was formed.When the molten metal reached the solidified weld pool pe-riphery, it changed the flow direction, resulting in the in-ward flow. Due to the inward flow, more molten metal and energywere transported from the lateral sides to the centerline ofthe top weld pool, leading to the formation of the high-temperature zone at the centerline of the top weld pool.Without enough molten metal and energy, the lateral sidesof the top weld pool were easily prematurely solidified, caus-ing the undercut formation. As shown in Fig. 10, when the plasma gas rate was 3.0L/min, the maximum arc pressure was about 7179 Pa, andthe maximum plasma shear stress was about 787 Pa. The arc
pressure and plasma shear stress were very large, so a largepenetrated keyhole was formed. The reverse flow of the arcplasma at the top surface (the upward plasma shear stress)was very weak, and the downward flow of the arc plasma(the downward plasma shear stress) was very strong, so nearthe rear keyhole wall, only a counterclockwise eddy wasformed inside the weld pool, and the molten metal floweddownward and inward with high velocity at the top surface(maximum velocity: about 0.8 m/s). The maximum back-ward flow velocity at the top surface (about 0.58 m/s) wassmaller than that of 1.7 L/min (about 0.62 m/s). The maxi-mum backward flow velocity at the bottom surface (about1.25 m/s) was larger than that of 1.7 L/min (about 1.15m/s). Most of the energy was transported to the bottomsurface, and little energy could be transported to the topsurface, so the weld pool length was decreased at the topsurface, but increased at the bottom surface. A teardrop-shaped top weld pool was easily formed. The molten metalflowed inward near the keyhole and at the middle of the topweld pool, resulting in the formation of the high-tempera-ture zone at the centerline of the top weld pool, and the seri-ous undercut formation.
The Undercut Formation Mechanism
Based on the above discussion, it can be concluded thatthe counterclockwise eddy inside the weld pool, and thebackward and inward flow at the top surface of the weldpool have great influence on the undercut formation. As shown in Fig. 14, the irregular fluid flow and uneven en-ergy distribution mechanisms are proposed to be responsiblefor the undercut formation at the top surface. When the plas-ma gas rate is increased, the counterclockwise eddy inside theweld pool becomes stronger, and the backward flow at the topsurface becomes weaker, so more energy is transported to thebottom surface, and less energy is transported to the top sur-face. The rear part of the top weld pool is easily solidified, so ateardrop-shaped profile is easily formed. The teardrop-shaped weld pool profile contributes to theincrease of the inward flow. It should be noted that when
Fig. 10 — The distribution of arc pressure and plasma shear stress of a flat surface with different plasma gas rates.
Fig. 11 — Schematic of the weld pool at the top view in thecase of 0.7 L/min.
A B
Nguyen (2018105) Supplement .qxp_Layout 1 6/6/19 5:35 PM Page 210

WELDING RESEARCH
JULY 2019 / WELDING JOURNAL 211-s
the counterclockwise eddy inside the weld pool becomesdominant, as shown in Fig. 14B, the downward and inwardflow can also be seen at the top surface near the rear key-hole wall. More molten metal and energy are transportedfrom the lateral sides to the centerline of the top weld pool.The high-temperature zone is formed at the centerline ofthe top weld pool, and the lateral sides of the top weld poolare easily prematurely solidified, causing the undercut for-mation at the top surface. It should be noted that more molten metal and energyare transported to the bottom surface, and inward flow can’tbe seen at the bottom surface, so the undercut is difficult toform at the bottom surface.
Conclusions
The following conclusions can be obtained: In the blind keyhole case, due to the reverse flow of thearc plasma, the molten metal at the top surface flows out-ward and backward, and only a clockwise eddy is formed in-
side the weld pool. The temperature of the molten metal atthe lateral sides of the weld pool is high, and the undercut isnot formed. The plasma shear stress is the dominant drivenforce for the weld pool convection, while the arc pressurehas minor influence on it. As the plasma gas rate is increased, a penetrated keyholeis formed. The counterclockwise eddy inside the weld poolbecomes large, and then dominant. The backward flow atthe top surface is decreased, while the inward flow caused bythe teardrop-shaped top weld pool profile and the dominantcounterclockwise eddy inside the weld pool is increased. Thetemperature of the molten metal at the lateral sides of thetop weld pool is low. In the KPAW process, the heat transportation by the flu-id flow is the dominant mechanism for the energy trans-portation inside the weld pool. The strong counterclockwiseeddy inside the weld pool, and the weak backward flow atthe top surface, lead to the uneven energy distribution be-tween the top and bottom surfaces. The strong inward flowcauses the uneven energy distribution between the lateral
Fig. 12 — The dominant driven force of the weld pool convec-tion when the plasma gas rate is 1.7 L/min.
Fig. 14 — A — Schematic of the undercut formation in the case of 1.7 L/min; B — schematic of the undercut formation in the caseof 3 L/min; C — the undercut formation mechanism.
Fig. 13 — Schematic of the weld pool at the top view in thecase of 1.7 L/min.
A C
B
Nguyen (2018105) Supplement .qxp_Layout 1 6/6/19 5:35 PM Page 211
WELDING RESEARCH
WELDING JOURNAL / JULY 2019, VOL. 98212-s
sides and centerline of the top weld pool. All of these rea-sons contribute to the undercut formation at the top surface.
Dr. Nguyen and Dr. Wu contributed equally to this work,so they should be regarded as first joint authors.
1. Vilkas, E. P. 1991. Plasma arc welding of exhaust pipe systemcomponents. Welding Journal 70(4): 49–52. 2. Irving, B. 1997. Why aren’t airplanes welded? Welding Journal76(1): 34–41. 3. Irving, B. 1992. Plasma arc welding takes on the advancedsolid rocket motor. Welding Journal 71(12): 49–52. 4. Martikainen, J. K., and Moisio, T. J. I. 1993. Investigation ofthe effect of welding parameters on weld quality of plasma arckeyhole welding of structural steels. Welding Journal 72(7): 329-sto 340-s. 5. Liu, Z. M., Wu, C. S., Liu, Y. K., and Luo, Z. 2015. Keyholebehaviors influence weld defects in plasma arc welding process.Welding Journal 94(9): 281-s to 290-s. 6. Mills, K. C., and Keene, B. J. 1990. Factors affecting variableweld penetration. International Materials Reviews 35(1): 185–216.DOI: 10.1179/095066090790323966 7. Mendez, P. F., and Eagar, T. W. 2003. Penetration and defectformation in high-current arc welding. Welding Journal 82(10):296-s to 306-s. 8. Meng, X., Qin, G., Bai, X., and Zou, Z. 2016. Numericalanalysis of undercut defect mechanism in high speed gas tung-sten arc welding. Journal of Materials Processing Technology 236:225–234. DOI: 10.1016/j.jmatprotec.2016.05.020 9. Meng, X., Qin, G., and Zou, Z. 2017. Sensitivity of drivingforces on molten pool behavior and defect formation in high-speed gas tungsten arc welding. International Journal of Heat andMass Transfer 107: 1119–1128. DOI: 10.1016/j.ijheatmasstrans-fer.2016.11.025 10. Nishi, T., Fujita, H., Haseba, S., and Ohara, M. 1982. Studyon high speed submerged arc welding (Report 1). Japan WeldingSociety 30(8): 68–74. DOI: 10.2207/qjjws1943.51.686 11. Ohara, M., Fujita, H., Haseba, S., and Nishi, T. 1983. Studyon high speed submerged arc welding (Report 2). Japan WeldingSociety 31(2): 45–48. DOI: 10.2207/qjjws.1.133 12. Nguyen, T. C., Weckman, D. C., and Johnson, D. A. 2007.Predicting onset of high speed gas metal arc weld bead defects us-ing dimensional analysis techniques. Science and Technology ofWelding and Joining 12(7): 634–648. DOI: 10.1179/174329307X-236797 13. Zong, R., Chen, J., Wu, C. S., and Padhy, G. K. 2017. Influ-ence of molten metal flow on undercutting formation in GMAW.Science and Technology of Welding and Joining 22(3): 198–207.DOI: 10.1080/13621718.2016.1214406 14. Zong, R., Chen, J., Wu, C. S., and Chen, M. A. 2016. Un-dercutting formation mechanism in gas metal arc welding. Weld-ing Journal 95(5): 174-s to 184-s. 15. Powell, J., Ilar, T., Frostevarg, J., Torkamany, M. J., Na, S.J., Petring, D., and Kaplan, A. F. 2015. Weld root instabilities infiber laser welding. Journal of Laser Applications 27(S2): S29008.DOI: 10.2351/1.4906390 16. Zhang, M., Zhang, Z., Tang, K., Mao, C., Hu, Y., and Chen,G. 2018. Analysis of mechanisms of underfill in full penetration
laser welding of thick stainless steel with a 10 kW fiber laser. Op-tics & Laser Technology 98: 97–105. DOI: 10.1016/j.optlastec.-2017.07.037 17. Liu, Z. M., Wu, C. S., and Chen, J. 2013. Sensing dynamickeyhole behaviors in controlled-pulse keyholing plasma arc weld-ing. Welding Journal 92(12): 381-s to 389-s. 18. Wu, C. S., and Liu, Z. M. 2015. Dynamic variation of key-hole exit and its inclination in plasma arc welding. Welding in theWorld 59(3): 365–371. DOI: 10.1007/s40194-014-0206-z 19. Liu, Z., Wu, C., Cui, S., and Luo, Z. 2017. Correlation ofkeyhole exit deviation distance and weld pool thermo-state inplasma arc welding process. International Journal of Heat and MassTransfer 104: 310–317. DOI: 10.1016/j.ijheatmasstransfer.2016.-08.069 20. Li, T. Q., and Wu, C. S. 2015. Numerical simulation of plas-ma arc welding with keyhole-dependent heat source and arc pres-sure distribution. The International Journal of Advanced Manufac-turing Technology 78(1–4): 593–602. DOI: 10.1007/s00170-014-6685-7 21. Jian, X., Wu, C., Zhang, G., and Chen, J. 2015. A unified3D model for an interaction mechanism of the plasma arc, weldpool and keyhole in plasma arc welding. Journal of Physics D: Ap-plied Physics 48(46): 465504. DOI: 10.1088/0022-3727/48/46/-465504 22. Li, Y., Feng, Y., Zhang, X., and Wu, C. 2014. Energy propa-gation in plasma arc welding with keyhole tracking. Energy 64:1044–1056. DOI: 10.1016/j.energy.2013.11.018 23. Van, A. N., Tashiro, S., Van, H. B., and Tanaka, M. 2017.Experimental investigation on the weld pool formation process inplasma keyhole arc welding. Journal of Physics D: Applied Physics51(1): 015204. DOI: 10.1088/1361-6463/aa9902 24. Yamazaki, K., Yamamoto, E., Suzuki, K., Koshiishi, F.,Tashiro, S., Tanaka, M., and Nakata, K. 2013. Measurement ofsurface temperature of weld pools by infrared two colour pyrome-try. Science and Technology of Welding and Joining 15(1): 40–47.DOI: 10.1179/136217109X12537145658814 25. Tashiro, S., Miyata, M., Tanaka, M., Shin, K., and Taka-hashi, K. 2010. Numerical analysis of keyhole welding of mildsteel plate with the plasma arc. Transactions of JWRI 39(1):27–31. 26. Kawahito, Y., Uemura, Y., Doi, Y., Mizutani, M., Nishimo-to, K., Kawakami, H., and Katayama, S. 2017. Elucidation of theeffect of welding speed on melt flows in high-brightness andhigh-power laser welding of stainless steel on basis of three-dimensional x-ray transmission in situ observation. Welding Inter-national 31(3): 206–213. DOI: 10.1080/09507116.2016.1223204 27. Xu, B., Jiang, F., Chen, S., Tanaka, M., Tashiro, S., and Van,A. N. 2018. Numerical analysis of plasma arc physical characteris-tics under additional constraint of keyhole. Chinese Physics B27(3): 034701. DOI: 10.1088/1674-1056/27/3/034701
ANH VAN NGUYEN, DONGSHENG WU ([email protected]),SHINICHI TASHIRO ([email protected]), and MANABUTANAKA are with the Joining and Welding Research Institute,Osaka University, Ibaraki, Osaka, Japan. NGUYEN is also withMurata Welding Laboratories Ltd., Osaka, Yodogawaku, Japan,and WU is also with Shanghai Key Laboratory of MaterialLaser Processing and Modification (Shanghai Jiao Tong Uni-versity), Shanghai, China.
References
Acknowledgments
Nguyen (2018105) Supplement .qxp_Layout 1 6/6/19 5:35 PM Page 212