Embed Size (px)
Citation preview
Cheung Chuk Shan College
Team R5
Teacher Advisor: Mr Lo
Team Members: Chan Chak Yan
Fong Yan Ting
Lok Ching Tung
Tse Hiu Yi
Yuen Tinny NY
(F5)
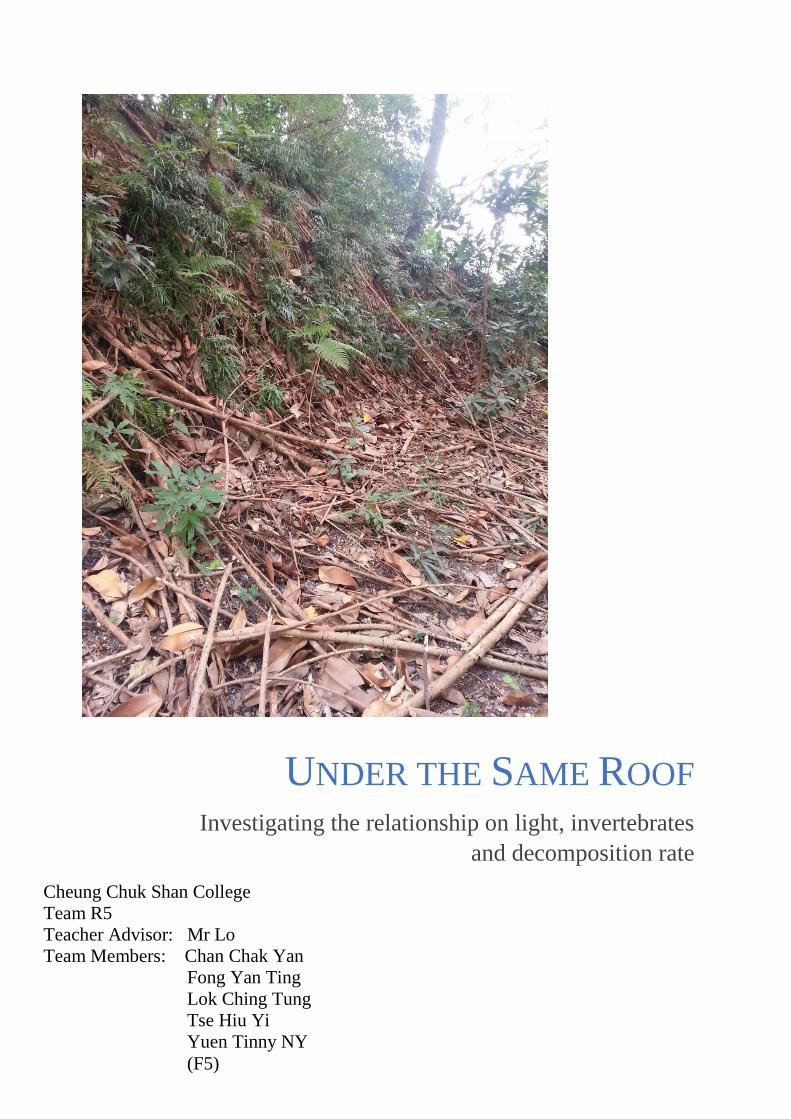
UNDER THE SAME ROOF
Investigating the relationship on light, invertebrates
and decomposition rate
1
Contents 1. Abstract 2
2. Introduction 2
2.1 Introduction to research topic 2
2.2 Objectives 2
2.3 Introduction of plant litter as a habitat 3
2.4 How do insects respond to light 3
3. Materials and Methods 3
3.1 Field study 3
3.2 Soil pH 4
3.3 Soil Conductivity 4
3.4 Invertebrates population survey 5
3.5 Soil Collection 5
3.7 Working Schedule 5
4. Results 6
4.1 Tables of Results 6
5. Discussion 11
5.1 Difference in invertebrate population in different light intensities 11
5.2 Soil fertility in different light intensities 11
5.3. Limitations and errors 12
6. Conclusion 13
7. Bibliography 14
2
1. Abstract The nitrogen cycle was introduced to us at school. However, the part of
decomposition by bacteria was only briefly introduced in our DSE syllabus. We
would like to look into some factors that may affect the decomposition rate. In this
study, we investigated the relationship between light, invertebrate population and
decomposition rate. Soil samples were collected from more exposed and less exposed
areas. Then, their conductivities were measured which is an indicator for soil fertility.
Before and after a period of time, the population of invertebrates were counted in
bright and dark areas in different time of the day. It is found that the species richness
and the number of invertebrates is higher in areas with a lower light intensity. Also,
the decomposition rate is higher in places with a lower light intensity.
2. Introduction
2.1 Introduction to research topic
The world where we are living in stresses a lot on the concept of cycle,
examples include water cycle, carbon cycle and nitrogen cycle. Cycles are
important because they can maintain the stability of a habitat. Plant litter plays
a vital role in material recycling, and there is a fascinating biodiversity in this
special habitat.
However, today in Hong Kong, the government treat plant litter as rubbish
rather than a source of fertilisers. A remarkable sum of money is spent on
transferring the plant litter to landfills, as well as buying artificial fertilizers.
Chemical fertilizers can only serve as a remedial measure, which is not
sustainable in the long term. There is not much study about plant litter in Hong
Kong too. Inspired by an online article talking about the fate of plant litter in
Hong Kong, we feel that we should look more into this topic.
Originally, we would like to study the decomposition rate of the plant litter of
Ficus elastica and Ficus microcarpa. These two species are abundant in Hong
Kong and belong to the same genus, but their leaves are very different. It is
known that there is a chemical called ficuselastic acid (KiemVanPham,
2012)which can be beetle-resistant. But we cannot find a good site for
studying Ficus microcarpa as most of the sites we found were regularly
maintained and pesticides were sprayed on it. As a result, we changed the
focus to studying the relationship between invertebrates and light and
decomposition rate.
2.2 Objectives
1. To investigate the difference in invertebrate population in different light
intensities
2. To investigate the soil fertility in different light intensities
3
2.3 Introduction of plant litter as a habitat
According to Satchell, plant litter is the layer of dead plant material which is
present on the surface of the soil. Dead plant materials which are not attached
to a living plant is also a kind of plant litter. (Satchell, 1974) The Oxford
English Dictionary defined decomposition as "The action or process of
decomposing, separation or resolution (of anything) into its constituent
elements; disintegration; putrescence". Decomposition is done both physically
and chemically. Physically means breaking the tissues into smaller parts, while
chemically is to convert materials from one form to another, like from
cellulose to sugar.
Bacteria and protozoa takes up the main role as decomposers. For example,
the cellvibrio bacteria are capable of cellulose degeneration. (Gyllenberg &
Eklund, 1974) Macroarthropods has a larger size than bacteria and has the
ability to move, they facilitate decomposition and recycling by physically
disintegrate plant tissues to increase surface area for decomposition,
decomposing sugar, cellulose and lignin, transforming tissues into humic
materials and forming complex aggregates between organic and inorganic
fractions of soil. (Edwards, 1974) Earthworms, or Oligochaetes, facilitate
mixing of matter by its burrowing and feeding actions.
Visible invertebrates in the habitat which are involved in litter breakdown are
woodlice, flies, millipedes, booklice, earthworms and beetles. Ants are also
common.
2.4 How do insects respond to light
Insects have two types of photoreceptive organs, compound eyes and ocelli. It
is common to see moths, who are positively phototactic, to fly around street
lamps at night. On the other hand, negatively phototactic organisms such as
cockroaches lives in dark places. (Life Science- Why are bugs attracted to
light?, unknown date) Insect larvae also hide away in the dark so as to hide
away from predators.
3. Materials and Methods 3.1 Field study
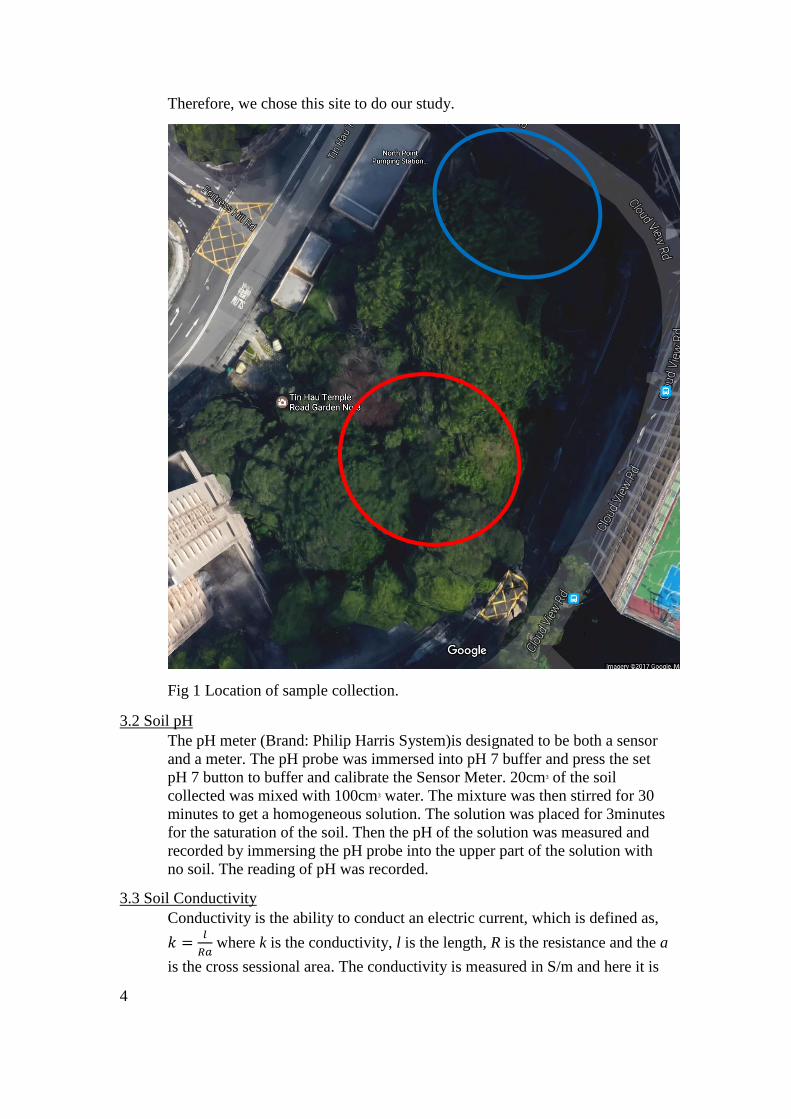
The site we have chosen was located on 11th Cloud View Road, opposite to
Cheung Chuk Shan College. It is mainly covered by a Ficus elastica. The site
can be divided into two parts. One is more exposed to light (or referred as
‘more exposed’ in the paper) and the other one less exposed to light (or
referred as ‘less exposed’ in the paper). The red circle in the below figure is
the area with less light, while the blue one is more exposed to light. The site
suffers from little human disturbance and has a big contrast between the two
areas. Also, there is little plant cover under the tree and the leaves under the
tree are only from Ficus elastica, minimizing impacts from other plants.
4
Therefore, we chose this site to do our study.
Fig 1 Location of sample collection.
3.2 Soil pH
The pH meter (Brand: Philip Harris System)is designated to be both a sensor
and a meter. The pH probe was immersed into pH 7 buffer and press the set
pH 7 button to buffer and calibrate the Sensor Meter. 20cm3 of the soil
collected was mixed with 100cm3 water. The mixture was then stirred for 30
minutes to get a homogeneous solution. The solution was placed for 3minutes
for the saturation of the soil. Then the pH of the solution was measured and
recorded by immersing the pH probe into the upper part of the solution with
no soil. The reading of pH was recorded.
3.3 Soil Conductivity
Conductivity is the ability to conduct an electric current, which is defined as,
𝑘 =𝑙
𝑅𝑎 where k is the conductivity, l is the length, R is the resistance and the a
is the cross sessional area. The conductivity is measured in S/m and here it is
5
used as an indicator for soil fertility. (Department of Sustainable Natural
Resources, 2006) The Conductivity Probe can be used to measure either
solution conductivity or total ion concentration of aqueous samples of the soil.
The calibration of the cell constant is done by immersing the sensor probe into
1 M potassium chloride and the constant at 25℃ is 117 S/m. 20cm3 of the soil
collected was mixed with 100cm3 water. The mixture was then stirred for 30
minutes to get a homogeneous solution. The solution was placed for 3minutes
for the saturation of the soil. The upper part of the solution with no soil was
tested by the conductivity Sensor Meter (Brand: Philip Harris System).
3.4 Invertebrates population survey
The number of invertebrates were counted and recorded within 10 minutes in
the sites. Photos of the invertebrates were taken to enhance the credibility. To
increase the reliability, three replications were taken.
3.5 Soil Collection
The soil from more exposed area and less exposed area were collected to
compare their difference in decomposition rate. The area of soil collected was
selected by random sampling using a 10cm x 10cm quadrat, then the soil is
dug and collected, with leaves or anything on the surface, with 5cm depth.
3.6 Measuring Light Intensity
The light intensity was measured using a light sensor. Since the reading is not
stable, three readings were recorded and an average was taken to be the final
light intensity. The unit is lux.
3.7 Working Schedule
Date Time Location Event
16th Feb 17 15:45-15:55 The hill opposite to
CCSC
Collection of soil under Ficus elastica in a more
exposed area and sheltered area
13th Mar 17 12:45-13:15 The hill opposite to
CCSC
Counting of invertebrates in more exposed area and
sheltered area
27th Mar 17 16:10-17:00 The hill opposite to
CCSC
Counting of invertebrates in more exposed area and
sheltered area
13th Apr 17 18:00-19:00 The hill opposite to
CCSC
Counting of invertebrates in more exposed area and
sheltered area
6
4. Results
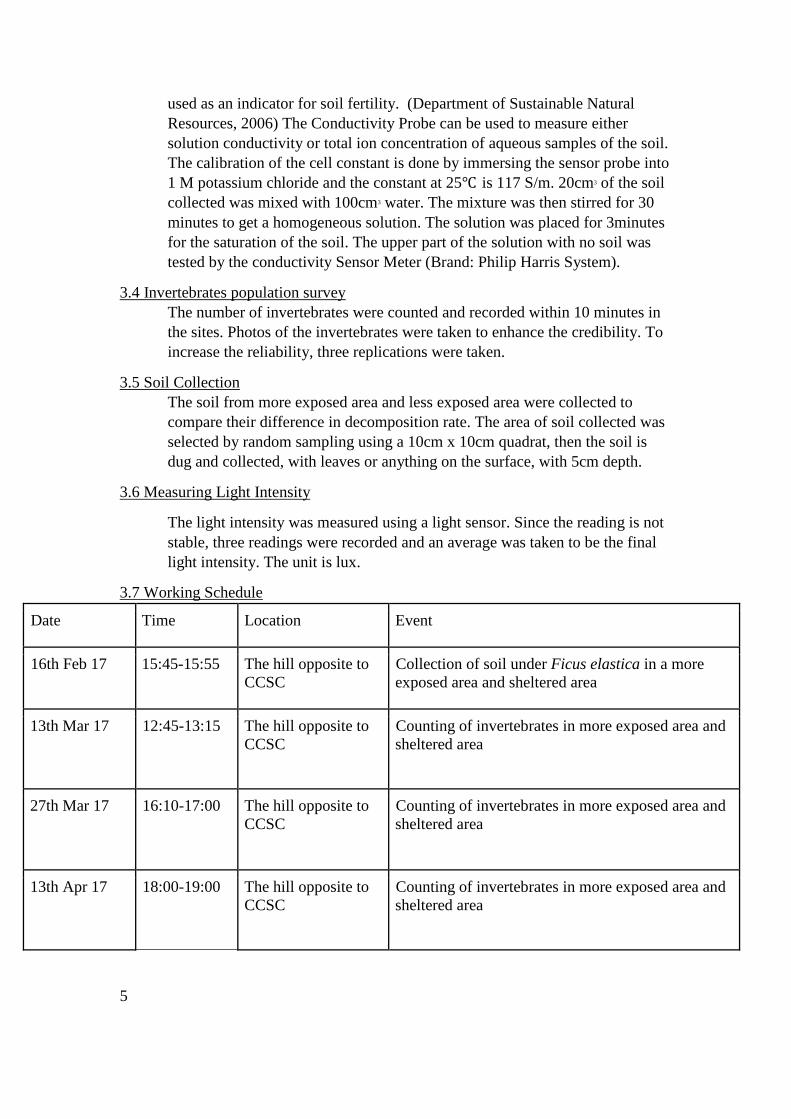
4.1 Tables of Results
Afternoon (Less Exposed) Night (Less Exposed) Night (More Exposed)
Trial 1
Trial 2
Trial 3 average
Trial 1
Trial 2
Trial 3 average
Trial 1
Trial 2
Trial 3 average
Light intensity (lux) 1735 1829 1920 1828 102.4 122.5 92.7 105.867 1320 1472 1340 1377.333333
Table 4.1 Record of Light Intensities
Ant (red) Ladybird
More
exposed
Less
exposed
More
exposed
Less
exposed
Morning 0 20 Morning 0 0
Afternoon 9 142 Afternoon 0 0
Evening 56 194 Evening 0 9
7
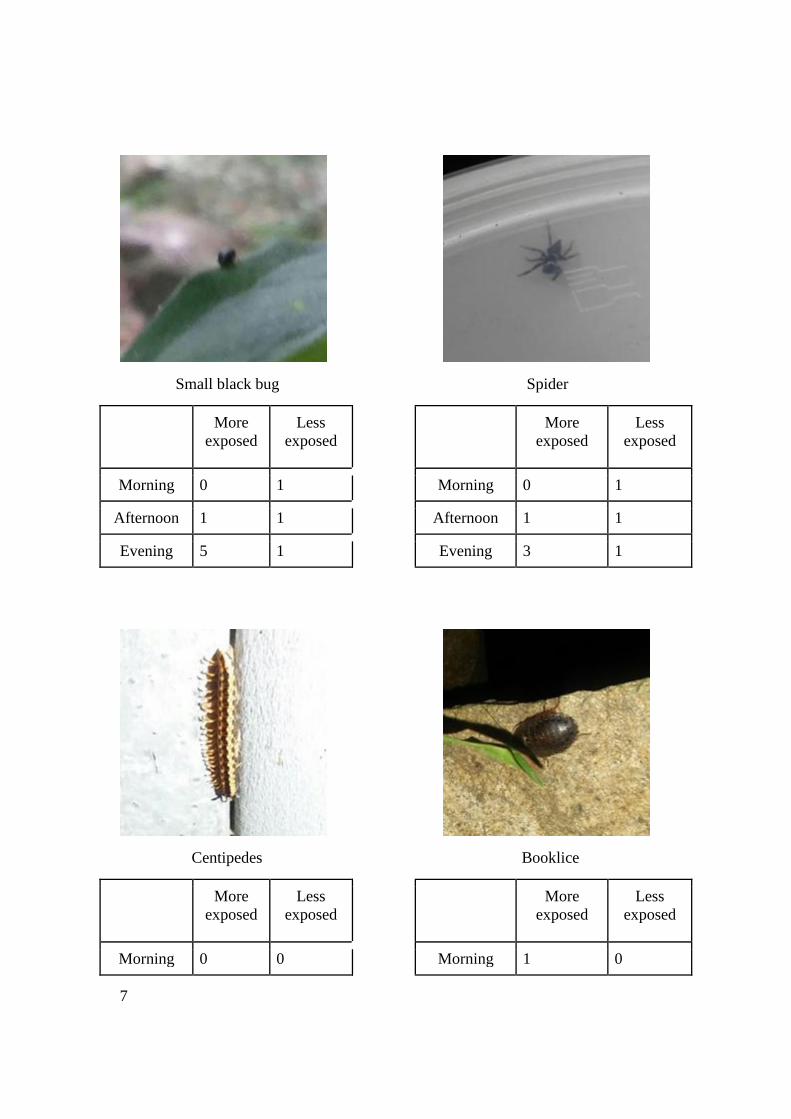
Small black bug Spider
More
exposed
Less
exposed
More
exposed
Less
exposed
Morning 0 1 Morning 0 1
Afternoon 1 1 Afternoon 1 1
Evening 5 1 Evening 3 1
Centipedes Booklice
More
exposed
Less
exposed
More
exposed
Less
exposed
Morning 0 0 Morning 1 0
8
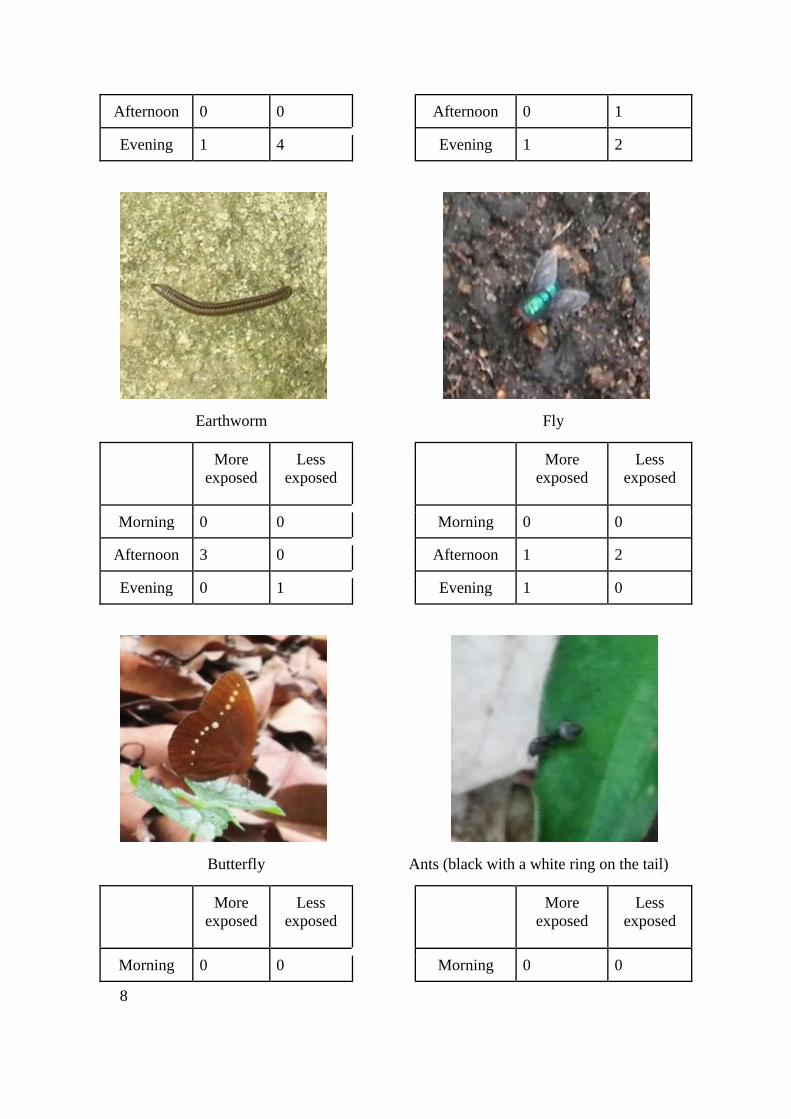
Afternoon 0 0 Afternoon 0 1
Evening 1 4 Evening 1 2
Earthworm Fly
More
exposed
Less
exposed
More
exposed
Less
exposed
Morning 0 0 Morning 0 0
Afternoon 3 0 Afternoon 1 2
Evening 0 1 Evening 1 0
Butterfly Ants (black with a white ring on the tail)
More
exposed
Less
exposed
More
exposed
Less
exposed
Morning 0 0 Morning 0 0
9
Afternoon 1 1 Afternoon 0 1
Evening 0 0 Evening 0 0
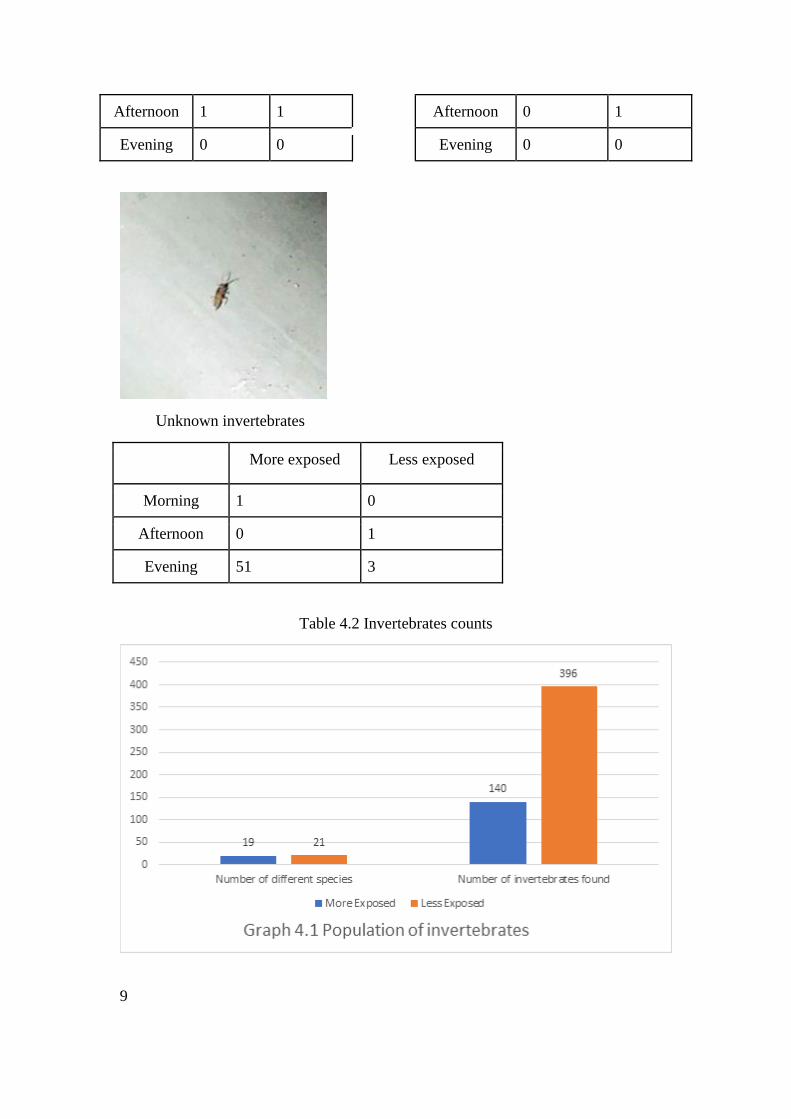
Unknown invertebrates
More exposed Less exposed
Morning 1 0
Afternoon 0 1
Evening 51 3
Table 4.2 Invertebrates counts
10
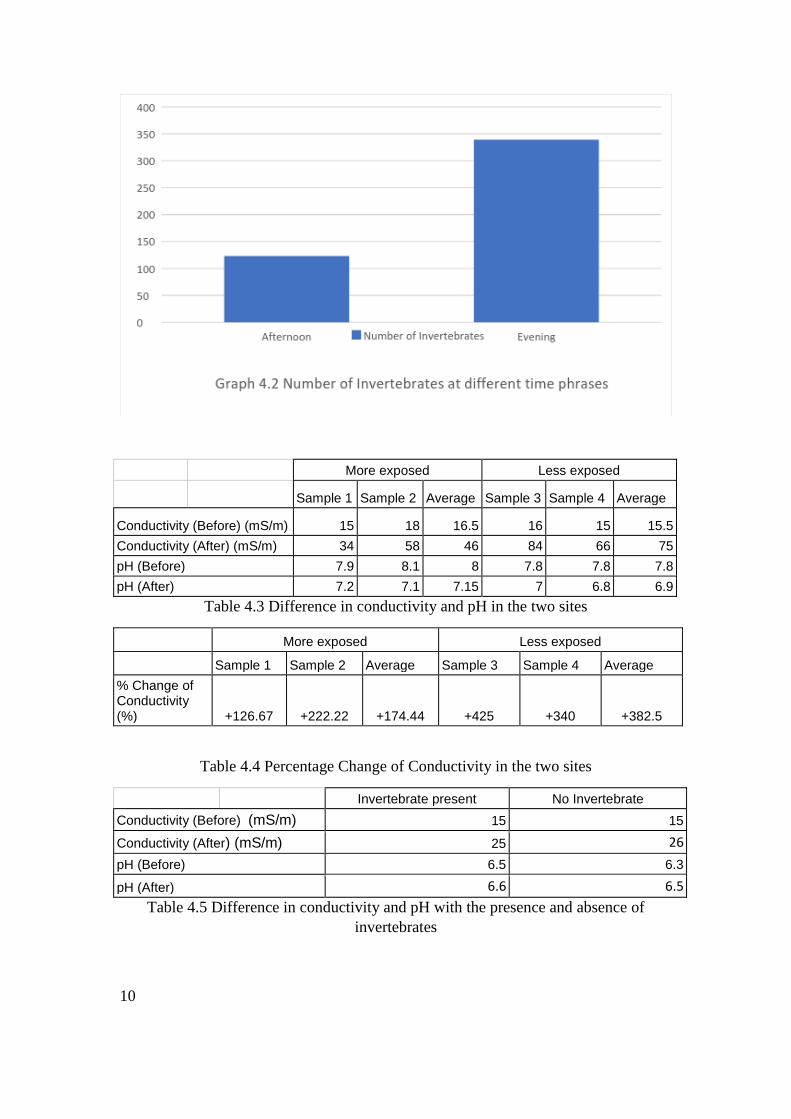
More exposed Less exposed
Sample 1 Sample 2 Average Sample 3 Sample 4 Average
Conductivity (Before) (mS/m) 15 18 16.5 16 15 15.5
Conductivity (After) (mS/m) 34 58 46 84 66 75
pH (Before) 7.9 8.1 8 7.8 7.8 7.8
pH (After) 7.2 7.1 7.15 7 6.8 6.9
Table 4.3 Difference in conductivity and pH in the two sites
More exposed Less exposed
Sample 1 Sample 2 Average Sample 3 Sample 4 Average
% Change of Conductivity (%) +126.67 +222.22 +174.44 +425 +340 +382.5
Table 4.4 Percentage Change of Conductivity in the two sites
Invertebrate present No Invertebrate
Conductivity (Before) (mS/m) 15 15
Conductivity (After) (mS/m) 25 26
pH (Before) 6.5 6.3
pH (After) 6.6 6.5
Table 4.5 Difference in conductivity and pH with the presence and absence of
invertebrates
11
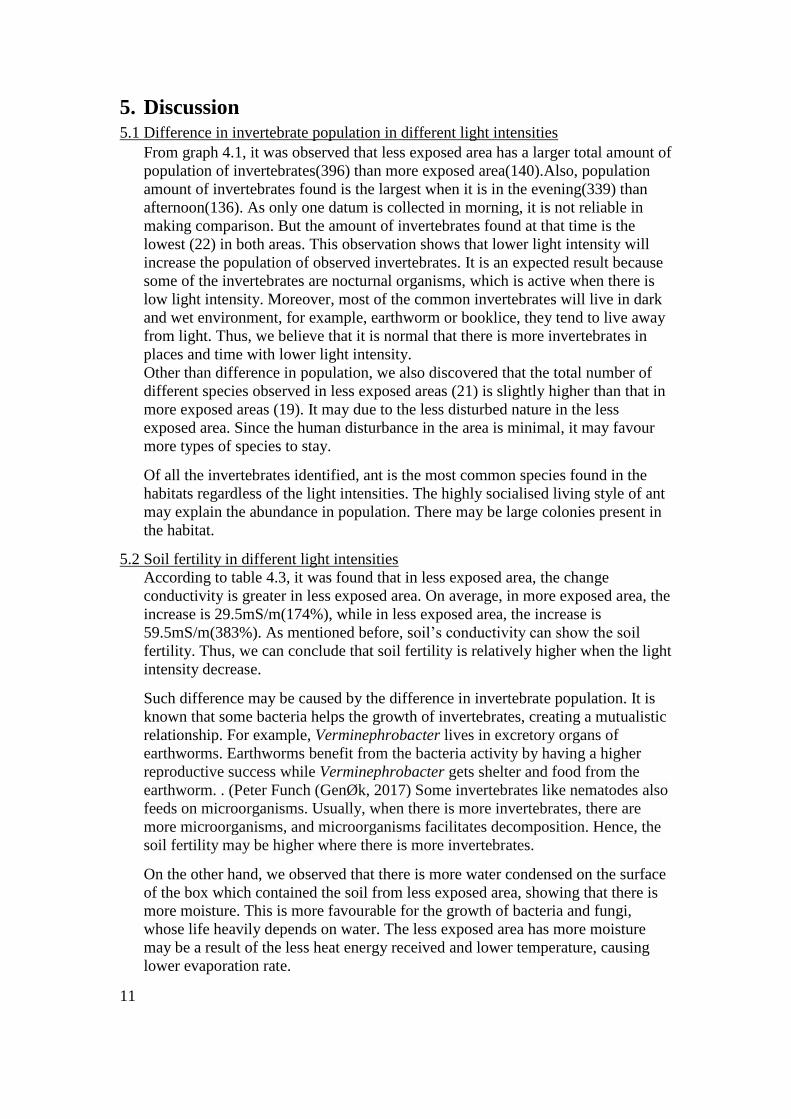
5. Discussion 5.1 Difference in invertebrate population in different light intensities
From graph 4.1, it was observed that less exposed area has a larger total amount of
population of invertebrates(396) than more exposed area(140).Also, population
amount of invertebrates found is the largest when it is in the evening(339) than
afternoon(136). As only one datum is collected in morning, it is not reliable in
making comparison. But the amount of invertebrates found at that time is the
lowest (22) in both areas. This observation shows that lower light intensity will
increase the population of observed invertebrates. It is an expected result because
some of the invertebrates are nocturnal organisms, which is active when there is
low light intensity. Moreover, most of the common invertebrates will live in dark
and wet environment, for example, earthworm or booklice, they tend to live away
from light. Thus, we believe that it is normal that there is more invertebrates in
places and time with lower light intensity.
Other than difference in population, we also discovered that the total number of
different species observed in less exposed areas (21) is slightly higher than that in
more exposed areas (19). It may due to the less disturbed nature in the less
exposed area. Since the human disturbance in the area is minimal, it may favour
more types of species to stay.
Of all the invertebrates identified, ant is the most common species found in the
habitats regardless of the light intensities. The highly socialised living style of ant
may explain the abundance in population. There may be large colonies present in
the habitat.
5.2 Soil fertility in different light intensities
According to table 4.3, it was found that in less exposed area, the change
conductivity is greater in less exposed area. On average, in more exposed area, the
increase is 29.5mS/m(174%), while in less exposed area, the increase is
59.5mS/m(383%). As mentioned before, soil’s conductivity can show the soil
fertility. Thus, we can conclude that soil fertility is relatively higher when the light
intensity decrease.
Such difference may be caused by the difference in invertebrate population. It is
known that some bacteria helps the growth of invertebrates, creating a mutualistic
relationship. For example, Verminephrobacter lives in excretory organs of
earthworms. Earthworms benefit from the bacteria activity by having a higher
reproductive success while Verminephrobacter gets shelter and food from the
earthworm. . (Peter Funch (GenØ k, 2017) Some invertebrates like nematodes also
feeds on microorganisms. Usually, when there is more invertebrates, there are
more microorganisms, and microorganisms facilitates decomposition. Hence, the
soil fertility may be higher where there is more invertebrates.
On the other hand, we observed that there is more water condensed on the surface
of the box which contained the soil from less exposed area, showing that there is
more moisture. This is more favourable for the growth of bacteria and fungi,
whose life heavily depends on water. The less exposed area has more moisture
may be a result of the less heat energy received and lower temperature, causing
lower evaporation rate.

12
5.3. Limitations and errors
5.3.1 Short experimental time
Decomposition of plant litter mostly takes a long period of time (i.e 2-3 years)
(Heneghan et al., 1999) In this investigation, we were unable to obtain a
significant change decomposition rate within a short period of time. There was not
enough time for them to decompose completely and observe a significant effect of
invertebrates on the decomposition rate. Therefore, it was hard to make
comparison of the result with little changes.
5.3.2 Sampling condition
Due to rainy days in March and April, replication work was not able to be carried
out and so we cannot observe the changes in decomposition rate within the same
area on different time period to ensure the reliability of the decomposition rate.
Since the data collected was under different weather condition, we could not
eliminate the effect of different weather condition (i.e. temperature and air
pressure) on the decomposition rate and the activity of invertebrates’ movement.
Therefore, effect of other abiotic factors, other than the factor under investigation
(light intensity), was not assessed.
5.3.3 Sampling of invertebrate method
In the investigation of the effect of population of invertebrates on the
decomposition rate, we had observed that there were flying invertebrates and fast-
moving organism which we were not able to take photo or collect it for further
investigation. Their roles in decomposition were not assessed as most of them
escaped very quickly and difficult to take a closer look. This limits our ability to
identify and record invertebrate community that under investigation.
5.3.4 Existence of bacteria
As mentioned in the introduction, bacteria take up tmain role as decomposers.
They may contribute to the decomposition process. We were not able to eliminate
bacteria due to a limitation in laboratory apparatus. The role of bacteria is
neglected which we cannot ensure the fertility is affected by light intensity and
invertebrates only.
5.3.5 Conductivity as an indicator of soil fertility
Conductivity is the measurement of amount of soluble salt in a sample. We chose
conductivity as the indicator for soil fertility because ions are produced while
decomposition, so salt content will be increased upon decomposition. However, it
is an indirect measure of soil fertility and we can just say that soil conductivity is
proportional to the soil fertility.
5.3.6 Error in measurements
The error of the electronic balance is 0.005%, which is quite accurate. The reading
13
of conductivity meter and pH meter has an error of 4%.
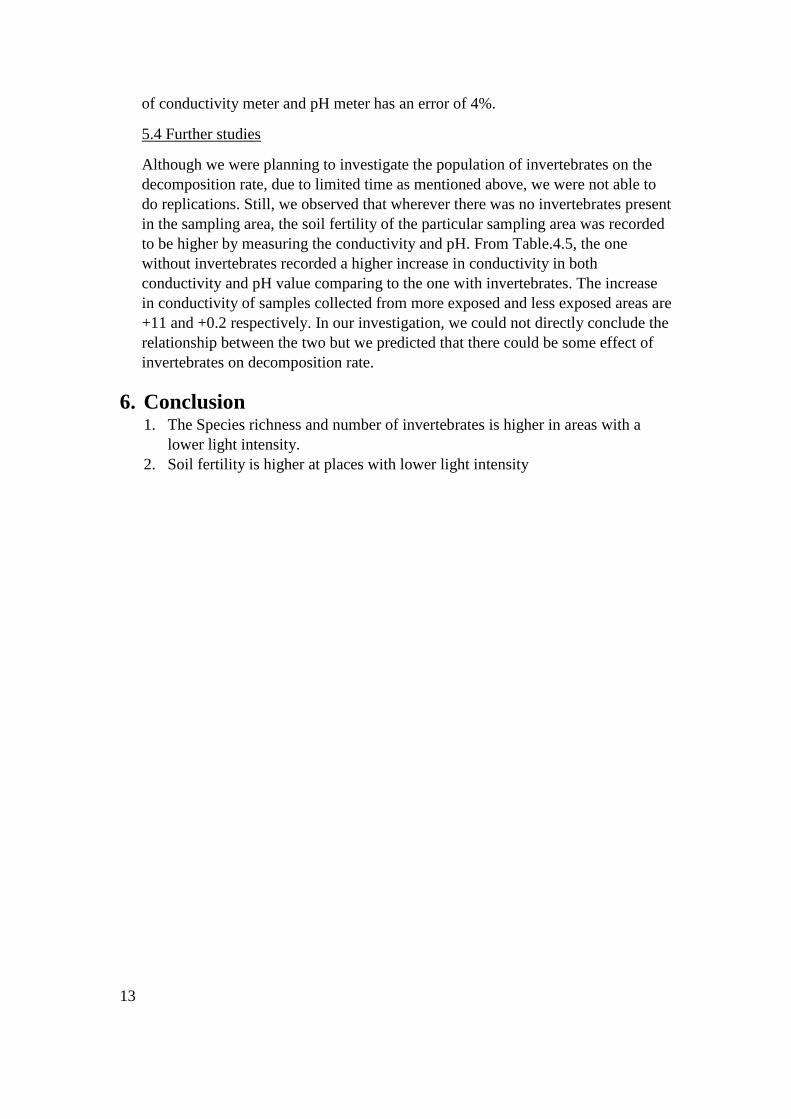
5.4 Further studies
Although we were planning to investigate the population of invertebrates on the
decomposition rate, due to limited time as mentioned above, we were not able to
do replications. Still, we observed that wherever there was no invertebrates present
in the sampling area, the soil fertility of the particular sampling area was recorded
to be higher by measuring the conductivity and pH. From Table.4.5, the one
without invertebrates recorded a higher increase in conductivity in both
conductivity and pH value comparing to the one with invertebrates. The increase
in conductivity of samples collected from more exposed and less exposed areas are
+11 and +0.2 respectively. In our investigation, we could not directly conclude the
relationship between the two but we predicted that there could be some effect of
invertebrates on decomposition rate.
6. Conclusion 1. The Species richness and number of invertebrates is higher in areas with a
lower light intensity.
2. Soil fertility is higher at places with lower light intensity
14
7. Bibliography
Department of Sustainable Natural Resources. (2006). Soil survey standard test
method-electrical conductivity.
Edwards, C. A. (1974). Macroarthropods. In Biology of Plant Litter Decomposition
(p. 534). Academic Press.
Gyllenberg, H., & Eklund, E. (1974). Bacteria. In Biology of Plant Litter
Decomposition (p. 249). Academic Press.
Heneghan L, Coleman DC, Zou X, Crossley DA, Jr, Haines BL. Soil
microarthropod contributions to decomposition dynamics: tropical–temperate
comparisons of a single substrate. Ecology. 1999;80:1873–1882
KiemVanPham. (2012). Chemical Constituents of the Ficus elastica Leaves and Their
Antioxidant Activities. Korean Chem. Soc., 3461-3464.
Life Science- Why are bugs attracted to light? (unknown date). Retrieved from Life
Science: http://www.iflscience.com/plants-and-animals/why-are-bugs-
attracted-light/
Peter Funch (GenØ k, A. (2017, 4 5). AARHUS University, Department of
Bioscience. Retrieved from Microbial Symbiosis: http://bios.au.dk/en/about-
bioscience/organisation/microbiology/research/microbial-symbiosis/
Satchell, J. E. (1974). Litter—Interface of Animate/Inanimate. In Biology of Plant
Litter Decomposition (pp. xiii–xliv). Academic Press.